Abstract
Deep cryogenic treatment (DC) is widely applied to martensitic stainless steels to suppress the presence of metastable retained austenite (RA), which may otherwise transform into brittle martensite under deformation and degrade mechanical performance. In this study, a low-carbon 13Cr-2Ni-2Mo martensitic stainless steel was subjected to deep cryogenic treatment for 2 h, followed by tempering at 200–600 °C to investigate carbide evolution and its correlation with mechanical response. At 200 °C, undissolved M23C6 was observed, accompanied by an RA volume fraction of 8.43% which exhibited a hardness of 543.3 ± 5.1 Hv. When tempered at 400 °C, M3C became predominant, corresponding to a hardness of 524.5 ± 5.1 Hv. At 500 °C, the simultaneous precipitation of M3C, M7C3, and M23C6 carbides induced pronounced secondary hardening, which promoted the peak hardness of 559 ± 5.6 Hv. Further tempering at 600 °C resulted in carbide spheroidization M23C6, which resulted in a hardness reduction to 392.2 ± 3.9 Hv while enhancing ductility. These findings reveal that the tempering temperature plays a decisive role in controlling the carbide precipitation sequence and the stability of retained austenite, thereby enabling the design of an optimal strength–ductility balance in deep cryogenically treated martensitic stainless steels.
1. Introduction
Martensitic stainless steels are utilized in corrosion-resistant plastic molds, dental and surgical instruments, cutlery, and wear-resistant components in the mining industry, owing to their combined corrosion resistance, wear resistance, and mechanical strength [1]. To meet performance demands, microstructure control is critical because retained austenite (RA) is recognized as a soft and metastable phase at low temperatures, which readily transforms into brittle martensite under applied stress or elevated temperature during service. According to the theory of martensitic transformation, this phase transformation is accompanied by a volume expansion which results in dimensional instability that may cause distortion or even locking of bearings during operation [2,3].
Deep cryogenic treatment (DC) has been extensively employed to minimize RA and stabilize the microstructure by promoting the transformation of austenite to martensite [4] and facilitating the precipitation of fine secondary carbides [5,6]. In addition to these established effects, DC has been reported to alter the reversed-austenite formation behavior during subsequent tempering. Zheng et al. [7] demonstrated that for 14.7Cr–6.5Ni–2.0Mo–0.02C super martensitic stainless steel, the RA fraction initially increased and then decreased between 550 and 750 °C, reaching a maximum at 650 °C. The DC-treated steel exhibited a higher and finer RA distribution due to increased Ni-enriched diffusion sites and shortened diffusion paths, while the redissolution of RA at elevated temperatures refined the martensitic laths, thereby enhancing structural stability.
Building on this, recent research on AISI 431 martensitic stainless steel [8] identified a novel cryogenic austenite retransformation (CAR) mechanism, in which the reverted austenite formed during austenite reversion transformation (ART) subsequently retransforms into tertiary α-martensite, ε-martensite, and fine carbides during tempering, leading to enhanced strength and deformation resistance. Moreover, comparative studies on different steels [9] have shown that the effectiveness of DC strongly depends on alloy chemistry and initial matrix structure; the treatment promotes more homogeneous carbide precipitation, particularly when combined with higher austenitizing and lower tempering temperatures.
Therefore, understanding the influence of DC on the microstructural evolution and phase stability of martensitic stainless steels is crucial for optimizing their mechanical and functional properties. In this work, a low-carbon 13Cr–2Ni–2Mo martensitic stainless steel was subjected to deep cryogenic treatment followed by tempering at 200–600 °C to elucidate the carbide evolution sequence and its correlation with mechanical response. The investigation focused on how tempering temperature affects the type, morphology, and distribution of carbides (M3C, M7C3, and M23C6), as well as the retained austenite stability and hardness variation. The results provide insights into designing an optimal strength–ductility balance in deep cryogenically treated martensitic stainless steels through controlled tempering.
2. Materials and Methods
2.1. Materials Preparation and Heat Treatments
In the present study, 13Cr–2Ni–2Mo martensitic stainless-steel rods were employed as experimental materials. The rods underwent rolling followed by two annealing treatments above the Ac1 temperature to relieve internal stresses, resulting in a final diameter of 3.5 mm. The chemical composition was verified using Optical Emission Spectroscopy (GVM-1014S, Shimadzu Corporation, Kyoto, Japan) and is summarized in Table 1.

Table 1.
Elemental composition of 13Cr–2Ni–2Mo expressed in weight percent (wt%).
Deep cryogenic treatment (DC) was applied for 2 h in a liquid nitrogen tank after air quenching from 1040 °C. After cryogenic treatment, specimens were tempered in a furnace at temperatures of 200, 400, 500, and 600 °C. The heating rate was maintained at 10 °C/min and each specimen was held isothermally for 2 h. After tempering, all samples were cooled in still air to ambient temperature (~25 °C) without forced convection or quenching. Each batch was processed together to minimize temperature and time variation between samples and are illustrated as shown in Figure 1a. For comparison, conventional quenching and tempering (QT) without DC were also performed under identical austenitizing conditions at 1040 °C for 2 h. The notation used is QCT (tempering temperature) for specimens subjected to DC, and QT (tempering temperature) for samples treated without DC. Dilatometry was employed to determine thermal expansion coefficients and phase transformation temperatures. A DIL 805A/D dilatometer was used with rod specimens (3.5 mm diameter and 10 mm length) under high vacuum (<5 × 10⁻⁴ mbar) to prevent oxidation. The heat treatment simulation involved heating at 10 °C/s to 1040 °C followed by cooling under high-purity helium gas at 100 °C/s to replicate air-cooling conditions. Figure 1b presents the thermal expansion curve of 13Cr–2Ni–2Mo stainless steel. During heating, a slope change at 824 °C marks the onset of austenite formation (AC1), while a linear trend above 970 °C indicates austenite full transformation (AC3). Upon cooling from 1040 °C, the rod length shifts from contraction to expansion at 233.91 °C, which corresponds to the martensite start temperature (Ms).
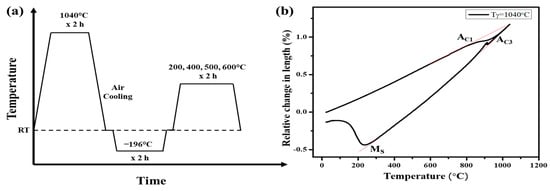
Figure 1.
(a) Schematic diagram of QCT treatment with different tempering temperatures and (b) expansion behavior curves after holding at 1040 °C for 2 h in the dilatometer.
2.2. Microstructure Analysis
Microstructural characterization was performed using field-emission SEM (FEI NOVA NANO SEM 450, FEI Company, Hillsboro, OR, USA) and EBSD (JEOL JSM-7800F Prime FEG-SEM, Tokyo, Japan) with NordlysNano detector (Oxford Instruments NanoAnalysis, High Wycombe, UK). Samples for SEM were sectioned, cold-mounted, and polished with SiC paper (240–4000 grit) followed by alumina suspension (1–0.05 µm). EBSD characterization requires specimens to be electrolytically polished using a Fischione Twin-Jet Electropolisher Model 110 (E.A. Fischione Instruments, Inc., Export, PA, USA) with an electrolyte composed of 15 vol% glycerol, 5 vol% perchloric acid, and 80 vol% anhydrous ethanol. Liquid nitrogen was applied to maintain the electrolyte temperature at −35 °C, while polishing was conducted under a current of 20 A and a voltage of 50 V.
Transmission Electron Microscopy (TEM) is a powerful imaging technique that employs high-energy electron beam transmitted through an ultra-thin specimen, which enables examination of internal structures at a nanometer scale. High-Resolution Transmission Electron Microscopy (HRTEM), an advanced mode of TEM, allows for direct visualization of atomic arrangements, lattice structures, and interfaces. In this study, an FEI Tecnai G2 F20 200 kV FEG-TEM (FEI Company, Hillsboro, OR, USA) was employed to analyze the microstructure. Bright-field imaging, selected-area diffraction patterns, and high-resolution lattice imaging were used to examine the morphology and crystal structures of martensite and precipitates. An integrated Energy-Dispersive Spectroscopy (EDS) system equipped with an Oxford X-MAX 80 detector (Oxford Instruments NanoAnalysis, High Wycombe, UK) was utilized to determine elemental distributions.
TEM specimen preparation involved cutting thin slices approximately 400 μm thick using a precision diamond saw. The slices were mechanically ground using SiC paper of grades 400, 800, and 1000 to a thickness of about 80 μm. Discs with a diameter of 3 mm were then punched to fit the TEM holder and further thinned using finer grades of 1500, 2500, and 4000 to approximately 60 μm. Final thinning was performed by twin-jet electropolishing using a Fischione Model 110 electropolisher (E.A. Fischione Instruments, Inc., Export, PA, USA) under the same electrolyte composition and parameters as the EBSD sample. Polishing was continued until perforation appeared at the center of the disc. The foils were immediately rinsed sequentially with distilled water, 95% ethanol, anhydrous ethanol, and isopropanol to minimize surface contamination and oxidation prior to TEM observation.
Phase identification was further carried out by X-ray diffraction (D2 PHASER, Bruker AXS GmbH, Karlsruhe, Germany) using Cu-Kα radiation (λ = 1.54060 Å, 300 W). XRD scans were conducted in the range of 40–90°, and diffraction patterns were analyzed using MDI Jade6 for phase identification. Retained austenite (RA) volume fraction was calculated from integrated intensities of selected martensite ((211), (200), (110)) and austenite ((111), (200), (220)) peaks using Equation (1) below [10].
2.3. Mechanical Properties Analysis
Vickers hardness measurements were performed using an FM-810 tester (Future Tech, Kawasaki, Kanagawa, Japan) with a 1 kg load and 10 s dwell time. Samples were embedded along the normal direction, ground with 400–4000 grit SiC, and polished with 1 μm alumina. Five indents were created at 500 μm intervals, and average values were calculated excluding outliers.
Mechanical behavior was evaluated by three-point bending using an MTS 810 UTS (MTS Systems Corporation, Eden Prairie, MN, USA) at 0.48 mm/min. Specimens with a size of 3.5 mm in diameter and 30 mm in length were tested with a 15 mm span and a 4.9 mm indenter. Load–displacement curves were recorded to assess strength, ductility, and fracture behavior.
2.4. Magneto-Induction Method
Magnetic phase (such as martensite and δ-ferrite) content was measured using a ferrite content meter (FERITSCOPE MP30, Helmut Fischer GmbH, Sindelfingen, Germany), which operates based on magnetic induction and eddy current principles. The device allows for non-destructive quantification of ferrite in the range of 0.1–110 FN (0.1–80% Fe) in stainless steels. Measurements were recorded with automatic acceptance at probe contact, where four measurements were taken on each sample to obtain the mean value along with the corresponding standard error.
The fraction of α-martensite and possibly δ-ferrite (fm) was determined, which used a magnetic field through its probe, thus interacting with the specimen. Since γ-austenite and ε-martensite are paramagnetic [11], only the ferromagnetic α-martensite contributes to the measured response, because the δ-ferrite fraction has no significant contribution to the previous result [12]. Retained austenite measurement used the following method:
where Fem denotes ferritescope measurement and k is the curvature correction factor. In the present study, with a 3.5 mm diameter and measured values of 60–80% Fe, a constant correction factor of 1.2 was applied to all samples in present study regardless of the parameter [13,14,15].
3. Results and Discussion
3.1. Microstructure Analysis
After austenitizing at 1040 °C for 2 h, the precipitates present in the as-quenched sample progressively decreased and were eventually dissolved into the matrix, as shown in the SEM micrograph in Figure 2a. In contrast, the conventional quenching and tempering (QT) treatment at 200 °C in sample QT200 preserved finer carbides, since limited atomic diffusion at a low tempering temperature restricted carbide growth and coarsening, as shown in Figure 2b [16,17]. Conventional QT treatment after tempering at 400 °C can be observed in Figure 2c, which reveals needle-type carbide. Tempering at 500 °C and 600 °C showed globular and flaky carbide, as shown in Figure 2d,e, respectively, where at elevated temperatures, enhanced diffusion promoted atom migration to promote more carbides [18].
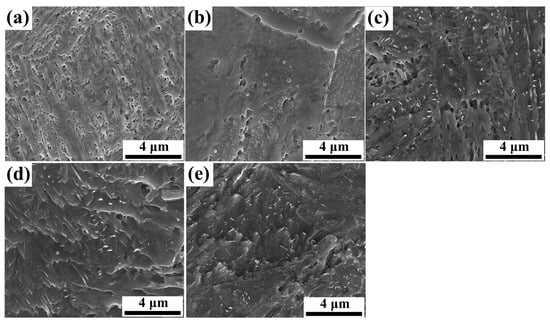
Figure 2.
SEM secondary electron micrographs of (a) as-quenched specimen; specimens without DC subjected to 2 h tempering at (b) 200 °C—QT200; (c) 400 °C—QT400; (d) 500 °C—QT500; and (e) 600 °C—QT600 with magnification of 10,000×.
Although no carbides were detected in the SEM micrograph after quenching at 1040 °C, TEM observations at a higher magnification revealed the presence of very fine nanosized carbides approximately 200 nm in size, which were enriched in chromium and molybdenum, as confirmed by TEM-EDS in Figure 3a and Figure 3b, respectively. The corresponding SAED pattern identified these precipitates as M23C6 carbides with zone axis and a lattice parameter of 1.06587 nm, as shown in Figure 3c. Combining the EDS and SAED results indicates that undissolved M23C6 (M = Fe, Cr, Mo) persisted in the low-C 13Cr–2Ni–2Mo martensitic stainless steel after quenching.
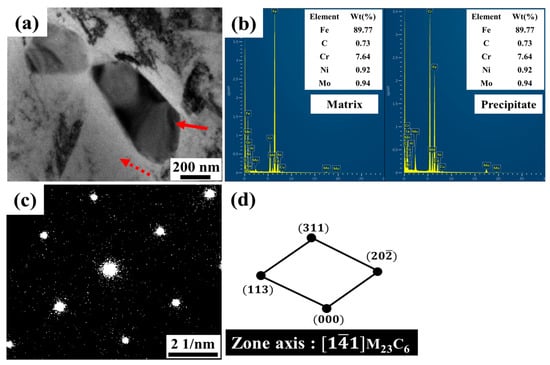
Figure 3.
TEM micrographs of the as-quenched sample after austenitizing at 1040 °C for 2 h (solid arrow: nanosized carbide; dashed arrow: matrix). (a) Bright-field image; (b) TEM-EDS analysis of precipitates and matrix; (c) selected area diffraction (SAED) pattern; and (d) diffraction pattern analysis confirming M23C6 carbide.
After tempering at 200 °C for 2 h in sample QCT200, fine globular M23C6 carbides with a size of 200 nm−1 μm were observed primarily at grain boundaries, as shown in Figure 4a,e. The high dislocation density generated by DC provided preferential nucleation sites, while enhanced carbon diffusion facilitated carbide precipitation and growth compared to the sample without DC, as shown in Figure 2b. At 400 °C, needle-like precipitates (~200 nm) appeared within lath martensite, as shown in Figure 4b,f. Tempering at 500 °C, both needle-like and nanosized globular carbides coexisted, as observed in Figure 4c,g. Tempering at 600 °C, needle-like precipitates diminished while finer globular carbides became more uniformly distributed throughout the matrix, as observed in Figure 4d,h. The superior effect of DC can be ascribed to the enhanced carbide precipitation during tempering at 200–600 °C compared with conventional QT treatment, which was facilitated by the higher dislocation density generated through cryogenic treatment [19,20,21].
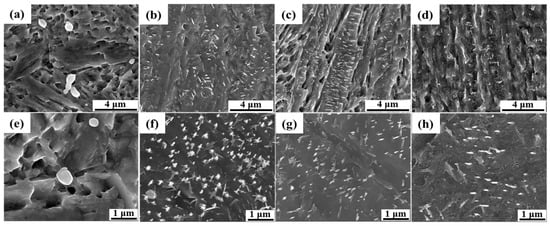
Figure 4.
SEM secondary electron micrographs of specimens subjected to 2 h DC followed by 2 h tempering at (a) 200 °C; (b) 400 °C; (c) 500 °C; and (d) 600 °C with magnification of 10,000× and (e) 200 °C; (f) 400 °C; (g) 500 °C; and (h) 600 °C with magnification of 25,000×.
As shown in Figure 5, neither the as-quenched condition nor tempering at 200 °C revealed detectable peaks corresponding to carbides or austenite [22]. With tempering at 400–500 °C, martensite peaks became broader due to carbon depletion and fine carbide precipitation, while weak γ(111) reflections appeared, indicating the onset of reversed austenite [23]. At 600 °C, faint M23C6 peaks emerged, indicating that these carbides reached an XRD-detectable size and fraction. The increase in peak intensity likely reflects a higher volume fraction of M23C6 [24].
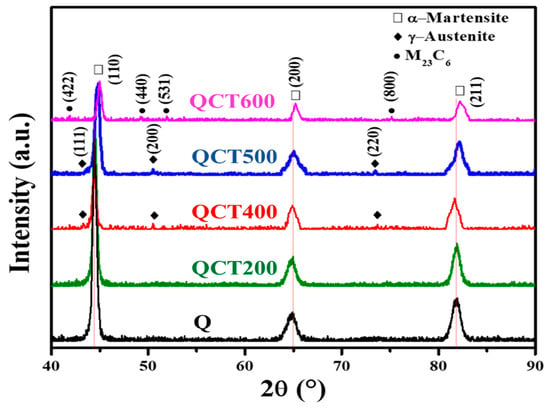
Figure 5.
XRD results across different tempering conditions.
The detailed TEM microstructure of the 13Cr–2Ni–2Mo martensitic stainless steel after 2 h of deep cryogenic treatment followed by tempering at 200 °C was presented in our previous study [12]. In that work, M23C6 carbides with an average size of about 500 nm (lattice parameter ≈ 1.0677 nm) were identified along the zone axis, surrounded by a high dislocation density. These results are consistent with the present SEM observations and provide a useful reference for comparison with the current TEM analysis.
Figure 6a–c presents TEM analysis of 13Cr–2Ni–2Mo MSS tempered at 400 °C, which, as shown in Figure 6a, reveals needle-like precipitates with a size of 170–200 nm in length and 40 nm in width, consistent with SEM observations. SAED performed on these precipitates showed strong and weak diffraction spots arising from two distinct phases. The weaker signals, due to low intensity, were difficult to resolve in dark-field mode, as shown in Figure 6b. The crystallographic alignment between the two phases was identified as , corresponding to the Bagaryatskii orientation relationship commonly observed between cementite (M3C) and BCC ferrite [25], as illustrated in Figure 6c.
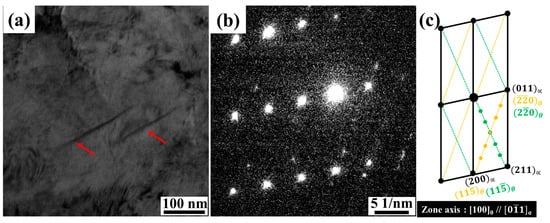
Figure 6.
TEM images of 13Cr–2Ni–2Mo MSS after DC for 2 h and tempering in sample QCT200 and for sample QCT400 with tempering at 400 °C for (a) bright-field micrograph, arrows indicate M3C carbides; (b) SAED pattern; (c) diffraction pattern analysis corresponding to M3C carbide.
Owing to their nanoscale dimensions after tempering at 500 °C, the precipitates could not be identified using conventional electron diffraction; therefore, high-resolution transmission electron microscopy (HRTEM) combined with Fast Fourier Transform (FFT) analysis was required. The HRTEM bright-field micrograph, as shown in Figure 7a, reveals circular precipitates of approximately 10 nm in size. FFT analysis of the yellow-boxed region, as shown in Figure 7b, confirms martensite with a zone axis, as observed in Figure 7c, whereas the red-boxed region, as shown in Figure 7d, corresponds to the and planes of M7C3 with a zone axis, thereby M7C3 precipitation within the martensitic matrix after tempering at 500 °C was observed.
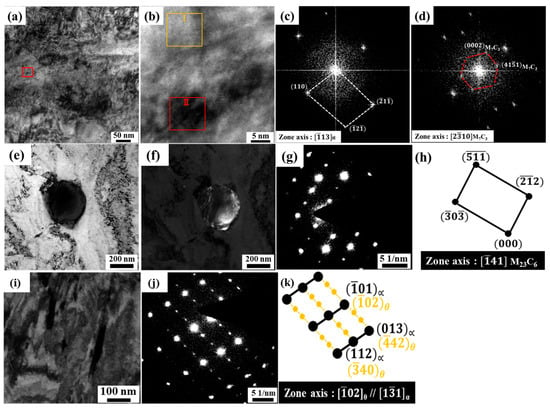
Figure 7.
TEM results of the QCT500 sample tempered at 500 °C: (a) bright-field micrograph showing M7C3 carbide; (b) magnified HRTEM image of the marked region in (a); (c) FFT pattern from the yellow-box in (b); and (d) FFT pattern from the red box in (b). Additional TEM observations of the same sample: (e) bright-field micrograph; (f) dark-field image of M23C6 carbide; (g) SAED pattern; and (h) diffraction pattern analysis confirming M23C6. Further TEM analysis: (i) bright-field micrograph; (j) SAED pattern; and (k) diffraction pattern analysis corresponding to M3C carbide.
In addition to the previously identified carbides, TEM bright-field micrographs, as observed in Figure 7e, and dark-field micrographs, as shown in Figure 7f, revealed the presence of small globular precipitates with a size of 200 nm, which were identified as M23C6 with a zone axis and lattice parameter of 1.07561 nm. Upon tempering at 500 °C, TEM bright-field micrograph analysis of 13Cr–2Ni–2Mo MSS further revealed needle-like precipitates measuring 130–230 nm in length and 15–25 nm in width, as shown in Figure 7i. The SAED pattern confirmed a Bagaryatskii orientation relationship between ferrite and cementite, consistent with the BCC ferrite diffraction pattern along the zone axis as reported by Liu et al. [25,26,27]. Thus, the low-carbon 13Cr–2Ni–2Mo martensitic stainless steel in sample QCT500 contains various types of nanoscale carbides, specifically cementite (M3C), M23C6, and M7C3.
During tempering at 600 °C, spherical carbides with an average size of approximately 500 nm were detected, as shown in the bright-field and dark-field TEM micrographs in Figure 8a and Figure 8b, respectively. The SAED pattern confirmed the precipitate as M23C6 with a zone axis of as observed in Figure 8c, while diffraction pattern analysis, as illustrated in Figure 8d, revealed a lattice parameter of 1.06733 nm for the QCT600 sample. These observations are consistent with the SEM results, which also identified nanosized spherical carbides, as shown in Figure 4g,h, further supported by XRD analysis, where a distinct increase in peak intensity corresponding to the M23C6 phase was observed. This type of carbide commonly initiates nucleation, as observed in other authors’ findings during high-temperature tempering [28,29,30].

Figure 8.
TEM images of 13Cr–2Ni–2Mo MSS after DC for 2 h and tempering in sample QCT200 for (a) bright-field micrograph; (b) dark-field image of M23C6 carbide; (c) selected area diffraction (SAED) pattern; and (d) diffraction pattern analysis confirming M23C6 carbide.
K. Kaneko et al. [31] reported that in 2-Cr martensitic steel, only Fe3C (M3C) carbides form within the tempering range of 300–500 °C, which is relatively consistent with the present findings. Tempering at 400 °C, flaky-shaped M3C (cementite) carbides were observed, whereas at 500 °C, both M3C and M7C3 carbides precipitated simultaneously. In the current study, the formation of M23C6 carbides was first detected after tempering at 500 °C, which indicates the concurrent presence of M3C, M7C3, and M23C6 carbides. After further tempering at 600 °C, M23C6 precipitation became increasingly dominant, which was accompanied by a gradual reduction in the amounts of M3C and M7C3. This transition suggests that the carbide evolution is progressively governed by M23C6 precipitation, in accordance with the carbide transformation reactions described in the literature [32,33,34,35,36]. Thus, the proposed reaction in the present study is as follows:
Matrix (with undissolved carbide) → M3C → M7C3 → M23C6
Figure 9a–f present IPF-Z maps for the as-quenched, QCT200, QCT400, QCT500, and QCT600 samples, respectively. Figure 9f–j show EBSD phase distribution maps of 13Cr–2Ni–2Mo MSS at different tempering temperatures. The quenched sample consists of 0.15% RA, as shown in Figure 9f, and slightly increases after tempering at 200 °C to 0.20%, as shown in Figure 9g. At 400 °C, the RA fraction increases to 0.93% in Figure 9h, which is attributed to carbon partitioning that stabilizes reversed austenite along lath and grain boundaries [37]. However, RA decreases to 0.50% after tempering at 500 °C in Figure 9i as reversed austenite decomposes into ferrite and carbides (mainly M7C3) [38]. Further tempering to 600 °C, as observed in Figure 9j, reduces RA to 0.14% due to decomposition into secondary martensite and predominantly M23C6 carbides [39]. RA fraction measurement from EBSD is summarized in Table 2. Figure 9k–o present the grain boundary misorientation distributions for the as-quenched, QCT200, QCT400, QCT500, and QCT600 samples, respectively. Furthermore, sample QCT500 possesses the highest carbide fraction of 3.46% among all samples, which reflects various types of carbides with relatively high-volume fraction from EBSD measurement.
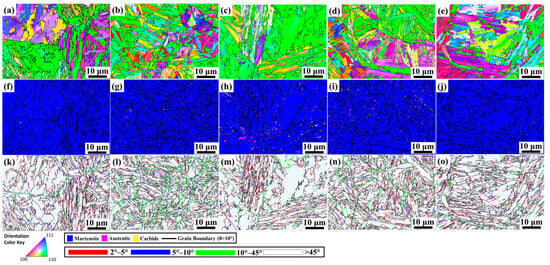
Figure 9.
IPF-Z maps of (a) as-quenched DC-treated samples (2 h) followed by tempering (2 h) at (b) 200 °C, (c) 400 °C, (d) 500 °C, and (e) 600 °C showing the crystallographic orientations of martensite laths; EBSD phase distribution maps of (f) as-quenched DC-treated samples (2 h) followed by tempering (2 h) at (g) 200 °C, (h) 400 °C, (i) 500 °C, and (j) 600 °C. Corresponding misorientation angle distributions are shown for (k) as-quenched, (l) 200 °C, (m) 400 °C, (n) 500 °C. and (o) 600 °C.

Table 2.
Comparative statistical summary of phase fractions derived from EBSD analysis at various tempering temperatures following 2 h DC.
Figure 10 presents grain boundary misorientation for different tempering temperatures. In this study, a threshold of 10° was adopted to define low-angle grain boundaries, which means that misorientation angles above 10° were excluded from the local misorientation analysis, as they were classified as medium-angle boundaries (10–45°) or high-angle boundaries (>45°) rather than being associated with geometrically necessary dislocations (GNDs) [40]. Tempering at 200 °C in sample QCT200 exhibited the lowest low-angle boundary fraction of 22%, which indicates less recovery and higher stored strain energy during low-temperature tempering [41]. High-angle grain boundaries remained the most prevalent structural feature regardless of tempering temperature, with QCT600 exhibiting the highest fraction of 67.9%, which promotes recovery, reduces dislocation density, and stabilizes high-angle grain boundaries.
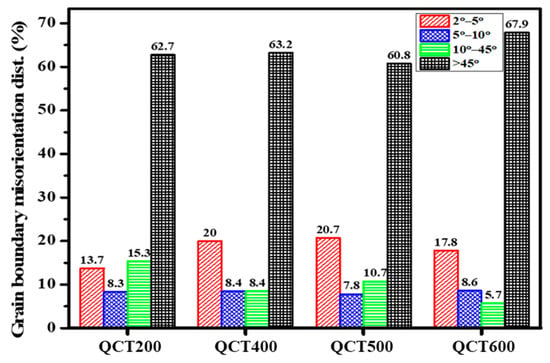
Figure 10.
Grain boundary misorientation at varying tempering temperatures.
A comparison of austenite fractions derived from XRD analysis and EBSD measurements shows a consistent trend across different tempering temperatures, as presented in Figure 11. Both methods confirm an increase in austenite content up to 10.67% at 400 °C for XRD, followed by a decline to 3.36% after tempering at 600 °C. The results indicate that XRD consistently reports higher austenite fractions than EBSD. This discrepancy is likely attributed to the lower spatial resolution of EBSD, which limits its ability to detect fine RA, whereas XRD is a bulk analysis technique that can capture phases more effectively.
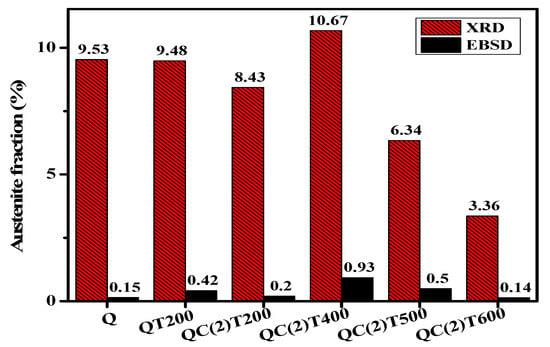
Figure 11.
Comparison of retained austenite fractions obtained from XRD and EBSD measurements across different tempering temperatures.
3.2. Magnetic Permeability Method
Ferritescope is generally a less sensitive method than other methods like the Vibrating Sample Magnetometer (VSM), since the ferritescope only detects surface area instead of bulk measurement [42]. In the present study, QCT treatment exhibits higher Fe%, hence it possesses a lower RA volume fraction than conventional QT regardless of the tempering temperature applied, as presented in Figure 12. Typically, RA measured by ferritescope has a relatively similar trend with XRD and EBSD results, with slightly higher values compared to XRD. As the tempering temperature increases, the RA fraction decreases in both QT and QCT results. As-quenched samples, QCT200, QCT400, QCT500, and QCT600 exhibit RA fractions of 21.3%, 15.9%, 16.6%, 8.6%, and 6.3%, respectively. In the present study, tempering after 600 °C for sample QCT600 leads to the highest Fe% of 78.1%, resulting in an RA volume fraction of 6.3%, which is 1.8 times higher compared to the XRD result.
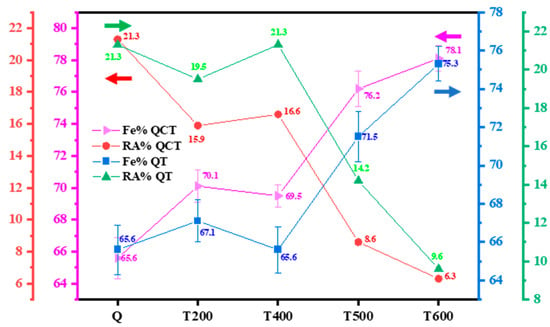
Figure 12.
Martensite fraction from ferritescope measurement for different tempering temperatures.
The ferritescope consistently reported higher retained austenite values than XRD or EBSD because its magnetic-based measurement is sensitive to all non-ferromagnetic regions, including fine carbides, δ-ferrite, and strain-affected zones within a deep sampling volume (~1–2 mm). These factors locally reduce magnetic permeability and are interpreted as austenite, which results in an apparent overestimation. In contrast, XRD and EBSD quantify only the true FCC phase within limited surface depths, yielding more accurate phase-specific values. Despite these differences, all techniques exhibited consistent trends in RA reduction with cryogenic treatment and tempering, which confirms the reliability of the observed phase transformation behavior [43].
3.3. Mechanical Properties
Figure 13a illustrates the hardness evolution of low-C 13Cr–2Ni–2Mo stainless steel at different tempering temperatures following austenitization at 1040 °C for 2 h. Overall, the QCT process demonstrates a higher hardness compared with conventional QT, primarily due to an increased dislocation density that enhances strengthening [44,45]. In addition, pronounced secondary hardening from more carbide precipitation, as in the SEM result, assists in an increase in hardness [46]. The as-quenched sample exhibits a hardness of 572.3 ± 4.9 HV, which decreases to 543.3 ± 5.1 HV after DC, followed by tempering at 200 °C in sample QCT200. Further tempering at 300°C reduces hardness significantly to 499 ± 4.0 Hv, as carbon diffusion from supersaturated martensite initiates a loss of tetragonality [47]. Tempering at 400 °C in sample QCT400, hardness increases again to 524.5 ± 5.1 Hv owing to cementite (M3C) precipitation, which contributes to secondary hardening. Maximum hardness, which, in the present study is observed as 559 ± 5.6 Hv, after tempering at 500 °C in sample QCT500, results from pronounced secondary hardening via the precipitation of nanosized M3C, M7C3, and M23C6 carbides. The observed hardness increases due to dispersion of fine M23C6 carbides within martensite laths at 500 °C, which promotes secondary hardening [48,49,50]. The secondary hardening observed at 500 °C can be attributed to precipitation strengthening mechanisms, primarily Orowan looping and dislocation pinning [51]. At this temperature, the formation of fine, non-shearable carbides (M3C, M7C3, and M23C6) effectively impedes dislocation motion, thus increasing the strength of the martensitic matrix [52]. The nanoscale size and uniform dispersion of these carbides, as observed in TEM, are consistent with Orowan-type strengthening, which further explains the hardness peak and subsequent decrease at higher tempering temperatures due to particle coarsening. At 600 °C in sample QCT600, hardness decreases sharply to 392.2 ± 3.9 Hv, which is attributed to excessive grain growth and a consequent reduction in grain boundary strengthening.
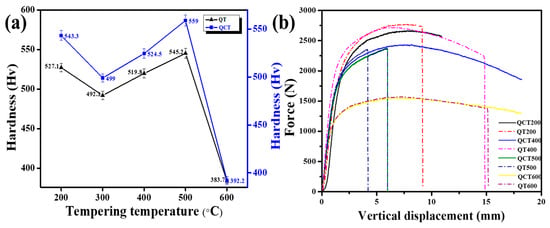
Figure 13.
(a) Hardness variation with tempering temperature (black triangles: QT; blue squares: QCT for 2 h) and (b) three-point bending test results at different tempering temperatures (solid line: QCT; dashed line: QT).
Figure 13b presents three-point bending results at various tempering temperatures, with ultimate load and vertical displacement for QT and QCT samples, which are summarized in Table 3. Overall, QCT samples exhibited slightly lower maximum loads compared to conventional QT but demonstrated enhanced ductility, with no fracture observed except in sample QCT500. The superior ductility of QCT is attributed to the presence of finer, uniformly distributed carbides and a more stable microstructure which effectively absorbs deformation energy and delays crack propagation [53]. In contrast, QT samples achieved higher peak loads but fractured earlier, which reflects more brittle behavior.

Table 3.
Comparative table of mechanical properties for QCT and conventional QT samples across different tempering temperatures.
It should be noted that present mechanical evaluation was limited to hardness and three-point bending tests. While these methods reliably indicate relative changes in strength and embrittlement associated with carbide evolution and retained austenite transformation, they do not fully represent the tensile or fracture toughness behavior of the material. Tensile and fracture tests were not conducted due to the limitations of material size and shape, as in the present study, the sample shape is a long rod with a diameter of 3.5mm, where such tests require precisely machined standard specimens (ASTM E8 or E399).
4. Conclusions
This study systematically investigated the effect of tempering temperature on the carbide evolution and mechanical response of 13Cr–2Ni–2Mo martensitic stainless steel subjected to deep cryogenic treatment.
Tempering at 200 °C retained undissolved M23C6 carbide, while at a higher temperature of 400 °C, cementite (M3C) began to precipitate. The tempering temperature governed carbide precipitation and retained austenite stability, with fine M3C, M7C3, and M23C6 carbides forming during tempering at 500 °C. The uniform dispersion of these fine carbides provided strong obstacles to dislocation motion, which resulted in a pronounced secondary hardening effect. At higher tempering temperatures (600 °C), carbide coarsening and partial matrix recovery led to decline in hardness but an improvement in ductility.
Thus, in the present study, tempering at 200 °C in sample QCT200 was the most favorable within the present mechanical scope due to exhibiting a relatively high hardness of 543.3 Hv while maintaining satisfying mechanical properties with relatively lower retained austenite, with values of 8.43% (XRD), 15.9% (ferritescope), and 0.2% (EBSD).
Author Contributions
Conceptualization, M.R.R.F.; methodology, M.R.R.F.; formal analysis, M.R.R.F.; investigation, M.R.R.F., H.-J.C., and K.-M.L.; resources, M.R.R.F.; data curation, M.R.R.F.; writing—original draft preparation, M.R.R.F.; writing—review and editing, M.R.R.F., H.-J.C., K.-M.L., and H.-C.L.; visualization, M.R.R.F.; supervision, H.-C.L.; project administration, H.-C.L.; funding acquisition, H.-C.L. All authors have read and agreed to the published version of the manuscript.
Funding
This research received no external funding.
Data Availability Statement
The original contributions presented in the study are included in the article. Further inquiries can be directed to the corresponding author.
Acknowledgments
The authors would like to express their gratitude to the instrumental assistance provided by the Instrumentation Center of the National Taiwan University for the EBSD experiment and the National Taiwan University of Science and Technology for the XRD measurement.
Conflicts of Interest
The authors declare no conflicts of interest in any capacity, competing or financial.
References
- de Moura, A.N.; Favarato, L.N.O.; Amorim, D.d.S.C.; Alcantara, C.M.d.; Marques, M.C.S.; Orlando, M.T.D.A.; Vieira, E.A.; Labiapari, W.d.S.; da Cunha, M.A.; de Oliveira, T.R. Effect of austenitization temperature on microstructure, crystallographic aspects, and mechanical properties of AISI 420 martensitic stainless steel. Mater. Sci. Eng. A Struct. Mater. Prop. Microstruct. Process. 2024, 909, 146835. [Google Scholar] [CrossRef]
- Li, S.; Xiao, M.; Ye, G.; Zhao, K.; Yang, M. Effects of deep cryogenic treatment on microstructural evolution and alloy phases precipitation of a new low carbon martensitic stainless bearing steel during aging. Mater. Sci. Eng. A 2018, 732, 167–177. [Google Scholar] [CrossRef]
- Kang, C.; Liu, F.; Jiang, Z.; Suo, H.; Yu, X.; Zhang, H.; Ding, S. Effect of cryogenic treatment on microstructure evolution and mechanical properties of high nitrogen plastic die steel. J. Mater. Res. Technol. 2021, 15, 5128–5140. [Google Scholar] [CrossRef]
- Prieto, G.; Ipiña, J.P.; Tuckart, W. Cryogenic treatments on AISI 420 stainless steel: Microstructure and mechanical properties. Mater. Sci. Eng. A 2014, 605, 236–243. [Google Scholar] [CrossRef]
- Singh, G.; Pandey, K. Effect of cryogenic treatment on properties of materials: A review. Proc. Inst. Mech. Eng. Part E J. Process. Mech. Eng. 2022, 236, 1758–1773. [Google Scholar] [CrossRef]
- Jurči, P.; Dlouhý, I. Cryogenic Treatment of Martensitic Steels: Microstructural Fundamentals and Implications for Mechanical Properties and Wear and Corrosion Performance. Materials 2024, 17, 548. [Google Scholar] [CrossRef]
- Zheng, S.-Q.; Jiang, W.; Bai, X.; Li, S.-H.; Zhao, K.-Y.; Zhu, X.-K. Effect of deep cryogenic treatment on formation of reversed austenite in super martensitic stainless steel. J. Iron Steel Res. Int. 2015, 22, 451–456. [Google Scholar] [CrossRef]
- Jovičević-Klug, P.; Jovičević-Klug, M.; Thormählen, L.; McCord, J.; Rohwerder, M.; Godec, M.; Podgornik, B. Austenite reversion suppression with deep cryogenic treatment: A novel pathway towards 3rd generation advanced high-strength steels. Mater. Sci. Eng. A 2023, 873, 145033. [Google Scholar] [CrossRef]
- Jovičević-Klug, P.; Jovičević-Klug, M.; Sever, T.; Feizpour, D.; Podgornik, B. Impact of steel type, composition and heat treatment parameters on effectiveness of deep cryogenic treatment. J. Mater. Res. Technol. 2021, 14, 1007–1020. [Google Scholar] [CrossRef]
- Günerli, E.; Bayramoglu, M.; Geren, N. Volume fraction of retained austenite in 1.2842 tool steel as a function of tempering temperature. Eur. Mech. Sci. 2022, 6, 263–268. [Google Scholar] [CrossRef]
- Datta, K.; Delhez, R.; Bronsveld, P.M.; Beyer, J.; Geijselaers, H.J.M.; Post, J. A low-temperature study to examine the role of ε-martensite during strain-induced transformations in metastable austenitic stainless steels. Acta Mater. 2009, 57, 3321–3326. [Google Scholar] [CrossRef]
- Fatih, M.R.R.; Chen, H.-J.; Lin, H.-C. The Effect of Cryogenic Treatment and Tempering Duration on the Microstructure and Mechanical Properties of Martensitic Stainless Steel 13Cr-2Ni-2Mo. Materials 2025, 18, 1784. [Google Scholar] [CrossRef] [PubMed]
- H.F. GmbH. FERITSCOPE® FMP30 Operator’s Manual: Coating Thickness, Material Analysis, Microhardness, Material Testing; H.F. GmbH: Sindelfingen, Germany, 2016; Available online: https://www.helmut-fischer.com (accessed on 14 October 2025).
- Ionescu, L.G.; Pantawane, M.V.; Tănase, C.; Sichim, R.V.; Dascălu, C.A.; Ghiban, B. Evaluation of Retained Austenite in Carburized Bearing Steel Using Magneto-Inductive Method. Crystals 2023, 13, 1173. [Google Scholar] [CrossRef]
- Kaňa, V.; Pernica, V.; Zadera, A.; Krutis, V. Comparison of Methods for Determining the Ferrite Content in Duplex Cast Steels. Arch. Foundry Eng. 2023, 19, 85–90. [Google Scholar] [CrossRef]
- Takaki, S.; Ngo, H.K.L.; Nakada, N.; Tsuchiyama, T. Strengthening Mechanism in Ultra Low Carbon Martensitic Steel. ISIJ Int. 2012, 52, 710–716. [Google Scholar] [CrossRef]
- Rahimi, R.; Ritzenhoff, R.; Biermann, H.; Mola, J. Low-Temperature Tempering Reactions in a High Nitrogen Martensitic Stainless Steel by Magnetic Saturation Measurements. In Proceedings of the High Nitrogen Steels 2014, Hamburg, Germany, 16–19 September 2014. [Google Scholar]
- Cong, J.; Yang, Y.; Zhu, H.; Shang, X.; Wu, H.; Song, Z.; Wang, X.; Xu, X. Study on the Coarsening Behavior of Interphase Precipitates and Random Precipitates in Steel Under the High-Temperature Environment of Fire. Metals 2025, 15, 73. [Google Scholar] [CrossRef]
- Weng, Z.; Gu, K.; Zheng, J.; Cui, C.; Zhang, M.; Wang, J. Cryogenically martensitic transformation and its effects on tempering behaviors of bearing steel. Mater. Charact. 2022, 190, 112066. [Google Scholar] [CrossRef]
- Yan, J.; Zhang, C.; Guo, J.; Dong, G.; Wang, S.; Gao, J.; Wu, H.; Zhao, H.; Lu, J.; Huang, Y.; et al. Investigating the influence mechanisms of cryogenic treatment on mechanical properties and wear resistance of AISI 4340 steel. J. Mater. Res. Technol. 2025, 38, 3264–3276. [Google Scholar] [CrossRef]
- Xu, G.; Huang, P.; Feng, Z.; Wei, Z.; Zu, G. Effect of Deep Cryogenic Time on Martensite Multi-Level Microstructures and Mechanical Properties in AISI M35 High-Speed Steel. Materials 2022, 15, 6618. [Google Scholar] [CrossRef]
- Bhadeshia, H.K.D.H.; Honeycombe, S. The Tempering of Martensite. In Steels; Elsevier: Amsterdam, The Netherlands, 2006; pp. 183–208. [Google Scholar]
- Hosseini, N.; Forouzan, F.; Vuorinen, E. In-situ microstructural evolution during quenching and partitioning of a high-carbon steel by high-temperature X-Ray Diffraction. Mater. Today Commun. 2022, 31, 103503. [Google Scholar] [CrossRef]
- Talebi, S.H.; Jahazi, M.; Melkonyan, H. Retained Austenite Decomposition and Carbide Precipitation during Isothermal Tempering of a Medium-Carbon Low-Alloy Bainitic Steel. Materials 2018, 11, 1441. [Google Scholar] [CrossRef] [PubMed]
- Bhadeshia, H. Solution to the Bagaryatskii and Isaichev ferrite–cementite orientation relationship problem. Mater. Sci. Technol. 2018, 34, 1666–1668. [Google Scholar] [CrossRef]
- Liu, T.; Li, T.; Liu, X. TEM and electron diffraction analysis of ω-Fe to cementite transformation in quenched and tempered high carbon steels. AIP Adv. 2019, 9, 045219. [Google Scholar] [CrossRef]
- Zhong, N.; Wang, X.; Guo, Z.; Rong, Y. Orientation Relationships between Ferrite and Cementite by Edge-to-edge Matching Principle. J. Mater. Sci. Technol. 2011, 27, 475–480. [Google Scholar] [CrossRef]
- Zhao, Y.; Liu, W.; Zhang, T.; Sun, Z.; Wang, Y.; Fan, Y.; Dong, B. Assessment of the correlation between M23C6 precipitates and pitting corrosion resistance of 0Cr13 martensitic stainless steel. Corros. Sci. 2021, 189, 109580. [Google Scholar] [CrossRef]
- Ma, D.-S.; Chi, H.-X.; Jian, Z.; Yong, Q. Microstructure and Mechanical Properties of Martensitic Stainless Steel 6Cr15MoV. J. Iron Steel Res. Int. 2012, 19, 56–61. [Google Scholar] [CrossRef]
- Jiang, W.; Wu, D.; Zhang, Q.; Li, M.; Liu, W. Effect of Tempering Time on the Microstructure and Properties of Martensitic Stainless Steel. Metals 2024, 14, 322. [Google Scholar] [CrossRef]
- Kaneko, K.; Fujita, K.; Sadakata, A.; Tomokiyo, Y.; Matsumura, S. Nanostructural and nanoelemental analysis of metastable M3C-type carbides with alloy-rich layer in heat resistant 2Cr-martensitic steel. Scr. Mater. 2003, 48, 761–765. [Google Scholar] [CrossRef]
- Wang, R.; Li, F.; Wu, Z.; Kang, Y.; Fan, J.; Yu, Z.; Yan, Z.; Du, S.; Eckert, J. Precipitation and Transformation of Carbides during Tempering of 7Cr14 Martensitic Stainless Steel. Steel Res. Int. 2024, 95, 2300248. [Google Scholar] [CrossRef]
- Wieczerzak, K.; Bala, P.; Dziurka, R.; Tokarski, T.; Cios, G.; Koziel, T.; Gondek, L. The effect of temperature on the evolution of eutectic carbides and M7C3 → M23C6 carbides reaction in the rapidly solidified Fe-Cr-C alloy. J. Alloys Compd. 2017, 698, 673–684. [Google Scholar] [CrossRef]
- Chen, H.J.; Hsiao, P.-C.; Chien, H.-K.; Lin, K.; Chuo, Y.-T.; Huang, C.-Y.; Lin, H.-C. Effects of heat treatment on microstructure, mechanical properties and corrosion resistance 13Cr-2Ni-2Mo martensitic stainless steel. Mater. Charact. 2025, 223, 114909. [Google Scholar] [CrossRef]
- Gorunov, A.I. Investigation of M7C3, M23C6 and M3C carbides synthesized on austenitic stainless steel and carbon fibers using laser metal deposition. Surf. Coat. Technol. 2020, 401, 126294. [Google Scholar] [CrossRef]
- Channa, I.; Shah, A.A.; Abro, S.; Siddiqui, M.; Mujahid, M.; Chandio, A. Effect of Tempering Temperature on the Properties of Martensitic stainless steel (AISI 420). Sukkur IBA J. Emerg. Technol. 2019, 20, 1. [Google Scholar]
- Celada-Casero, C.; Kwakernaak, C.; Sietsma, J.; Santofimia, M.J. The influence of the austenite grain size on the microstructural development during quenching and partitioning processing of a low-carbon steel. Mater. Des. 2019, 178, 107847. [Google Scholar] [CrossRef]
- Wang, X.; Ding, R.; Hu, C.; Yang, D.; Wu, Y.; Liu, L.; Lin, X. Influence of tempering treatment on the microstructure evolution and mechanical properties of laser-cladding high-strength iron-based alloy coatings. J. Mater. Res. Technol. 2025, 38, 4662–4675. [Google Scholar] [CrossRef]
- Liu, Y.-r.; Ye, D.; Yong, Q.-l.; Su, J.; Zhao, K.-y.; Jiang, W. Effect of Heat Treatment on Microstructure and Property of Cr13 Super Martensitic Stainless Steel. J. Iron Steel Res. Int. 2011, 18, 60–66. [Google Scholar] [CrossRef]
- Kim, J.H.; Miyamoto, G.; Shibata, A.; Hojo, T.; Koyama, M.; Zhang, Y.; Furuhara, T. Influence of austenite grain boundary misorientation on hydrogen-induced intergranular crack propagation in a medium carbon martensitic steel. Acta Mater. 2024, 274, 120036. [Google Scholar] [CrossRef]
- Yang, G.; Xia, S.L.; Zhang, F.C.; Branco, R.; Long, X.Y.; Li, Y.G.; Li, J.H. Effect of tempering temperature on monotonic and low-cycle fatigue properties of a new low-carbon martensitic steel. Mater. Sci. Eng. A 2021, 826, 141939. [Google Scholar] [CrossRef]
- Freeman, F.S.H.B.; Sharp, J.; Xi, J.; Todd, I. Influence of solidification cell structure on the martensitic transformation in additively manufactured steels. Addit. Manuf. 2019, 30, 100917. [Google Scholar] [CrossRef]
- Lucas, F.; Sandim, M.; Sandim, H.; Santos, D.B.; Renzetti, R. Quantification of retained austenite by X-ray diffraction and saturation magnetization in a supermartensitic stainless steel. Mater. Charact. 2016, 115, 90–96. [Google Scholar] [CrossRef]
- Wei, X.; Zhang, X.; He, W.; Li, J.; Zhang, J.; Li, D.; Li, S. Influence of Deep Cryogenic Treatment on Microstructural Evolution and Transformation Kinetics Simulation by Finite Element Method of Low-Carbon High-Alloy Martensitic-Bearing Steel. Steel Res. Int. 2022, 93, 2100785. [Google Scholar] [CrossRef]
- Das, D.; Dutta, A.; Ray, K.K. Inconsistent wear behaviour of cryotreated tool steels: Role of mode and mechanism. Mater. Sci. Technol. 2009, 25, 1249–1257. [Google Scholar] [CrossRef]
- Yıldız, E.; Altan Özbek, N. Investigation of the effects of shallow and deep cryogenic treatment on the mechanical and microstructural properties of AISI 431 martensitic stainless steel. Ironmak. Steelmak. 2022, 6, 74–82. [Google Scholar] [CrossRef]
- Maissara, K.; Forouzan, F.; Åkerfeldt, P.; Timokhina, I.; Åkerström, P.; Vuorinen, E.; Antti, M.-L. Effect of Tempering on Microstructure and Tensile Properties of Ultra-High Strength Steels for Press Hardening Applications. Metall. Mater. Trans. A 2025, 56, 2570–2585. [Google Scholar] [CrossRef]
- Su, Y.-Y.; Chiu, L.-H.; Chen, F.-S.; Lin, S.-C.; Pan, Y.-T. Residual Stresses and Dimensional Changes Related to the Lattice Parameter Changes of Heat-Treated JIS SKD 11 Tool Steels. Mater. Trans. 2014, 55, 831–837. [Google Scholar] [CrossRef]
- Godbole, K.; Das, C.; Panigrahi, B. Tailoring of mechanical properties of AISI 410 martensitic stainless steel through tempering. In Proceedings of the Metal 2017, Brno, Czech Republic, 24–26 May 2017. [Google Scholar]
- Suwanpatcharakul, K.; Saenarjhan, N.; Nakthong, N.; Lothongkum, A.W.; Lothongkum, G. Effect of tempering temperature on impact energy of AISI 410 martensitic stainless steel at low temperatures. Mater. Test. 2021, 63, 699–704. [Google Scholar] [CrossRef]
- Cui, A.; Wang, X.; Cui, Y. Multiscale modelling of precipitation hardening: A review. J. Mater. Sci. Mater. Theory 2024, 8, 13. [Google Scholar] [CrossRef]
- Lv, Z.-w.; Fan, J.; Wang, R.; Yu, Z.-q.; Kang, Y.; Hu, Y.; Tuo, L.-f.; Eckert, J.; Yan, Z.-j. Microstructural evolution during tempering process and mechanical properties of Cr–Ni–Mo–V/Nb high strength steel. J. Iron Steel Res. Int. 2025, 32, 270–281. [Google Scholar] [CrossRef]
- Li, J.; Zhang, X.; Bu, H.; Qi, H.; Zuo, P.; Li, S.; Li, M. Effects of deep cryogenic treatment on the microstructure evolution, mechanical and thermal fatigue properties of H13 hot work die steel. J. Mater. Res. Technol. 2023, 27, 8100–8118. [Google Scholar] [CrossRef]
Disclaimer/Publisher’s Note: The statements, opinions and data contained in all publications are solely those of the individual author(s) and contributor(s) and not of MDPI and/or the editor(s). MDPI and/or the editor(s) disclaim responsibility for any injury to people or property resulting from any ideas, methods, instructions or products referred to in the content. |
© 2025 by the authors. Licensee MDPI, Basel, Switzerland. This article is an open access article distributed under the terms and conditions of the Creative Commons Attribution (CC BY) license (https://creativecommons.org/licenses/by/4.0/).