Article

Quantification of Austenite in Medium Manganese Steels Using the Magnetic Permeameter

by
Hongqian Huang
*,
Linxiu Du
*,
Hongyan Wu
and
Xiuhua Gao
State Key Laboratory of Digital Steel, Northeastern University, Shenyang 110819, China
*
Authors to whom correspondence should be addressed.
Metals 2025, 15(10), 1151; https://doi.org/10.3390/met15101151
Submission received: 13 August 2025 / Revised: 29 September 2025 / Accepted: 30 September 2025 / Published: 17 October 2025

Abstract

With the industrial production and application of a series of advanced high-strength steels containing austenite phases, quantifying austenite content has become vital for optimizing production processes and guaranteeing product quality. Traditional austenite measurement methods typically demand laborious, meticulous sample preparation and complex subsequent data processing, rendering them unsuitable for large-scale industrial standardization. The industry urgently requires a simple, stable technique for determining austenite content in bulk samples of these advanced steels. This article explored an innovative permeameter method to achieve the simple and stable quantitative determination of the austenite content in multiphase steels. This method measures the magnetization data within the near-saturation range, then utilizes the linear Frölich–Kennelly relationship to fit the data and indirectly derive the saturation magnetization, and subsequently determines the austenite content. Using medium manganese steels with varied austenite fractions as experimental materials, we conducted cross-comparisons with conventional methods—using a vibrating sample magnetometer and X-ray diffraction—to rigorously demonstrate the method’s feasibility, accuracy, and reliability. Extensive experimental results confirm that this method is both feasible and sensitive, with the measurement error meeting industrial requirements for quantitative austenite determination. It offers significant advantages in operational simplicity, analysis efficiency, measurement stability, and sensitivity, making it particularly well-suited for the quantification of austenite in medium manganese steels.

1. Introduction

More recently, a series of advanced high-strength steels (AHSSs) have been developed to meet the increasing demand for structural materials in consideration of light weight, security, and energy saving in the automobile and other manufacturing industries [1,2]. Notable examples include nanostructured bainitic steels [3], transformation-induced plasticity (TRIP) steels [4], quenching and partitioning (Q&P) steels [5], and medium Mn steels [6,7], which achieve an exceptional balance of high strength and ductility/toughness. Central to the superior performance of these AHSSs is the deliberate incorporation of metastable austenite—either retained or reverted—with a tailored morphology and volume fraction. This austenite phase enables mechanisms such as the TRIP effect, where stress-induced martensitic transformation during deformation enhances strain hardening and delays necking, thereby overcoming the classical strength–ductility trade-off [8,9,10]. However, the stability and content of austenite are highly sensitive to thermo-mechanical processing parameters, including rolling, post-rolling cooling, deformation, cryogenic treatments, and intercritical annealing. These processes trigger complex phase transitions (e.g., γ→α′ + (γ), γ→ε→α′, or α′→α + γ) under varying stress, strain, and temperature conditions, leading to significant fluctuations in the final austenite content. Such variability directly impacts mechanical performance, hydrogen embrittlement resistance, and thermal/mechanical stability [9,10,11,12,13]. In the manufacturing, welding, and repair processes of certain bearing steels, low-temperature iron–nickel alloys, and martensitic stainless steels, trace amounts of residual austenite often play a significant role in influencing the material’s low-temperature toughness, fracture toughness, fatigue performance and other properties [14,15,16,17]. The simple, accurate, and quantitative determination of the retained austenite content is a necessary prerequisite and foundation for evaluating and optimizing the performance of these steels in scientific research and industrial applications. This capability is essential for tailoring microstructures to achieve desired properties, ensuring their reliability in demanding applications and advancing the development of next-generation high-performance steels.
Experimental methods for determining austenite content reported in the literature include X-ray diffraction (XRD), optical microscopy (OM), scanning electron microscopy (SEM), Electron Back-Scattered Diffraction (EBSD), transmission electron microscopy (TEM), magnetization measurements, and others [18,19]. Among these, the XRD method is most commonly used due to its suitability and the widespread availability of XRD facilities. The measurement error in determining the retained austenite content through XRD is influenced by the sample condition, instrument limitations, and calculation methods, including factors such as surface condition, crystallographic orientation, texture, grain size, scanning step, focusing, statistical count, peak boundary, R value, and more [20,21]. The shallow penetration depth of X-rays means that the phase structure and austenite content are significantly affected by stress conditions and surface treatments applied to the sample. The processing texture of steel can cause the characteristic peaks at certain angles to weaken or disappear, leading to measurement errors. Additionally, the scanning step length, time, and speed of the XRD can greatly impact the accuracy of austenite measurements, with high-precision measurements taking dozens of hours [22,23,24]. The austenite content measured using the XRD method represents the austenite tens of micrometers below the surface. The complex and detailed sample preparation and calculation methods required for XRD are more appropriate for scientific research than for industrial steel evaluation. Microscopic microstructure analysis techniques, such as SEM, TEM, and EBSD, provide detailed insights into the morphology, composition, and crystal structure within minute regions magnified by tens of thousands of times. In reality, microstructure variations across different regions of a macroscopic steel sample are extremely pronounced. Magnifying and photographing every region of a macroscopic sample proves impractical. Typically, the actual procedure involves selecting representative areas for imaging; this selection depends entirely on the operator’s subjective discretion. Consequently, the analysis results derived from these enlarged microscopic images merely represent the chosen area, not the entire sample. Furthermore, precisely quantifying trace amounts of thin-film nano-scale austenite (with film thicknesses ≤ 100 nm) in medium manganese steels is an exceptionally challenging task for conventional austenite measurement techniques like XRD, EBSD, and SEM.
Magnetic methods are physical techniques that rely on the significant differences in the saturation magnetization (Ms) of steels with varying volume fractions of austenite. This method is particularly suitable for complex nano-scale multiphase steels containing austenite, as the Ms value is independent of the microstructure morphology and crystal size. The common magnetic measurement methods for quantifying austenite content rely on magnetometer technologies, such as the vibrating sample magnetometer (VSM) and the superconducting quantum interference device (SQUID) magnetometer [25,26,27,28,29]. These measurement methods necessitate the preparation of very small, standard-shaped samples and the correction of macroscopic sample-shape demagnetization fields to accurately measure the true magnetization curve. Work hardening during the very small sample preparation can introduce additional ferromagnetic phases (TRIP effect) and alter the Ms value of steels, potentially affecting the determination of the true austenite content. Furthermore, most of the existing techniques for measuring austenite content are based on very small samples, and the measured austenite content is actually only the content on the surface, in a local area, or within a small volume of the sample. The complex and meticulous sample preparation process, the expensive research instruments, and the complicated data analysis procedures involved in these existing methods make it not an easy task to measure the content of austenite in multiphase steels containing austenite. A simple, rapid, and accurate method for determining the austenite content within bulk steel samples is urgently needed in both industry and scientific research; the magnetic measurement method based on magnetic fluxmetric techniques may be an important and feasible solution [30,31].
This study introduces a simple magnetic measurement technique for assessing the saturation magnetization and austenite content in medium manganese steels using a specific magnetic permeameter. A permeameter is an instrument designed to measure the internal magnetic properties of soft magnetic materials, such as industrial silicon steel, employing magnetic fluxmetric technology. It offers a rapid, non-destructive evaluation of the internal magnetic characteristics of bulk ferromagnetic samples, eliminating the need for intricate demagnetization corrections and elaborate sample preparation. Given that the permeameter’s maximum field strength (≤1000 Oe) is significantly lower than that of other saturation magnetization instruments, the directly measured maximum magnetization strength (Mm) differs from the Ms value. To overcome this constraint, an innovative method has been suggested: estimating the Ms value indirectly by linearly fitting near-saturation reversible magnetization data, utilizing the ancient law of approach to saturation (LAS)—the classical Frölich–Kennelly equation. Medium Mn steel is one of a new generation of AHSSs with a complex multiphase microstructure, which can obtain a wide range of austenite content through different quenching, cold rolling, and intercritical annealing treatments, as well as other treatment processes. The factors influencing the measurement of magnetization in a permeameter, including measurement and instrumental aspects, are initially studied, as they impact the accuracy of measuring the saturation magnetization and austenite content. We determined the Ms values and austenite volume fractions in medium Mn steels under varied processing conditions using the permeameter method. These measurement results were corroborated by findings obtained from VSM and XRD techniques. The permeameter method demonstrates a remarkable sensitivity and precision for quantifying low-content austenite in medium manganese steels. However, it proves unsuitable for quantifying austenite in multiphase steels containing a high austenite content or phases with a high magnetocrystalline anisotropy, due to its constrained magnetic field strength.

2. Theoretical Basis

According to the theory of ferromagnetism, the saturation magnetization (Ms) of a crystal phase is an intrinsic magnetic parameter that is only linked to intrinsic crystal structure, temperature T, phase density, and solute alloy element content and is independent of its crystal size, microstructure morphology, stress state, and other extrinsic factors [32]. The relationship between the saturation magnetization Ms of α-iron and temperature T obeys the well-known Blouch T3/2 law [33]: Ms(T) = Ms(0)(1-CT3/2). Here, Ms(T) represents the saturation magnetization at temperature T, Ms(0) is the saturation magnetization at 0 K, and C is a fixed constant. Ms(T) vanishes at the Curie temperature (Tc). In most of the literature, unless otherwise specified, “Ms” actually refers to the saturation magnetization at a test temperature T, that is, Ms(T). This article adopts the same convention, omitting the explicit temperature symbol (T). The influence of alloying element content on the Ms value is explained by band theory [34,35], typically manifesting as a weak gradual effect at low concentrations. When ignoring the difference in phase density of different types of steel (by using the same density setting), the saturation magnetization is actually the mass saturation magnetization (σs). At the same test temperature, the difference in the Ms (or σs) values of different steels is solely determined by the types and proportions of their internal crystallographic constituent phases. In this paper, the standard SI (International System) is used, but, in order to facilitate the comparison of historical research data, the magnetic field (Oe) and magnetization Gs in the CGS (electromagnetic or emu) systems are also used in some places.

2.1. Physical Principle of Magnetic Measurement Methods of Austenite Content

Despite the complex microstructures of novel multiphase steels like TRIP steel, medium manganese steel, and Fe-Ni alloys, their internal constituent phases, viewed through their crystal structures, are limited. These phases may include bcc-Fe, fcc-Fe, hcp-Fe, and θ-Fe3C, along with minor precipitated phases and non-magnetic inclusions. Here, we must distinguish between the microstructural phase and the crystallographic constituent phase. The Ms value relates specifically to the crystallographic constituent phase. These crystallographic constituent phases can be categorized into ferromagnetic, paramagnetic, and antiferromagnetic phases based on their magnetic properties. These crystallographic phases fall into three categories based on magnetic properties: ferromagnetic, paramagnetic, and antiferromagnetic. Ferromagnetic phases exhibit a high permeability and a fixed Ms below the Tc, whereas paramagnetic and antiferromagnetic phases show a low permeability and negligible magnetization within achievable magnetic fields. Specifically, bcc-Fe and θ-Fe3C are ferromagnetic; fcc-Fe is paramagnetic; and hcp-Fe (or ε-martensite), found in stainless steel or high manganese steel, is antiferromagnetic [36]. Most inclusions, such as calcium oxide (CaO) and aluminum oxide (Al2O3), alongside non-ferrous intermetallic (compounds like manganese sulfide (MnS), vanadium carbide (VC), and vanadium nitride (VN)), are non-magnetic phases. Typically, the volume fraction of precipitated phases and inclusions in steels is minimal and negligible. For a multiphase steel with n different phases, the collective saturation magnetization Ms(c) value is the sum of the product of each phase volume fraction f(i) and its corresponding saturated magnetization Ms(i):
M s ( c ) = i = 1 n f ( i ) ( M s ( i ) = f ( α ) M s ( α ) + f ( γ ) M s ( γ ) + f ( θ ) M s ( θ ) + i = 1 n f ( i ) = f ( α ) + f ( γ ) + f ( θ ) + = 1 , f ( i ) = V i V                                                                    
where each phase i has a fixed Ms(i) at a test temperature T; the Ms(c) value is determined by the volume fraction of each phase f(i); f(γ) is the volume fraction of the austenitic phase; f(θ) is the volume fraction of the cementite phase; Ms(α) is the saturation magnetization of the α-ferrite phase; and Ms(γ) is the “saturation magnetization of the γ-austenite phase. Vi represents the volume of phase i, and V represents the total volume of all phases. When the subtle differences in density among different phases are ignored, the volume fraction f(i) of each phase and the phase mass fraction are equivalent. Generally, utilizing magnetic polarization intensity (J) proves more convenient than magnetization intensity. This relationship is defined as J = μ0M, where μ0 represents the vacuum permeability constant, μ0 = 4π × 10−7 T·m/A. The saturation polarization intensity (Js) is also equivalent to Ms. At room temperature (RT, 298 K), the Js(α) for pure iron is approximately 2.15 T, whereas the Js value of non-magnetic phases (such as fcc-Fe, hcp-Fe) is usually less than 0.005 T [35], even at a magnetic field strength of 106 A/m (approximately 1.25 T). This immense disparity in Js (or Ms) values between ferromagnetic and non-magnetic phases means that even a slight increase in non-magnetic phase content will trigger a substantial change in Ms(c). When the influence of trace inclusions and precipitated phases except for austenite is disregarded, the f(γ) value can be determined by the following simplified relationship [25]:
f ( γ ) = 1 M s ( c ) M s ( f ) = 1 M s ( c ) β M s ( α )      
where Ms(c) is the collective saturation magnetization of an austenite-containing steel sample; Ms(f) is called the saturation magnetization of an austenite-free steel sample with the same composition. The f(γ) value can be measured by measuring the Ms(f) and Ms(c) values of a multiphase steel through magnetic measurement experiments. β is a constant related to the composition of steel, which is usually less than 1. It represents the proportion by which the Ms(f) value decreases relative to the α-Fe phase due to changes in the content of other phases (such as cementite, non-magnetic inclusions, etc.) or alloy elements in the steel. Its expression is as follows: β = Ms(f)/Ms(α). In medium-high alloy steel, the significant influence of alloy element content on the Ms(f) value must be considered. The Ms(f) value for an alloy steel is typically determined by directly measuring the Ms value of that specific steel when it contains 100% α-martensite. The austenite-free sample can be obtained by quenching the alloy steel in water, liquid nitrogen, or liquid helium after a thorough solid solution homogenization. The actual commercial steel is a complex multiphase steel containing other non-magnetic phases (MnS, hcp-Fe, CaO, VN, etc.); the f(γ) value calculated using Formula (2) in the magnetic method is actually the sum of the volume fractions of all these non-magnetic phases.

2.2. The Law of Approach to Saturation Magnetization

According to ferromagnetic domain theory, a macroscopic ferromagnet consists of numerous magnetic domains; each is spontaneously magnetized to the saturation magnetization strength [37]. Without an applied magnetic field, the magnetization vectors of these domains point in random directions, collectively resulting in zero macroscopic magnetization for the entire ferromagnet. The direct measurement of the Ms value of a ferromagnetic material requires a sufficiently high magnetic field to eliminate domain walls and rotate the magnetization directions of all magnetic domains with the external field direction. However, this external field is often too strong to be achieved. The practical measurement method involves testing the magnetization curve (M-H) of a test sample in a high field and subsequently determining the Ms value using the law of approach to saturation (LAS), which describes how magnetization approaches saturation magnetization under a high effective external field (H). For polycrystalline ferromagnetic materials, the general LAS equation can be described by means of the following expression [38,39]:
M M s ( 1 A H B H 2 ) + χ α H
where A, B, and χα are temperature-dependent positive constants. The constant A is generally attributed to the presence of structural inhomogeneities (voids, dislocations, microstresses, inclusions, non-magnetic phase, etc.). It was called the magnetic “hardness” coefficient by P. Weiss [40]. The constant B is related to the magnetocrystalline anisotropy. χα represents the magnetic susceptibility of α-Fe under extremely high magnetic fields, which is typically a very small value. The χαH term is understood to describe the forced enhancement of spontaneous magnetization within the α-Fe phase, resulting from the increased spin alignment under a high field. This term’s contribution is generally negligible at temperatures significantly below the Tc and for fields below approximately 106 A/m [39]. Therefore, under typical laboratory conditions, the saturation magnetization Ms(T) for soft and semi-hard magnetic materials can be determined by fitting the high-field segment of the experimental curve solely with the first term on the right side of Equation (3).
However, there are both practical and theoretical difficulties in using this LAS model to measure the saturation magnetization. One practical difficulty is in deciding over what range of fields it should be applied; an improper fitting range data selection will lead to different fitting results and large errors. The values of Ms, A, B, and χα may depend quite strongly on the lower field limit chosen for fitting the equation. The magnetic fields used to determine the saturation magnetization range from a few hundred Oersted to tens of thousands of Oersted, and the interval of data that is chosen actually determines the fitting results. R. Grössinger has given the methods of the fit procedure to solve each parameter of this equation, but the above M-H relationship is very complicated and non-linear, and there are four free parameters or more parameters that need to be obtained using the complex fit procedure [41].
Another LAS model for ferromagnetic materials was probably the earliest, Lamont’s Law [42], which states that the susceptibility in fields strengths considerably greater than the coercive force is proportional to the difference between the intensity of magnetization and its saturation value. It can be converted into the following form:
M = M s ( 1 A H + A )
where A is the magnetic “hardness”. This formula is an ancient empirical formula which is derived from the data obtained by testing ferromagnetic materials in the magnetic field generated by the solenoid. Due to the relatively small strength of the electromagnetic field, the χαH term of the LAS Equation (3) was not considered in this LAS formula. This formula is equivalent to the linear Frölich–Kennelly (F-K) relation [42], which can be written as follows:
H M = A M s + H M s = a + b H
where a and b are constants, and b is the inverse of Ms. This linear relationship between H/M is easier to distinguish and determines the field range from the graph plots, and it is particularly suitable for measuring the Ms value through high field data fitting. The Ms value is only related to the linear slope (relative value of ΔHM), which means that it is not sensitive to the instrument calibration accuracy. But this Lamont’s law or F-K relation was also an empirical LAS formula that still lacks a theoretical explanation.
When determining the Ms(c) value of multiphase steels containing austenite, the LAS Formula (3) is also valid. However, the term χαH includes the austenite magnetization component and cannot be ignored in high-precision measurements, particularly when the austenite content is relatively high. This is because the paramagnetic austenite magnetization (Mγ) increases linearly with the field H, and the magnetic susceptibility (χγ) of austenite is much higher than the χα value. In this situation, the collective magnetization M(c,H) data of all the ferromagnetic phases should be used in the LAS model; this data can be obtained through the following relationship:
M ( c , H ) = M ( H ) M ( γ , H ) = M ( H ) f ( γ ) x γ H
where M(H) is the practical measured M-H data of multiphase steels. The χγ value can be obtained through theoretical calculation or by measuring a completely non-magnetic austenite sample, and the f(γ) value can be estimated from the directly measured Mm value. The measured M-H data can be corrected using the aforementioned equation to eliminate the component of austenite magnetization, and then the Ms(c,H) value can be obtained through a normal fitting calculation by the LAS Equation (3) (without the χαH term). When Lamont’s LAS formula (or F-K relation) is adopted to determine the Ms(c) value of a multiphase steel under a high magnetic field intensity (>200 Oe), this correction processing method is also effective and necessary for high-precision measurements. When the test magnetic field is very small, the f(γ)χγ term does not need to be considered.

2.3. Magnetization Measurements Methods and Selection

The most commonly used magnetization measurements methods for the M-H curve can be divided into two categories [39]. One type is the magnetometer technology based on open-sample systems, such as VSM or the Quantum Design SQUID magnetometer, which are particularly effective for characterizing hard permanent magnets, recording media, weakly magnetic materials, and paramagnetic substances. These instruments operate by subjecting the sample to static external applied fields (Hₐ) generated through electromagnets, superconducting solenoids, or permanent magnet assemblies, with the field strength typically quantified using Hall probes or fluxgate magnetometers. Although the measurement results of these instruments are usually presented in the form of M-H curves, they essentially represent the M-Ha relationship because the Hₐ is different from the internal effective field H. The relationship between the two magnetic fields can be written as follows [38]:
H = H a H d = H a N d M
where Hd is the demagnetizing field of the open sample, which is equal to Nd M. Nd is the macroscopic geometric demagnetizing factor of the sample, which is related to a series of factors such as the sample macroscopic shape and size. For sphere and cube samples, Nd = 1/3. The Nd values of samples with other shapes are difficult to measure or calculate accurately. One approximate method is to make the test sample into a small standard-shape (sphere or cube) sample or powder. Since the standard-designed VSM devices are limited to small samples (generally less than 0.1 g for strong ferromagnetic materials), the TRIP effect when preparing these very small samples of multiphase steel will affect the measurement results [25]. Another method is that the slope of the magnetizing curve in the weak field is equal to 1/Nd when ignoring the small field required for the magnetization of soft magnetic materials. In practice, the precise internal effective field H for an open sample cannot be reliably determined through these two methods due to the significant calculation error inherent in the demagnetizing field Nd M. This challenge is particularly acute for high-permeability soft magnetic materials or geometrically anisotropic samples, where demagnetizing fields substantially distort the internal magnetic environment [39]. Consequently, this fundamental limitation impedes the accurate derivation of the true M-H magnetization curves from experimentally measured M-Ha data.
The other magnetization measurement method employs magnetic fluxmetry techniques [43], which utilize a measurement system consisting of a magnetizing coil and a search coil (B-coil) wrapped around the test sample. The magnetizing coil generates a controlled magnetic field through the application of a sinusoidal or pulsed current. As the magnetic field dynamically varies, it induces changes in the sample’s magnetization state and magnetic flux density (B), thereby producing a proportional induced electromotive force in the search coil. This induced voltage is electronically integrated over time to quantify the instantaneous magnetic flux (Φ) threading the sample. Given the high precision achievable in measuring both current and voltage, this method enables a high-resolution B-H curve characterization with a high accuracy. Magnetic flux measurement techniques also can be categorized into open and closed magnetic circuits based on the type of sample arrangement. The closed magnetic circuit circumvents the complex calculations required for the geometric demagnetization factor and allows for a greater measurement accuracy. It can be realized by the sample itself, such as a ring sample or an Epstein frame. However, the preparation of ring samples or Epstein frames is more complex for industrial applications. Permeameters create a closed magnetic circuit configuration by combining an open sample with a yoke. This design allows for a customizable adaptation to accommodate diverse sample geometries, including rods, bars, wires, strips, or sheets, depending on the material type and experimental requirements. By eliminating the need for complex sample preparation and avoiding mechanical work hardening effects, permeameter measurements offer a non-destructive, rapid, and versatile approach for characterizing the magnetic properties of ferromagnetic materials under low-field conditions.
Multiple measurement methods exist for measuring magnetization curves in permeameters. In terms of power supply type, it can be divided into Direct Current (DC) and Alternating Current (AC) measurements. Generally, the DC magnetization curve of a material represents its constitutive magnetization curve, arising from the material’s response to a static external field H. It is solely related to the inherent magnetic properties of the test material and is independent of the specific sample size used in the test and the measurement method. However, achieving a truly static magnetization is practically impossible with fluxmetric methods; the “DC magnetization” in permeameters refers to a “quasi-static” magnetization process specifically designed to minimize the influence of eddy currents [43]. The typical method for achieving a quasi-static condition is that the magnetizing field strength is changed in a step-like fashion and the magnetization curve is obtained by a point-by-point procedure [44,45]. This measurement approach, known as the ballistic impact method, serves as the standard technique mandated by IEC 60404-4 standard [46]. This method demands specialized DC permeameters (such as IEC Type A, IEC Type B, and saturation permeameters [47]) and meticulously demagnetized specimens. The DC magnetization measurement process proves equally arduous and time-consuming, with the accuracy and reproducibility of results often being poor, largely due to the difficulties in achieving ideal quasi-static conditions and perfect demagnetization [43].
In an alternating magnetic field, the response functions B and M of magnetic materials lag the excitation magnetic field H by a phase angle φ due to the dissipative losses (eddy current, magnetic after-effect, and other ways) within the magnetic materials [43,45]. φ is usually referred to as the hysteresis angle or loss angle, which is not only related to the magnetic properties of the material itself, but also to the frequency and the size of the test sample. The relationship between B and H in the alternating magnetic field can be expressed as follows:
H = H m s i n ω t ;     B = μ a c H = B m s i n ( ω t φ )
where H is the source magnetic field; ω is the angular frequency (rad/s), ω = 2πν; ν signifies the frequency of the alternating magnetic field (Hz); Hm is the peak intensity of the alternating magnetic field; Bm is the peak magnetic flux density within the magnetic material; and μac represents the complex magnetic permeability of the magnetic material. It is divided into two parts and can be expressed as follows:
μ a c = ( μ ) 2 + ( μ ) 2 = B m H m , μ = μ a c cos ϕ ;   μ = μ a c sin ϕ
Here, μ is usually denoted as Re(μ), representing the real part of the complex magnetic permeability of a magnetic material. It characterizes the magnetic energy storage capacity (similar to inductance) of the magnetic material in alternating fields. μ is usually denoted as Im(μ), representing the real part of the complex magnetic permeability of a magnetic material. It characterizes the power loss capacity of magnetic materials in an alternating magnetic field. μ a c is referred to as the modulus of complex magnetic permeability or the alternating amplitude permeability and is usually lower than its μdc value. These AC magnetic characteristic parameters are not only related to the intrinsic parameters of the magnetic material, but also to the type of alternating field (frequency, amplitude, waveform, etc.) and the size of the sample, among other factors. When the magnetization M approaches Ms under a high field, the magnetic flux in the sample changes very slowly, the eddy current effect is not obvious, the hysteresis angle φ will approach 0°, the difference between the μ a c value and the μdc value becomes negligible [44,48], and the AC and DC magnetization curves almost coincide. The Single Sheet Tester (SST) permeameter is the most commonly used measuring instrument for AC magnetization, manufactured in accordance with the IEC 60404-3 standard [49], which is applicable to grain-oriented and non-oriented electrical steel strips and sheets for the measurement of AC magnetic properties at power frequencies. Modern digital AC permeameters, leveraging waveform synthesis, digital sampling, electronic integration, amplification, and air flux compensation, achieve an exceptional precision and repeatability even at remarkably low frequencies of 1 Hz [43]. Therefore, given the superiority of modern AC permeameters in terms of convenience, speed, efficiency, accuracy, and repeatability, as well as their ability to measure frequency-dependent iron losses, AC testing has become a feasible alternative for determining the saturation magnetization curve for soft magnetic materials or semi-hard magnetic materials.
With respect to the magnetic field measurement in the permeameters, there are two principal techniques: the direct H-measurement method and the equivalent magnetic circuit length (Le) method. The direct measurement of the effective field H is generally achieved by using either a localized Hall probe or an H-sensing coil placed on the specimen surface. In the standardized AC magnetization measurement of the SST permeameter, the effective field H is traditionally calculated using the calibrated Le value, but the actual Le value will constantly change due to variations in the material type, thickness, cross-sectional area, and test magnetic field strength of the test sample [50,51,52]. This is because magnetic flux always seeks the closed magnetic circuit path with the minimum total magnetic reluctance for transmission. The formula for calculating the magnetic reluctance of a magnetic material with a path length of l is l/μA, where μ represents its magnetic permeability and A denotes the cross-sectional area along path l. The magnetic flux transmission path within the overlapping area between the permeameter’s magnetic yoke and the test sample is governed by the ratio of their magnetic reluctances along this path. As long as the magnetic permeability of the test sample changes, the corresponding magnetic reluctance and Le value will also keep changing. The magnetic permeability of different steel materials varies greatly, and, accordingly, the corresponding Le value is also quite different, making the measurement of magnetic field strength very difficult. To resolve this problem, the magnetomotive force (MMF) method is proposed for measuring the Ms value. When a magnetic material approaches saturation magnetization, its magnetic permeability (μ) drops dramatically and changes minimally thereafter. At this stage, the Le value stabilizes, converging toward its inherent physical spacing. By leveraging the F-K relation, multiplying both sides by a fixed Le transforms the equation into a simplified form:
F M = A M s L e + H M s L e = a L e + b F , F = H L e = N 1 I
Here, I is the average magnetization current, N1 is the number of turns of the magnetizing coil, F represents the magnetomotive force, and M denotes the measured magnetization. The slope b can be derived via a regression calculation without requiring H or Le values. This approach minimizes the reliance on Le by directly correlating M with F, thereby enhancing measurement reliability in materials with a variable austenite content. Key advantages include a reduced uncertainty from Le variability, a simplified workflows due to the direct measurability of I, N1, and M, and an applicability to complex microstructures. This MMF method provides a robust solution for measuring Ms, balancing accuracy and practicality in industrial and research settings, particularly for advanced multiphase materials where traditional methods falter due to dynamic permeability or polarization strength.

3. Materials and Experimental Procedures

The experimental steel was melted in a vacuum induction furnace and cast as a 50 kg ingot. The final chemical composition of the experimental steels were measured using the Spark Optical Emission Spectrometer(SPECTRO MAXx LMX07, SPECTRO, Kleve, Germany), the measurement results are shown in Table 1. Throughout this paper, each alloy will be referred to by designations based on the approximate Mn content, such as 5Mn and 7Mn, respectively. The cast ingot was heated to 1200 °C for 3 h, followed by hot rolling to a plate of 5 mm. Subsequently, the rolled plates were air-cooled to room temperature and the steel was marked as 5MnA and 7MnA. Next, the rolled plates were reheated to the intercritical annealing temperature 650 °C for 30 min and 1 h, respectively, and were named T1 and T2, respectively. Then, the intercritical annealed 5 mm steel plate was cold-rolled to a thickness of 1 mm, with a total reduction of 80%, and was named “-CR”, such as 5MnT1-CR. The purpose of this process was to study the change in austenite content during cold rolling. In order to obtain an austenite-free sample, another 2 mm steel plate was reheated to 1200 °C for 3 h and then directly quenched in water to room temperature; the steel was marked as “-WQ”. The non-magnetic high-manganese steel 25Mn sample was mainly used to calibrate the air flux compensation effect of the magnetic permeameters and approximately measure the magnetic susceptibility (χγ) of residual austenite. The specimens for microstructural studies were polished using standard metallographic procedure, etched with a 4 vol% nital solution, optical microscope(Olympus DP72, OM, Tokyo, Japan) and scanning electron microscope (SEM; Ultra 55, Zeiss, Oberkochen, Germany) were employed to characterize the microstructure. The quantitative determination of austenite content was carried out independently using VSM method, XRD method and the permeameter method. The magnetization curves of medium manganese steel in different states were measured by a special designed SST permeameter and VSM, respectively. The Ms value was determined using the LAS model based on the magnetization curves, and the austenite content was further determined. The measured results were compared with those of the traditional XRD method.
The magnetization measurement of bulk steel samples was carried out in a special SST permeameter(Hunan Forever Elegance Technology Inc., Changsha, Hunan, China) [53]; the schematic diagram of this permeameter is presented in Figure 1. Figure 1a shows the structure diagram of the yoke. The symmetric U-shaped yokes and the test specimen together form a closed magnetic circuit. The U-shaped yoke dimensions were the following: 100 mm in length, 25 mm in width, 80 mm in height, and 30 mm thick. The geometric physical distance between the U-shaped yoke is 50 mm. The symmetrical yoke design is advantageous because it promotes a uniform cross-sectional distribution of magnetic flux in the specimen. The stacking yokes are made of oriented silicon steel with high permeability, and the cross-section of the yokes is much larger compared with that of the test specimen, which makes the magnetic reluctance and iron losses on the yoke much smaller than on the specimen. The test specimen of a rectangular cross-section is surrounded by two concentric windings: an exterior primary magnetization winding and an interior secondary search winding. Both the magnetization winding and the search winding have 700 turns. The design of the magnetizing and search coils, which have the same number of turns and distribution space, enables extremely high measurement accuracy through the mutual inductance technique. This technique is recommended for measuring the magnetization and relative permeability of macroscopic specimens of weak magnetic materials [43,54]. Except for the yokes, the remaining parts of the permeameter are all made of non-conducting, non-magnetic materials. This permeameter’s considerably shorter test sample length compared to the IEC 60404-3 standard [49] for silicon steel permeameters enables higher field strengths, enhancing its suitability for measuring the saturated magnetization of complex multiphase steels.
Figure 1b shows the circuit diagram for measuring the field and magnetization in the permeameter. The magnetizing coil is connected to a variable current source, mutual inductor, and an amperemeter (A). The search coil is connected to a voltmeter and mutual inductor. Air flux compensation was achieved by a compensating mutual inductor. The primary winding of the mutual inductor is connected in series with the primary winding of the test apparatus, while the secondary winding of the mutual inductor is connected to the secondary winding of the test apparatus in series opposition. Thus, the voltage induced in the combined secondary windings is proportional to the magnetization in the test specimen, and the magnetization curve tested is a J-H curve instead of a B-H curve. Magnetizing current waveform is generated as a standard sine wave by digital means. The compensated secondary voltage is detected in a complete cycle and A/D conversion is carried out; data is collected by 12-bit 400 kHz dual-channel digital acquisition card. The polarization intensity is measured with a digital integration method: the measurement program is processed by a computer unit and the data is recorded, the integration is carried out in the computer, and the residual deviation and drift are eliminated digitally. Through digital sampling and digital integration techniques, the test results have high accuracy and repeatability. The shorter magnetic circuit length ensures that a larger magnetic field strength is generated. The magnetizing currents range from 0 to 10 A, the theoretical maximum magnetomotive force can reach 7000 A, and the maximum magnetic field strength can reach 140 kA/m (about 1750 Oe), which creates the conditions for the measurement of Ms for advanced steels like medium Mn steels. For non-oriented silicon steel, the calibrated equivalent magnetic path length of this magnetometer is 59.62 mm, but it may not be applicable to other steel types.
Permeameter test samples were fabricated using wire cutting and mechanical grinding techniques, achieving dimensions of 30 × 100 × 1.0 mm3, and the sample thickness was deliberately controlled to be below the depth of the skin under power frequency conditions. The density of all the steel was set according to 7.85 g/cm3 during the permeameter test, and the cross-sectional area of the sample was determined using the weighing method, which can eliminate the influence of density difference on the Ms value. In this situation, the measured Ms value is actually equivalent to measures the mass saturation magnetization (σs). The AC magnetization tests were performed in the specialized SST permeameter. Air flux compensation effects in this permeameter were corrected before experimental testing commenced. Prior to batch testing, investigations explored the differences between AC and DC magnetization curves and the processing methods for the equivalent magnetic path length problem in the permeameter. The DC test was performed in standard permeameters manufactured according to IEC 60404-4 standard [46] by a professional organization [53]. The initial magnetization curve and the hysteresis loop were measured separately through distinct AC and DC testing procedures. All AC magnetization measurements were conducted at room temperature and at a frequency of 50 Hz. In the AC test, the point-by-point method for hysteresis loop measurement followed a predefined sequence of applied field steps; connecting the maximum field and magnetic induction points (Hm, Bm) yielded the initial magnetization curve. To ascertain the true Le value for the experimental steel within this special SST, a third-party independent professional organization was commissioned [53]. They measured and calibrated the Le and H values of an identical sample using a permeameter equipped with an H-measurement system. Experimental verification confirmed that the differences between low-frequency AC and DC magnetization curves under a high magnetic field can be disregarded. Consequently, the low-frequency AC test can effectively replace the cumbersome and time-consuming DC test for magnetization testing.
The high-field magnetization measurement of small samples were carried out using a Lakeshore 7407 vibrating sample magnetometer(Lake Shore Cryotronics Inc., Columbus, OH, USA) at 296 ± 5 K. The maximum magnetic field intensity was 2.10 T and the magnetization sensitivity was 5 × 10⁻⁷ emu. The VSM equipment was calibrated by a standard pure Ni sphere at a defined high field value in the rule before the test. The VSM samples were made by wire cutting into a square prism, followed by mechanical grinding and electrolytic polishing, resulting in samples with an approximate size of 2 × 2 × 1 mm3, and the total mass of the samples did not exceed 50 mg. The precision electronic balance(Secura125-1CN, Sartorius AG, Goettingen, Germany) was used to accurately determine the mass of the sample; the measurement precision must reach ±0.01 mg. During the test, the VSM sample was bonded to the center of the vibration rod, and the coordinate positions of the three directions are adjusted to find the saddle point. The magnetization curve was tested according to the test speed of 4 s/point, and the number of detected points was not less than 200 points. Each sample was tested more than three times to ensure the accuracy and repeatability of the measurement results. All samples were demagnetized before magnetic measurement. The demagnetization factor Nd of the samples is calculated by the formula in the Appendix A [55], and is calibrated by the slope of the measured M-Ha magnetization curves in weak fields (which is equal to 1/Nd). Then, the precise M-H magnetization curves are obtained from the measured M-Ha curves.
The XRD samples were made by wire cutting and mechanical grinding, with size 10 × 10 × 4 mm3. The samples were mechanically ground and electropolished in 8% perchloric acid alcohol to minimize the possible error originating from the mechanically induced transformation of retained austenite during the specimen preparation. The XRD sample was measured in the X-ray diffractometer (XRD) of the 9 kW Goniometer Smart Lab, using a Cu-Kα radiation source, scanning voltage and current of 40 kV/200 mA, scanning speed of 2°/min, and scanning angle range from 40 to 100°. The volume fraction of austenite f(γ) was estimated from the integrated intensity of the monitored austenite and ferrite peaks, which are described in the Appendix B [20,25]. The integrated intensities of (111)γ, (200)γ, (220)γ, (311)γ, (200)α, (220)α, and (211)α peaks were used to quantify the content of austenite and calculate the lattice parameters.

4. Source of Measurement Errors in the Permeameter

In magnetic research, the measurement errors caused by magnetic instruments and measuring methods have an important impact on the reliability of magnetic research results. The permeameter is an efficient, fast, and accurate test instrument for measuring the magnetization curves. However, some factors affecting measurement errors need to be considered and studied in the measurements of the permeameter, such as the difference between the DC and AC magnetization curves, the measurement method of effective field H, the air flux compensation, austenite paramagnetic magnetization, etc. These factors will affect the magnetization measurement accuracy and the results of the quantitative determination of Ms and austenite content.

4.1. Magnetization Curve Measurement Method

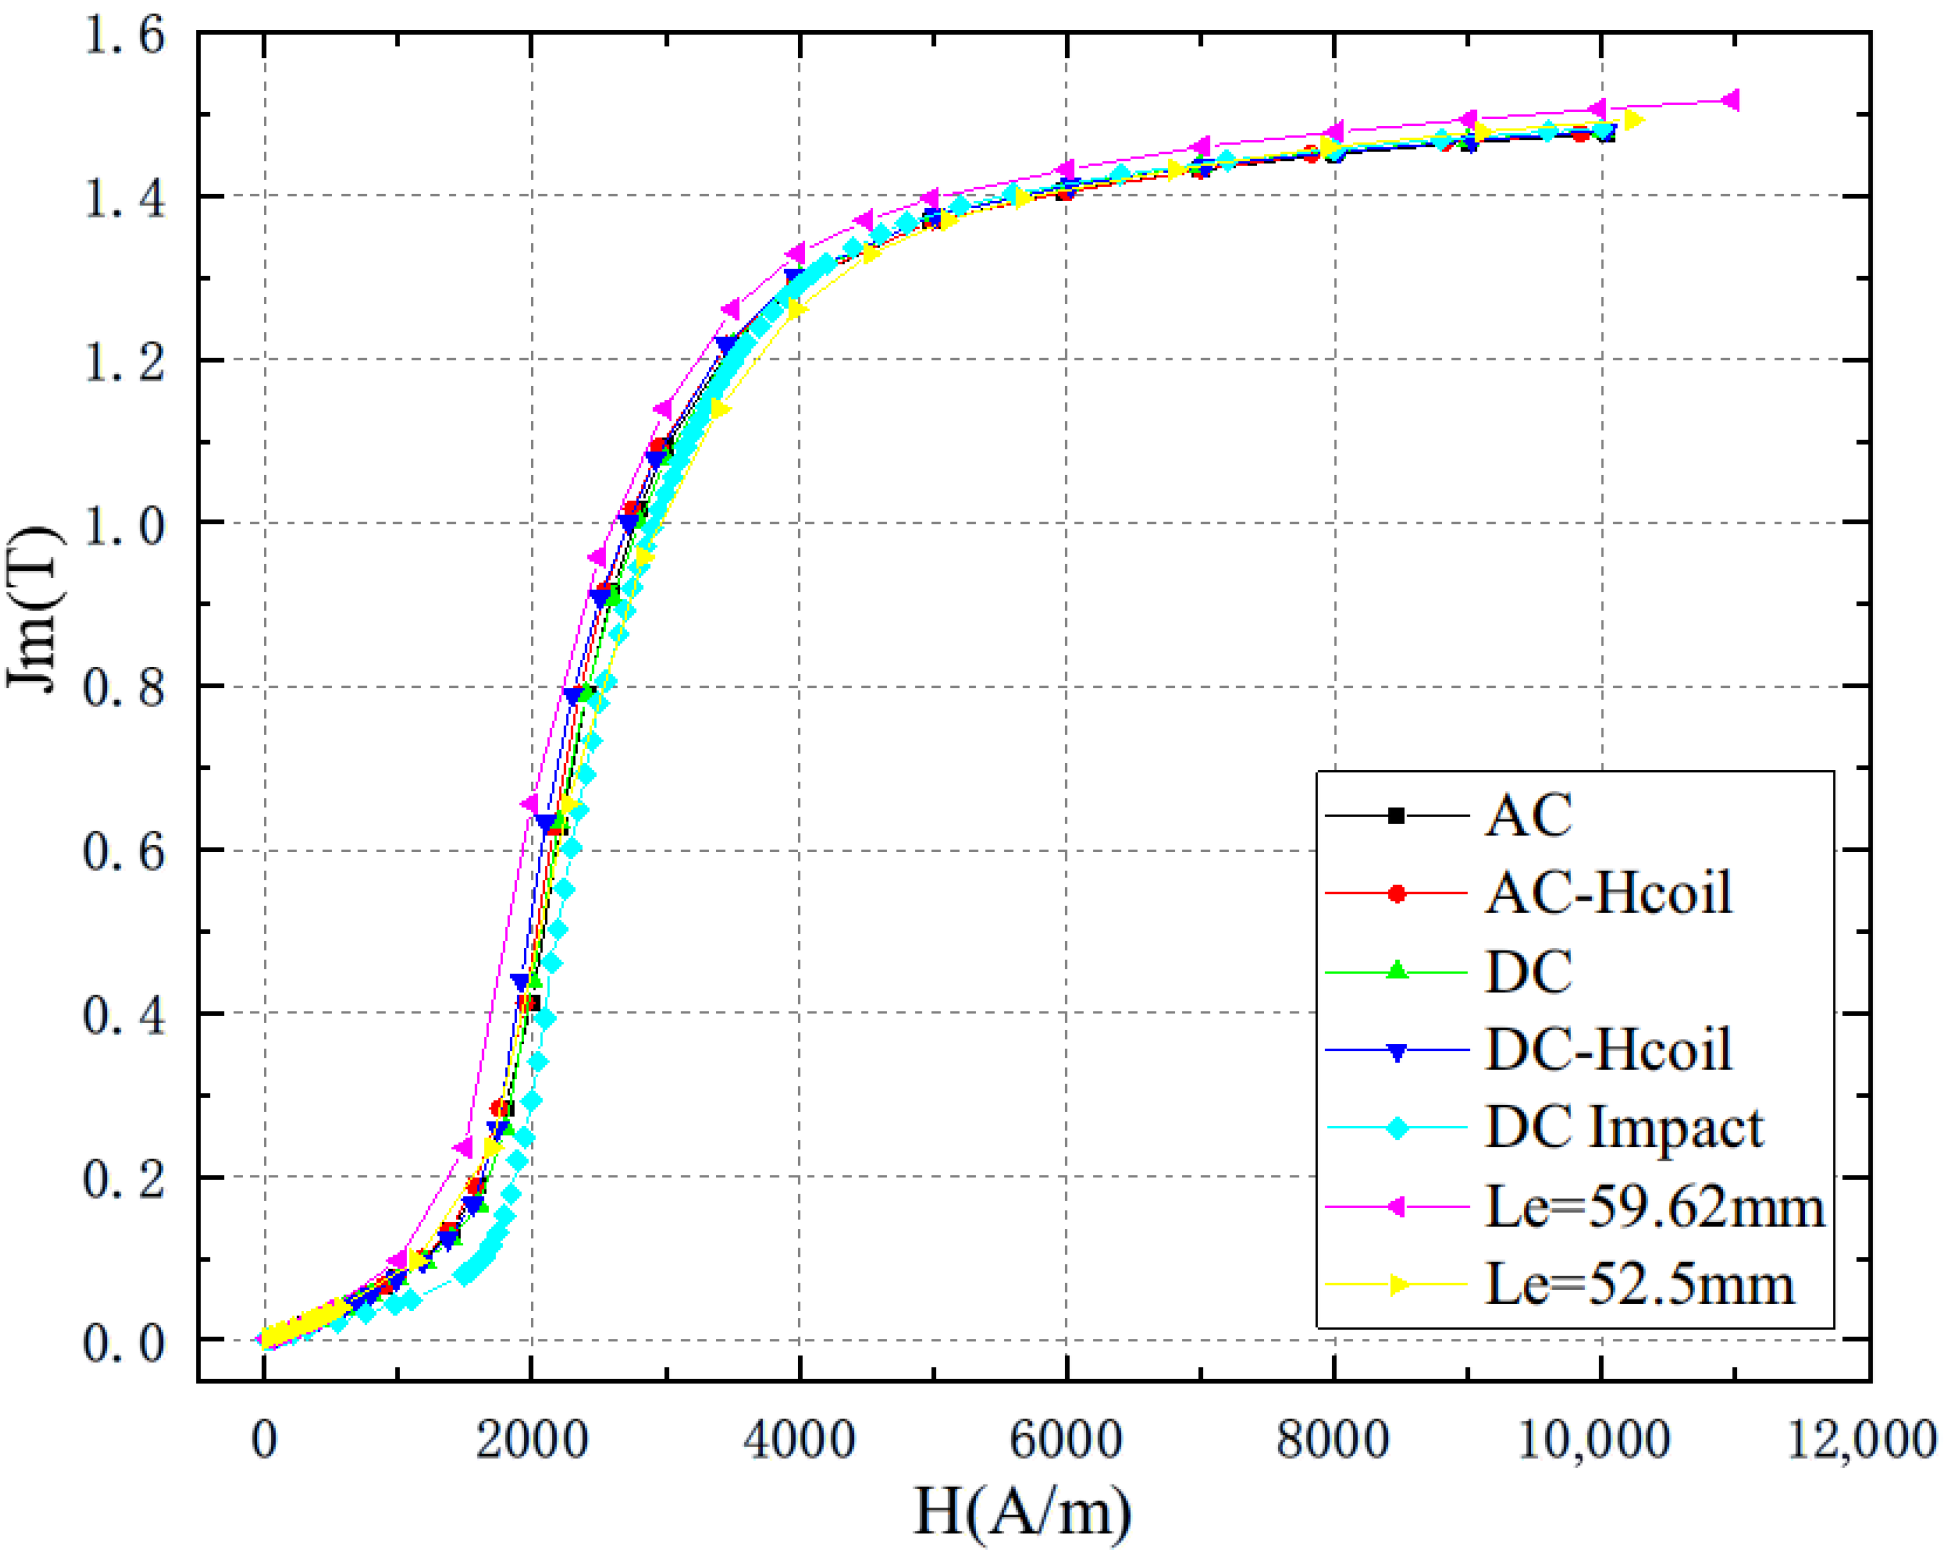
Figure 2 displays the magnetization curves of identical 5MnT1 steel obtained via these different magnetization measurement methods. The magnetic field strength was determined both by the Le method and the H-coil method (directly measured H). Curves labeled “H-coil” represent fields determined by professional permeameters equipped with an H-measurement system, while the others denote fields determined by the Le method. Professional institutions conducted DC tests on a Type A permeameter, designed per IEC 60404-4 standard [46], using a 250 mm sample. DC magnetization curves were measured via the ballistic impact method and magnetic field scanning method, labeled “DC-Impact” and “DC”, respectively. AC tests were performed using both professional institutions’ permeameters and our specially designed permeameters. Curves marked “AC” and “AC-H-Coil” show test results from a professional AC permeameter at 50 Hz using the Le method and H-coil method, respectively. The curves labeled “Le = 59.62 mm” and “Le = 52.5 mm” represent the results from our special permeameters, using a 100 mm sample, with the effective magnetic circuit length Le set to 59.62 mm and 52.5 mm, respectively. Figure 2 reveals that most magnetization curves obtained through the various DC and AC methods, except the “Le = 59.62 mm” curve, are essentially coincident and equivalent, verifying the constitutive law characteristics of the M-H magnetization curves. Barring instrumental errors, the AC and DC magnetization curves show minimal divergence as magnetization approaches saturation. Consequently, when determining the saturation magnetization roughly, the difference between AC magnetization and DC magnetization can be disregarded. As is evident in Figure 2, the magnetization curve exhibits a noticeable deviation when Le is set to 59.62 mm compared to other curves. However, setting Le to 52.5 mm aligns the curve with other measurement methods. This discrepancy arises because the Le value of 5MnT1 containing austenite is actually lower than that of silicon steel (59.62 mm). This improper setting of the Le value causes the actual field to significantly exceed the calculated value. Consequently, the “Le = 59.62 mm” magnetization curve exceeds the measurement curves from the other methods under an identical field strength. These results highlight the critical need for Le measurements specifically designed for different steels. Determining the precise Le value for different types of steel is challenging; the magnetomotive force method or the direct H-measurement method is recommended. For low-precision saturation magnetization measurements at high fields, the eddy current influence of the AC test becomes unimportant; these various methods of DC and low-frequency AC magnetization curves are all equivalent.

4.2. Air Flux Compensation Efect Correction

In the permeameter, mutual inductance technology is typically employed to eliminate the air flux generated by the magnetizing current. However, practical factors like manufacturing variations and air flux compensation settings often prevent a complete elimination of this air flux. Furthermore, since the search coil’s cross-section area exceeds that of the test sample, the measured flux encompasses both the sample flux and the residual air flux. Consequently, the measured magnetization (Mp) of the sample within the permeameter exceeds the sample’s true magnetization M. The difference ΔM between the measured Mp and the true magnetization M of the sample can be expressed as follows [47]:
Δ M = M p M = μ 0 ( S 2 S ) H = k 0 H
where μ0 is the vacuum permeability constant, and S2 and S are the cross-sectional area of the search coil and the measured sample in the permeameter, respectively. k0 is the correction factor and is related to the design parameters of the permeameter. Different permeameters have distinct air flux compensation settings and k0 values. As the field strength measured by the permeameter increases, the leakage air flux intensifies, making compensation correction increasingly critical—especially for magnetization measurements at high fields. Modern permeameters are capable of measuring the weak magnetization of austenitic steel through sophisticated signal amplification coupled with digital sampling and integration techniques. Before undertaking the quantitative determination of saturation magnetization, it is highly recommended to calibrate the k0 value of a new permeameter using a paramagnetic austenitic steel sample. The size and cross-sectional area of this austenitic steel calibration sample must match the sample intended for the saturation measurement, and the test frequency employed also must be identical. This enables the effective elimination of residual air flux through manual numerical compensation, yielding the actual magnetization value via the following relationship: M = Mpk0 H.
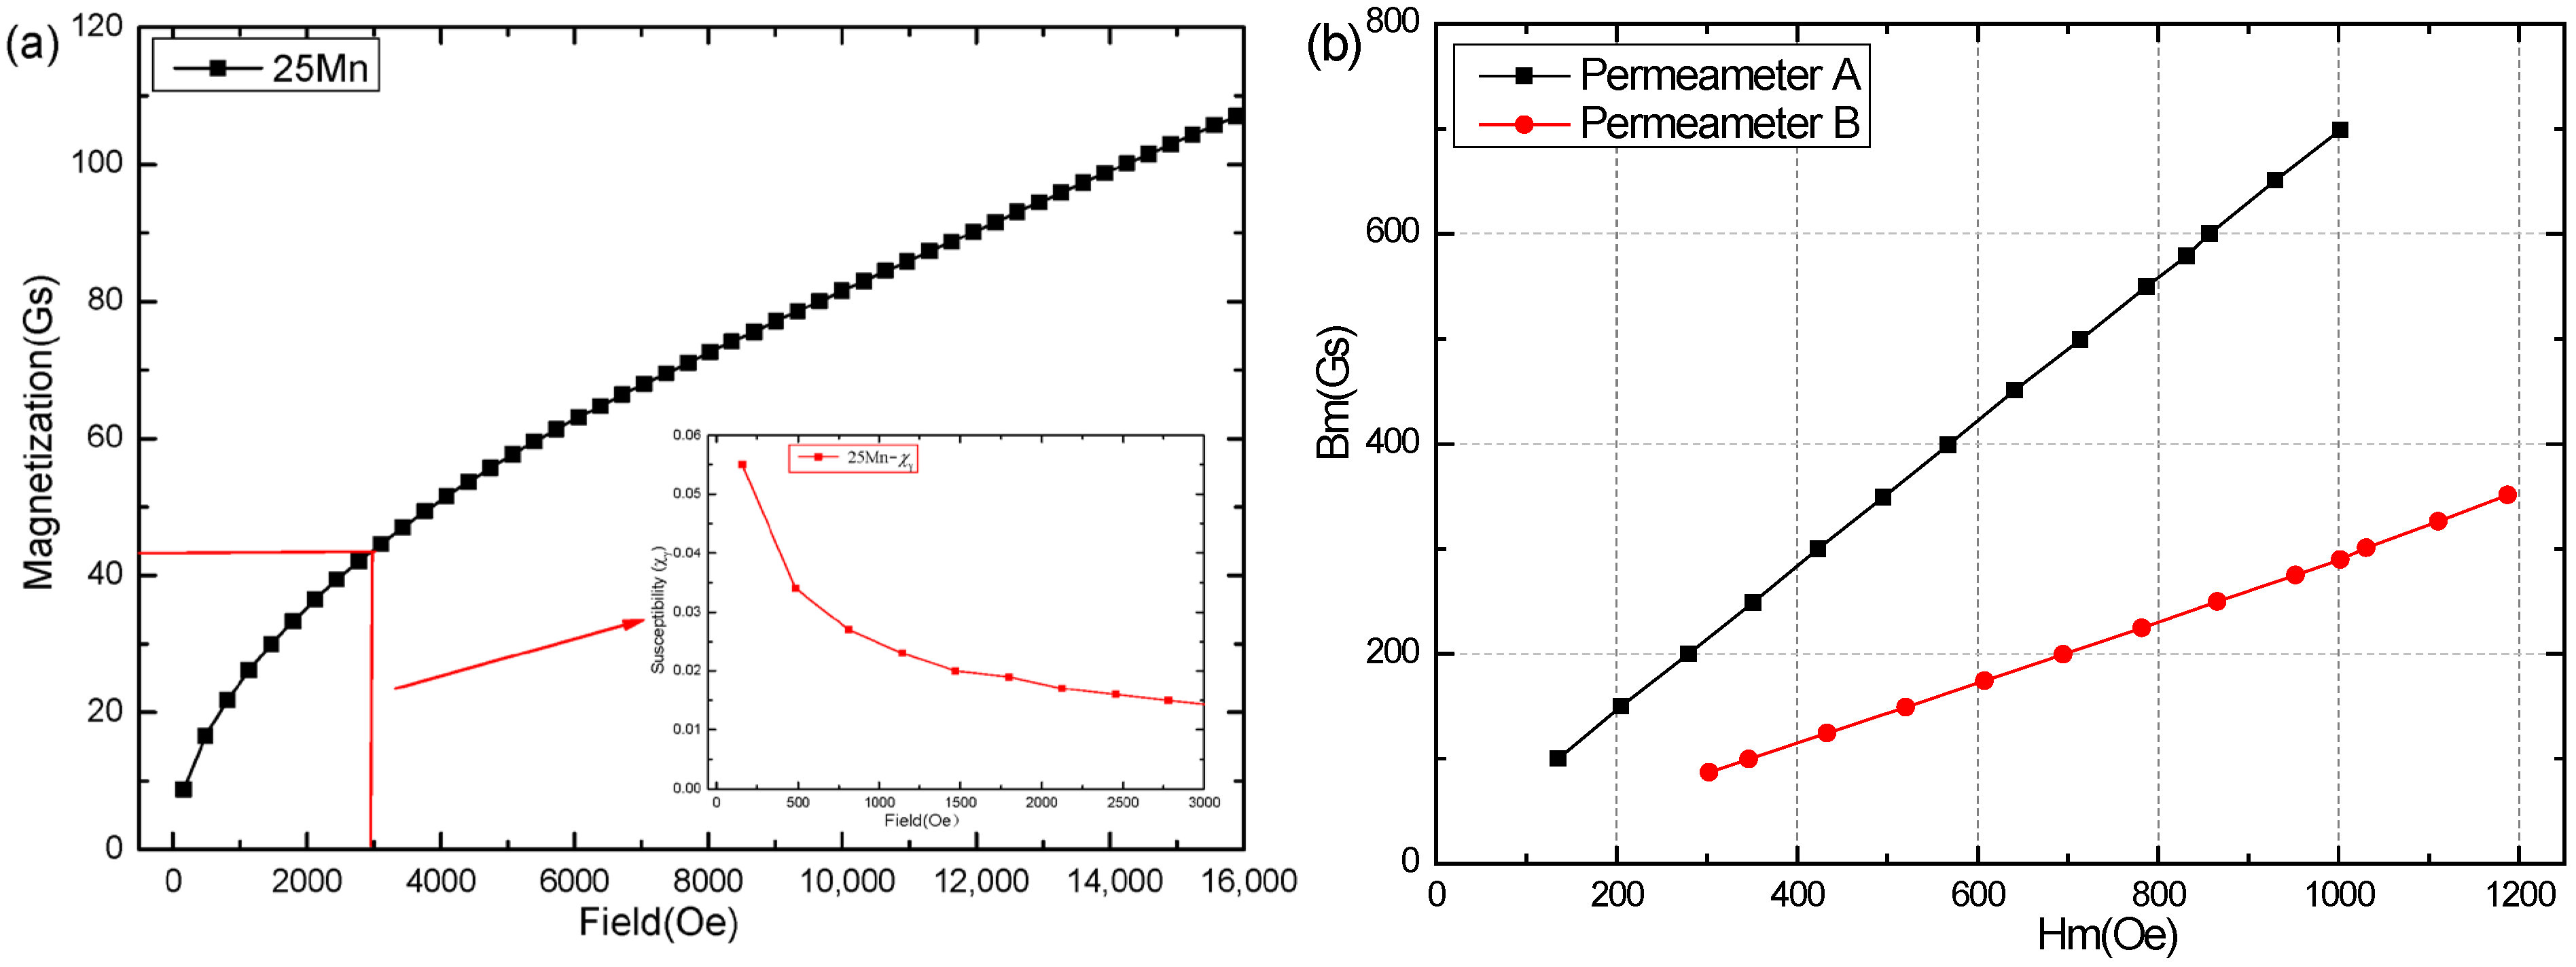
Figure 3 shows the different magnetization curve of the non-magnetic 25Mn steel measured using VSM and different permeameters. The 25Mn steel sample in the permeameter is 30 × 100 × 1.0 mm3, the same as in the batch experiments. Magnetization testing used a 50 Hz alternating magnetic field exceeding 200 Oe to enhance the weak austenite magnetization signal. From the above magnetization curve, it is easy to observe that the relative susceptibility of the same 25Mn non-magnetic steel measured using VSM and different permeameters shows significant differences. The susceptibility of 25Mn measured with VSM is the “true” susceptibility, decreasing as the field strength increases. At fields below 0.1 T (1000 Oe), the susceptibility is 0.04~0.05, and then gradually decreases to 0.002 at 5000 Oe. Beyond this field, the susceptibility changes became negligible. This significant drop likely stems from trace amounts of the ferromagnetic phase within the paramagnetic 25Mn steel. Even at a 1.5 T field, the paramagnetic magnetization of the 25Mn steel hovered just below 0.01 T (100 Gs). This true value of austenite paramagnetic magnetization is extremely small, exerting minimal influence on the saturation magnetization of multiphase steels. However, the susceptibility χγ of 25Mn measured using two different permeameters reached 0.7 and 0.3, respectively, at fields below 1000 Oe—vastly exceeding the VSM results. This inflated value does not reflect the true austenite magnetization but arises from the poor air flux compensation effect within the permeameters. This calibration sample is not perfect. It is recommended to find a non-magnetic steel with a constant magnetic permeability as the calibration sample for the calibration, such as the standard nickel balls in VSM. Based on the susceptibility results from VSM, the k0 values for permeameter A and permeameter B are determined as 0.65 and 0.25. The air flux compensation settings vary considerably among permeameters, causing marked discrepancies in their k0 values. This measured k0 value can be regarded as a fixed parameter for a permeameter under identical testing conditions; it can therefore be employed to artificially eliminate the excessive magnetization caused by air flux when testing other steels using the same permeameter. Within the limited magnetic field strength (<1000 Oe) that the permeameter can generate, the actual austenite magnetization component is generally very small (less than 50 Gs), and most of the measurement errors are caused by an improper air flux compensation. Consequently, correcting for the air flux compensation effect becomes critically important when determining the Ms and austenite content of multiphase steels in a high field.

5. Results

5.1. The Microstructure Characteristics of Medium Manganese Steels

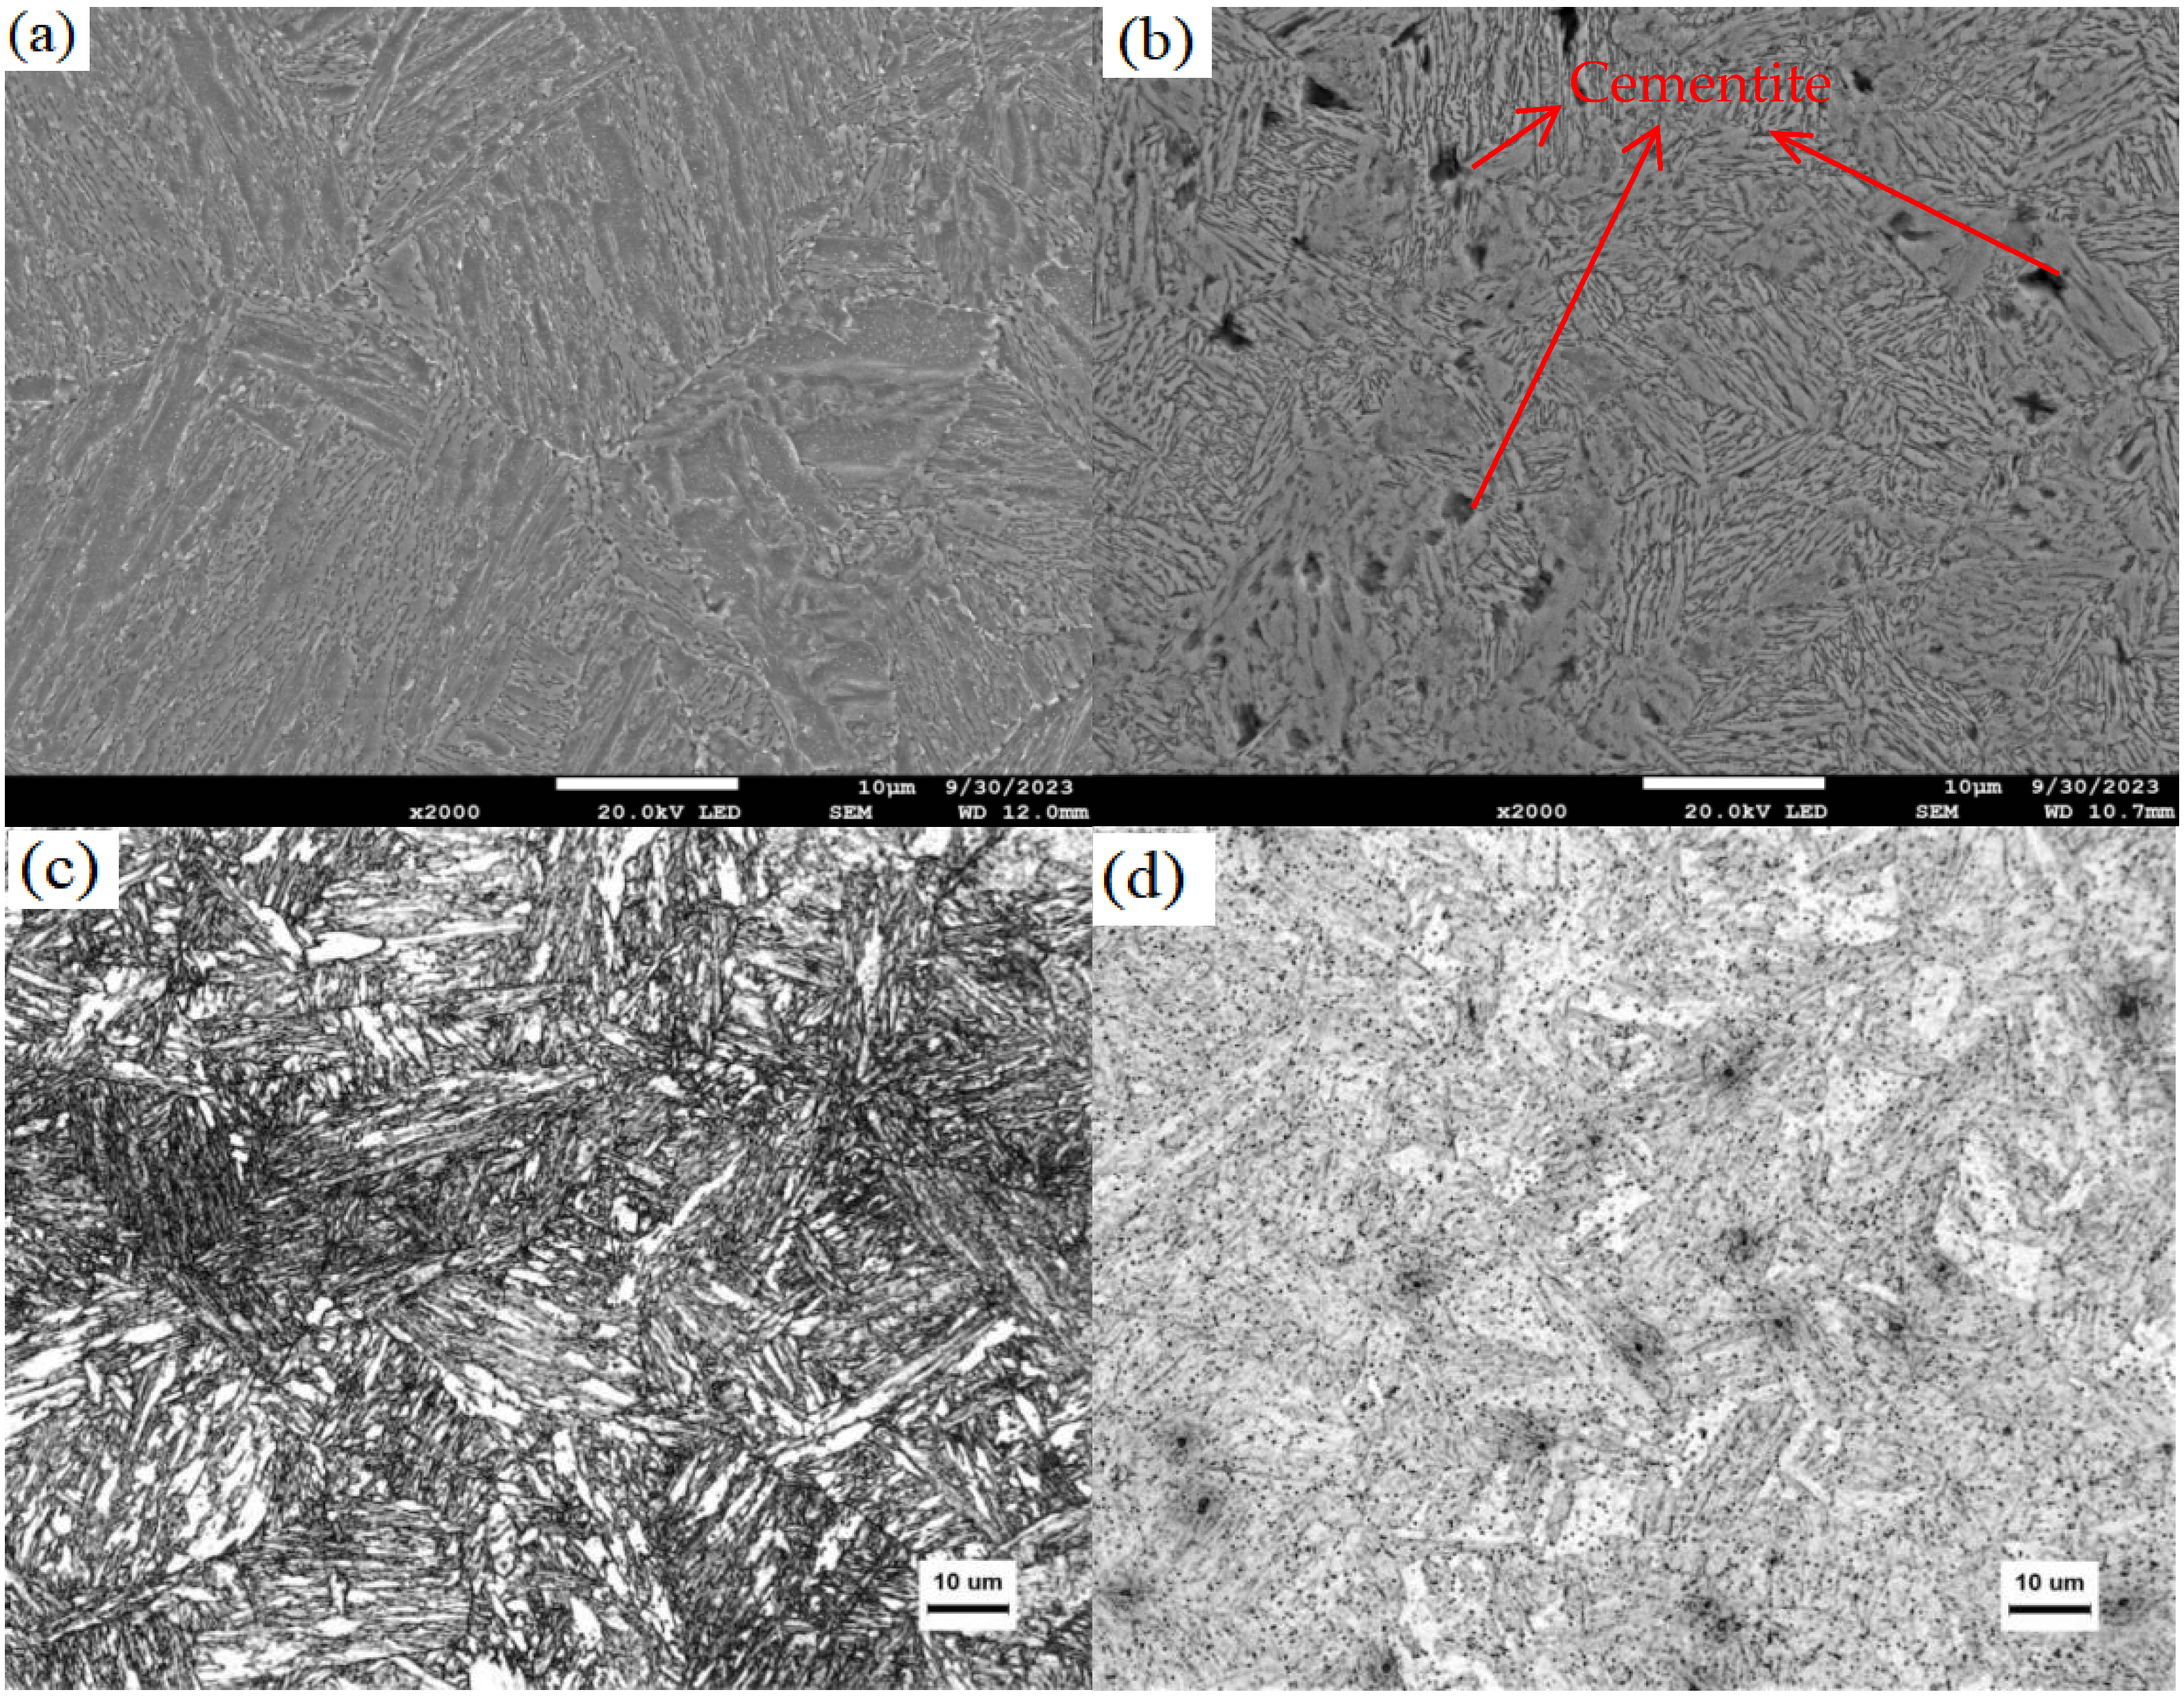
The microstructure of medium manganese steels has been extensively studied in detail [6,8,10]. Figure 4 shows the optical micrographs of 5MnA and 5MnT2 steels obtained in our experiment. The optical microstructure of these medium manganese steels is completely different from that of ordinary carbon steel with coarse α-ferrite grains. Their microstructure is extremely fine and is usually difficult to study using ordinary optical microscopes. Although the 5MnA steel was obtained through post-rolling air cooling, its microstructure is mainly composed of lamellar martensite (α′-Fe) with a high dislocation density, with the plate thickness ranging from 200 to 500 nm [56]. This is because the medium manganese steels have an extremely high hardenability [8,57]. The microstructure of 5MnT2 steel after intercritical annealing treatment still exhibits the characteristics of a lamellar structure. Numerous detailed studies have shown that it is mainly composed of lamellar-tempered martensite (or α-ferrite) and reversed γ-austenite, and the thickness of the lamellar martensite or austenite ranges from 50 to 600 nm [8,57,58]. The intricate and complex microstructures of medium manganese steels pose significant challenges for the microscopic analysis and determination of its austenite content.

5.2. Determination of the Js Values of 5Mn and 7Mn Steels by the VSM

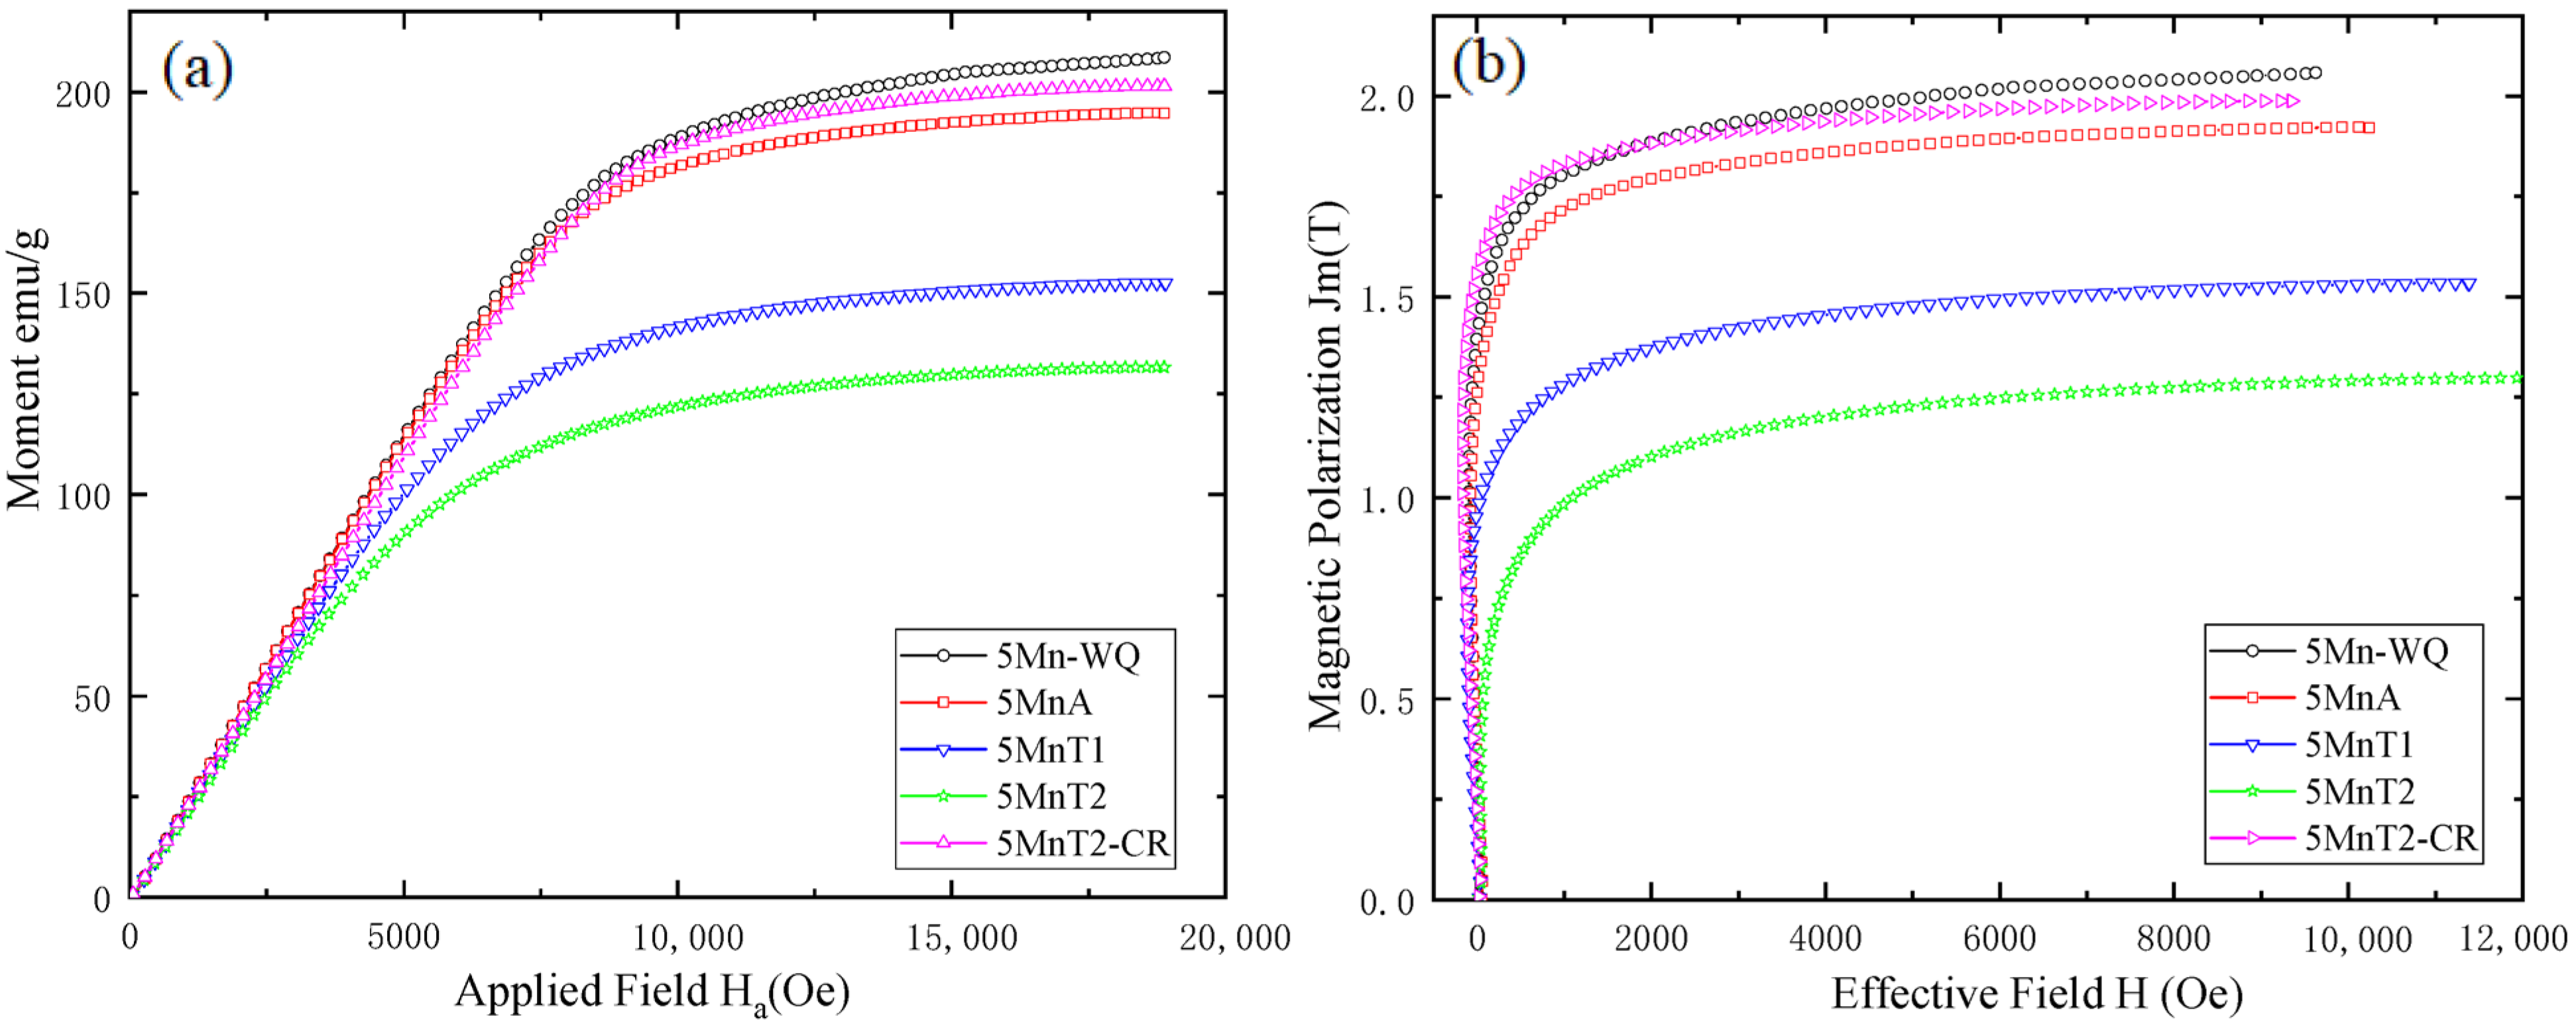
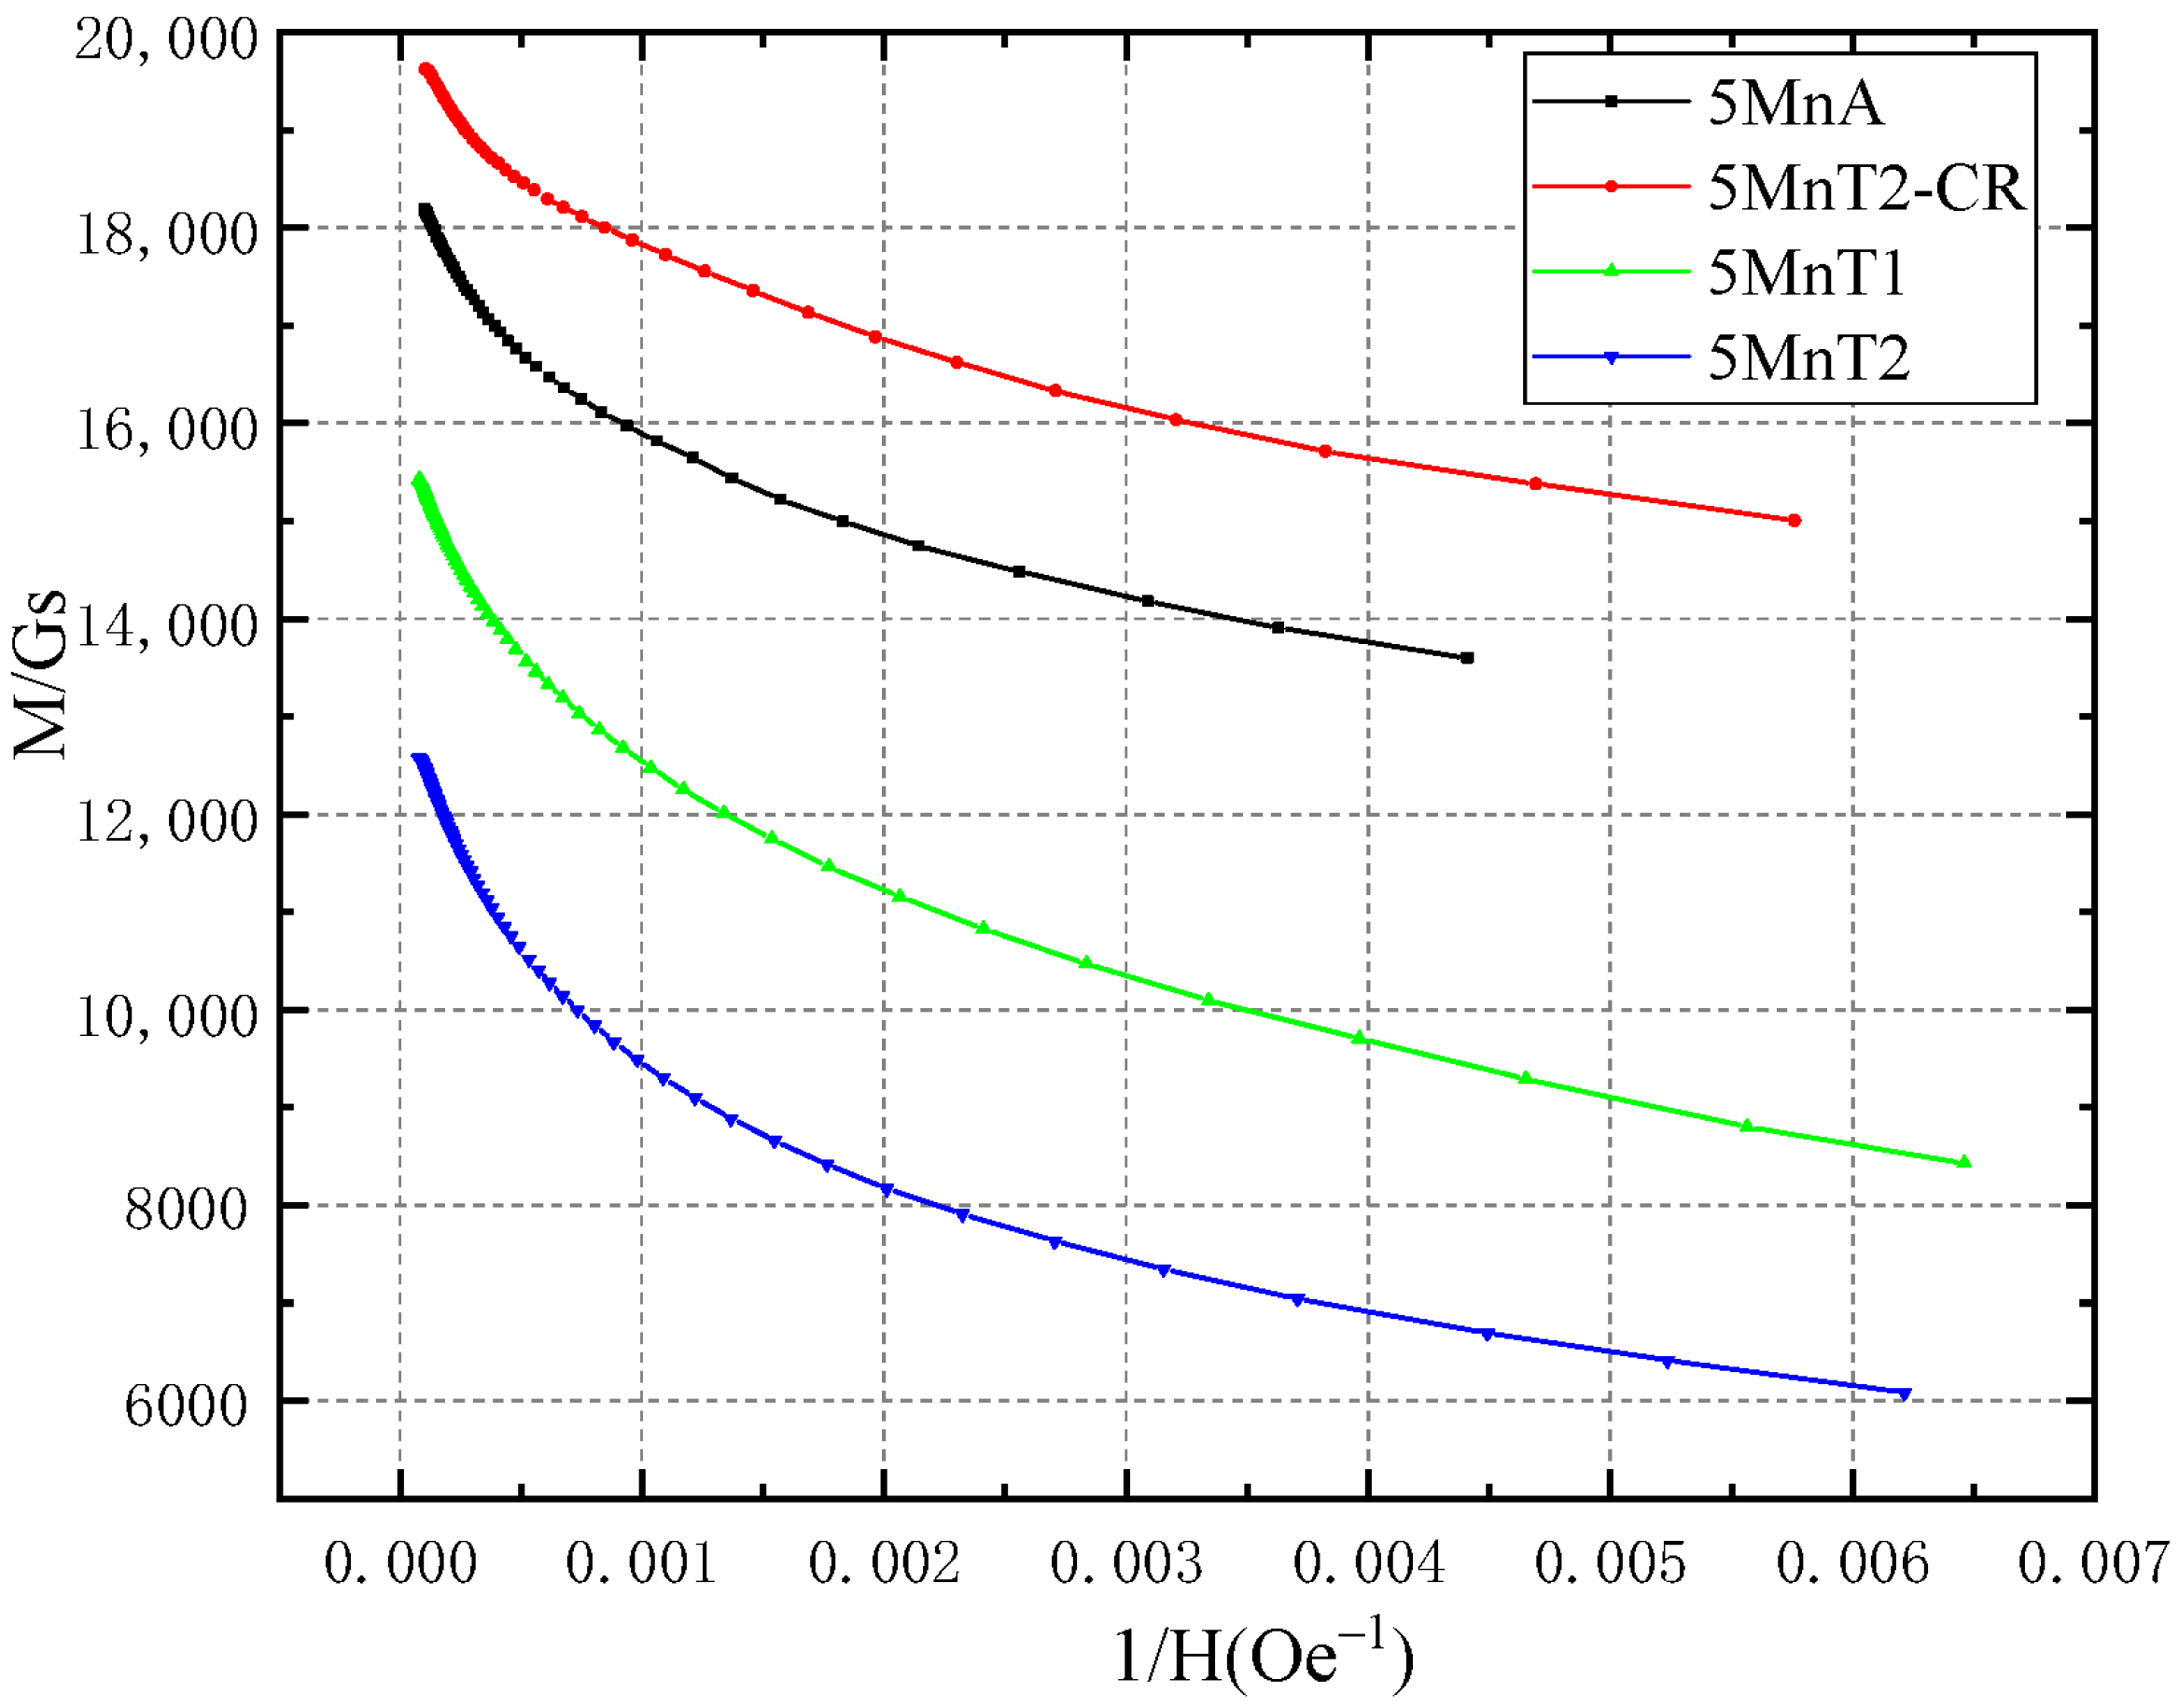
Figure 5a displays the directly measured magnetization curves of 5Mn steel in different process states as a function of the applied field Ha, obtained via VSM. These curves do not account for the sample’s demagnetizing field. It clearly reveals distinct magnetic characteristics for each state of the 5Mn steel, demonstrating the magnetic method’s effectiveness in detecting changes in austenite content. According to the measurements, the maximum mass magnetization σm values at RT for 5MnA, 5MnT1, 5MnT2, 5MnT2-CR, and 5Mn-WQ are 192.06 emu/g, 152.66 emu/g, 131.66 emu/g, 197.66 emu/g, and 206.6 emu/g, respectively. Calculating with a steel density of 7.85 g/cm3 yields corresponding Jm values of 1.90 T, 1.51 T, 1.30 T, 1.95 T, and 2.04 T. While Jm approaches the saturation magnetization Js, it is not equivalent; the true Ms (or Js) requires calculation using the LAS model, which depends on the true magnetization curve versus the effective field H. Figure 5b presents these true magnetization curves as a function of H after eliminating the geometric demagnetizing field (theoretically calculated in Appendix A). As Figure 5b shows, eliminating the demagnetization field steepens the true magnetization curves for all steels, allowing them to approach saturation magnetization at real external fields below 1000 Oe. The low-field magnetization curve exhibited unusual behavior, stemming from the inherent challenge of accurately calculating the demagnetization field for strongly magnetic materials. Obtaining an accurate low-field magnetization curve for steel via VSM proves particularly challenging. The saturation magnetization was ascertained utilizing both R. Grössinger’s graphical method [41] and the F-K method. Figure 6 distinctly displays the magnetization M versus 1/H curve for the 5Mn steel in different process states. This curve reveals a decidedly non-simple linear relationship, exhibiting linearity only at significantly high fields (>0.4 T). Notably, the Js fitting results varied considerably depending on the specific field range selected. The Js values obtained for 5MnA, 5MnT1, 5MnT2, and 5MnT2-CR via linear fitting within these high fields (>0.4 T) are 1.94 T, 1.57 T, 1.33 T, and 2.02 T, respectively—all slightly exceeding the corresponding Jm values of these steels.
Figure 7 illustrates the linear F-K relationship between magnetic reluctivity (H/M) and field strength H in 5Mn steel under various process states. Within the wide field range measured by VSM, the magnetic reluctivity and the effective external field H strictly conform to this linear F-K relation. Furthermore, the enlarged low-field observation graph (as shown in the upper left corner of Figure 7) demonstrates that, for all steels except 5MnT2 steel, this linear F-K relationship is maintained under a magnetic field of less than 1000 Oe. For 5MnT2 steel, when the magnetic field is below 500 Oe, there is a slight curvature in the linear F-K relationship, which is slightly different from the curves of other steels. This figure also demonstrates that most medium Mn steels follow the linear F-K relationship within a considerable range of magnetic fields. This provides a theoretical basis for the measurement of the Ms value using a permeameter under low magnetic fields. By linearly fitting the F-K curve above 1000 Oe, the intercept a and slope b are obtained, enabling the derivation of the Ms value. The linear fitting yielded R square values exceeding 0.9999. The measured Js values for 5MnA, 5MnT1, 5MnT2, 5MnT2-CR, and 5Mn-WQ are 1.95 T, 1.58 T, 1.34 T, 2.02 T, and 2.05 T, respectively. The Js values obtained through these two saturation magnetization fitting methods are almost exactly the same.
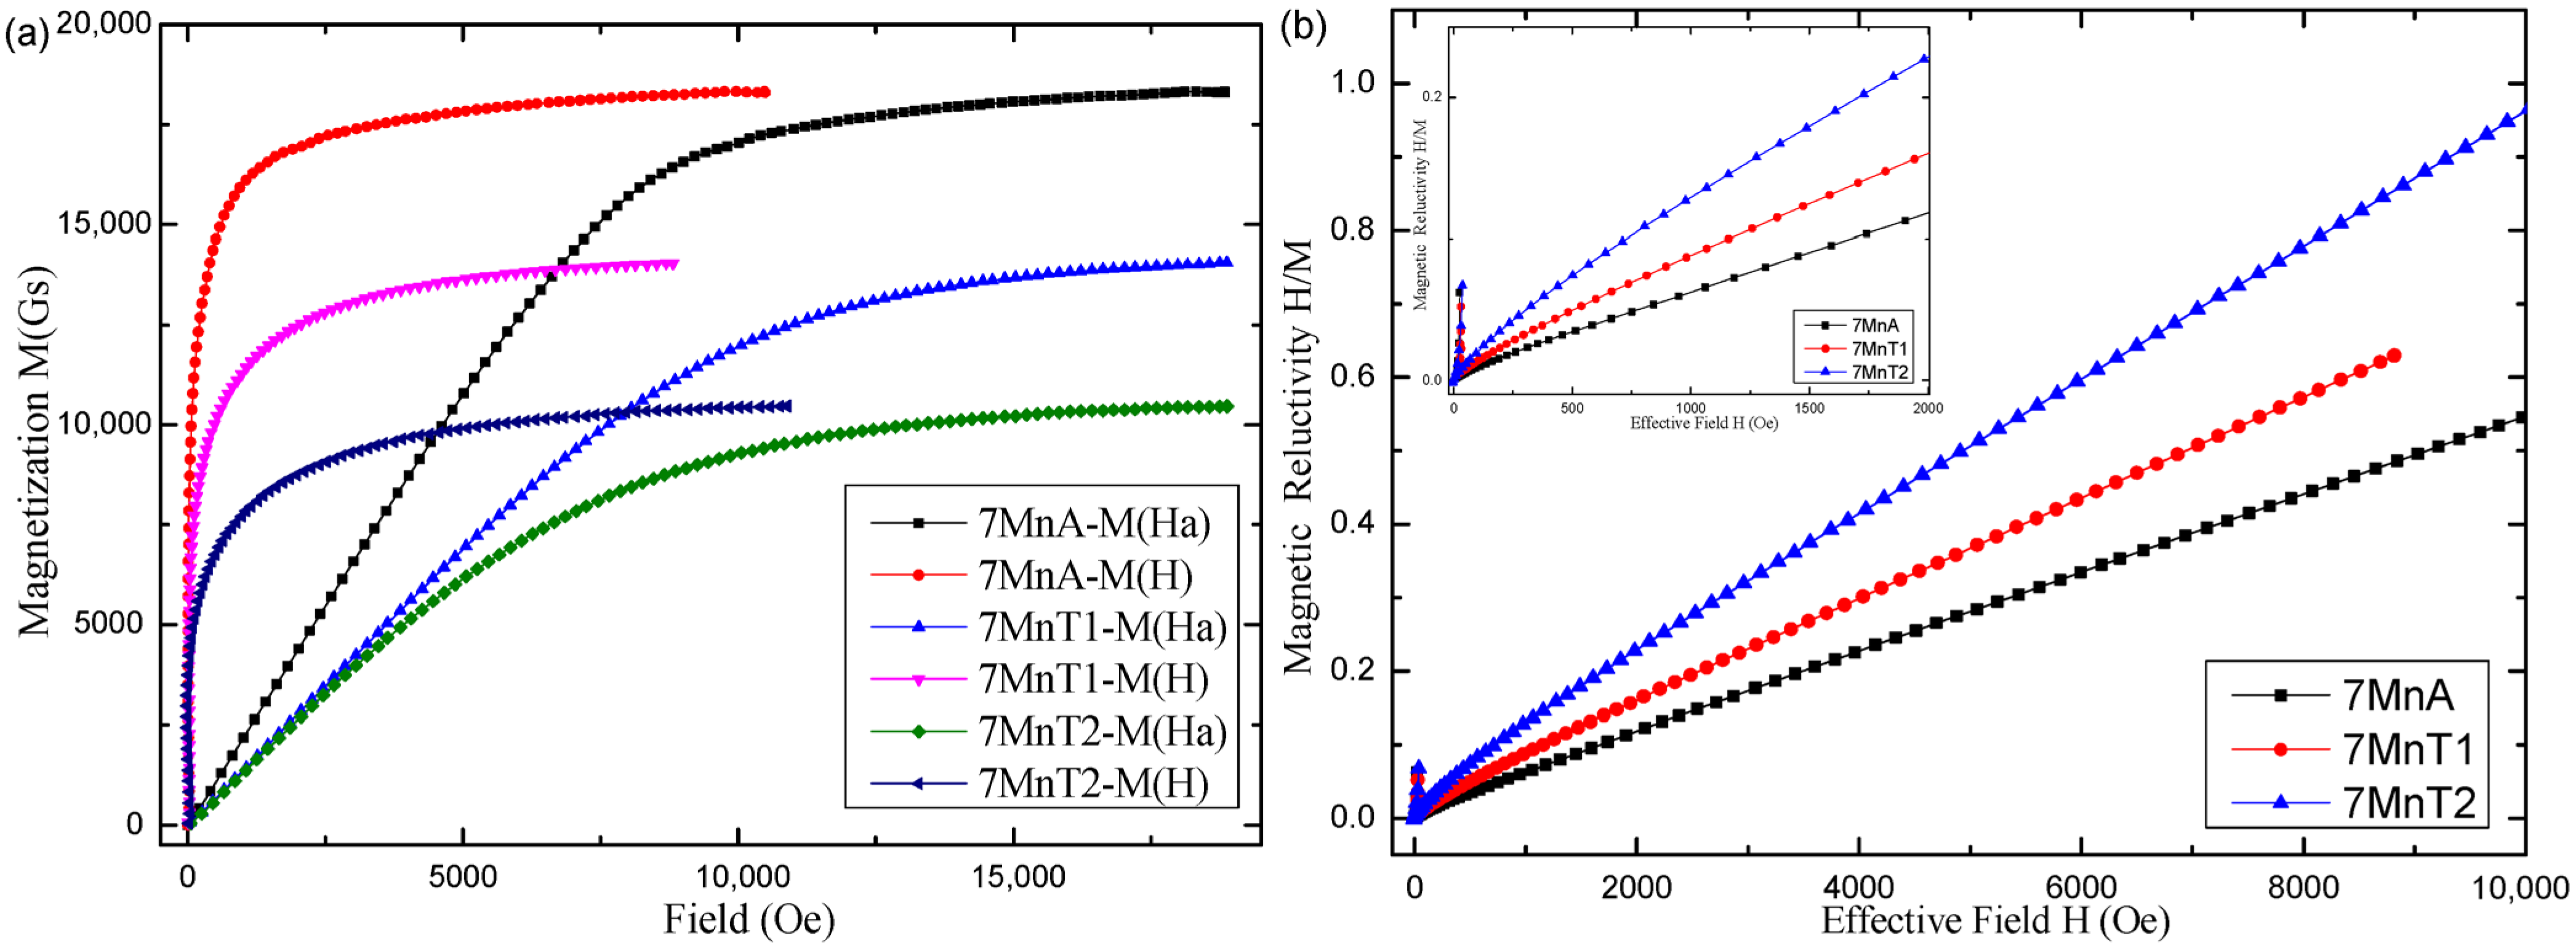
Meanwhile, the magnetization curves of 7Mn steel under different processing conditions were also measured using the VSM. Figure 8a shows the comparison of the magnetization curves for 7Mn steels in different process states measured using VSM, with and without the removal of the sample’s demagnetization field. The impact of removing the demagnetizing field on the shape of the magnetization curve is evident, and the magnetization curves for 7Mn steel in different process states also differ significantly. The Jm values for 7MnA, 7MnT1, and 7MnT were 1.82 T, 1.42 T, and 1.04 T, respectively, which are smaller than those of the corresponding states of 5Mn steel. When the austenite content is relatively high, the magnetization component of austenite in the VSM test should be corrected using Equation (6). Subsequently, the final magnetization data obtained can be employed to measure the Js value through the F-K relationship. Figure 8b displays the F-K linear relationship for the 7Mn steel after eliminating the demagnetization field and correcting for paramagnetic magnetization. This figure also confirms that the linear F-K relationship between magnetic reluctivity and field strength also holds valid for the 7Mn steel within the magnetic field range of 1000 to 15,000 Oe. However, the linear F-K relationship remains approximately valid for 7MnT1 and 7MnA steels below 1000 Oe, but it significantly deviates in the case of 7MnT2 steel. By performing a linear fitting of the F-K relationship within the range of 1000 to 10,000 Oe, the measured Js values were 1.83 T for 7MnA, 1.43 T for 7MnT1, and 1.07 T for 7MnT2. As can be seen from Figure 6 and Figure 7, when the austenite content in 5Mn and 7Mn steels is relatively high, the F-K relationship may deviate from linearity within the effective field range of less than 1000 Oe. Due to the meticulous and precise preparation process of the VSM samples in the VSM experiment, the TRIP effect in this process has been minimized to the greatest extent, so the measurement error of the Js values in the VSM method is within ±0.01 T. Although the VSM method provides accurate results for the saturation magnetization of medium manganese steels, the preparation process of VSM samples is extremely cumbersome, the testing time is prolonged, the demagnetization coefficient is difficult to calculate accurately, and it is still challenging to obtain precise low-field magnetization curves.

5.3. Determination of the Js Values of 5Mn and 7Mn Steels by the Permeameter

The magnetization curves measured via the permeameter can bypass the problem of complex demagnetization field, and can more accurately capture the magnetization characteristics of steels under low-to-medium magnetic fields. Figure 9a presents the magnetization curves for 5Mn steel in various process states measured by the AC permeameter with H-Coil. The maximum magnetic field strength of this permeameter reaches 35,000 A/m(≈440 Oe). These M-H curves can more clearly reflect the magnetization behavior of 5Mn steels under lower magnetic fields compared to the M-H curves measured with VSM (see Figure 5b). At a magnetic field strength of 400 Oe, the Jm values for 5MnA, 5MnT1, 5MnT2, 5MnT2-CR, and 5Mn-WQ are 1.75 T, 1.44 T, 1.06 T, 1.98 T, and 1.95 T, respectively—significantly lower than the VSM measurements. This discrepancy arises because the maximum field strength generated by the permeameter is much lower than that of the VSM (>10,000 Oe). Figure 9b illustrates the linear F-K relationship between the magnetic reluctivity and the field strength of 5Mn steels. Although there are significant differences in the microstructure and austenite content of 5Mn steel under different processing conditions, the F-K relationship of these 5Mn steels shows a clear linear relationship within a wide range of magnetic fields above the lowest magnetic resistance point. Linear fitting of the F-K relation slightly above this minimum reluctivity point yields intercept (a) and slope (b) values, enabling the derivation of Js and magnetic hardness A. Table 2 displays these linear fitting results, where R-squared values exceed 0.9999. The derived Js values for 5MnA, 5MnT1, 5MnT2, 5MnT2-CR, and 5Mn-WQ were 1.94 T, 1.56 T, 1.24 T, 2.04 T, and 2.07 T, respectively.
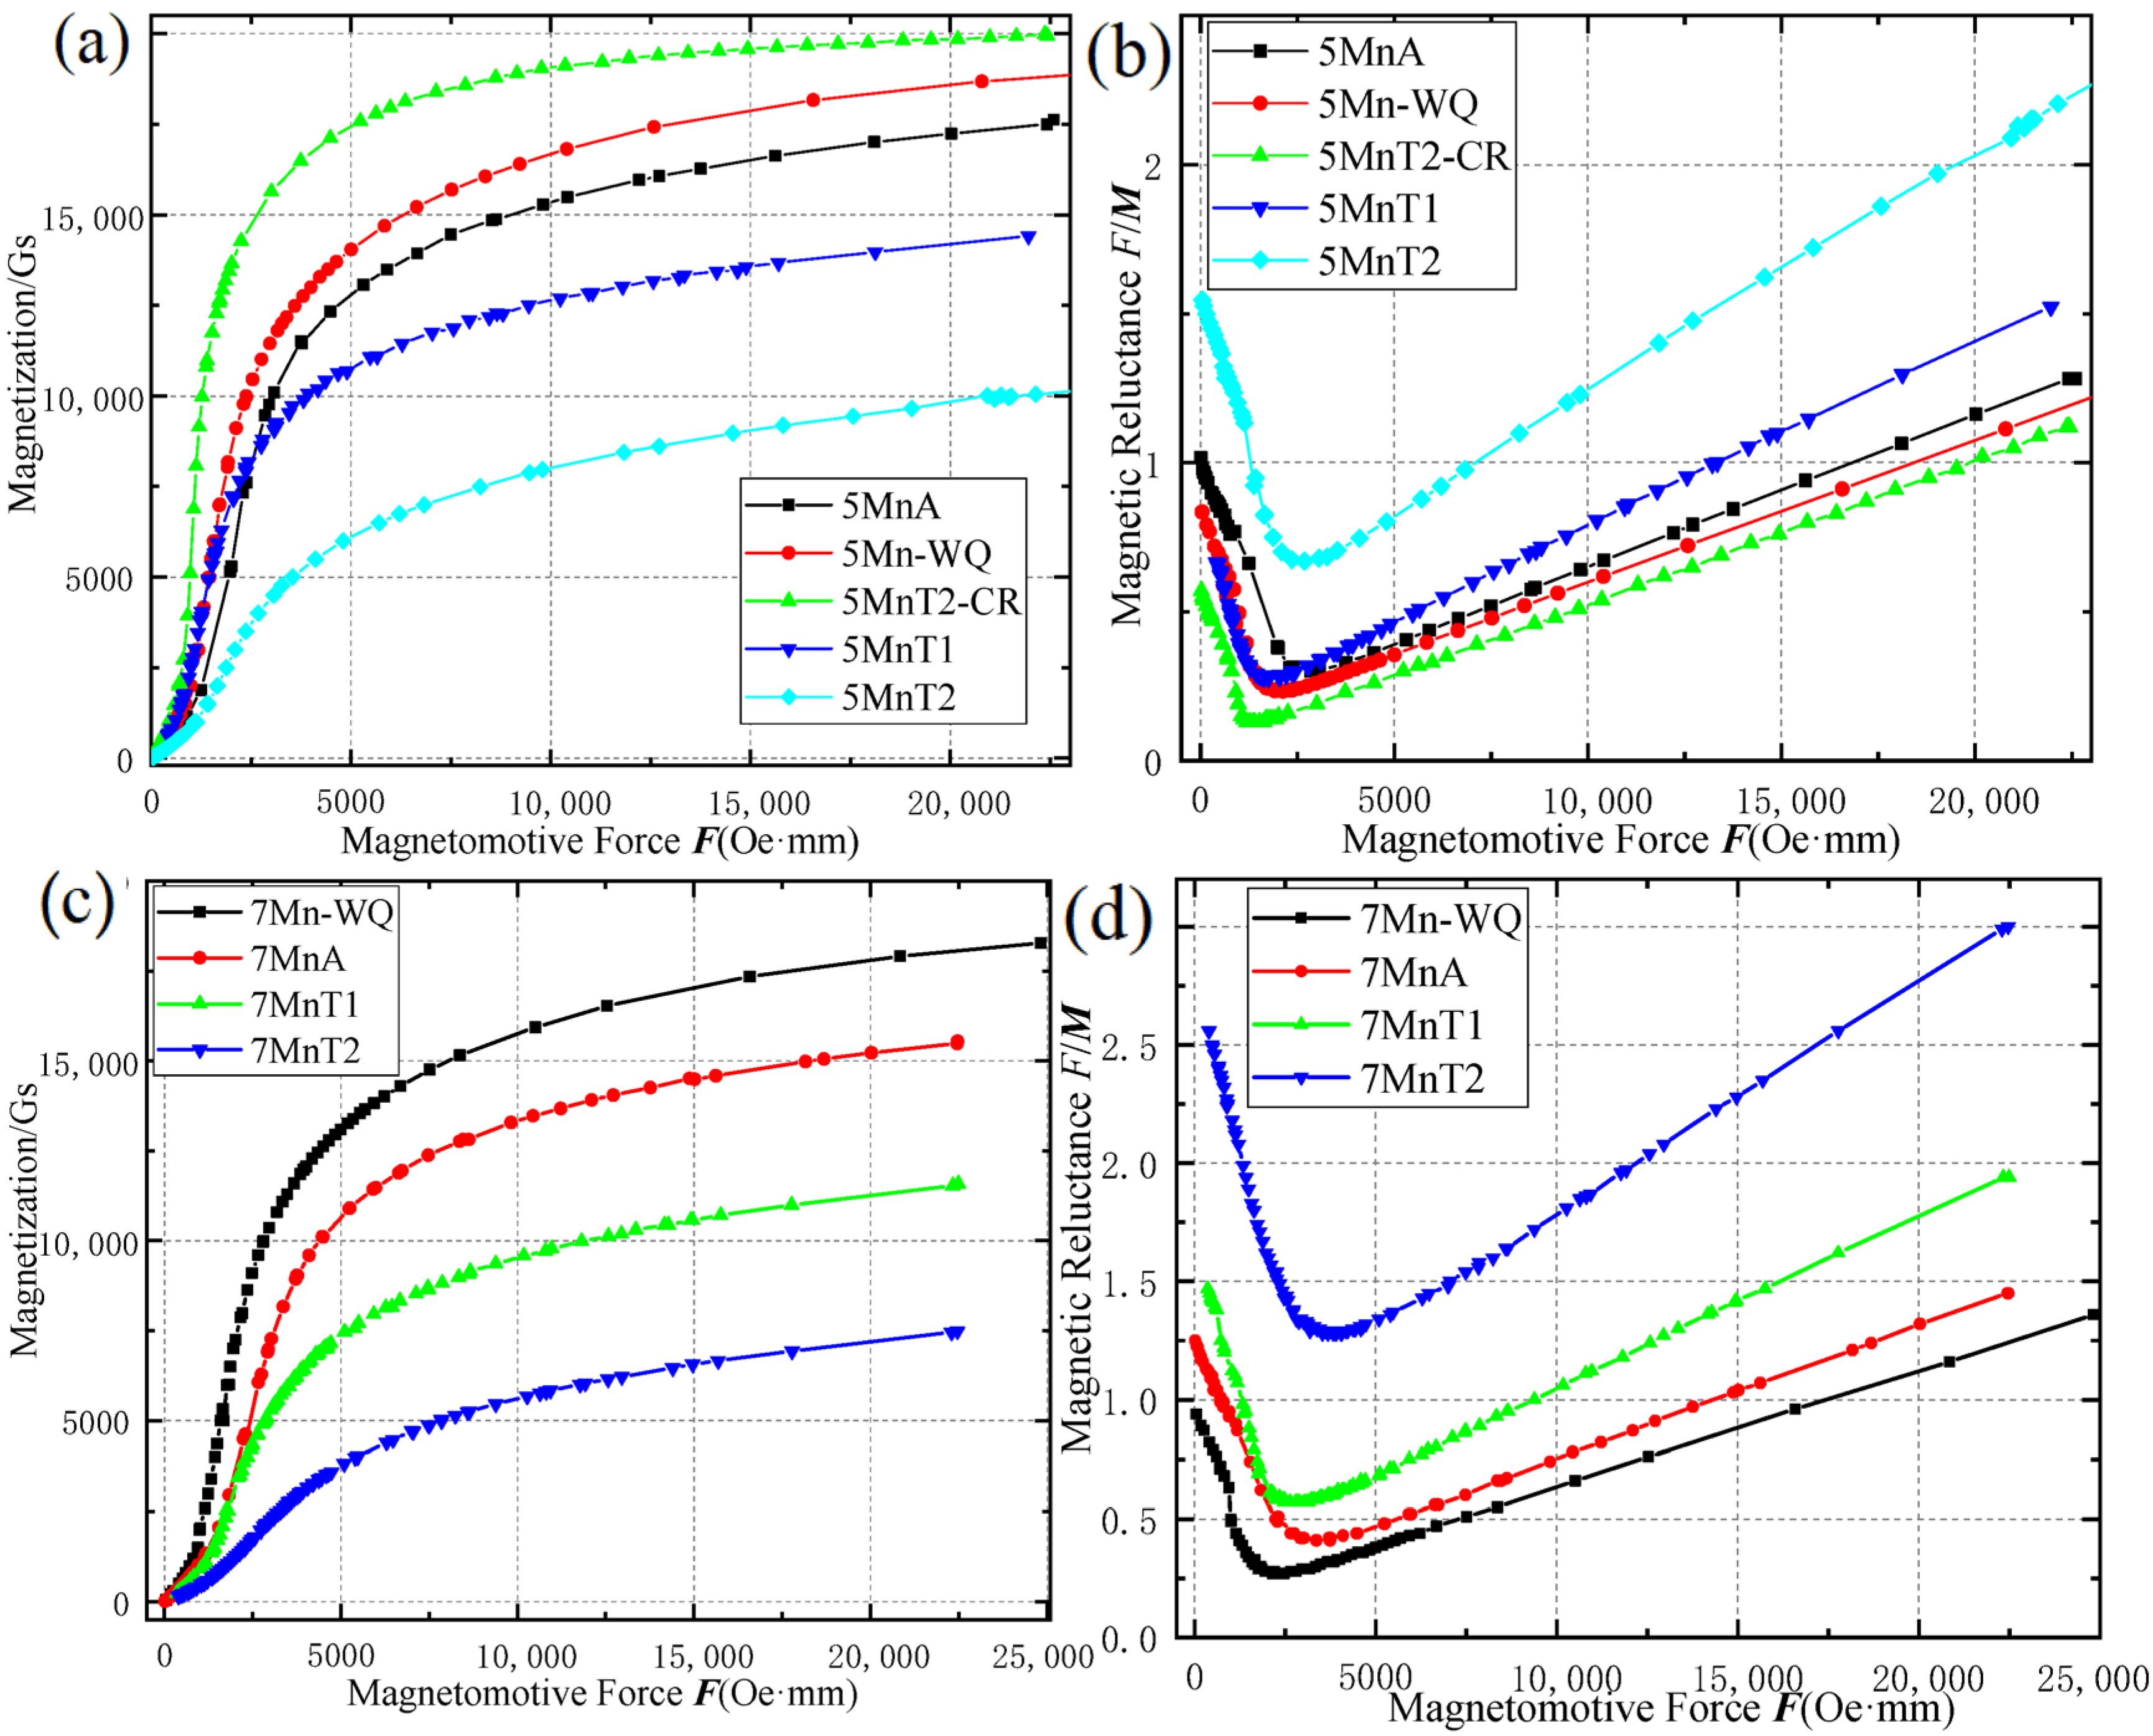
Most permeameters lack a dedicated H-measuring system, instead approximating the H value using a fixed, calibrated equivalent magnetic circuit length (Le). However, the Le value is inconsistent for multiphase steels with varying austenite content, and measuring it directly is an intricate procedure. Consequently, the magnetomotive force method is strongly recommended. Within the permeameter, magnetization directly corresponds to the magnetomotive force F and remains independent of any pre-set Le value. The resulting M-F curve serves as the constitutive curve for permeameter measurements, capturing the direct relationship between the true magnetizing current and the induced voltage while entirely circumventing the problematic measurement of the field H. Figure 10a illustrates the magnetization curves of 5Mn steels under different magnetomotive forces F. Obviously, the shape of the M-F curves of 5Mn steels is exactly the same as that of the conventional M-H curves (see Figure 9a).
Figure 10b depicts the relationship between magnetomotive forces and the total magnetic reluctances of 5Mn steels. As can be seen from Figure 10b, within the magnetic field range above the minimum magnetic reluctance values of 5Mn steels, there is a clear linear relationship between the total magnetic resistances and the magnetomotive forces of these 5Mn steels. This is consistent with the previous theoretical analysis (in Section 2.3). Linear fitting within this interval yields the intercept aLe and slope b, enabling the subsequent derivation of Ms. The linear fitting results are shown in Table 2. The R square of the linear fitting result is also more than 0.9999. The derived Js values for 5MnA, 5MnT1, 5MnT2, 5MnT2-CR, and 5Mn-WQ were 1.94 T, 1.57 T, 1.26T, 2.05 T, and 2.07 T, respectively, with a measurement error less than ±0.01 T. As shown in Table 2, the Js values of 5Mn steels determined by this method align perfectly with those from the F-K fitting method based on the M-H curves, yet it elegantly omits the measurement of H. The consistency of the measurement results from these two methods is due to the fact that, when the test sample’s magnetization nears saturation, its magnetic permeability drops sharply and becomes relatively stable, and thus the Le values of the test sample are also relatively stable. Therefore, the total magnetomotive force–total magnetic reluctance relationship in the circuit becomes equivalent to the magnetic field–magnetic reluctivity relationship intrinsic to the test sample. The magnetomotive force method, by eliminating the need to measure the intermediate variable H, offers a more accurate measurement technique that inherently reduces error. Consequently, it emerges as the preferred method. The test sample of the permeameter is a large bulk sheet sample, and its surface has been polished to remove the hardened layer. Therefore, the TRIP effect during the sample preparation process has much less of an impact on the measurement error of Js values compared to the “VSM” effect, and it can usually be ignored. However, during the permeameter’s measurement process, the eddy current effect and air flux compensation will impact its measurement accuracy. Considering these factors, its measurement error for Js values exceeds that of VSM, but the maximum measurement error will not exceed ±0.02T (without considering the relevant factors of the saturation magnetization fitting method).
Figure 10c shows the magnetization curves of the 7Mn steels in different process states, measured by the permeameter. The Jm values of 7Mn-WQ, 7MnA, 7MnT1, and 7MnT2 were 1.90 T, 1.56 T, 1.16 T, and 0.87 T, respectively. Figure 10d shows the relationship between the magnetic reluctances and the magnetomotive forces of 7Mn steels. It showed that the linear relationship between magnetomotive force and magnetic reluctance was also valid in the 7Mn steels. The same method was used for linear fitting, and the fitting results are also shown in Table 2. The obtained Js values of 7Mn-WQ, 7MnA, 7MnT1, and 7MnT2 were 2.02 T, 1.78 T, 1.37 T, and 1.02 T, respectively, which were much larger than the Jm values. This permeameter not only enables the rapid and simple measurement of the Js values of different steels, but also can simultaneously measure the magnetic hardness A values of these steels; the results are also shown in Table 2.

5.4. Comparison of Austenite Content of 5Mn and 7Mn Steels Measured by Different Methods

To determine the content of austenite in alloy steel by magnetic methods, it is necessary to know the Js value of the austenite-free sample with the same alloy composition. According to saturation magnetization measurements performed by Hiroshi Yamauchi et al. [50] on a fully α-phase Fe-Mn alloy fabricated via cold rolling and subsequently cooling in liquid helium for 10 h, the σm values of the 5.7% Mn and 8.4%Mn steel at 298 K under a 0.8 T field were 209.4 emu/g and 203.2 emu/g, respectively. Using a steel density of 7.85 g/cm3, the corresponding Jm values of these two steels were 2.06 T and 2.02 T at 298 K. The 5.7% Mn steel’s chemical composition is extremely similar to that of our experimental 5Mn steel, and its Jm value is highly consistent with that of the 5Mn-WQ steel we prepared. Therefore, the Js value of 5Mn-WQ steel can be regarded as the Js value of the austenite-free sample of 5Mn steel. The Js value of 7Mn-WQ steel determined by the permeameter was consistent with the measured Jm value of α-phase 8.4% Mn alloys from Hiroshi Yamauchi et al. [50], so it was set as the Js value of the austenite-free sample of 7Mn steel. According to these settings, the austenite content of 5Mn and 7Mn steels in different processing states could be calculated. Consider the measurement errors of the Js values for these two magnetic measurement methods; the measurement error of austenite content in the VSM method is ± 0.5%, while that of the permeameter method is ± 1%. Table 3 presents the Jm and Js values and austenite contents of 5Mn and 7Mn steels under different processing conditions, measured by two different magnetic measurement methods. As shown in Table 3, the permeameter method can easily distinguish the subtle changes in the austenite content of 5Mn and 7Mn steels under different processing conditions, which can offer a considerable convenience for the characterization of medium manganese steels.
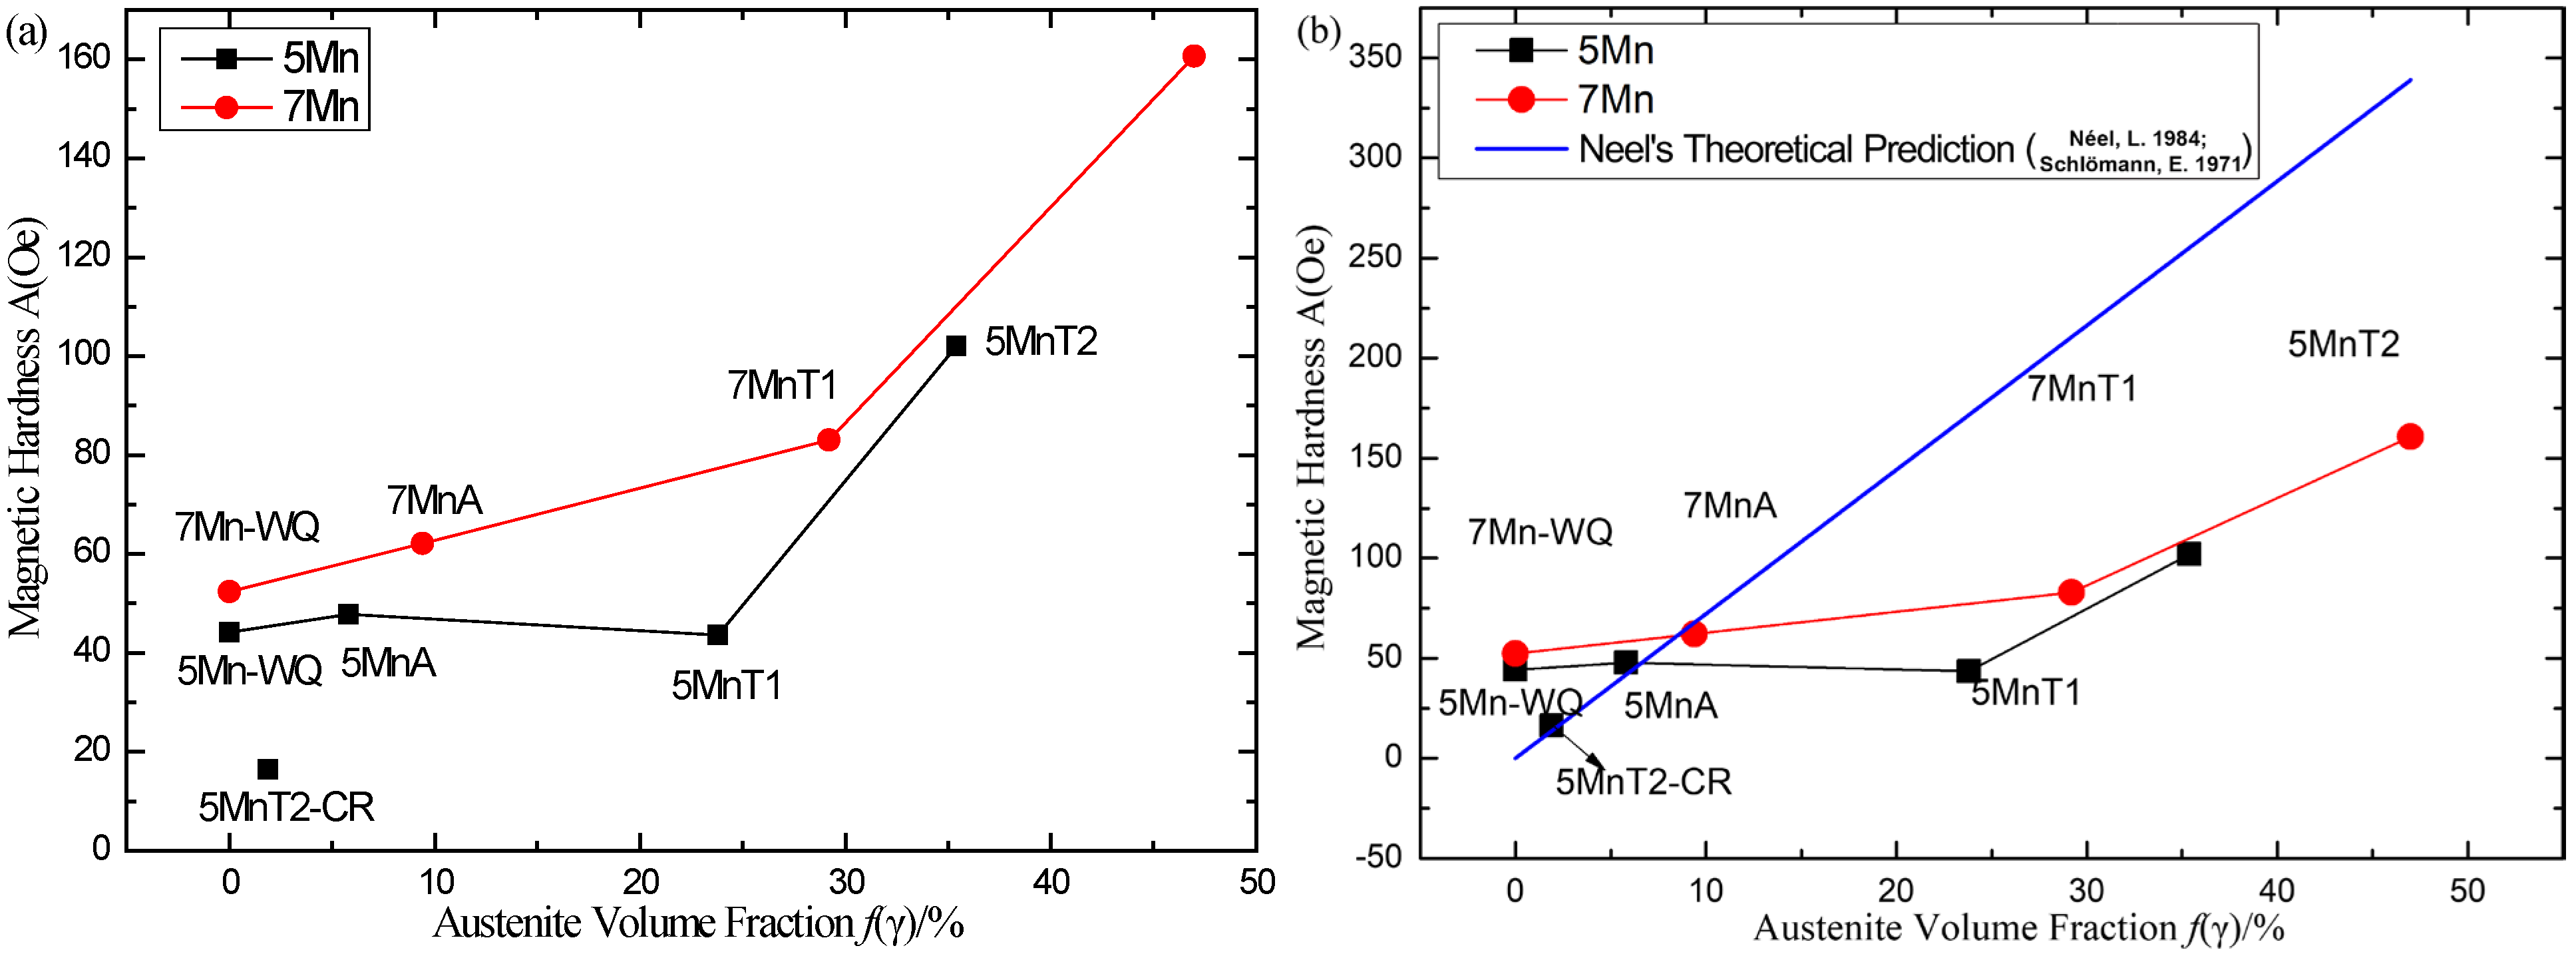
From the comparison of Js values and austenite contents for 5Mn and 7Mn steels determined via the permeameter method and the VSM method presented in Table 3, it can be seen that the results of these two magnetic methods have a high consistency, and the differences between their measurement results are not significant. Although the differences between the Jm values and the Js values of all 5Mn and 7Mn steels measured using the permeameter method are very significant, the Js values for all 5Mn and 7Mn steels derived by fitting the F-K relationship using these two distinct magnetic methods remain remarkably similar. For 5Mn steels under different processing conditions, the measured Js values and austenite contents for 5Mn steels from these two magnetic methods align closely with the VSM results—except for 5MnT2 steel. The Js values of 5MnT2 steel measured using VSM are slightly higher than those measured by the permeameter. For 7Mn steels under various processing conditions, the Js values of 7Mn steels determined using the permeameter method were also always lower than the corresponding Js values obtained via the VSM. Under the same processing conditions, the difference of Js values of 7Mn steels measured using the two magnetic methods is much greater than that of 5Mn steels. For instance, the difference in the Js values of 7MnT1 steel measured using VSM and the permeameter is 0.05T, while for 5MnT1 steel it is only 0.01T. From the perspective of measuring magnetic hardness A, the steel with higher magnetic hardness shows more significant differences in the Js values measured using these two magnetic methods, as well as in the content of austenite.
We have measured the Js values of a large number of medium Mn steels with different amounts of austenite, utilizing both the permeameter and VSM techniques. Due to space limitations, these measurement results are not presented here. The results showed that, in steels with a relatively lower amount of austenite (<30%), the Js values measured by the permeameter and the VSM were highly consistent. However, when the austenite content within the steel rises, a marked divergence emerges between the measurement results obtained from the permeameter and the VSM. In general, the Js values measured by the permeameter are lower than those of the VSM method, resulting in the measured austenite content being generally higher than that of the VSM method. VSM is a traditional instrument used for measuring saturation magnetization. After eliminating the influencing factors of the TRIP effect during the VSM sample preparation process, the Js values measured by this instrument should be accurate. The Js values determined using the permeameter method may have measurement errors under certain special conditions. The causes of these measurement errors will be discussed in detail in the following section.
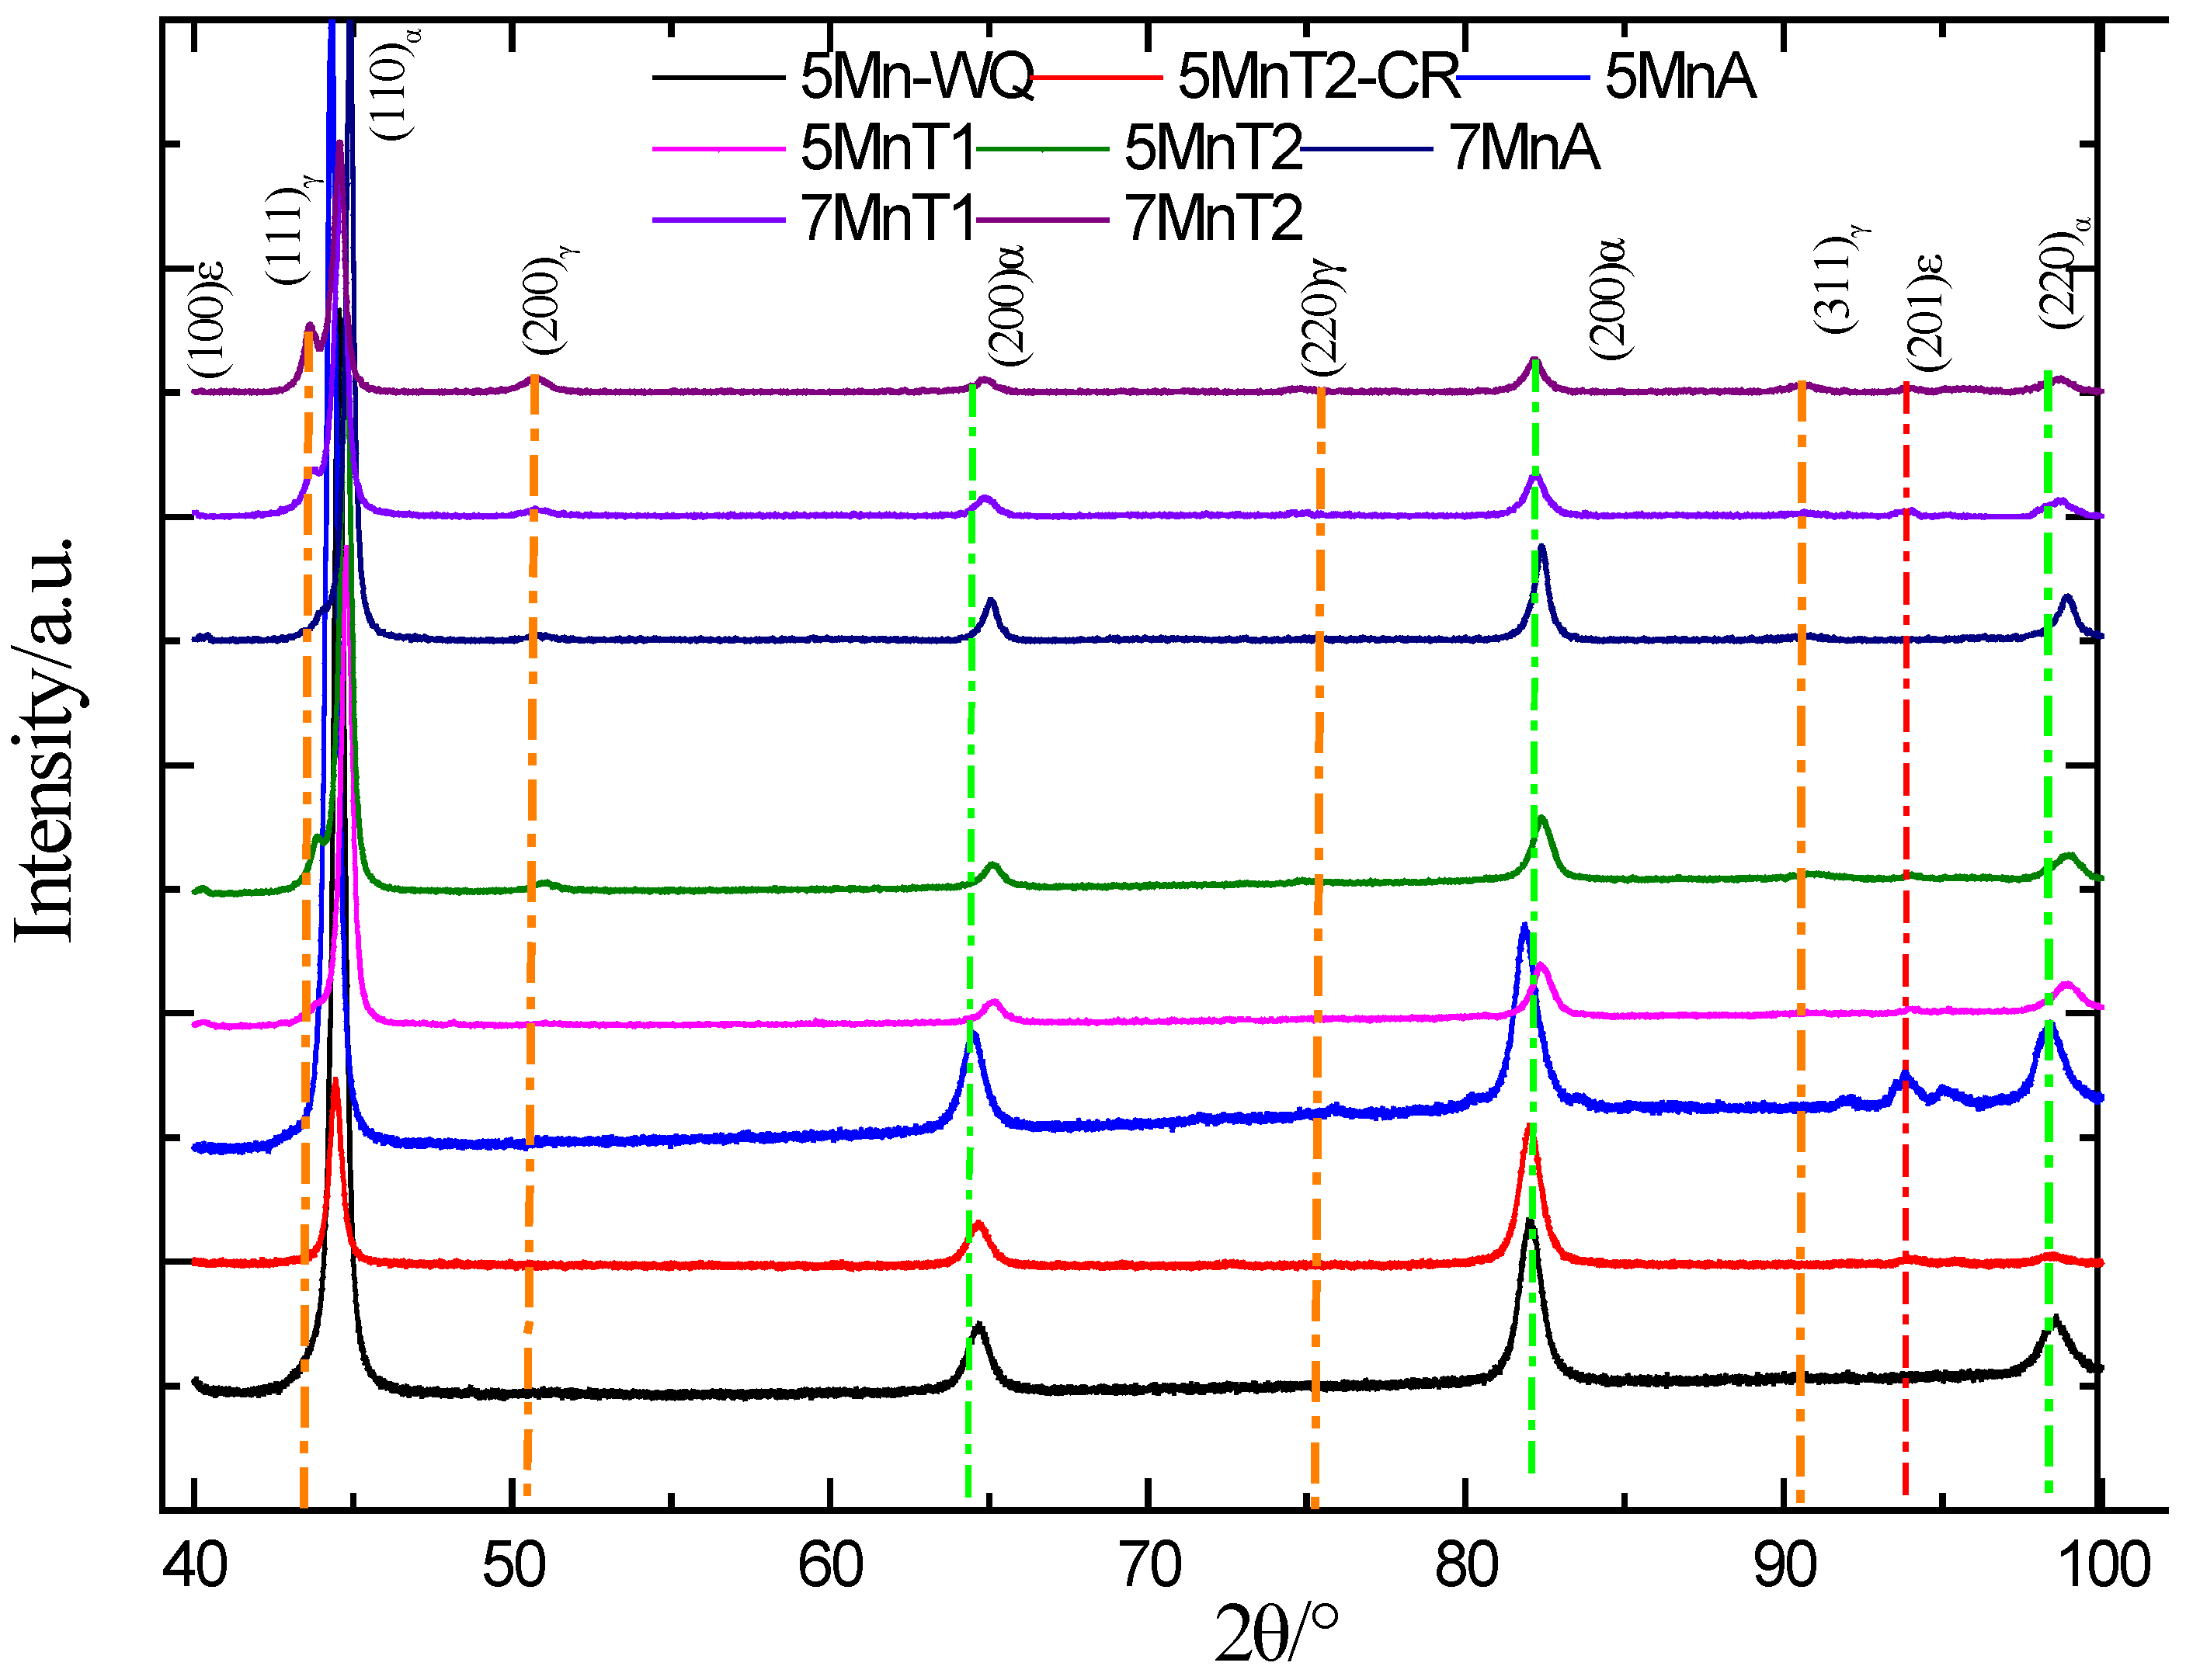
The austenite content of 5Mn and 7Mn steels in different process states was also measured using the XRD method. Figure 11 presents the X-ray diffractograms for 5Mn and 7Mn steels in different process states across the 40–100° diffraction angle range. The volume fraction of retained austenite f(γ) was estimated from the integrated intensity of the monitored austenite and ferrite peaks according to the formula in Appendix B. The measurement results of 5Mn and 7Mn steels from the XRD method and two magnetic methods are also presented in Table 3. Using the median of the diffraction angles 2θ of the three diffraction peaks (200)α, (211)α, and (220)α of the α-Fe, the mean lattice parameter a of bcc-Fe was also calculated based on the formula in Appendix B, and the calculated results are presented in Table 3. By comparing the measurement results of the austenite content of 5Mn and 7Mn steels under different processing conditions using the magnetic method and XRD method, it can be clearly observed that the content of austenite measured by the magnetic method is always higher than that indicated by the XRD results. The permeameter method shows the highest austenite content, followed by VSM, and the lowest is XRD. The permeameter method is very sensitive for the detection of trace austenite content. From the diffractograms of the 5Mn and 7Mn steels, the (200)γ, (220)γ, and (311)γ austenite diffraction peaks of 5Mn-WQ, 5MnA, 7MnA, and 5MnT2-CR steel are difficult to be identified visually, so the austenite content of these three steels are all 0% according to the XRD method. However, their magnetization curves and Js values measured by the permeameter method show significant differences, indicating that their microstructure and austenite content are also completely different. In XRD measurements, the diffraction peaks from trace austenite and other phases are frequently drowned out by background noise, making it difficult to distinguish and quantify such trace austenite variations. This limitation leads to a significant error—up to 1–5%—in quantifying the austenite content [18,22]. This also demonstrates the permeameter method’s markedly greater sensitivity to trace austenite content changes compared to XRD, making it far more suitable for measuring these minute quantities.
As shown in Table 3, the austenite content of 5MnA, 5MnT1, and 5MnT2 steel measured using the XRD method were 0%, 16.2%, and 29.6%, respectively, while the corresponding results measured using the VSM method were 5.8%, 23.8%, and 35.4%, respectively. The XRD results of these steels were, respectively, 5.8%, 7.6%, and 5.8% lower than the results obtained using the VSM method. This phenomenon is also the same for 7Mn steels in different processing states. That is, the austenite content measured by X-ray diffraction is always much lower than that measured by the magnetic method, and this difference exceeds the range that can be explained by the measurement error of XRD. By carefully observing the X-ray diffractograms, it can be discovered that the 5MnA, 5MnT1, and 5MnT2 steels have a weak diffraction peak near 93~95°, which neither belongs to the diffraction peak of γ-Fe nor belongs to the diffraction peak of α-Fe. After consulting the relevant data, this diffraction peak is the (201)ε peak of the ε-martensite phase [59,60]; the weak (100) peak of the ε-martensite phase near 40° can confirm this assumption. Specifically, the (201)ε diffraction peak of 5MnA steel is particularly prominent. This is a transitional phase that occurs during the austenite γ→ε→α′ martensitic transformation in high-manganese (Mn > 13%) steels [36,61], where the fcc(γ)→hcp(ε) martensitic transformation proceeds via the movement of the a/6<112> Shockley partial dislocation across every second austenite plane [61]. ε-martensite is a closely packed hexagonal structure phase (hcp), which is an antiferromagnetic phase [59]. The presence of ε-martensite inevitably leads to a decrease in the collective saturation magnetization Ms(c) and ultimately results in a higher content of austenite measured with the magnetic method than that measured with the XRD method. To assess the content of ε-martensite, we treat the (201)ε diffraction peak as the offset of the (311) γ diffraction peak and roughly calculate its content using the austenite content formula in Appendix B. After estimation, the ε-martensite content in 5MnA, 5MnT1, and 5MnT2 steel reached 4.1%, 7.9%, and 4.9%, respectively. We also used the same method to calculate the ε-martensite contents of 7MnA, 7MnT1, and 7MnT2, which were 4.1%, 7.9%, and 4.5%, respectively. The formation of ε-martensite may be due to the γ→ε transformation of low-stability austenite during the air cooling process after hot rolling or intercritical annealing. As shown in Table 3, the total volume fraction of γ-austenite and ε-martensite in 5Mn and 7Mn steels is more consistent with the “austenite content” determined using the two magnetic methods. This also confirms the theory described in Section 2.1: the “austenite content” determined using the magnetic method is actually a collective content of all non-magnetic phases, and not merely the actual austenite content. Of course, if there are other non-magnetic phases (such as inclusions) in these 5Mn steels, then they will inevitably lead to a decrease in the saturation magnetization, thereby causing them to be incorrectly identified as additional austenite phases. Therefore, the measured austenite content from the XRD method was always lower than that measured using the magnetic method. This also demonstrates the drawback of the magnetic method (both the permeameter and the VSM method) in determining austenite, which is that it is difficult to distinguish the specific contents of various non-magnetic phases.

6. Discussion

The permeameter method employs the linear F-K relationship, an empirical law that describes the linear dependence of H/M on H in fields significantly exceeding the coercive field. By fitting low-field (100–1500 Oe) magnetization data to this relationship, Mₛ can be derived from the slope, thus eliminating the need for high-field saturation. Compared with the determination of austenite content using the XRD method and VSM method, it has obvious advantages in terms of the simplicity of sample preparation, the operational simplicity, non-destructiveness, and rapidity of the measurement process, as well as the sensitivity, high efficiency, repeatability, and stability of the measurement results, making it particularly suitable for the quantitative determination of austenite in steels in industry. Not taking into account the common shortcomings of the magnetic method in determining the austenite content in multiphase steels, numerous previous experiments have confirmed that the permeameter method and the VSM method have an excellent consistency in measuring the austenite content of medium manganese steels in most cases. However, the measurement results of the two methods show significant differences in some cases. These differences do not stem from measurement errors of the instruments, but rather from the chosen LAS model—the F-K relationship. The physical basis of the linear F-K relationship and its applicability to modern advanced multiphase steels remain unclear. This ambiguity raises critical questions: Are the Jₛvalues obtained from low-field permeameter measurements reliable? Under what range of magnetic fields does the F-K relationship hold? Can it be universally extended to all types of multiphase steels?

6.1. Theoretical Explanation of the Experimental Results

As is vividly depicted in Figure 4, medium manganese steels have an exceptionally intricate and fine lath microstructure, strikingly distinct from conventional carbon and silicon steels with micro-scale (>1 μm) coarse ferrite grains. The thickness of this lath ferrite typically measures less than 1 μm, commonly falling within the 50~600 nm range [58], classifying it as a sub-micron scale microstructure. After undergoing intercritical annealing, these medium manganese steels form a complex microstructure, consisting of alternating layers of ferromagnetic α-ferrite laths and non-magnetic γ-austenite laths, which is more similar to a heterogeneous magnetic hysteresis alloy rather than ordinary steel. According to the ferromagnetic domain theory for soft steel, the interiors of coarse α-ferrite grains typically divide into numerous magnetic domains, which are separated by domain walls with a theoretical thickness of 20–60 nm [35]. The sub-micron-sized α-ferrite and γ-austenite structures within the medium manganese steel will inevitably affect the formation of internal domain walls and the magnetic structure, thereby causing changes in its magnetic properties. The saturation magnetization law it follows should be significantly different from that of ordinary steel.
The Taylor expansion of Lamont’s law (or F-K formula) can be converted to the following form:
M = M s ( 1 A H ) 1 + A H 2 + A H 4 +
where A represents magnetic hardness; it is generally less than 10 Oe for plain carbon steels with a body-centered cubic (bcc) structure. When the range of the measured magnetic field satisfies the condition A/H ≤ 1/10, the (A/H)2 term and other higher-order terms can be neglected. The F-K relationship approximately describes the A/H approach law at high fields, and this approach law is supported by many studies. Brown’s research [62,63] indicated that the A/H approach law under high fields may be related to crystal defects such as dislocations, which cause the spin direction of the local regions around the dislocations to deviate from the spontaneous magnetization direction of the internal crystal. In air-cooled, water-quenched, and cold-rolled medium Mn steels, the A/H approach law can be attributed to the presence of a large number of dislocations within the microstructure, as explained by Brown. For example, the air-cooled 5MnA and water-quenched 5Mn-WQ steels have a higher magnetic hardness A value than the cold-rolled 5Mn steel (see Table 2), which might be due to the fact that quenched martensitic steels typically have a higher dislocation density than cold-rolled steel. The XRD results also confirm this point. The lattice parameter a of α-Fe and background noise of cold-rolled 5Mn steel are also lower than those of quenched 5Mn steels (see Table 3), which means that the former has more perfect crystals and a lower dislocation density than the latter.
Néel’s saturation theory for inhomogeneous magnetic materials may be the closest theory that can be used to describe the saturation magnetization process of medium Mn steels; the observed A/H approach law can be attributed to the presence of a non-magnetic austenite microstructure [40,64]. Louis Néel first discovered that the A/H approach law might be associated with the presence of microcavities or non-magnetic phases, which can cause the generation of complex stray field distributions in the surrounding space. These stray fields cause a local misalignment of the saturation magnetization vector of the ferromagnetic phase relative to the external field direction and reduce the projection of the magnetization vector on the field direction by an amount that depends on the field strength. Based on the simplified assumption that there are irregularly distributed spherical cavities or non-magnetic phases inside magnetic materials, he derived a more complex LAS formula for inhomogeneous ferromagnetic materials, which can be expressed as follows:
M = M s ( c ) 1 f 2 ( 1 f ) F ( ρ )
where Ms(c) is the average saturation magnetization of steel with the non-magnetic phase, Ms(c) = (1 − f )Ms(α); Ms(α) is the saturation magnetization of α-ferrite; and f is the effective volume fraction of non-magnetic phases or cavities. F(ρ) is a function related to the relative permeability (μr); ρ = H/Ms(c) = 1/(μr − 1), which is also defined as “magnetic reluctivity” in the field of electricity. The function F(ρ) behaves as ρ−2 for ρ > 1, but for an intermediate field range (0.1 ≤ ρ ≤2) it varies approximately as ρ−1. Néel’s theory actually indicated that the law of approaching saturation is in the form of 1/H at the intermediate field range (H = 0.1~2 Ms), and is in the form of 1/H2 when the field H > Ms. Under the low field (H = 0.1~2 Ms), Equation (12) can be converted to the familiar A/H approach law: M = Ms(c)(1-A/H), where A = 0.035 Ms(α) f, and the magnetic hardness A is proportional to the volume fraction of the non-magnetic phases. Figure 12a shows the relationship between the actual measured magnetic hardness and the austenite volume fraction in 5Mn and 7Mn steels. It is evident that the measured A values increase as the volume fraction of austenite rises. This is consistent with the trend predicted by Néel’s theory. This also confirms that the high magnetic hardness of medium Mn steel containing austenite should be attributed to the stray magnetic fields generated by the non-magnetic phases within it.
According to Néel’s saturation theory for inhomogeneous magnetic materials containing non-magnetic phases, using the austenite content of 5Mn and7Mn steels measured with VSM as our variable, we calculated the theoretical predicted magnetic hardnesses under different austenite volume fractions. Figure 12b contrasts the actual measured magnetic hardness of 5Mn and 7Mn steels with predictions derived from Néel’s theory across different austenite volume fractions. As can be seen from the figure, when the austenite content of 5Mn and 7Mn steel is relatively low, there is a linear relationship between the actual magnetic hardness and the austenite content, which is consistent with Néel’s theoretical prediction. However, when the austenite content is relatively high, the predicted magnetic hardness results significantly deviate from the measured values; the predicted magnetic hardness values are higher than the actual values. Néel’s theory is not accurate in its quantitative explanation of magnetic hardness. Néel’s theory is derived based on an approximate model that assumes magnetic materials contain a small amount of uniformly distributed spherical non-magnetic inclusions or voids. The non-magnetic austenite present in medium manganese steel does not conform to the approximate assumptions in Néel’s theory, inevitably leading to prediction errors. Ernst Schlömann [64] pointed out that the approach saturation law for inhomogeneous ferromagnetic materials depends quite strongly on the shape of the non-magnetic inclusions; spherical inclusions conform to Néel’s theory, while layer-like inclusions deviate significantly from Néel’s theory. Upon examining the microstructure of the 5Mn steels depicted in Figure 4, it becomes evident that the austenite morphology does not conform to the spherical shape postulated by Néel’s theory. So, the disparity between the predicted and experimental outcomes for magnetic hardness can be attributed to the irregular shape and distribution of the austenite phases. Néel’s and Schlömann’s theories provide a reasonable qualitative explanation for the high magnetic hardness results in medium Mn steels.
In conclusion, medium Mn steels are actually inhomogeneous ferromagnetic materials that contain various inhomogeneities in microstructure, such as austenite, non-magnetic phases, dislocations, microstresses, grain boundaries, phase boundaries, and so forth. The A/H term in the LAS formula, which is attributed to the inhomogeneity of the internal nano-scale microstructure, dominates the approach law to saturation magnetization in these complex ferromagnetic steels. Conversely, due to the low crystal anisotropy constant of α-ferrite, the B/H2 term, which is typically associated with crystal anisotropy, is not significant at low fields and can be ignored in these steels. The F-K relationship approximately describes the A/H approach law at high fields; therefore, it may be reasonable to measure the Mₛ value and austenite content of medium Mn steels using this relationship. However, the linear F-K relationship does not perfectly equate to the A/H approach law, as shown in Figure 6, although the linear F-K relationship is still valid for various ferromagnetic materials, both in the imhomogeneous multiphase steels and soft steel with fewer internal crystal defects. Furthermore, in our experiments determining the austenite content of medium manganese steel using a magnetometer, the testing magnetic field range of the permeameter also does not meet the necessary conditions (A/H ≤ 1/10) stipulated by the A/H approach law, but the error in the test results was not significant. Brown’s, Néel’s, and Schlömann’s saturation magnetization theories cannot explain these phenomena and cannot serve as a theoretical basis for measuring saturation magnetization in complex inhomogeneous multiphase steels.

6.2. A General Theoretical Explanation for the Linear F-K Relation

The linear F-K relationship seems to be a universal principle governing all ordinary ferromagnetic materials, which was the consensus among early electromagnetic engineers before 1900. C. P. Steinmetz [65,66] tested the magnetic properties of a large number of various types of steels and proposed the linear law of “metallic reluctivity”, which can be expressed in the following form after conversion into the SI system of units:
ρ = ρ 0 + σ H , ρ = H M , σ = 1 M s
where ρ is the “metallic reluctivity”, which should be distinguished from the “metallic resistance”. ρ0 is the “coefficient of magnetic hardness” and σ is the “coefficient of magnetic saturation”. It can be seen that the linear law of reluctivity is mathematically equivalent to the linear F-K relationship. From Lamont’s pioneering law to the subsequent F-K relationship—culminating in the linear reluctivity law championed by the renowned electrical engineer Steinmetz—while their expressions differ, these formulas are mathematically identical. This linear relationship is also strikingly predicted by Jiles–Atherton’s hysteresis model (JAM) and Hauser’s energetic model (EM) within the high field regime [67].
The F-K relationship may stem from ferromagnetic materials exhibiting solely reversible magnetization processes near saturation magnetization—a phenomenon observed in W. Steinhaus and E. Gumlich’s foundational ferromagnetic studies [68,69]. The movement of magnetic domains usually completes at very low magnetic fields, and the saturation magnetization process mainly involves the rotation of magnetic domains. They proposed that, without irreversible processes, ferromagnetic magnetization curves would adhere to the Langevin function. Their experimental measurements on cast iron, alloy steel, and hard magnetic materials confirmed this rule’s validity approaching saturation. Yet, for soft iron, significant deviation occurs at high fields. In our view, their treatment overlooks the influence of magnetic interactions between “effective domains”. The Langevin–Weiss anhysteretic magnetization function provides a far more detailed and comprehensive description of isotropic ferromagnetic material magnetization curves than the classical Langevin function, typically expressed as follows:
M = M s c o t h H + α M a a H + α M , a = k B T μ 0 m = k B T μ 0 N μ a t o m
where He is the internal effective field, He = H + αM; αM represents the average magnetic interaction field between “effective domains”; and α is the effective domain coupling parameter. The parameter a is an inherent constant of the material, representing the density of the “effective domain”, kB is the Boltzmann constant, T is the absolute temperature, <m> represents the average total magnetic moment of an effective domain, <m> = <N> μatom, <N> reflects the average number of aligned atomic moments, and μatom is the atomic magnetic moment. This function stems from Weiss’s molecular field theory [70], the most significant foundational theory in contemporary ferromagnetic theory. The Jiles–Atherton hysteresis model, which has been widely applied in various soft and hard ferromagnetic materials, is also based on this Langevin–Weiss function [71]. The “effective domains” refer to collective magnetic moment entities that possess a uniform spontaneous magnetization vector, which are similar to the concept of spontaneous magnetized “molecules” proposed by Weiss. When approaching saturation magnetization, the magnetic domain walls within the grains disappear; these “effective domains” can be the defect-free grains of the ferromagnetic phases. The Langevin–Weiss function originates from classical statistics, one of the three fundamental pillars of statistical physics alongside Bose statistics and Fermi statistics. Importantly, both Fermi and Bose statistics can often be reduced to this classical framework. In conclusion, for the anhysteresis magnetization process of isotropic ferromagnetic materials, the physical foundation of the Langevin–function is very solid.
Medium manganese steels and other AHSS steels exhibit heterogeneous microstructures characterized by coexisting ferromagnetic and non-magnetic phases, such as α-ferrite, γ-austenite, α′-martensite, ε-martensite, cementite, and trace amounts of non-magnetic precipitates and inclusions. The magnetization process of such an inhomogeneous ferromagnetic material involves complex non-local interactions caused by microstructural crystal defects, internal stresses, and non-magnetic phases. These non-local interactions may include stray fields from non-magnetic phases, magneto-elastic interactions due to internal stresses, and magnetostrictive interactions caused by lattice distortions. The traditional Akulov’s B/H2 approach law for ferromagnets solely considers the influence of the external field energy and anisotropic field energy in the approaching saturation magnetization. It is difficult to apply to the saturation magnetization process of modern steels with complex multiphase microstructures, where the interaction of stray fields plays a significant role. In contrast, the Langevin–Weiss function emerges as a phenomenological bridge between classical statistical mechanics and modern micromagnetic theory, enabling an analysis of saturation magnetization behavior in inhomogeneous ferromagnetic materials. Despite the highly complex microstructures of modern steels at the microscopic level, these steels remain macroscopic non-magnetic in the absence of an external field. This means that the spontaneous magnetization vectors of the ferromagnetic phases are randomly distributed, which can be described by classical statistics. We can consider these steels to be isotropic polycrystalline ferromagnets composed of randomly distributed ferromagnetic “molecules”, and we can introduce an internal interaction field Hint to model the average effect of the various complex internal interactions; the αM term can be replaced by Hint, and then the reversible magnetization process of these steels also can be described using the Langevin–Weiss function. Hint is a synthetic interaction field that includes the magnetic interaction field αM and other complex interaction fields.
The Langevin–Weiss anhysteresis magnetization function can be further streamlined into a form that is identical to the familiar F-K relationship form. Table 4 shows the values of each item of the Langevin–Weiss function under different He/a values. As shown in Table 4, when the dimensionless parameter He/a ≥ 3 (corresponding to M/Ms ≥ 0.672), the coth (He/a) term converges to 1 with negligible error (<0.5%); the coth term can be replaced by 1, and then the Langevin–Weiss function can be converted to the following form:
H M = a H M s ( H + H int a ) + H M s ; A = a 1 + H int a H
This formula is already very close to the F-K formula, the parameter a in the Langevin–Weiss formula is essentially mathematically equivalent to the magnetic “hardness” A. This formula also illustrates the linear relationship between H and M, just as described by the linear F-K relationship. The slope in the formula represents the reciprocal of Ms; its value depends solely on the parameters H and M and is independent of the complex internal interaction field Hint. The Ms value is easily obtained through a linear regression of the test magnetization data of the reversible magnetization interval, without the need to know the complex interaction information within it. However, the magnetic “hardness” A in the F-K formula is related to the internal interaction field Hint. This aligns with the common explanation that parameter A is attributed to internal crystal defects, such as dislocations, grain boundaries, phase boundaries, inclusions, and pores, among others, as these defects are the root causes of complex non-local interactions.
We can easily obtain the conditions for the establishment of the above formula or the linear Frölich–Kennelly relation: (1) magnetic isotropy (random distribution of spontaneous magnetization directions); (2) a reversible magnetization process; and (3) He/a ≥ 3 or M/Ms ≥ 0.672. These conditions are the necessary prerequisites for measuring Ms using the linear F-K relationship. Magnetic isotropy and crystal isotropy represent distinct concepts. Within a bcc-Fe crystal, magnetization directions can align along the <100>, <110>, and <111> crystal axes. Achieving a random distribution of magnetization directions proves far easier than achieving a random distribution of crystal orientations. Therefore, most steels can be regarded as isotropic magnetic materials in the process of saturation magnetization measurements. Meanwhile, irreversible domain wall movements are usually completed under a relatively small effective field during the magnetization process of most steels; only reversible magnetization processes occur when approaching saturation magnetization. The second condition is usually quite easy to meet. For most magnetic materials, Aa ≈ αMsHμ; Hμ is the magnetic field corresponding to the maximum permeability μm or the minimum magnetic reluctivity. The third condition can be converted into the following form: H ≥ 2Hμ = 2A. Since the magnetic hardness A of most steels falls below 100 Oe, the third condition is readily met within a permeameter’s typical measurement field. This likely explains why permeameters can measure the Js value in relatively low fields compared to VSM. However, in our permeameter measurements of Js values for 5Mn and 7Mn steels, we imposed no restrictions on the fitting field range. Take 7MnT2 steel: its magnetic hardness is 160.6 Oe, demanding a fitting range exceeding 321.2 Oe for accuracy. Yet, our actual fitting range spanned only 200 to 500 Oe. This mismatch explains the larger measurement error between the permeameter and VSM observed in materials with higher austenite content and magnetic hardness. As long as the above three conditions are met, the accuracy of the saturation magnetization and the related austenite content measured by the permeameter is sufficient to meet the industrial requirements for determining the austenite content.

6.3. The Limitations of Permeameter Method for Measuring Austenitic Content

The main difficulty in measuring the Ms value using the permeameter method lies in how to know whether or not the magnetization has entered into the reversible saturation magnetization interval, especially for steels containing high magnetocrystalline anisotropy phases. According to the magnetic measurement results of 5Mn and 7Mn steels under different process states using VSM in Section 5.1, it is evident that the linear F-K relationship is valid within a wide magnetic field range (100~12,000 Oe). However, for the 5MnT2, 7MnT1, and 7MnT2 steel, this linear relationship significantly deviates from linearity at lower fields (<1000 Oe), as illustrated in Figure 7 and Figure 8b. The inconsistent linear relationship observed in low magnetic fields (<500~1000 Oe) and high magnetic fields (>1000 Oe) is the reason for the significant differences in the Js values measured by the VSM method and the permeameter method. This difference in the measured Js values is more pronounced in 7Mn steel than in 5Mn steel. We compared and analyzed the microstructural differences between 5MnT2 and 7MnT2, which were all intercritically annealed at 650 °C for 1 h, but their compositions were different.
Figure 13 shows a comparison of SEM and optical micrographs of 5MnT2 and 7MnT2 steels. The microstructure of both steels primarily features lamellar ferrite and reversed austenite. Many studies have shown that the austenite and ferrite microstructures are separated and arranged with each other, with the width of the plate-like austenite and ferrite being approximately 50 to 300 nm [8,10]. Moreover, a comparison of the 5MnT2 and 7MnT2 microstructures in Figure 13 clearly reveals that the 7MnT2 steel exhibits a significantly higher concentration of cementite and distinct precipitated phases (see Figure 13d) than the 5MnT2 steel. This difference is due to the fact that the carbon content (0.17 wt.%) and vanadium content (0.20 wt.%) of the 7Mn steel are higher than those of 5Mn steel (0.06 wt.%). The cementite content in 5MnT1 steel is extremely low and almost undetectable. Previous measurements showed austenite volume fractions of 38.5% for 5MnT2 and 47.8% for 7MnT2 steel, and magnetic hardness A values of 103 Oe and 160.2 Oe, respectively. From the perspective of ferromagnetism, a high content of plate-like non-magnetic austenite diminishes the magnetic interaction field αM between the self-magnetized α-ferrite phases, necessitating a relatively high external field H to achieve the measurement saturation magnetization condition—H + αM ≥ 3A. When αM approaches zero, the minimum magnetic field H necessary to measure the Ms value must exceed 309 Oe for 5MnT2 steel and 465 Oe for 7MnT2 steel, which surpasses the measurement field range of most permeameters. The measurement errors for Js in 5MnT2 and 7MnT2 between VSM and permeameters arise from the fact that the selected field range for data fitting in the permeameter does not meet the following condition: He = H + αM ≥ 3A. So, the Js value obtained through the permeameter method is usually significantly lower than that of the VSM method.
Moreover, the presence of single-domain particles of ferromagnetic phases (α-Fe or cementite) cannot be ruled out in the incritically annealed 5Mn and 7Mn steels due to the segmentation effect caused by high-content austenite phases. Medium manganese steel is not ordinary structural steel, and it is also a kind of magnetic hysteresis alloy steel. For such single-domain particles, magnetization reversal along the hard axis demands the internal effective field He exceeding the ferromagnetic phase’s anisotropy field (HK) [72]. Consequently, the magnetization process of steels containing single-domain particles is not truly reversible when the internal effective field He falls below the ferromagnetic phase’s HK. Given that the HK value of the bcc-Fe phase is approximately 500 Oe, even if single-domain α-Fe particles exist, all magnetic domains reverse under an external field H exceeding 500 Oe at RT. Considering the magnetic interaction field, the required field H is actually lower. Therefore, theoretically, for multiphase steels lacking high magnetocrystalline anisotropy phases, the permeameter’s measurement field range (≤1000 Oe) is sufficient to meet the requirements for measuring the saturation magnetization of these steels. On the contrary, if the multiphase steels contain a high proportion of high magnetocrystalline anisotropy phases, the measurement of saturation magnetization using a permeameter may encounter problems. Many studies have indicated that the cementite (Fe3C) phase demonstrates a lower saturation polarization (Js ≈ 1.2~1.3 T) and a higher magnetocrystalline anisotropy constant (K1 ≈ 120–150 kJ/m3) at room temperature compared to the α-Fe phase [73,74]. The theoretical HK value of cementite is approximately 2000–3000 Oe, which is also significantly larger than the HK of the α-Fe phase. These high magnetocrystalline anisotropy phases may increase the difficulty for itself and the adjacent bcc-Fe to change its spontaneous magnetization direction towards the external field direction, thus requiring a higher magnetic field to achieve the reversible magnetization process. This required magnetic field may exceed the measurement range of a common permeameter; thus, a special permeameter (such as the saturation permeameter [47]) is needed. The problem of air flux compensation in the high field of the permeameter also affects the measurement accuracy. This may well explain why permeameter measurements of Js values in high-carbon 7Mn steel consistently show greater error relative to VSM than those in low-carbon 5Mn steel. At the same time, as the volume fraction of the cementite phase in the complex multiphase steel increases, it will also lead to a decrease in the collective saturation magnetization Ms(c), causing it to be mistakenly regarded as an increase in the content of austenite calculated using Formula (2).
In conclusion, as the austenite content of multiphase steel increases, its magnetic hardness will increase; the measurement field range of the ordinary permeameters cannot meet the necessary conditions for determining Ms values, resulting in a larger measurement error of the permeameter compared to the VSM. The ordinary permeameter may prove unsuitable for multiphase steels exhibiting a significant proportion of austenite or those containing substantial amounts of high magnetocrystalline anisotropy phases, such as cementite or cobalt-containing phases. Fortunately, the content of cementite or retained austenite in most AHSS steels remains very low; consequently, the austenite content of most steels can readily be measured by a permeameter, and its measurement accuracy fully meets the requirements for general industrial characterization.

7. Conclusions

This study proposed and verified an innovative magnetic permeameter method based on the linear Frölich–Kennelly empirical relationship for the rapid and non-destructive determination of the saturation magnetization and the austenite content of medium manganese steels. The core principle of this method is to utilize the fact that the reciprocal of the magnetization intensity (1/M) of multiphase steels shows a linear relationship with the magnetic field intensity (H) when the field exceeds the coercive field (Hc) significantly. By linearly fitting the reversible magnetization data in the near-saturation region, the Ms values can be conveniently and accurately determined, and the volume fraction of the non-magnetic phases (mainly austenite) can be calculated. Experimental results show that this method has a high consistency using traditional VSM and XRD methods and exhibits an extremely high sensitivity and accuracy for low austenite content.
In the permeameter method, the issue of the air flux compensation effect in the high-field measurement and the setting of the effective magnetic path length (Le) have an impact on the measurement results of the saturation magnetization. The Ms value of a multiphase steel determined by the linear fitting of the magnetomotive force–magnetic reluctance relationship is consistent with the value determined by the F-K relationship, but the former method avoids the measurement of Le values and is the preferred measurement approach. However, the application of this method has certain theoretical prerequisites and limitations. Theoretically, this method utilizes the empirical Frölich–Kennelly relationship. We first proposed and believed that this empirical F-K relationship stems from the Langevin–Weiss anhysteresis magnetization function, which is applicable to the reversible magnetization process of isotropic ferromagnetic materials. Therefore, to measure the Ms values using a permeameter, the effective magnetization measurement data must be within the reversible saturation magnetization range, and the fitting magnetic field range must satisfy H ≥ 2H ≈ 2A, where Hμ is the magnetic field corresponding to the maximum permeability, which is approximately equal to the magnetic “hardness” A of a ferromagnetic material. When a high proportion of non-magnetic phases (> 50%) or high magnetocrystalline anisotropy phases exist within multiphase steel, the corresponding magnetic hardness A value increases significantly. The limited test magnetic field range of the permeameter will prevent it from meeting the necessary field conditions (H ≥ 2A or the reversible magnetization) for determining the Ms value, thereby affecting the measurement accuracy of Ms. Finally, magnetic method measurements of “austenite content” typically yield higher values than XRD measurements. This occurs because the magnetic method, in fact, quantifies the total content of all non-magnetic phases—which may include austenite, non-magnetic inclusions, and precipitates—rather than exclusively measuring austenite. Generally, the presence and quantity of other non-magnetic phases besides austenite are minimal, rendering the magnetic method’s austenite measurement accuracy sufficient for material science microstructure characterization.
Although the experiments in this paper focused on medium manganese steels, given that the Ms value mainly depends on the crystal structure, this method can theoretically be extended to other advanced high-strength steels with retained austenite (such as TRIP steel and bainitic steel). In conclusion, this permeameter method provides a highly industrially applicable transformative solution for the quantitative phase analysis of complex multiphase steels and offers advantages including simple sample preparation, simple operation, rapid analysis, and non-destructiveness, as well as high reliability and repeatability of the measurement results. Besides measuring the Ms value and austenite content, it can also provide a large amount of other information such as the magnetization curve, magnetic permeability, iron loss characteristics, coercivity, remanence, and a series of other magnetic information. These magnetic properties are closely related to key microstructural parameters (such as dislocation density, grain size, morphology, phase composition and content, etc.), and can be used to characterize, analyze, and understand the internal microstructure of these complex multiphase steels on a macroscopic scale.

Author Contributions

Conceptualization, H.H. and L.D.; methodology, H.H.; software, H.H.; validation, H.H.; formal analysis, H.H.; investigation, H.H. and L.D.; resources, L.D. and X.G.; data curation, H.H. and L.D.; writing—original draft, H.H.; writing—review and editing, H.H. and H.W.; visualization, H.H. and L.D.; supervision, L.D., H.W., and X.G.; project administration, L.D., H.W., and X.G.; funding acquisition, L.D., H.W., and X.G. All authors have read and agreed to the published version of the manuscript.

Funding

This research was funded by [National High-tech R&D Program (863 Program)] grant number [2015AA03A5011].

Data Availability Statement

The raw data supporting the conclusions of this article will be made available by the authors on request.

Acknowledgments

The authors gratefully acknowledge to Hunan Forever Elegance Technology Company for the assistance and support provided in the field of permeameter measurement and calibration.

Conflicts of Interest

The authors declare no conflicts of interest.

Appendix A

Calculation of Shape Demagnetization Coefficient: For a square prism (a = b ≠ c, a and b are the side lengths of the square, c is the height of the test direction), the demagnetization factor Nd is calculated according to the theoretical formula provided by Amikam Aharoni [55]. The specific expression is as follows:
    π N d = p 1 p l n p 2 + 2 + 1 p 2 + 2 1 + 2 p l n 2 + 1 + p l n p 2 + 1 1 p 2 + 1 + 1 + 2 a r c t a n 1 p p 2 + 2 + 2 1 p 2 3 p p 2 + 2 + 2 1 p 3 3 p 2 3 / 2 3 p + 2 3 p 2 + 1 2 p 1 p
where Nd is the demagnetization factor of the square prism sample in the axis of the prism and p is the ratio of height to width of a square prism, p = c/a.

Appendix B

The Formula for Volume Fraction of Retained Austenite: The volume fraction of retained austenite f(γ) was estimated from the integrated intensity of the monitored austenite (Iγ,i) and ferrite (Iα,i) peaks [23]:
f ( γ ) = 1 P i = 1 P I γ , i R γ , i 1 P i = 1 P I γ , i R γ , i + 1 Q i = 1 Q I α , i R α , i
where P and Q are the number of considered austenite and ferrite reflections, respectively. The index i refers to the {hkl} reflection of interest. The normalization factors for the austenite (Rγ,i) and ferrite (Rα,i) peak intensities are obtained from the diffracted intensity without texture. At 300 K, the normalization factors are estimated at Rγ,{200}= 2.067 m−1, Rγ,{220} = 1.796 m−1, Rγ,{311} = 2.282 m−1, Rα,{200} = 1.269 m−1, Rα,{211} = 2.932 m−1, and Rα,{220} = 0.951 m−1 [23].
The mean lattice parameters a for the austenite and ferrite phases can be determined from the experimental mean 2θi of the considered {hkl} reflections using the following relation [23]:
a = 1 N i = 1 N λ 2 h 2 + l 2 + k 2 s i n θ i
where N is the number of considered reflections for the austenite or ferrite phase, λ represents the wavelength of the characteristic X-rays emitted by the anode target.

References

  1. Bleck, W.; Brühl, F.; Ma, Y.; Sasse, C. Materials and processes for the third-generation advanced high-strength steels. Berg Huettenmaen. Monats. 2019, 164, 466–474. [Google Scholar] [CrossRef]
  2. Raabe, D.; Sun, B.; Da Silva, A.K.; Gault, B.; Yen, H.-W.; Sedighiani, K.; Sukumar, P.T.; Filho, I.R.S.; Katnagallu, S.; Jägle, E.; et al. Current challenges and opportunities in microstructure-related properties of advanced high-strength steels. Metall. Mater. Trans. A 2020, 51, 5517–5586. [Google Scholar] [CrossRef]
  3. Long, X.Y.; Kang, J.; Lv, B.; Zhang, F.C. Carbide-free bainite in medium carbon steel. Mater. Des. 2014, 64, 237–245. [Google Scholar] [CrossRef]
  4. Soleimani, M.; Kalhor, A.; Mirzadeh, H. Transformation-induced plasticity (trip) in advanced steels: A review. Mater. Sci. Eng. A 2020, 795, 140023. [Google Scholar] [CrossRef]
  5. Ariza, E.A.; Poplawsky, J.; Guo, W.; Unocic, K.; Ramirez, A.J.; Tschiptschin, A.P.; Babu, S.S. Evaluation of carbon partitioning in new generation of quench and partitioning (Q&P) steels. Metall. Mater. Trans. A 2018, 49, 4809–4823. [Google Scholar] [CrossRef]
  6. Hu, J.; Zhang, J.-M.; Sun, G.-S.; Du, L.-X.; Liu, Y.; Dong, Y.; Misra, R.D.K. High strength and ductility combination in nano-/ultrafine-grained medium-mn steel by tuning the stability of reverted austenite involving intercritical annealing. J. Mater. Sci. 2019, 54, 6565–6578. [Google Scholar] [CrossRef]
  7. Li, Y.; Yuan, G.; Li, L.; Kang, J.; Yan, F.; Du, P.; Raabe, D.; Wang, G. Ductile 2-gpa steels with hierarchical substructure. Science 2023, 379, 168–173. [Google Scholar] [CrossRef]
  8. Hu, J.; Du, L.-X.; Sun, G.-S.; Xie, H.; Misra, R.D.K. The determining role of reversed austenite in enhancing toughness of a novel ultra-low carbon medium manganese high strength steel. Scr. Mater. 2015, 104, 87–90. [Google Scholar] [CrossRef]
  9. Wang, Z.; Huang, M.X. The role of retained austenite stability on low-temperature mechanical behaviors of a quenching and partitioning steel. Metall. Mater. Trans. A 2019, 50, 5650–5655. [Google Scholar] [CrossRef]
  10. Qi, X.; Du, L.; Hu, J.; Misra, R.D.K. Effect of austenite stability on toughness, ductility, and work-hardening of medium-mn steel. Mater. Sci. Technol. 2019, 35, 2134–2142. [Google Scholar] [CrossRef]
  11. Xiong, X.C.; Chen, B.; Huang, M.X.; Wang, J.F.; Wang, L. The effect of morphology on the stability of retained austenite in a quenched and partitioned steel. Scr. Mater. 2013, 68, 321–324. [Google Scholar] [CrossRef]
  12. Solheim, K.G.; Solberg, J.K.; Walmsley, J.; Rosenqvist, F.; Bjørnå, T.H. The role of retained austenite in hydrogen embrittlement of supermartensitic stainless steel. Eng. Fail. Anal. 2013, 34, 140–149. [Google Scholar] [CrossRef]
  13. Sun, B.; Wang, D.; Lu, X.; Wan, D.; Ponge, D.; Zhang, X. Current challenges and opportunities toward understanding hydrogen embrittlement mechanisms in advanced high-strength steels: A review. Acta Metall. Sin. (Engl. Lett.) 2021, 34, 741–754. [Google Scholar] [CrossRef]
  14. Sidoroff, C.; Perez, M.; Dierickx, P.; Girodin, D. Advantages and shortcomings of retained austenite in bearing steels: A review. In Bearing Steel Technologies: 10th Volume, Advances in Steel Technologies for Rolling Bearings; ASTM International: West Conshohocken, PA, USA, 2014; pp. 1–37. [Google Scholar]
  15. Wang, M.; Liu, Z.-Y.; Li, C.-G. Correlations of ni contents, formation of reversed austenite and toughness for ni-containing cryogenic steels. Acta Metall. Sin. (Engl. Lett.) 2016, 30, 238–249. [Google Scholar] [CrossRef]
  16. Zheng, S.-Q.; Jiang, W.; Bai, X.; Li, S.-H.; Zhao, K.-Y.; Zhu, X.-K. Effect of deep cryogenic treatment on formation of reversed austenite in super martensitic stainless steel. J. Iron Steel Res. Int. 2015, 22, 451–456. [Google Scholar] [CrossRef]
  17. Trudel, A.; Lévesque, M.; Brochu, M. Microstructural effects on the fatigue crack growth resistance of a stainless steel ca6nm weld. Eng. Fract. Mech. 2014, 115, 60–72. [Google Scholar] [CrossRef]
  18. Jacques, P.J.; Allain, S.; Bouaziz, O.; De, A.; Gourgues, A.F.; Hance, B.M.; Houbaert, Y.; Huang, J.; Iza-Mendia, A.; Kruger, S.E.; et al. On measurement of retained austenite in multiphase trip steels—Results of blind round robin test involving six different techniques. Mater. Sci. Technol. 2009, 25, 567–574. [Google Scholar] [CrossRef]
  19. Talonen, J.; Aspegren, P.; Hänninen, H. Comparison of different methods for measuring strain induced α-martensite content in austenitic steels. Mater. Sci. Technol. 2004, 20, 1506–1512. [Google Scholar] [CrossRef]
  20. Jatczak, C.F. Retained austenite and its measurement by x-ray diffraction. In SAE Transactions; SAE International: Warrendale, PA, USA, 1980; pp. 1657–1676. [Google Scholar]
  21. Epp, J. X-ray diffraction (xrd) techniques for materials characterization. In Materials Characterization Using Nondestructive Evaluation (Nde) Methods; Woodhead Publishing: Amsterdam, The Netherlands, 2016; pp. 81–124. [Google Scholar]
  22. Blondé, R.; Jimenez-Melero, E.; Zhao, L.; Wright, J.P.; Brück, E.; van der Zwaag, S.; van Dijk, N.H. High-energy x-ray diffraction study on the temperature-dependent mechanical stability of retained austenite in low-alloyed trip steels. Acta Mater. 2012, 60, 565–577. [Google Scholar] [CrossRef]
  23. Vandijk, N.; Butt, A.; Zhao, L.; Sietsma, J.; Offerman, S.; Wright, J.; Vanderzwaag, S. Thermal stability of retained austenite in trip steels studied by synchrotron x-ray diffraction during cooling. Acta Mater. 2005, 53, 5439–5447. [Google Scholar] [CrossRef]
  24. Witte, M.; Lesch, C. On the improvement of measurement accuracy of retained austenite in steel with x-ray diffraction. Mater. Charact. 2018, 139, 111–115. [Google Scholar] [CrossRef]
  25. Zhao, L.; van Dijk, N.H.; Brück, E.; Sietsma, J.; van der Zwaag, S. Magnetic and x-ray diffraction measurements for the determination of retained austenite in trip steels. Mater. Sci. Eng. A 2001, 313, 145–152. [Google Scholar] [CrossRef]
  26. Mumtaz, K.; Takahashi, S.; Echigoya, J.; Kamada, Y.; Zhang, L.F.; Kikuchi, H.; Ara, K.; Sato, M. Magnetic measurements of martensitic transformation in austenitic stainless steel after room temperature rolling. J. Mater. Sci. 2004, 39, 85–97. [Google Scholar] [CrossRef]
  27. Tavares, S.S.M.; Mello, S.R.; Gomes, A.M.; Neto, J.M.; da Silva, M.R.; Pardal, J.M. X-ray diffraction and magnetic characterization of the retained austenite in a chromium alloyed high carbon steel. J. Mater. Sci. 2006, 41, 4732–4736. [Google Scholar] [CrossRef]
  28. Sicupira, F.L.; Sandim, M.J.R.; Sandim, H.R.Z.; Santos, D.B.; Renzetti, R.A. Quantification of retained austenite by x-ray diffraction and saturation magnetization in a supermartensitic stainless steel. Mater. Charact. 2016, 115, 90–96. [Google Scholar] [CrossRef]
  29. Arguelles, A.; Barbes, F.; Espeso, J.I.; Garcia-Mateo, C. Cryogenic study of the magnetic and thermal stability of retained austenite in nanostructured bainite. Sci. Technol. Adv. Mater. 2019, 20, 673–687. [Google Scholar] [CrossRef]
  30. Ahmadzade-Beiraki, E.; Kahrobaee, S.; Kashefi, M.; Akhlaghi, I.A.; Mazinani, M. Quantitative evaluation of deformation induced martensite in austenitic stainless steel using magnetic nde techniques. J. Nondestruct. Eval. 2020, 39, 28. [Google Scholar] [CrossRef]
  31. Radu, M.; Valy, J.; Gourgues, A.-F.; Le Strat, F.; Pineau, A. Continuous magnetic method for quantitative monitoring of martensitic transformation in steels containing metastable austenite. Scr. Mater. 2005, 52, 525–530. [Google Scholar] [CrossRef]
  32. Becker, R.; Döring, W. Ferromagnetismus; Springer: Berlin/Heidelberg, Germany, 2013; p. 167. [Google Scholar]
  33. Kittel, C. Physical theory of ferromagnetic domains. Rev. Mod. Phys. 1949, 21, 541–583. [Google Scholar] [CrossRef]
  34. Slater, J.C. The ferromagnetism of nickel. Phys. Rev. 1936, 49, 537–545. [Google Scholar] [CrossRef]
  35. McHenry, M.E.; Laughlin, D.E. Magnetic properties of metals and alloys. In Physical Metallurgy; Elsevier: Amsterdam, The Netherlands, 2014; pp. 1881–2008. [Google Scholar]
  36. Cina, B. A transitional h.C.P. Phase in the γ → α transformation in certain fe-base alloys. Acta Metall. 1958, 6, 748–762. [Google Scholar] [CrossRef]
  37. Kittel, C.; Galt, J. Ferromagnetic domain theory. In Solid State Physics; Elsevier: Amsterdam, The Netherlands, 1956; Volume 3, pp. 437–564. [Google Scholar]
  38. Cullity, B.D.; Graham, C.D. Introduction to Magnetic Materials, 2nd ed.; John Wiley & Sons: Hoboken, NJ, USA, 2011; p. 360. [Google Scholar]
  39. Fiorillo, F. (Ed.) Chapter 9-measurement of intrinsic magnetic properties of ferromagnets. In Characterization and Measurement of Magnetic Materials; Academic Press: San Diego, CA, USA, 2004; pp. 549–579. [Google Scholar]
  40. Néel, L. La loi d’approche en a: H et une nouvelle théorie de la dureté magnétique. J. Phys. Radium 1984, 9, 184–192. [Google Scholar] [CrossRef]
  41. Grössinger, R. A critical examination of the law of approach to saturation. I. Fit procedure. Phys. Status Solidi (A) 1981, 66, 665–674. [Google Scholar] [CrossRef]
  42. Bozorth, R.M. Ferromagnetism; Wiley-IEEE Press: Piscataway, NJ, USA, 1993; p. 484. [Google Scholar]
  43. Fiorillo, F. Measurements of magnetic materials. Metrologia 2020, 47, S114–S142. [Google Scholar] [CrossRef]
  44. Fiorillo, F. (Ed.) Chapter 7-characterization of soft magnetic materials. In Characterization and Measurement of Magnetic Materials; Academic Press: San Diego, CA, USA, 2004; pp. 307–474. [Google Scholar]
  45. Fiorillo, F. Dc and ac magnetization processes in soft magnetic materials. J. Magn. Magn. Mater. 2002, 242–245, 77–83. [Google Scholar] [CrossRef]
  46. IEC 60404-4; Magnetic Materials-Part 4: Methods of Measurement of Dc Magnetic Properties of Magnetically Soft Materials. IEC Standard Publication: Geneva, Switzerland, 2008.
  47. Gokhale, S. Saturation permeameter. J. AIEE 1928, 47, 196–200. [Google Scholar]
  48. Bowler, N. Frequency-dependence of relative permeability in steel. AIP Conf. Proc. 2006, 820, 1269–1276. [Google Scholar] [CrossRef]
  49. IEC 60404-3; Magnetic Materials-Part 3: Methods of Measurement of the Magnetic Properties of Electrical Steel Strip and Sheet by Means of a Single Sheet Tester. IEC Standard Publication: Geneva, Switzerland, 2022.
  50. Hofmann, M.; Kahraman, D.; Herzog, H.-G.; Hoffmann, M.J. Numerical determination of the effective magnetic path length of a single-sheet tester. IEEE Trans. Magn. 2014, 50, 929–932. [Google Scholar] [CrossRef]
  51. Pfutzner, H.; Shilyashki, G.; Huber, E. Physical assessment of the magnetic path length of energy loss testers. IEEE Trans. Magn. 2020, 56, 1–7. [Google Scholar] [CrossRef]
  52. Gmyrek, Z. Single sheet tester with variable dimensions. IEEE Trans. Instrum. Meas. 2016, 65, 1661–1668. [Google Scholar] [CrossRef]
  53. Chen, D.X.; Zhu, Y.H. Permeameter and solenoid measurements of epstein strips of electrical steels. Rev. Sci. Instrum. 2023, 94, 093904. [Google Scholar] [CrossRef] [PubMed]
  54. Arpaia, P.; Liccardo, A.; Buzio, M.; Parrella, A. On the use of fluxmetric methods for characterizing feebly magnetic materials. In Proceedings of the 2017 IEEE International Instrumentation and Measurement Technology Conference (I2MTC), Turin, Italy, 22–25 May 2017; pp. 1404–1409. [Google Scholar] [CrossRef]
  55. Aharoni, A. Demagnetizing factors for rectangular ferromagnetic prisms. J. Appl. Phys. 1998, 83, 3432–3434. [Google Scholar] [CrossRef]
  56. Luo, H.W.; Shi, J.; Wang, C.; Cao, W.Q.; Sun, X.J.; Dong, H. Experimental and numerical analysis on formation of stable austenite during the intercritical annealing of 5mn steel. Acta Mater. 2011, 59, 4002–4014. [Google Scholar] [CrossRef]
  57. Gramlich, A.; Schmiedl, T.; Schönborn, S.; Melz, T.; Bleck, W. Development of air-hardening martensitic forging steels. Mater. Sci. Eng. A 2020, 784, 139321. [Google Scholar] [CrossRef]
  58. Han, J.; Lee, Y.-K. The effects of the heating rate on the reverse transformation mechanism and the phase stability of reverted austenite in medium mn steels. Acta Mater. 2014, 67, 354–361. [Google Scholar] [CrossRef]
  59. Jin, X.J.; Hsu, T.Y. Thermodynamic consideration of antiferromagnetic transition on fcc(γ)→hcp(ε) martensitic transformation in fe–mn–si shape memory alloys. Mater. Chem. Phys. 1999, 61, 135–138. [Google Scholar] [CrossRef]
  60. Sahu, P.; Hamada, A.; Ghosh, R.; Karjalainen, L. X-ray diffraction study on cooling-rate-induced γ fcc→ ε hcp martensitic transformation in cast-homogenized fe-26mn-0.14 c austenitic steel. Metall. Mater. Trans. A 2007, 38, 1991–2000. [Google Scholar] [CrossRef]
  61. Tsuzaki, K.; Fukasaku, S.-I.; Tomota, Y.; Maki, T. Effect of prior deformation of austenite on the γ→ε martensitic transformation in fe-mn alloys. Mater. Trans. JIM 1991, 32, 222–228. [Google Scholar] [CrossRef]
  62. Brown, W.F. Theory of the approach to magnetic saturation. Phys. Rev. 1940, 58, 736–743. [Google Scholar] [CrossRef]
  63. Brown, W.F. The effect of dislocations on magnetization near saturation. Phys. Rev. 1941, 60, 139–147. [Google Scholar] [CrossRef]
  64. Schlömann, E. Approach to saturation in inhomogeneous magnetic materials. J. Appl. Phys. 1971, 42, 5798–5807. [Google Scholar] [CrossRef]
  65. Steinmetz, C.P. On the law of hysteresis. Trans. Am. Inst. Electr. Eng. 1892, 9, 1–64. [Google Scholar] [CrossRef]
  66. Steinmetz, C.P. On the law of hysteresis (part ii.) and other phenomena of the magnetic circuit. Trans. Am. Inst. Electr. Eng. 1892, 9, 619–758. [Google Scholar] [CrossRef]
  67. Hauser, H.; Jiles, D.C.; Melikhov, Y.; Li, L.; Grössinger, R. An approach to modeling the dependence of magnetization on magnetic field in the high field regime. J. Magn. Magn. Mater. 2006, 300, 273–283. [Google Scholar] [CrossRef]
  68. Steinhaus, W.; Gumlich, E. Experimentelle untersuchungen zur theorie des ferromagnetismus. Arch. Für Elektrotechnik 1915, 4, 89–98. [Google Scholar] [CrossRef]
  69. Steinhaus, W.; Gumlich, E. Experimentelle untersuchungen zur theorie des ferromagnetismus: Ii. Ideale, dh hysteresefreie magnetisierung. Arch. Elektrotechnik 1915, 4, 149–158. [Google Scholar] [CrossRef]
  70. Weiss, P. L’hypothèse du champ moléculaire et la propriété ferromagnétique. J. Phys. Theor. Appl. 1907, 6, 661–690. [Google Scholar] [CrossRef]
  71. Jiles, D.C.; Atherton, D.L. Theory of ferromagnetic hysteresis (invited). J. Appl. Phys. 1984, 55, 2115–2120. [Google Scholar] [CrossRef]
  72. Stoner, E.C.; Wohlfarth, E.P. A mechanism of magnetic hysteresis in heterogeneous alloys. IEEE Trans. Magn. 1991, 27, 3475–3518. [Google Scholar] [CrossRef]
  73. Bhadeshia, H.K.D.H. Cementite. Int. Mater. Rev. 2019, 65, 1–27. [Google Scholar] [CrossRef]
  74. Yamamoto, S.; Terai, T.; Fukuda, T.; Sato, K.; Kakeshita, T.; Horii, S.; Ito, M.; Yonemura, M. Magnetocrystalline anisotropy of cementite pseudo single crystal fabricated under a rotating magnetic field. J. Magn. Magn. Mater. 2018, 451, 1–4. [Google Scholar] [CrossRef]
Figure 1. (a) The structure diagram and circuit diagram of the permeameter; (b) circuit diagram for measuring the field and magnetization in the permeameter.
Metals 15 01151 g001
Figure 2. The magnetization curve of the 5MnT1 steel measured with different measurement methods.
Metals 15 01151 g002
Figure 3. The different magnetization curve of the 25Mn non-magnetic steel measured using VSM and different permeameters. (a) VSM; (b) different permeameters.
Metals 15 01151 g003
Figure 4. The optical micrographs of 5MnA and 5MnT2 steels. (a) 5MnA; (b) 5MnT2.
Metals 15 01151 g004
Figure 5. The magnetization curves of 5Mn steels in different process states. (a) M-Ha curves; (b) M-H curves.
Metals 15 01151 g005
Figure 6. The M vs. 1/H curve for the 5Mn steel in different process states.
Metals 15 01151 g006
Figure 7. The relation between magnetic reluctivity (H/M) and field H in the 5Mn steel of different process states.
Metals 15 01151 g007
Figure 8. (a) The magnetization curve of the 7Mn steel in different process states measured using VSM; (b) the linear F-K relationship of the 7Mn steel after elimination of demagnetization field.
Metals 15 01151 g008
Figure 9. (a) The M-H magnetization curves of 5Mn steels measured by the permeameter; (b) the linear F-K relation between the magnetic reluctivity and the field H of 5Mn steels.
Metals 15 01151 g009
Figure 10. (a,c) The magnetization curves of 5Mn and 7Mn steels under different magnetomotive force F; (b,d) the relationship between the magnetomotive force and total magnetic reluctance of 5Mn and 7Mn steels.
Metals 15 01151 g010
Figure 11. The X-ray diffractograms of 5Mn and 7Mn steels in different process states.
Metals 15 01151 g011
Figure 12. The relationship between the magnetic hardness (A) values and the austenite volume fraction of 5Mn and 7Mn steels. (a) Experimental measurement results; (b) compared with the Néel’s theory-predicted results, adapted from Refs. [40,64].
Metals 15 01151 g012
Figure 13. (a,b) SEM micrographs of 5MnT2 and 7MnT2 steels and (c,d) optical micrographs of 5MnT2 and 7MnT2 steels.
Metals 15 01151 g013
Table 1. Chemical compositions of experimental manganese steels (wt%).
Steel No.CSiMnAlPSCrNiMoCuTiV
5Mn0.060.175.500.0280.0150.0050.450.270.220.220.015<0.004
7Mn0.170.166.800.0100.0140.0040.430.270.220.220.0060.194
25Mn0.580.6125.21.860.0230.011//////
Table 2. The linear fitting results of 5Mn and 7Mn steels measured by the permeameter.
Steel No.Frölich–Kennelly MethodMagnetomotive Force Method
Intercept aSlope bR SquareJs/TA/OeIntercept aLeSlope bR SquareJs/TALe/OeA/Oe
5Mn-WQ0.002134.82 × 10−50.999972.07 ± 0.0244.20.11824.82 × 10−50.999982.07 ± 0.022452.846.7
5MnT2-CR7.92 × 10−44.86 × 10−512.04 ± 0.0216.40.04434.84 × 10−50.999932.05 ± 0.02918.417.5
5MnA0.002475.17 × 10−50.999951.94 ± 0.0247.80.13485.16 × 10−50.999971.94 ± 0.022615.849.8
5MnT10.002796.39 × 10−50.999841.56 ± 0.0243.60.15866.35 × 10−50.999741.57 ± 0.022498.947.6
5MnT20.008218.06 × 10−50.999521.25 ± 0.021020.43538.02 × 10−50.999611.26 ± 0.025426.4103.3
7Mn-WQ/////0.135884.94 × 10−50.99992.02 ± 0.022750.652.4
7MnA/////0.184445.66 × 10−50.99981.78 ± 0.023258.662.1
7MnT1/////0.317857.30 × 10−50.99971.37 ± 0.024354.183.0
7MnT2/////0.820479.73 × 10−50.99961.02 ± 0.028432.3160.6
Table 3. The comparison of austenite content of 5Mn and 7Mn steels measured by different methods.
Steel No.VSM ResultsPermeameter ResultsXRD Results
Jm/TJs/Tf(γ)/%Jm/TJs/Tf(γ)/%A/Oef(γ)/%f(ε)/%f(ε) + f(γ)/%a(bcc-Fe)/Å
5Mn-WQ2.042.06 ± 0.0101.962.07 ± 0.02044.20002.892
5MnT2-CR1.982.02 ± 0.011.9 ± 0.51.982.04 ± 0.020.5 ± 116.40002.876
5MnA1.901.94 ± 0.015.8 ± 0.51.751.94 ± 0.025.8 ± 147.804.8 (a)4.8 ±52.881
5MnT11.521.57 ± 0.0123.8 ± 0.51.441.56 ± 0.0224.3 ± 143.616.26.4 (a)22.6 ± 52.865
5MnT21.301.33 ± 0.0135.4 ± 0.51.061.24 ± 0.0239.8 ± 110229.66.9 (a)36.5 ± 52.864
7Mn-WQ//01.902.02 ± 0.02052.4////
7MnA1.811.83 ± 0.019.4 ± 0.51.561.78 ± 0.0211.8 ± 162.11.94.1 (a)6 ± 52.877
7MnT11.421.43 ± 0.0129.2 ± 0.51.161.37 ± 0.0232.1 ± 183.018.37.9 (a)26.2 ± 52.870
7MnT21.041.07 ± 0.0147.0 ± 0.50.871.02 ± 0.0249.5 ± 1160.643.74.5 (a)48.2 ± 52.869
(a) The ε-martensite content measured using XRD was approximate, and there may be a certain amount of error.
Table 4. The values of each item of the Langevin–Weiss function under different He/a values.
He/a ((H + αM)/a)234578101520
coth (He/a)1.037 1.0050 1.0007 1.0001 1.0000 1.0000 1.000 1.000 1.000
Error (coth (He/a)-1) (%)3.73%0.50%0.07%0.01%0.00%0.00%0.00%0.00%0.00%
M/Ms0.53730.6716 0.750 0.800.8570.875 0.900.93 0.95
Disclaimer/Publisher’s Note: The statements, opinions and data contained in all publications are solely those of the individual author(s) and contributor(s) and not of MDPI and/or the editor(s). MDPI and/or the editor(s) disclaim responsibility for any injury to people or property resulting from any ideas, methods, instructions or products referred to in the content.