Abstract
The present study evaluated the ratcheting response of notched and press-fitted Al 7075-T6 specimens under stress-controlled asymmetric cycles. The degree of the interference fit (DIF) directly influenced the magnitude and the rate of progressive plastic strain at the notch edge region. Local ratcheting at the hole–pin interference region was analyzed by means of two kinematic-hardening rules—the Ahmadzadeh–Varvani (A–V) rule and the Chaboche rule—coupled with the Neuber rule. Ratcheting strains at the notch root of aluminum samples with DIF = 0 (non-press-fitting samples) were measured and found to be the highest in magnitude. For the press-fitted samples, however, ratcheting strains dropped noticeably as the DIF increased from 1% to 2%. The press-fitting process plastically deformed the perimeter edges of the notches and improved the materials strength locally at the notch edges, resulting in better resistance against ratcheting progress. Local ratcheting strains at distances of 0.5, 1.3, and 3.0 mm from the notch roots were predicted for both pinned and unpinned samples via the hardening rules and were compared with those of measured ratcheting values. The ratcheting curves predicted by means of the A-V and Chaboche hardening rules closely agreed with the experimental data. The predicted ratcheting curves were positioned, respectively, above and below the measured ratcheting data.
1. Introduction
A common approach for joining numerous structural components in automobile and aerospace industries is the use of detachable mechanical joints such as fastening and riveting. The presence of stress raisers promotes fatigue crack initiation at the fastener holes, leading to the failure of load-bearing in-service components. To reduce the likelihood of premature failure, several techniques—clamping force application [1,2], cold expansion [3,4,5], interference fit [6,7], and a combination of approaches [8,9]—have been developed over the last few decades.
During the assembly of parts, larger fastener pins are pressed into the notches/ holes of the joints to create an interference fit (IF) around the notch. Such interference fits are commonly applied in the automotive, aerospace, and manufacturing industries. An IF induces residual stresses on the hole–pin interface, which can reduce fatigue and improve the ratcheting resistance of components that are undergoing stress cycles. At the site of a notch, the applied loading spectrum highly affects the plastic strain accumulation in the plastically deformed notch region during the proceeding loading cycles. The ratcheting phenomenon refers to the progressive plastic strain under loading cycles with non-zero mean stress.
Recently, local ratcheting and stress relaxation in the vicinity of notch roots in metallic parts [10,11,12,13,14] have been studied. However, the literature lacks a thorough analysis of ratcheting at the hole–pin region. Varvani-Farahani et al. [10,11] investigated local ratcheting at the root of different-sized circular notched samples of 1045 steel. They discussed how the magnitude and rate of the local ratcheting strain changed as the stress cycles proceeded. The local ratcheting and stress relaxation of notched samples were studied via the use of a hardening framework that controlled the progress of plastic strain over asymmetric loading cycles [12].
Shekarian and Varvani-Farahani [11,12,13,14] examined both ratcheting and stress relaxation at notch roots of steel plates by coupling the Chaboche [15] and Ahmadzadeh–Varvani (A–V) [16] kinematic-hardening models with the Neuber rule [17]. They further employed these hardening frameworks to assess ratcheting at the roots of various elliptical and circular notches in 316 stainless steel specimens [14].
Steel specimens subjected to asymmetric loading cycles were studied by Wang and Rose [18]. To define the plastic shakedown rate while loading cycles continued, they proposed an integral approach. According to Hu et al. [19], local ratcheting and the rate of stress relaxation were intensified at the notch roots as the applied strain increased. They further evaluated ratcheting and stress relaxation in the vicinity of notch roots using the Chaboche hardening rule.
Ratcheting tests on notched 304L steel plates with different notch geometries were carried out by Rahman and Hassan [20]. They employed various hardening criteria developed by Chaboche [15], Ohno and Wang [21], and Ohno and Abdel Karim [22]. They reported that the simulated local ratcheting values determined by Chaboche’s model closely agreed with the experimental data. Firat [23] measured local strains at notched 1070 steel specimens using strain gauges mounted in the vicinity of the notch roots. He used Neuber’s rule and the Chaboche model to measure plastic strain values over asymmetric axial–torsional loading cycles. The predicted local ratcheting strains at the notch roots of 1070 steel specimens were found to be comparable with the measured values published in [24]. Liu et al. [25] conducted cyclic tests on austenitic stainless steel elbow pipes. The local strains on the perimeter of pressurized elbows, which were measured using strain gauges installed around the diameters of the elbow pipes, closely agreed with those predicted via the use of the Chen–Jiao–Kim (CJK) model [26]. In a recent study, Hatami and Varvani-Farahani [27] assessed local ratcheting at the notch roots of 1045 steel samples that were subjected to uniaxial asymmetric loading cycles. They employed the A–V hardening framework together with the Neuber, Glinka, and Hoffman–Seeger (H–S) rules. They reported that the predicted ratcheting curves through use of Neuber’s rule, along with the A–V model closely agreed with those of experimental data. While the predicted curves were noticeably deviated from the measured ratcheting data, when the A-V model was coupled with the Glinka model or the H-S rule.
In the current study, the local ratcheting response of Al 7075-T6 specimens at different distances from the notch roots was predicted using the A–V and Chaboche hardening rules in conjunction with the Neuber rule. The ratcheting data for the interference-fitted samples, and at various distances from the notch roots, were taken from an earlier work [28]. The pinned samples possessed DIFs of 1% and 2%. The local ratcheting of press-fitted and non-press-fitted notched aluminum specimens was evaluated via the A–V and Chaboche kinematic-hardening rules coupled with the Neuber rule. The local ratcheting results were analyzed at various DIFs, different distances from the notch root, and various applied stresses. As the DIF increased from 0 → 1% → 2%, the local ratcheting strain dropped noticeably. An increase in the applied stress promoted ratcheting at the press-fitted holes. The predicted ratcheting curves via the A–V model were placed above the measured values, while those predicted by the Chaboche hardening rule collapsed below the experimental data. The lower ratcheting magnitude at the press-fitted samples was attributed to the materials higher resistance against ratcheting, which was induced at the press-fitted holes. The choice of press-fitting, post-processing, to control ratcheting at the notch roots of components is discussed.
2. Kinematic Hardening Rules and Formulation
2.1. Strain Increments
The sum of the elastic and plastic strain increments yields:
Elastic strain increment is described through Hooke’s law as:
Terms and represent the unit and stress tensors, respectively, and E is the modulus of elasticity, G is the shear modulus, and is the Poisson’s ratio.
The plastic strain increment and flow rule are related as:
where is the plastic modulus, is the deviatoric tensor increment, and is the vector normal to the yield surface. The yield contour separates the elastic domain from the plastic region, represents the onset of yielding, and is defined by von-Mises criterion as:
As the applied load exceeds the elastic range, the yield surface is translated into deviatoric stress space via the backstress tensor in Equation (4).
2.2. The Ahmadzadeh-Varvani (A-V) Kinematic Hardening Rule
The A-V non-linear hardening model [16] was developed to control the evolution of backstress increments during loading paths. The yield surface is translated as the applied load exceeds the elastic limit. The backstress increment is controlled by the internal variable in the dynamic recovery portion of the model. Term in the A-V rule controls magnitude and rate of yield surface translation into deviatoric stress space. The general form of the A-V hardening rule is expressed as:
In the dynamic recovery term, the internal variable, , with an initial value of zero, is introduced to gradually control backstress over loading cycles. A detailed explanation of how to calculate the variables in Equation (5) is described in reference [16]. Term in Equation (5) is expressed through a dot product of plastic strain increment through Equation (6):
The stress-controlled uniaxial stress–strain hysteresis loops are used to define the material-dependent coefficients C and . The coefficient is defined through the use of experimental ratcheting data obtained over the proceeding stress cycles [29]. The coefficient is a scaler value and for uniaxial loading condition is defined as . The first part of Equation (5) is rewritten as:
where k is equal to and exponent m falls between zero and unity .
2.3. Neuber’s Rule: Relating Nominal Stress/Strain to Local Components of Stress and Strain at Notch Root
Based on Neuber’s rule, the theoretical stress concentration factor, , is related to the stress and strain concentration factors, and , as:
where
Equations (9) and (10) were substituted into Equation (8) resulting in:
Equation (11) is rewritten as:
where corresponds to the nominal stress range, and E is the modulus of elasticity. In the right-hand side of Equation (12), terms and are, respectively, local strain and stress ranges. Equation (12) was employed to relate nominal stress S and nominal strain e to local stress and strain at the notch root as notched samples are loaded, unloaded, and reloaded through paths O → A, A → B, and B → C. Equations (13) and (4) represent relations between nominal and local stress and strains at notch root during unloading (A → B) and reloading (B → C) paths as:
Term is the stress concentration factor, and the subscripts A, B, and C correspond to the loads starting from zero (point O) to maximum load (point A), minimum load (point B), and maximum load (point C). The Ramberg–Osgood [30] equation was employed to relate nominal strain and stress through the initial loading path (O → A):
where terms and correspond to the cyclic hardening coefficient and cyclic hardening exponent, respectively.
To determine the unloading (A → B) and reloading (B → C) conditions, local backstress components for a full uniaxial loading cycle are related to local stresses at turning points through Equations (16)–(18):
The substitution of Equations (16)–(18) into Equations (13) and (14), for unloading (A → B) and reloading (B → C) paths related the local strains to the local stresses [11,12,13,14] as:
2.4. The Chaboche Kinematic Hardening Rule
Based on Chaboche’s postulation [15], yield surface translation is defined by the summation of backstress increments. This non-linear kinematic hardening model translates the yield surfaces as backstress increments are integrated. As materials are deformed beyond their elastic limits, yield surfaces are translated into deviatoric stress space based on Chaboche’s non-linear model:
Backstress components during unloading and reloading paths are defined as [15]:
In this case, represents the initial plastic strain, while represents the initial backstress. The Chaboche coefficients are derived by simulating the stabilized hysteresis loop from the strain-controlled cyclic test [15]. The slope of the initial part of the stabilized hysteresis loop with a high plastic modulus at the yield point corresponds to the coefficient and the slope of the linear part of the same curve represents the coefficient . Chaboche’s rule requires a coefficient that is large enough to stabilize the first hardening parameter.
3. Results and Discussion
3.1. Ratcheting Data
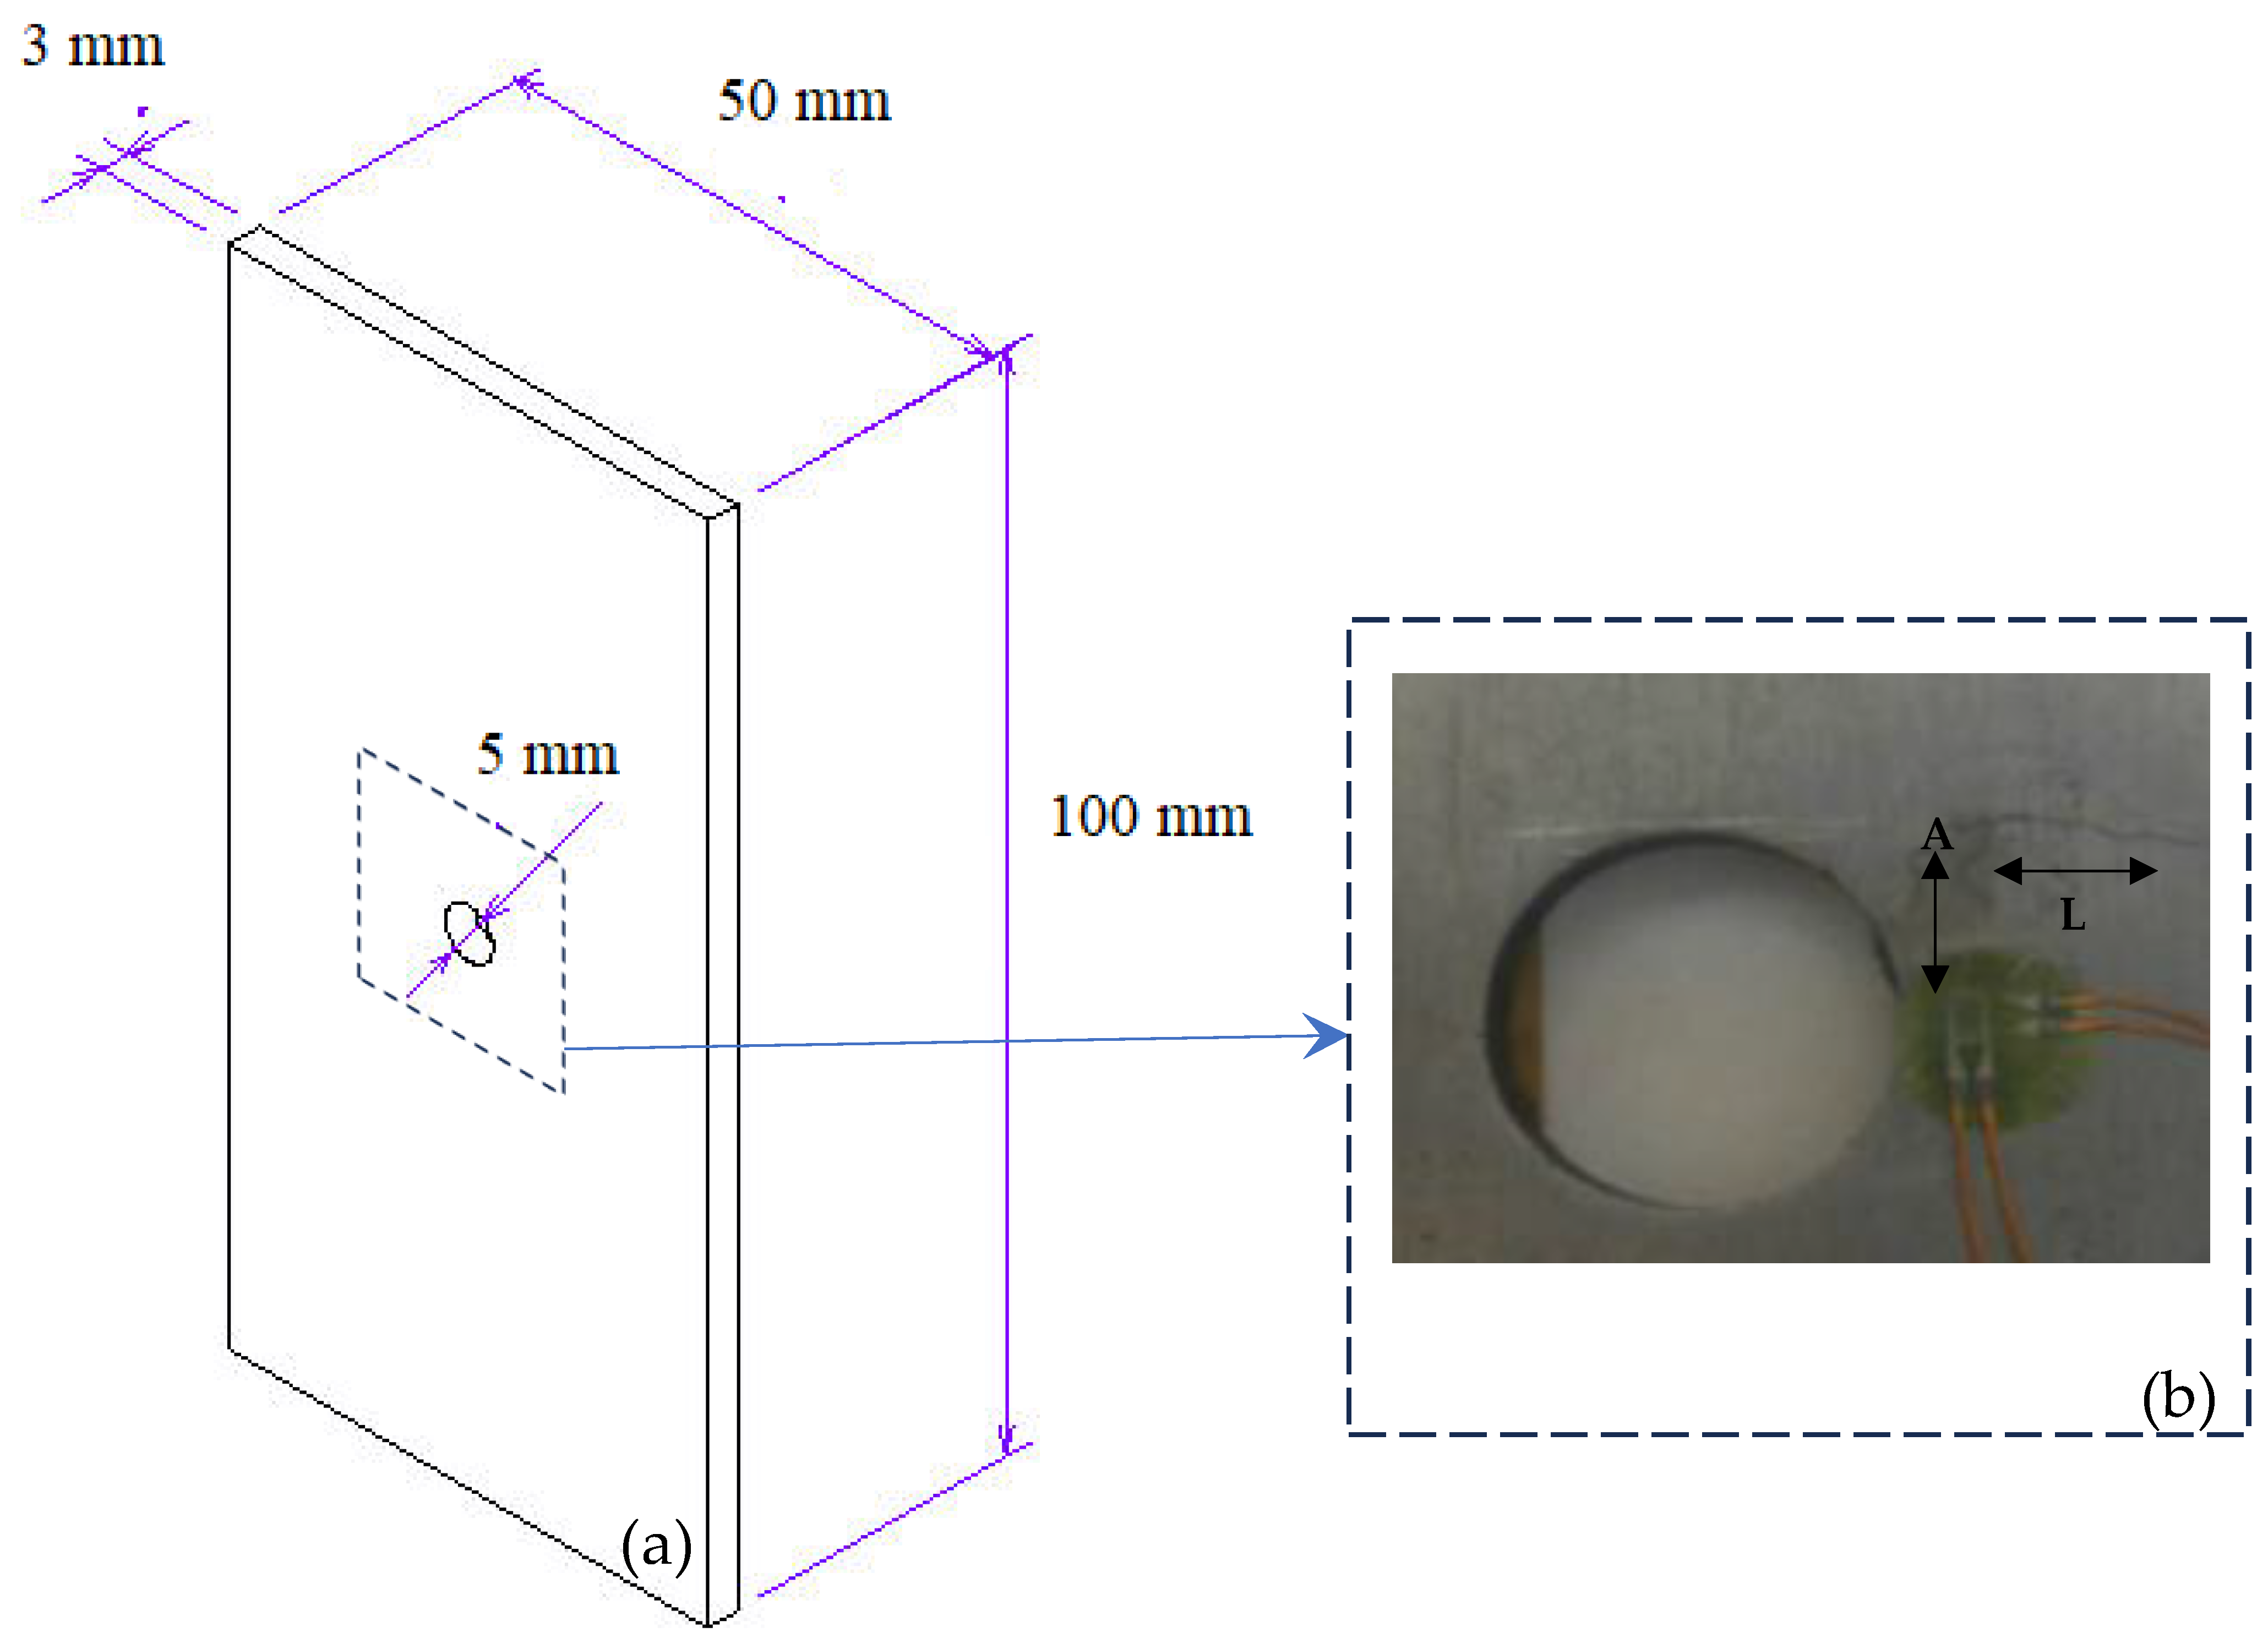
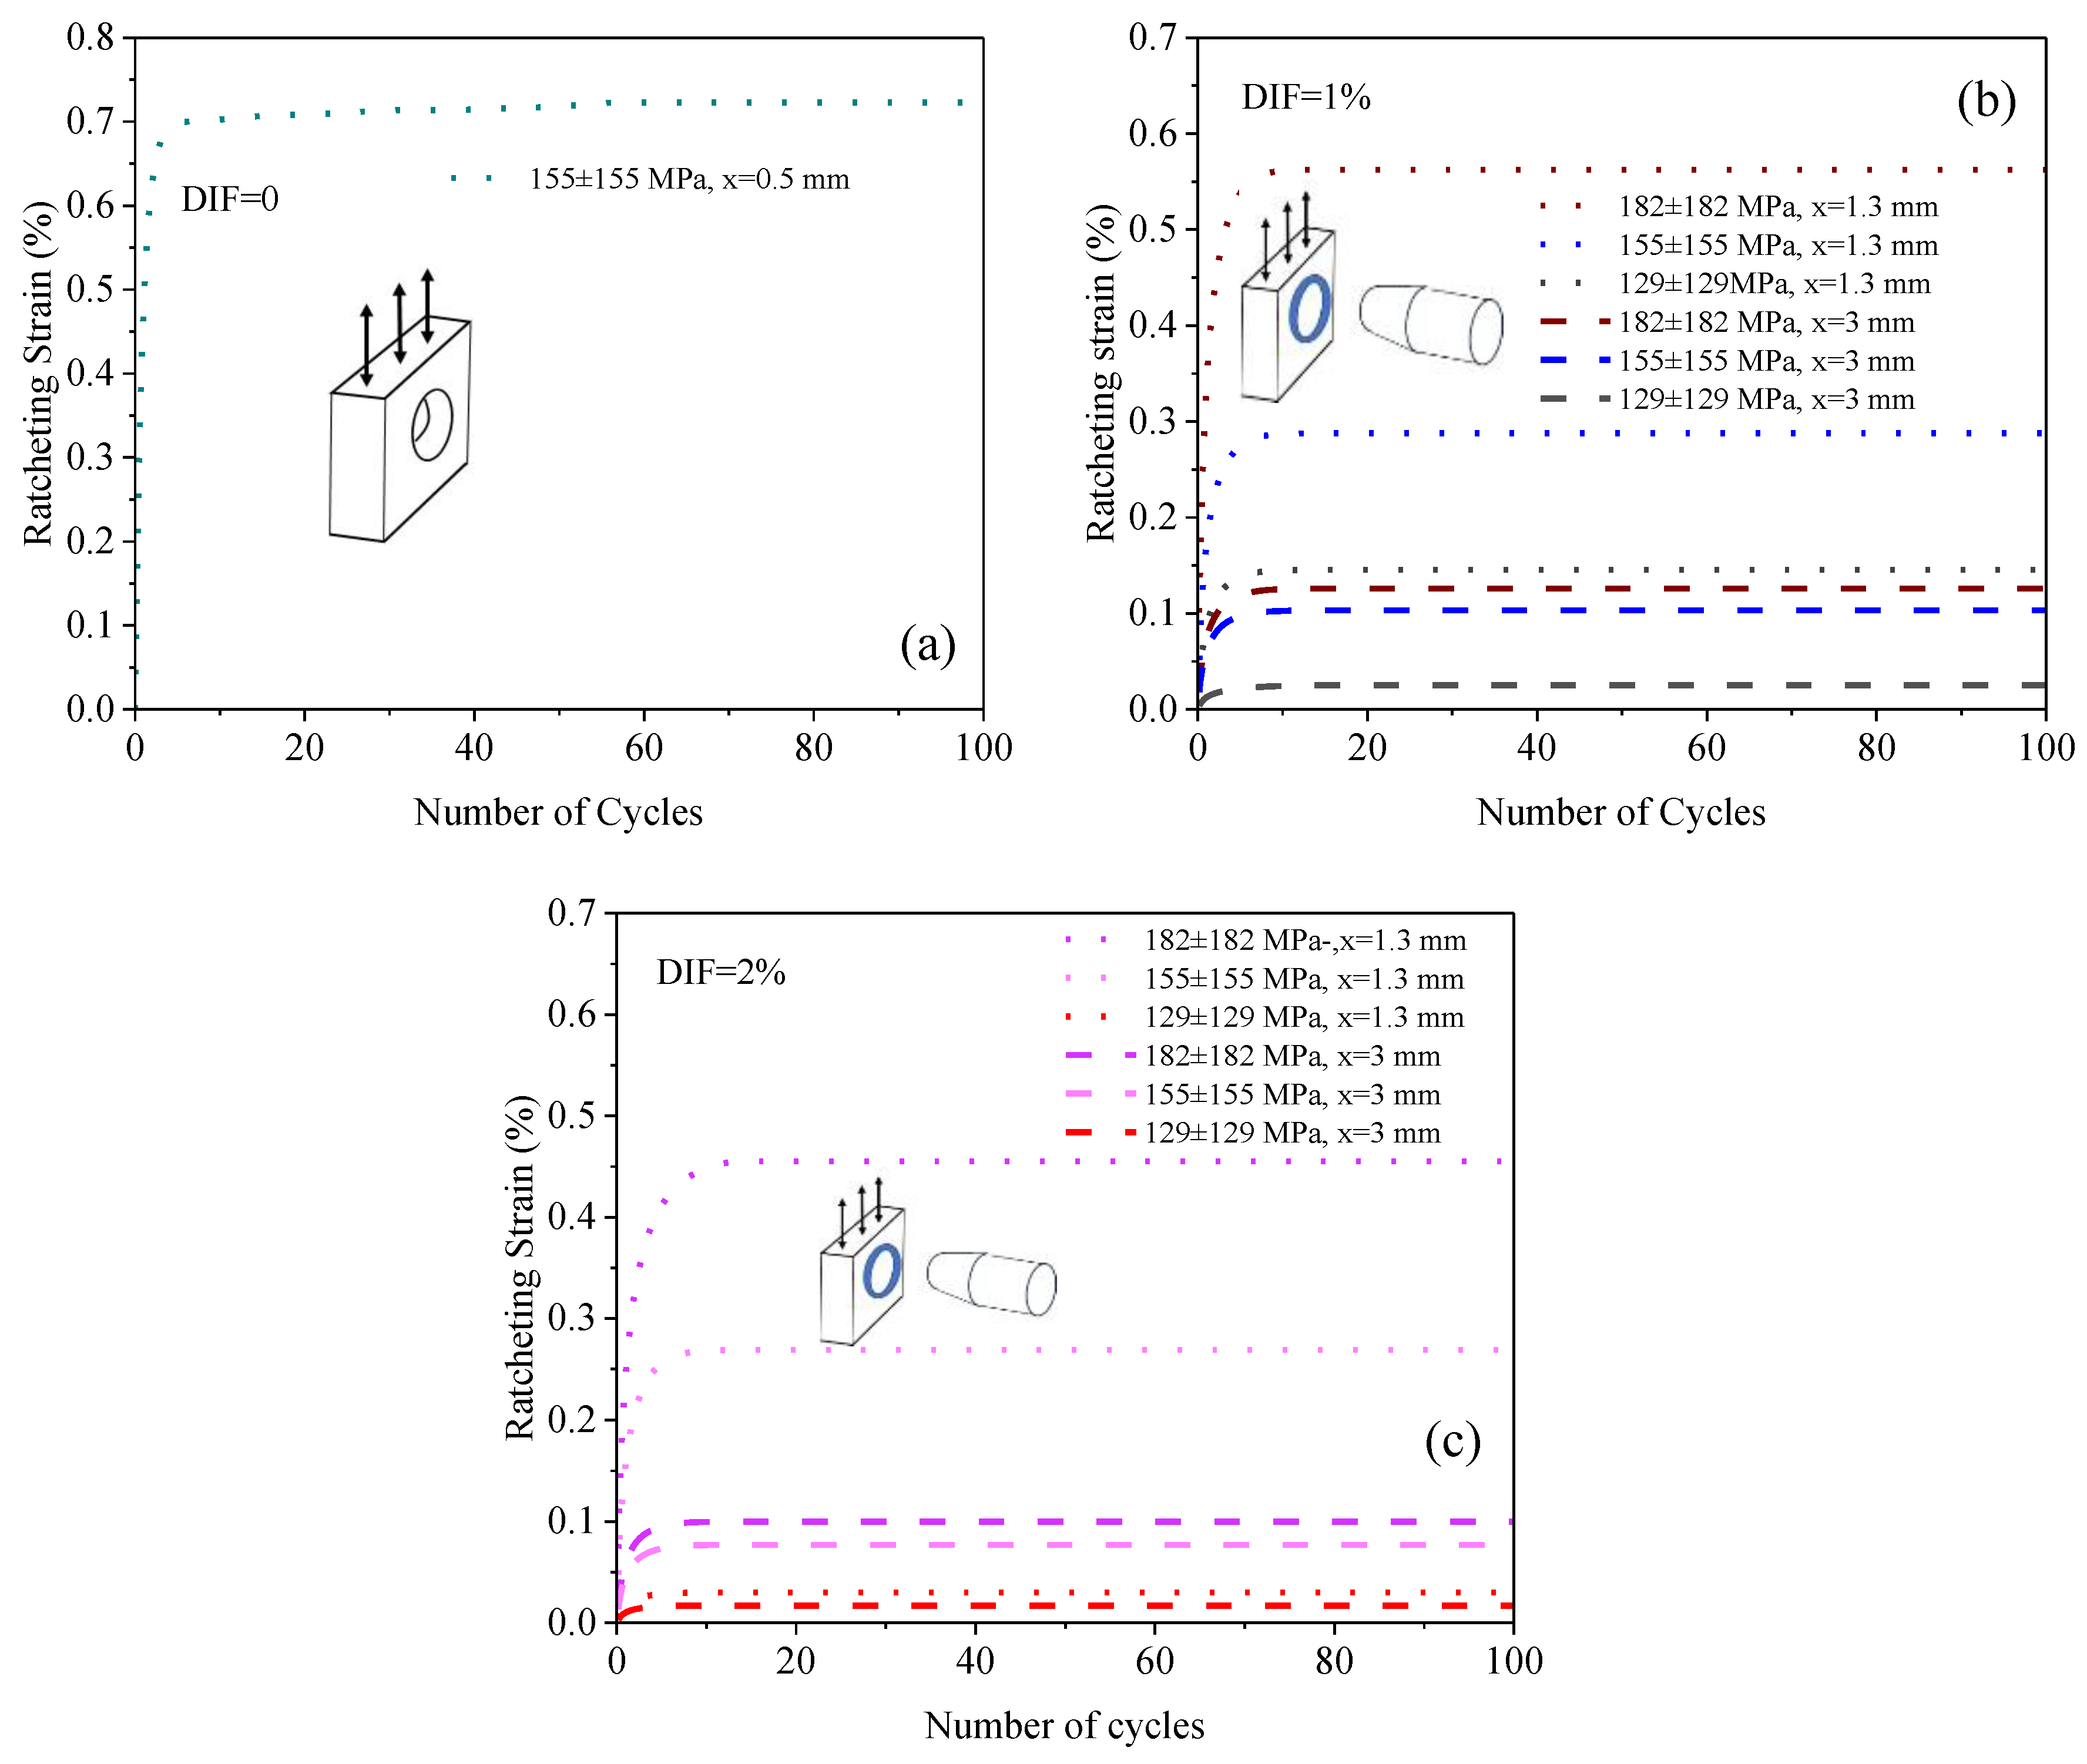
To analytically evaluate the ratcheting response of press-fitted and non-press-fitted Al7075-T6 samples under asymmetric loading cycles, two sets of ratcheting data were employed (i) tests conducted on notched Al7075-T6 aluminum samples with notch diameter d = 5 mm subjected to 155 ± 155 MPa with DIF = 0 (non-press fitted), and (ii) tests conducted on notched aluminum samples (d = 5 mm) with DIF = 1% and 2% subjected to uniaxial stress cycles. DIF was defined as the difference in the diameters of the notch on the aluminum plate and the steel pin divided by the notch diameter. The former test set was conducted by the second author’s research group and the latter test data were reported by Chakherlou et al. [28]. They reported modulus of elasticity and yield stress for Al7075-T6, respectively, as 71.5 GPa and 503 MPa. In their cyclic tests, strain gauges were mounted at different distances from the notch root to measure local strains. Press-fitted samples were tested at distances x = 1.3 and 3 mm from the notch roots. For the unpinned sample, the local strain was measured using strain gauges mounted as close as distance x = 0.5 mm from the notch root. Figure 1 presents plate sample geometry, notch root, and strain gauges (double strain gauge) mounted in the vicinity of the notch (x = 0.5 mm). Cyclic tests were carried out under uniaxial stress-control tests by a Roell fatigue testing machine at room temperature with a stress ratio of R = 0 and the testing frequency of 0.5 Hz. The use of a double strain gauge confirmed the biaxiality state of stress at the notch root [31]. Local strains were measured along axial (A) and lateral (L) directions. Local strains measured by an axial strain gauge along the A-direction were found noticeably larger than those measured values by the stain gauge along the lateral direction. Due to very small values of local strains measured by the lateral strain gages, (nearly zero values), the state of stress at the notch root was assumed to be dominantly controlled along the axial direction. Local ratcheting analysis was mainly assessed based on the readings of the axial strain gauge. Cyclic tests were conducted after detaching press-fitting pins from the holes. This curtailed the possible involvement of shear and frictional loads (fretting fatigue) in the hole–pin interface. Local axial ratcheting strains measured for unpinned and pinned Al 7075-T6 samples at various stress levels are presented in Figure 2.
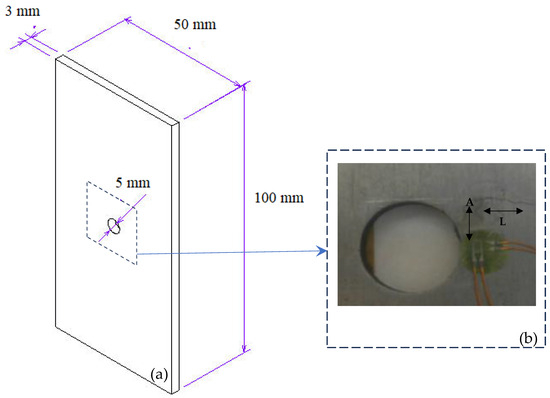
Figure 1.
(a) Sample geometry and (b) photo of strain gauges mounted at notch root of tested plate sample.
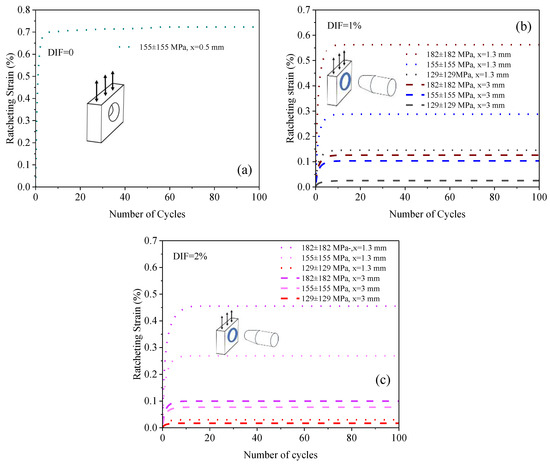
Figure 2.
Measured axial ratcheting data versus asymmetric loading cycles for Al 7075-T6 pinned and unpinned samples tested at various stress levels and distances from notch roots. (a) Unpinned sample (DIF = 0%), x = 0.5 mm, (b) pinned samples (DIF = 1%), x = 1.3 mm and x = 3 mm, and (c) pinned samples (DIF = 2%), x = 1.3 mm and x = 3 mm [28].
3.2. Kinematic Hardening Rule Coefficients
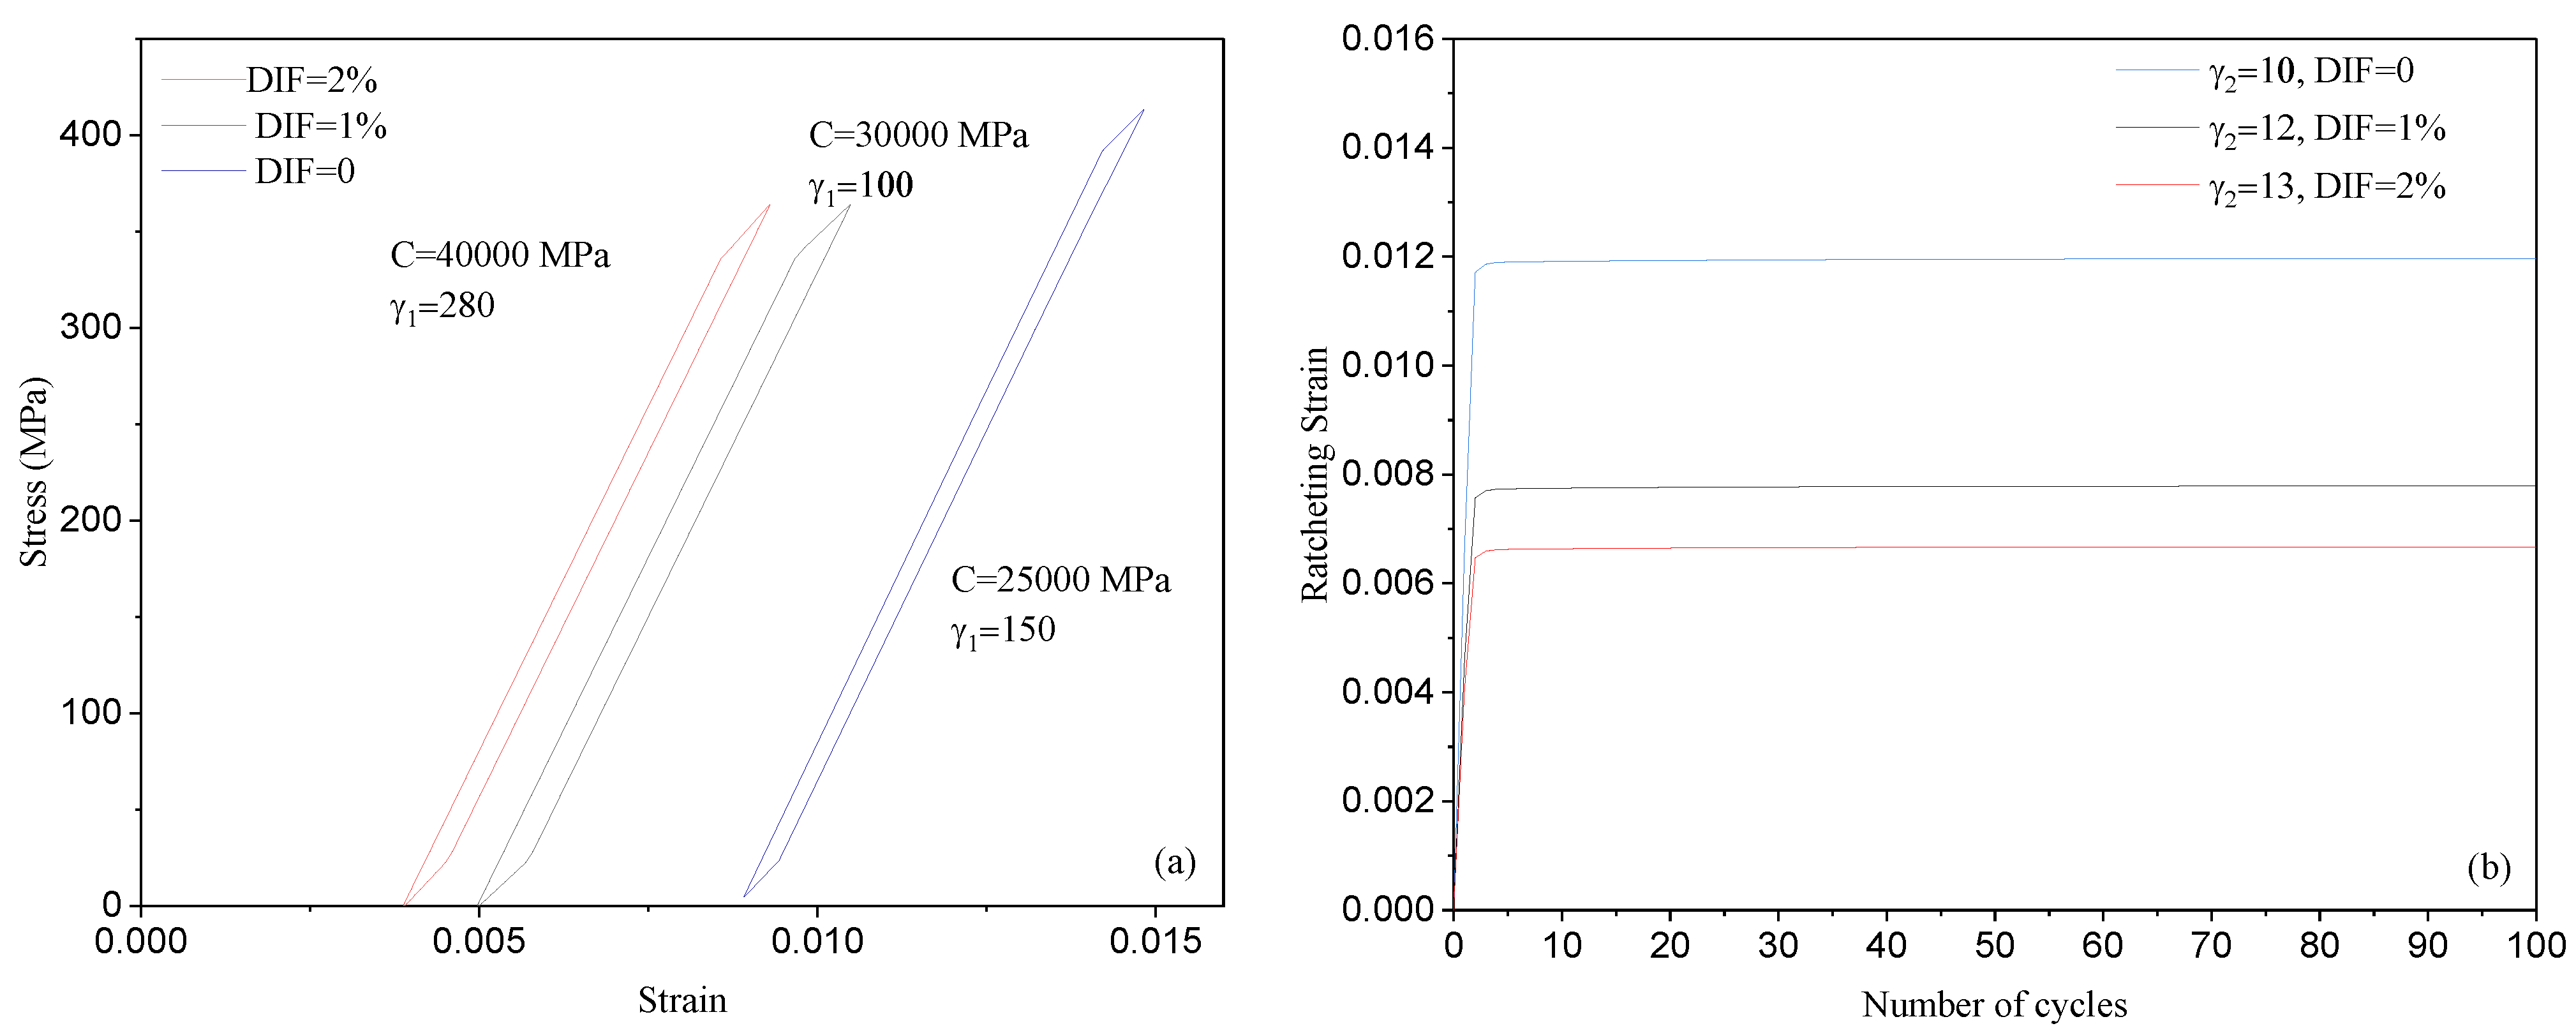
Coefficients C, , and in the A-V kinematic hardening model were determined for Al7075-T6 at different DIFs of 0%, 1%, and 2%. Figure 3a presents stress-controlled hysteresis loops for the second stress cycle generated at different DIFs. Through the A-V model, the highest value of C = 40,000 MPa was achieved for the sample with DIF = 2%, while this coefficient was found 30,000 and 25,000 MPa for DIF = 1% and 0%, respectively. Samples tested with DIF = 2% exhibited a hysteresis loop with the least amount of ratcheting strain, whereas DIF = 0% resulted in the greatest amount of ratcheting strain. Coefficients C and for different DIFs are presented in Figure 3a. Predicted ratcheting curves for DIF = 0%, 1%, and 2% are presented in Figure 3b. The lowest value of in this figure belongs to the sample tested with DIF = 0% with a higher ratcheting magnitude. Coefficient increased in magnitude as DIF increased. This led to greater resistance of the press-fitted holes against ratcheting.
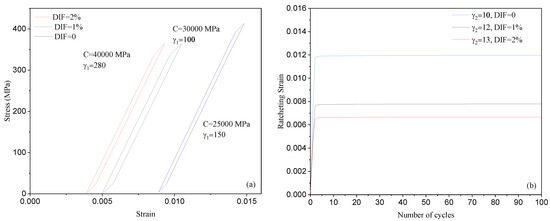
Figure 3.
The A-V hardening rule coefficients for unpinned (DIF = 0%) and press-fitted/pinned (DIF = 1% and 2%) Al 7075-T6 samples: (a) coefficients C and , and (b) coefficient .
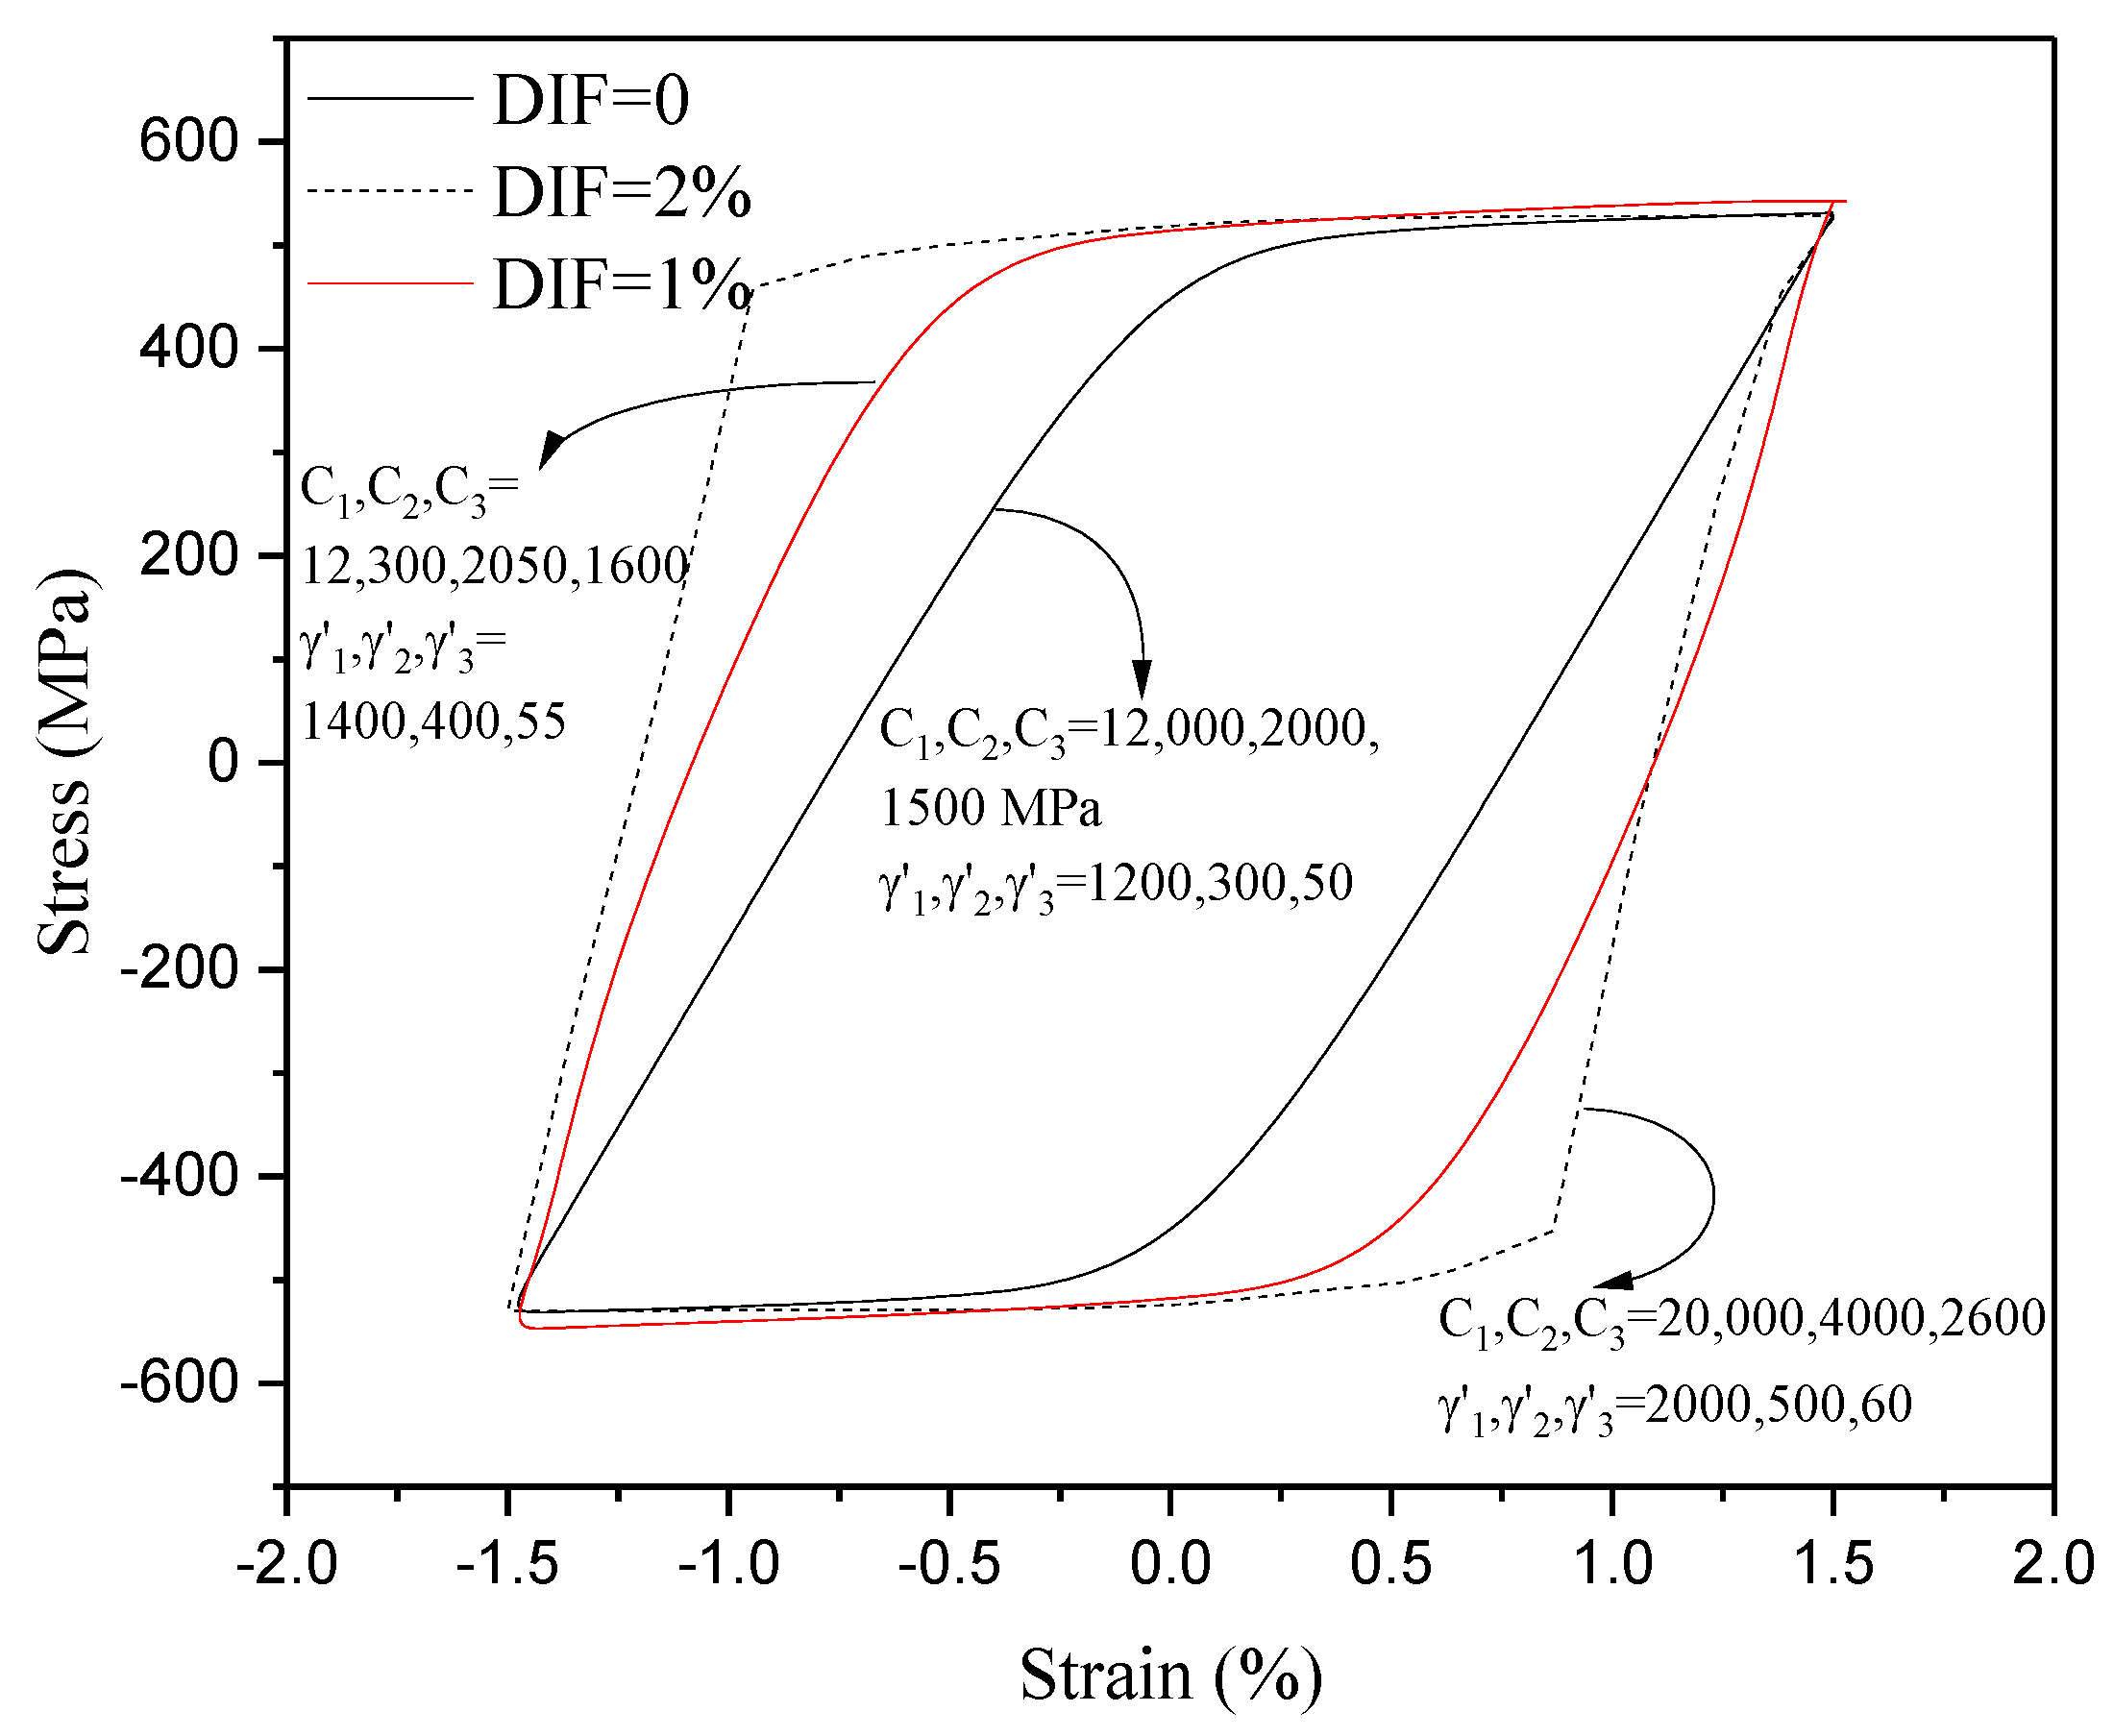
Coefficients of Chaboche’s models (, , and , , ) were derived using the stress–strain hysteresis loop measured from a strain-controlled cyclic test conducted at [32]. These coefficients were initially taken from a work published by Benedettia et al. [33]. More accurate values of these coefficients were then determined through several trials to achieve a close agreement between the predicted and measured loops. The method to determine these coefficients is given comprehensively in an earlier published work [11]. The strain-controlled loop and coefficients and for the Al7075-T6 sample with DIF = 0% are presented in Figure 4. In this figure, for DIFs of 1% and 2%, the coefficients were defined through several trials to preserve strain-controlled hysteresis loops within and to maintain the elastic and plastic moduli of press-fitted samples consistent to those estimated through simulated stress–strain curves presented in Figure 5.
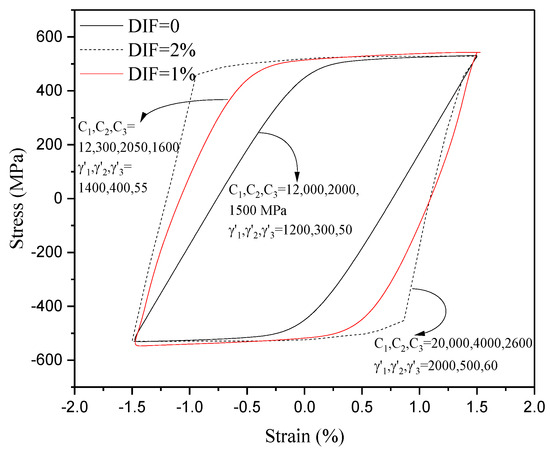
Figure 4.
Strain-controlled hysteresis loops to determine Chaboche’s coefficients and for unpinned sample (DIF = 0) and pinned samples (DIF = 1% and 2%) of Al7075-T6 alloy.
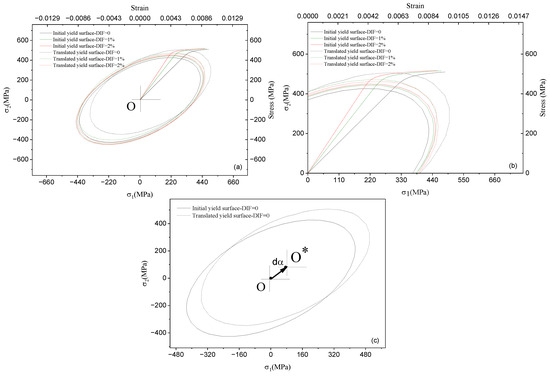
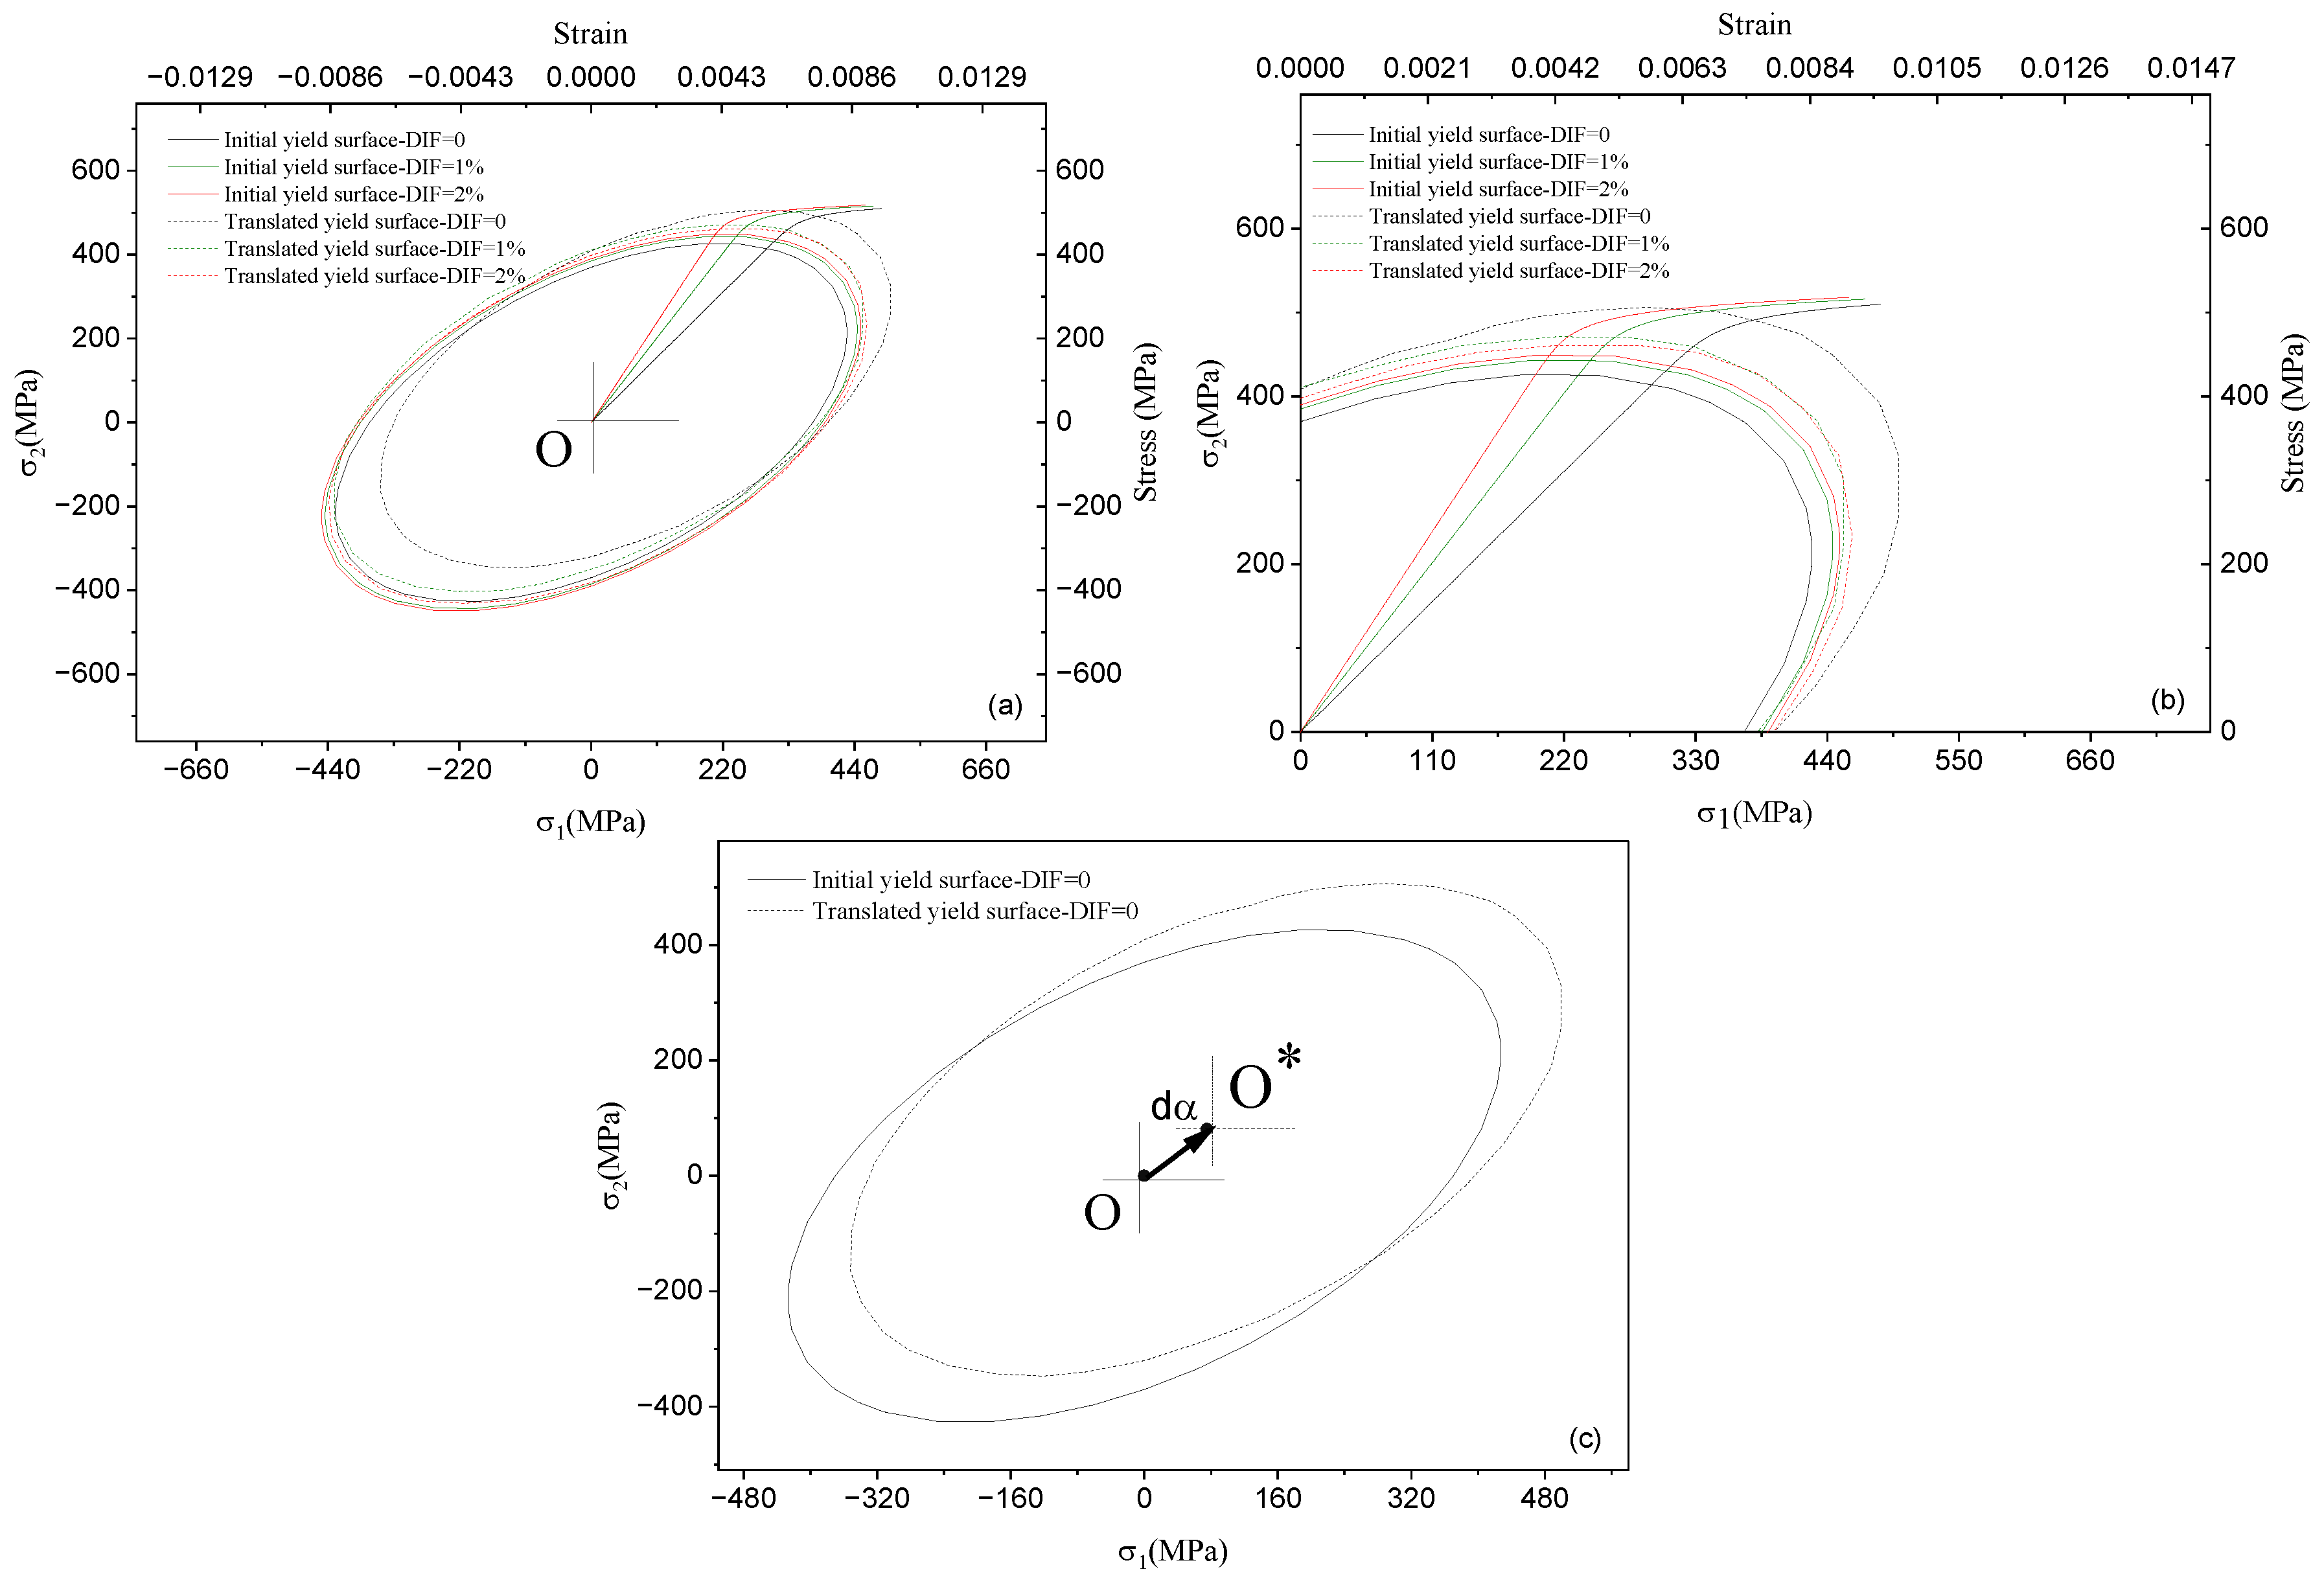
Figure 5.
Initial and translated yield surfaces based on the A-V hardening rule for different DIFs Al 7075-T6 samples. (a) Yield surface evolution, (b) intercepts of yield surfaces and stress–strain curves in the first quadrant, and (c) yield surface center O was translated to the center O* through the backstress increment for a test sample with DIF = 0.
3.3. Yield Surface Evolution
The onset of yielding for Al 7075-T6 was initially contoured by the von-Mises criterion. The isotropic hardening model expanded the concentric surfaces with no changes in the center of yield surfaces as stress magnitude exceeded the materials yield point. Through the kinematic hardening rule, the yield surface was translated with the backstress increments. The yield surface translation was governed by the A-V hardening rule through an internal variable and in the dynamic recovery term of the model. The yield surface movements, however, in Chaboche’s model were controlled as backstress components were integrated through the postulation . Term and postulation acted functionally equivalent in moving yield surfaces during loading over the plastic domain. Figure 5 presents the yield surface translation based on the A-V hardening rule for different testing materials with DIFs of 0, 1%, and 2%. This figure includes stress–strain curves developed by the Ramberg–Osgood equation [30], at which materials constants for Al7075-T6 are taken from [34]. The yield translation in Figure 5c is presented for the plane stress condition and in a two-dimensional coordinate system. The principal stresses and in this figure demonstrate the direction and magnitude of this translation from the initial yield surface center O to a new position O* through the backstress increment . For different DIFs, the initial yield surfaces intercepted stress–strain curves at elastic limits representing the onset of yielding contoured by the von-Mises criterion. The yield surfaces at the press-fitted hole region possessed different stress and strain values as materials at the notch roots of pinned samples showed more resistance against materials deformation and yielding. The yield surface for DIF=0 initially owned lower onset of yielding where intercepted with the related stress–strain curve. Through the A-V hardening rule, the yield surface, however, was translated largely into deviatoric stress space. For press-fitted specimens with initially larger yield stresses, this translation was found relatively lower in magnitude. This was found consistent with the fact that the backstress increments dropped as the degree of interference fit increased.
3.4. Backstress Evolution with Loading
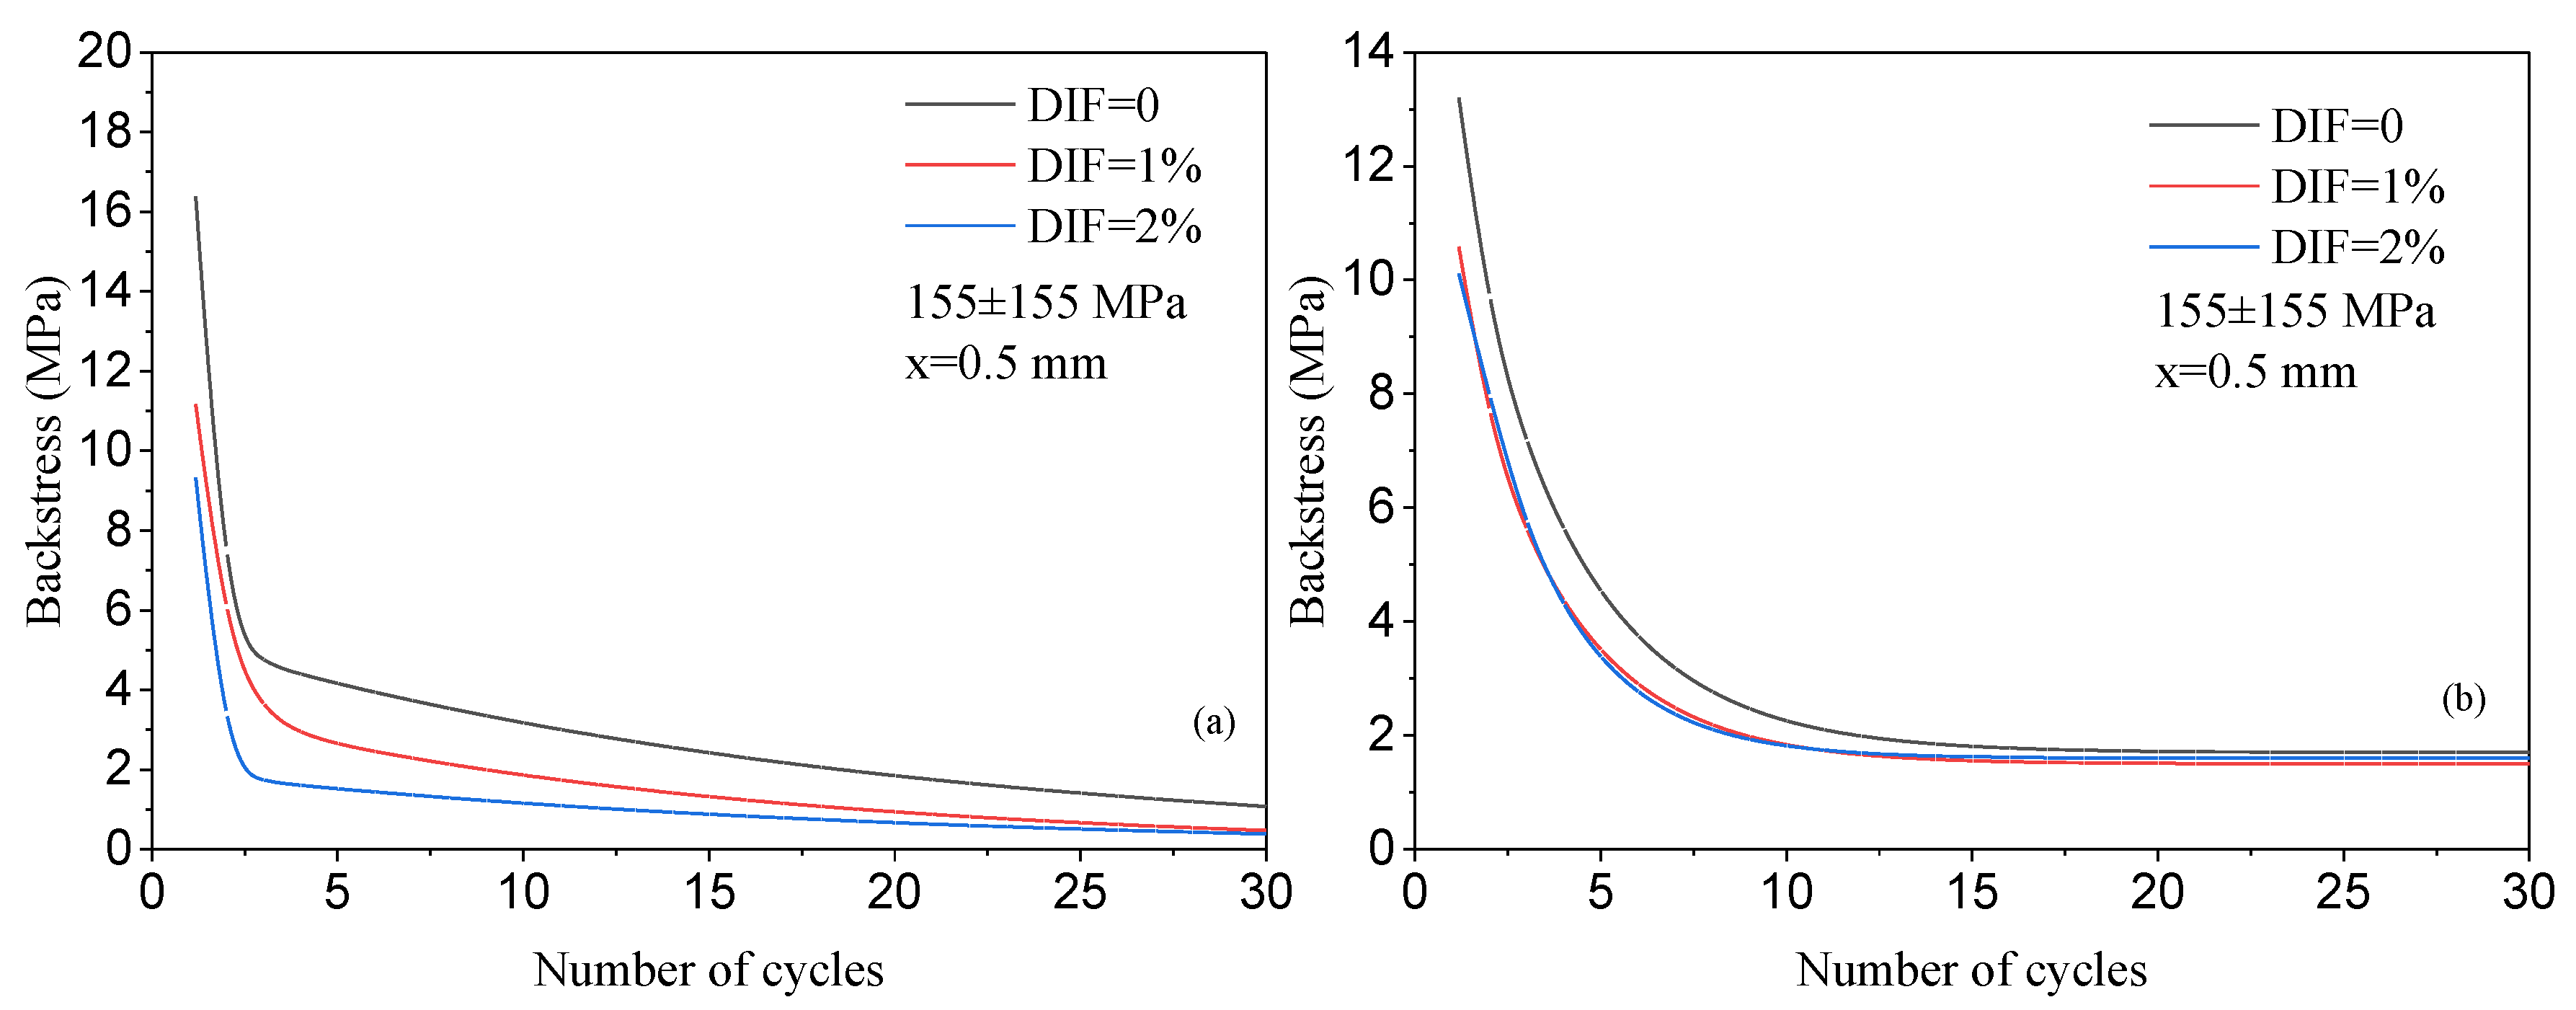
The A-V and Chaboche kinematic hardening rules were used to control the evolution of backstress over the loading process. The ratcheting and plastic strain increment , during asymmetric loading cycles, were controlled by the backstress and the internal variable . In the dynamic recovery term of the A-V model, the term −δ gradually got stabilized in magnitude as the number of loading cycles increased. Term −δ in the A-V model is comparable to Chaboche’s integration of backstress increments . Figure 6 illustrates the evolution of the backstress term (−δ) over the first 30 loading cycles applied to Al7075-T6 samples with different DIFs. This graph demonstrates a sharp decline in the backstress term −δ over the first few cycles. After the initial loading cycles, a steady state was reached consistent with an approximate plateau of stress–strain curve formed as the plastic strain increased. A drop in backstress with loading cycles for stainless steel samples was also reported by Zhou et al. [35] and Rajaeian and Parsa [36]. They reported an initial increase of backstress during the first several cycles and then a drop in backstress over the longer number of cycles leading to a stabilized condition or a continuous decrease of backstress to the fracture stage. The steady state in backstress evolution may also be attributed to the interaction of dislocations beyond the yielding point resulting in a reduction in the ratcheting strain rate. The graph clearly shows that backstress decreases with increasing DIF from 1% to 2%. The unpinned sample (DIF = 0) possessed the highest backstress curve.
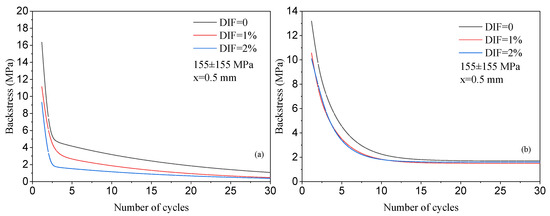
Figure 6.
The evolution of backstress over loading cycles on unpinned sample (DIF = 0) and Pinned samples (DIF = 1% and 2%) of Al7075-T6 tested under 155 ± 155 MPa based on (a) the A-V model through term , and (b) the Chaboche model through postulation .
3.5. Finite Element Analysis and Stress Distribution
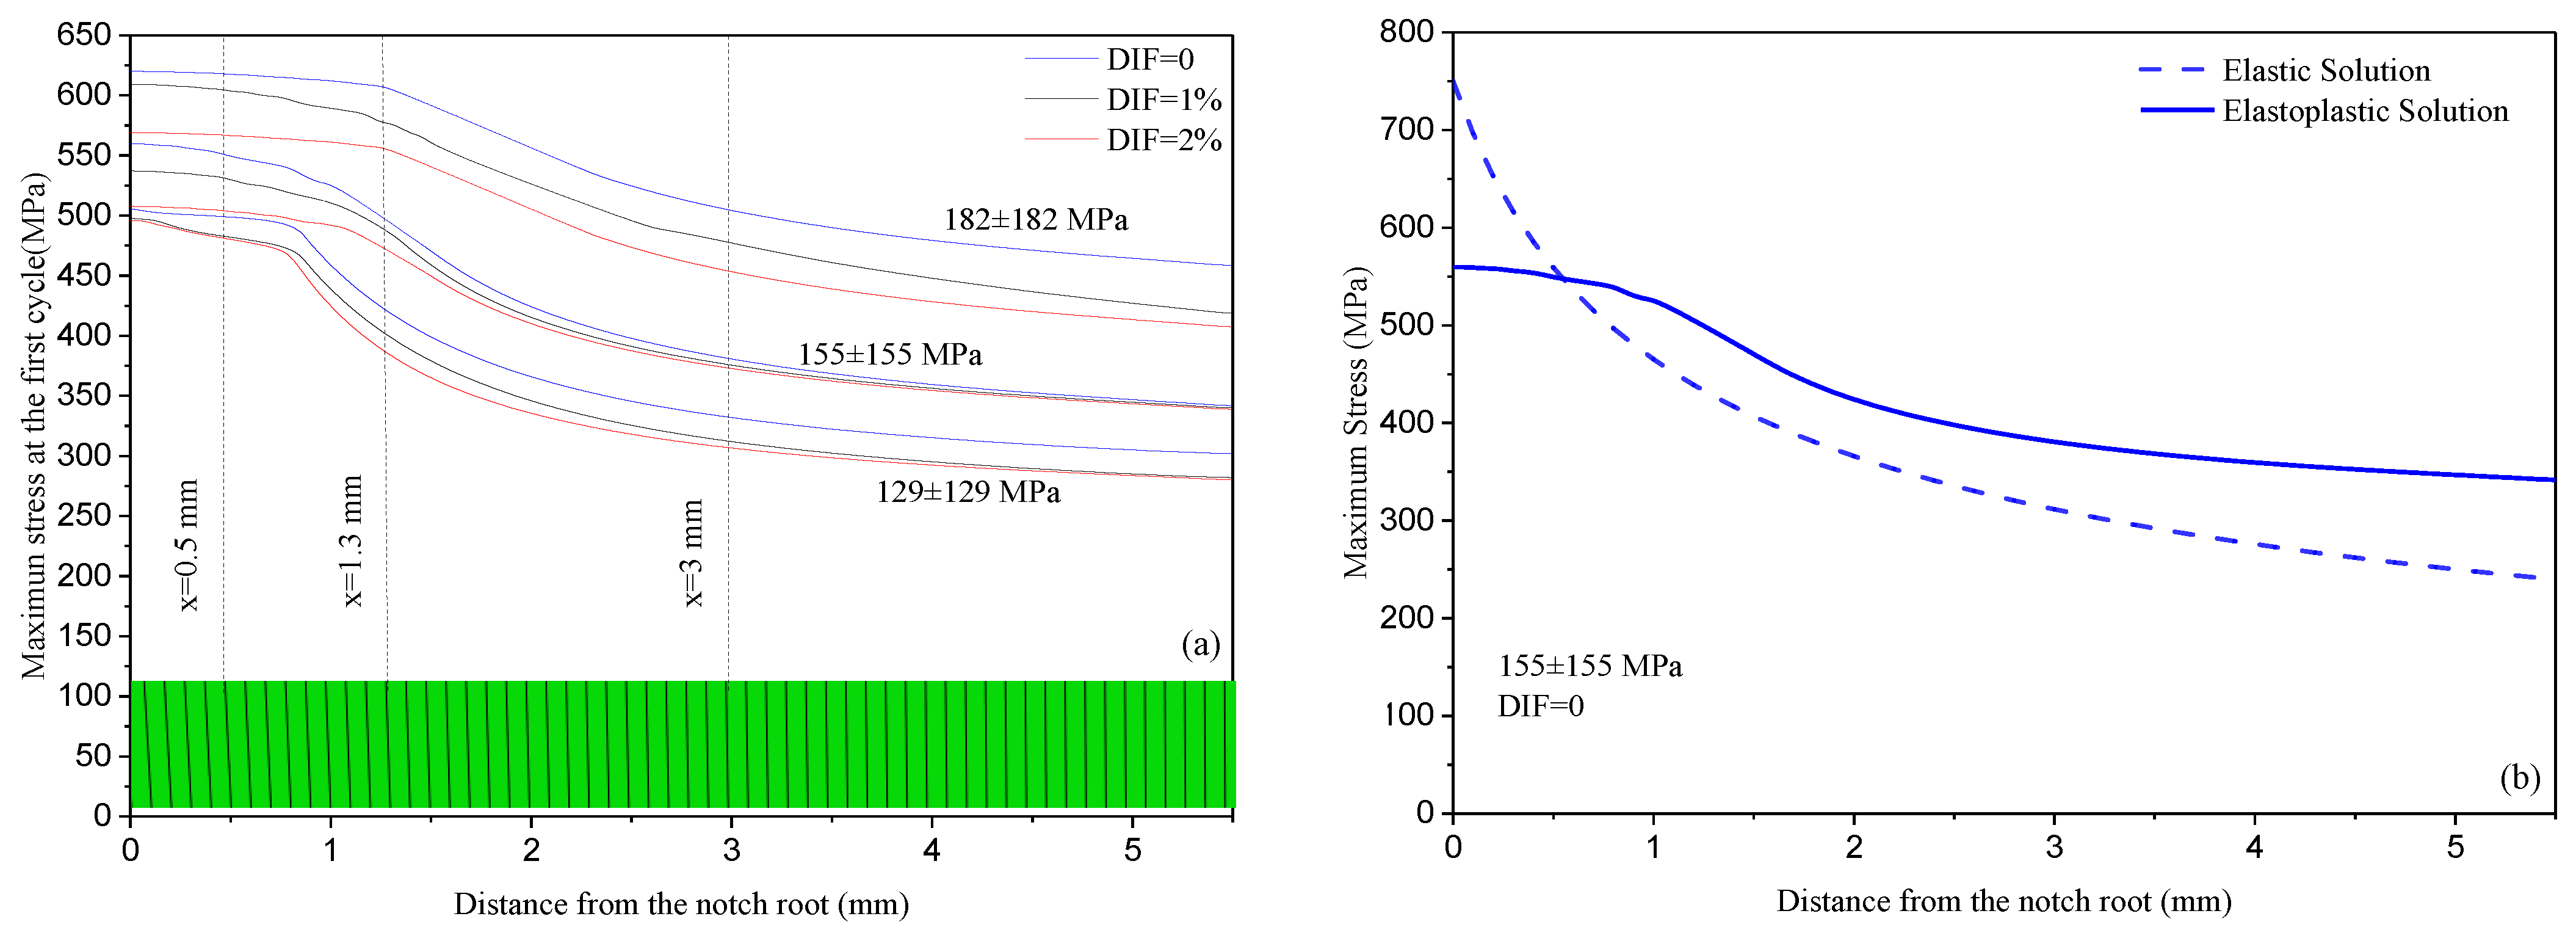
To map the notch root region and to determine its stress distribution, finite element analysis was employed using ABAQUS software version 6.13 [37]. The notched specimen was meshed with quadratic elements, and the constraints were placed to block its motion at one end as shown in Figure 7. The upper-end surface of the specimen had its translational and rotational axes restrained along the X- and Z-axes, while the specimen let to carry the load along the Y-axis. Uniaxial loading cycles were applied to the specimen′s upper end under the stress-controlled condition. Eight nodes per brick element were designed with the quadratic elements of type C3D8R, and 3 degrees of freedom per node, resulted in 24 degrees of freedom. As the FE was run at various applied stress levels and notch sizes, the smallest element size of 0.1 mm near the notch root led to a consistent convergence. The stress distribution curves over distances from the notch roots are presented in Figure 8. The stress distribution was numerically analyzed through the non-linear materials model of Chaboche within the elastoplastic domain. In this figure, the quadratic elements near the notch root and their corresponding stresses are marked at x = 0.5, 1.3, and 3 mm. In this figure, quadratic elements are demonstrated through distances x from the notch roots. This figure shows that as the DIFs increase 0 → 1% → 2% for various applied stress levels, the curves fall to lower levels. The simulated stress values through the FE analysis have been taken as input values at given distances x to predict local ratcheting at the press-fitted hole region of Al 7075-T6 samples. At farther distances x, the stress magnitudes stayed nearly constant. This was also evidenced earlier [31] for distances from the notch roots at which no further drop in the stress level was observed. Figure 8b compares the stress distribution curves based on the elastoplastic and elastic solutions for an Al 7075-T6 aluminum sample (DIF = 0) tested at MPa. The solid curve was simulated through Chaboche’s non-linear model for the elastoplastic response at the notch root distances. The dashed curve in this figure represents the elastic solution proposed earlier by Neuber’s elastic theory [38] and a recent work by Chmelko et al. [39]. The elastic solution in Figure 8b dropped to a lower level at which the stress field was placed dominantly within the elastic domain.
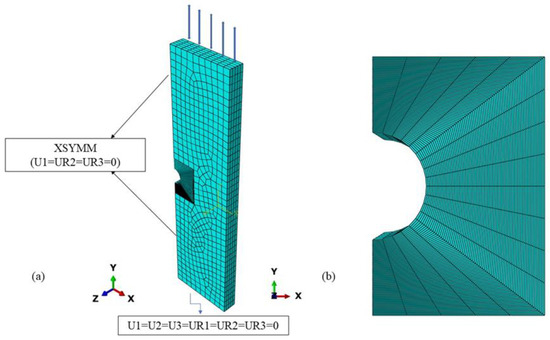
Figure 7.
(a) Meshed notch sample, constraints and loading direction, and (b) the quadratic elements at the notch edge and at various distances from the notch root.
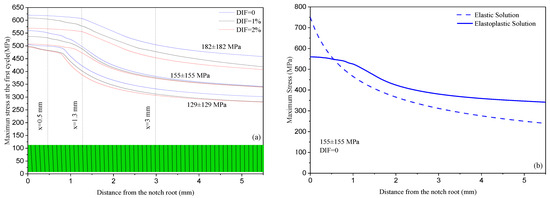
Figure 8.
(a) Stress distribution for the first loading cycles as distance x from notch root increases for unpinned sample (DIF = 0%) and pinned samples (DIF = 1% and 2%) of Al7075-T6 tested under various applied stresses, and (b) elastic and elastoplastic solutions for a typical tested sample (DIF = 0) at MPa.
3.6. Predicted Hysteresis Loops
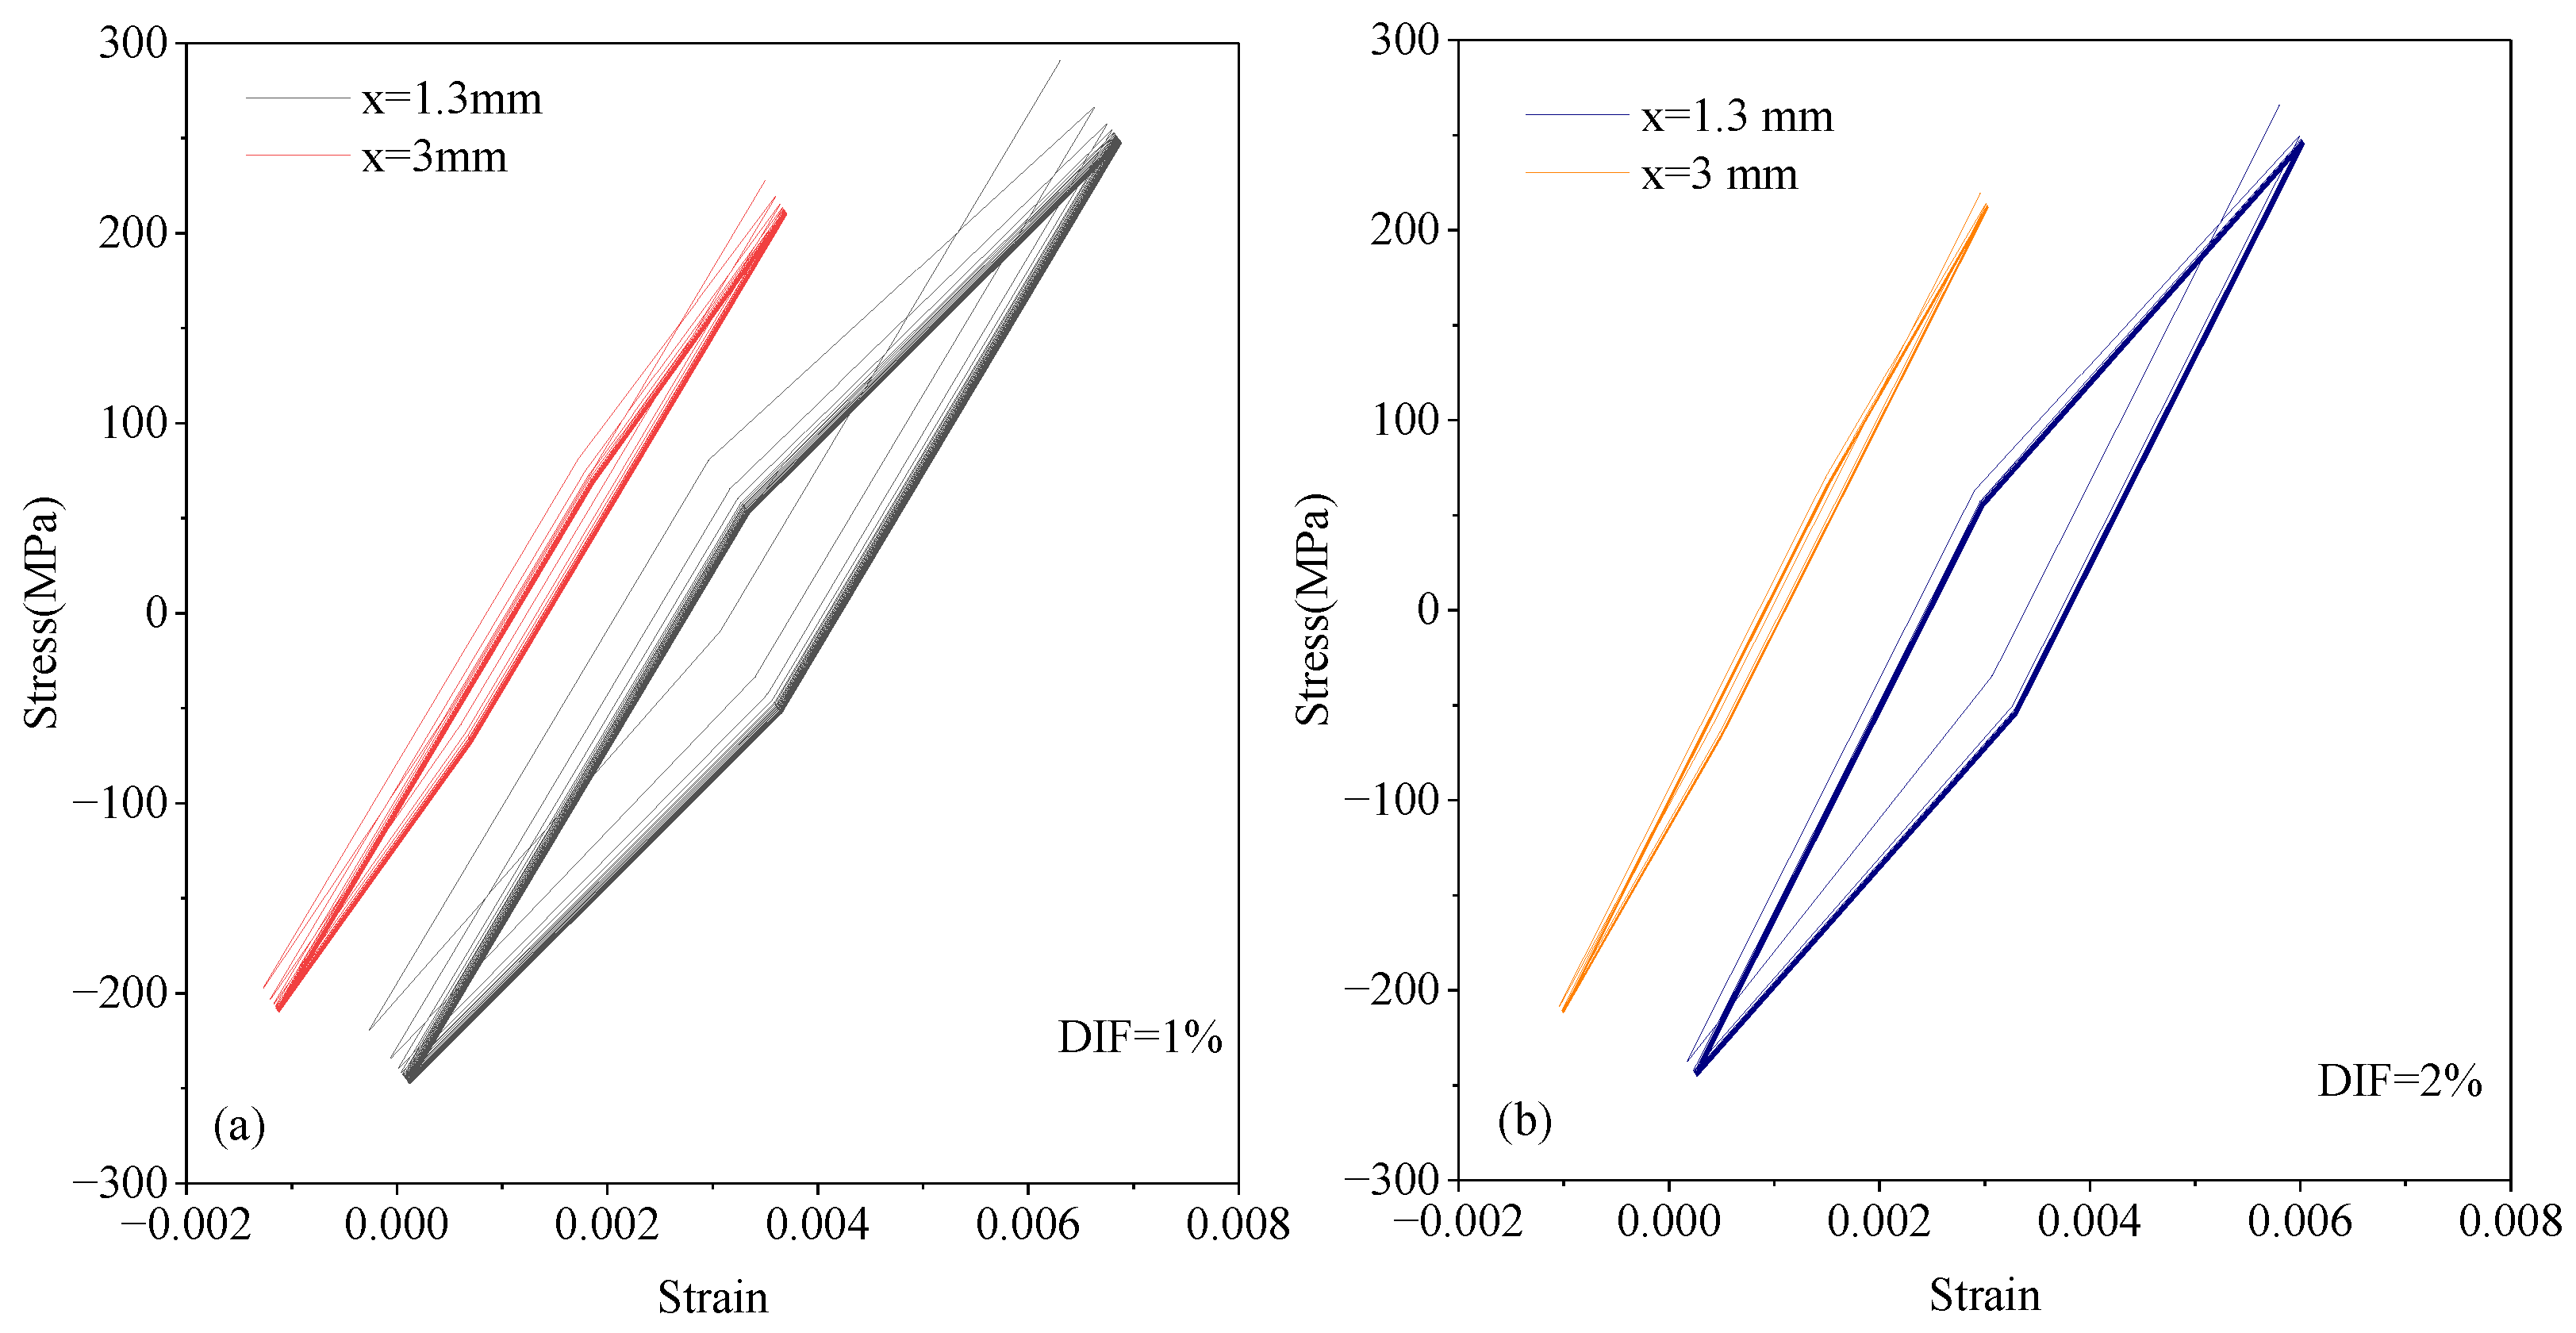
The stress–strain hysteresis loops of Al 7075-T6 samples tested at MPa with DIFs of 0, 1%, and 2% are depicted in Figure 9. These loops are generated at distances of 0.5, 1.3, and 3 mm from the notch roots and during 100 cycles. The vertical and horizontal axes in Figure 9 were scaled to be able to accurately compare/evaluate the plastic strain range at the notch edge region. In this figure, DIF = 2% test owned narrower hysteresis loops whereas the unpinned specimen (DIF = 0) resulted in wider loops. At a given DIF, as distance x increased from 1.3 mm to 3.0 mm, both the stress range and the plastic strain range dropped in magnitudes. Figure 10 compares the hysteresis loops generated at press-fitted samples at the distances x = 1.3 and 3 mm for the DIFs of 1% and 2%. The width of hysteresis loops generated for samples with DIF = 1% through the use of the A-V model was found as large as four times for x = 1.3 mm than that of distance x = 3.0 mm. For DIF = 2%, this difference in plastic strain range at distances 1.3 and 3.0 mm became as high as six times. In Figure 9 and Figure 10, the peaks of progressive loops dropped as the number of cycles increased resulting in stress relaxation events for both unpinned and pinned samples.
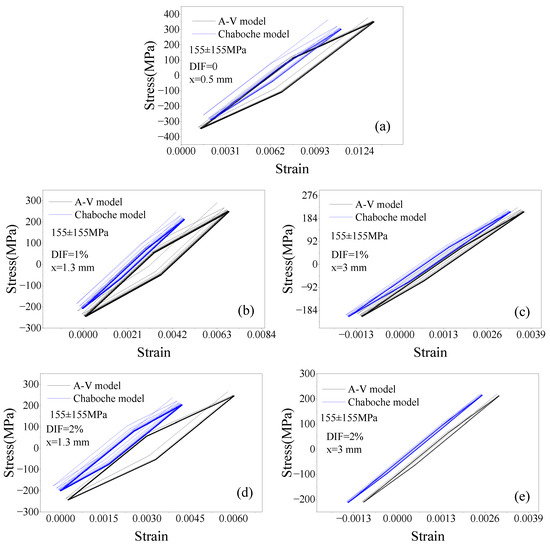
Figure 9.
Predicted hysteresis loops for pinned and unpinned samples of Al7075-T6 tested at 155 ± 155 MPa by means of the A-V and Chaboche kinematic hardening rule: (a) DIF = 0% and a distance of x = 0.5 mm from the notch root (b–c) DIF = 1% and different distances of x = 1.3 mm and x = 3 mm, and (d–e) DIF = 2% and different distances of x = 1.3 mm and x = 3 mm.
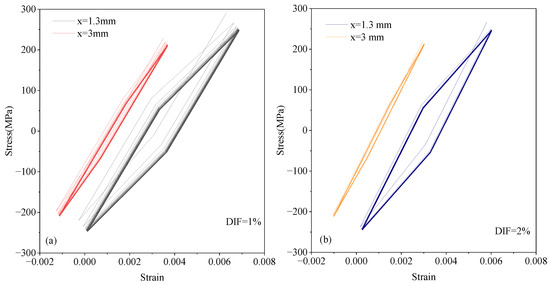
Figure 10.
Predicted stress-controlled hysteresis loops for pinned samples of Al7075-T6 tested at 155 ± 155 MPa by means of the A-V model: (a) comparison of the first 100 loops in DIF = 1% samples at distances x = 1.3 and 3 mm, and (b) comparison of the first 100 loops in DIF = 2% samples at distances x = 1.3 and 3 mm.
3.7. Local Ratcheting Strain Prediction
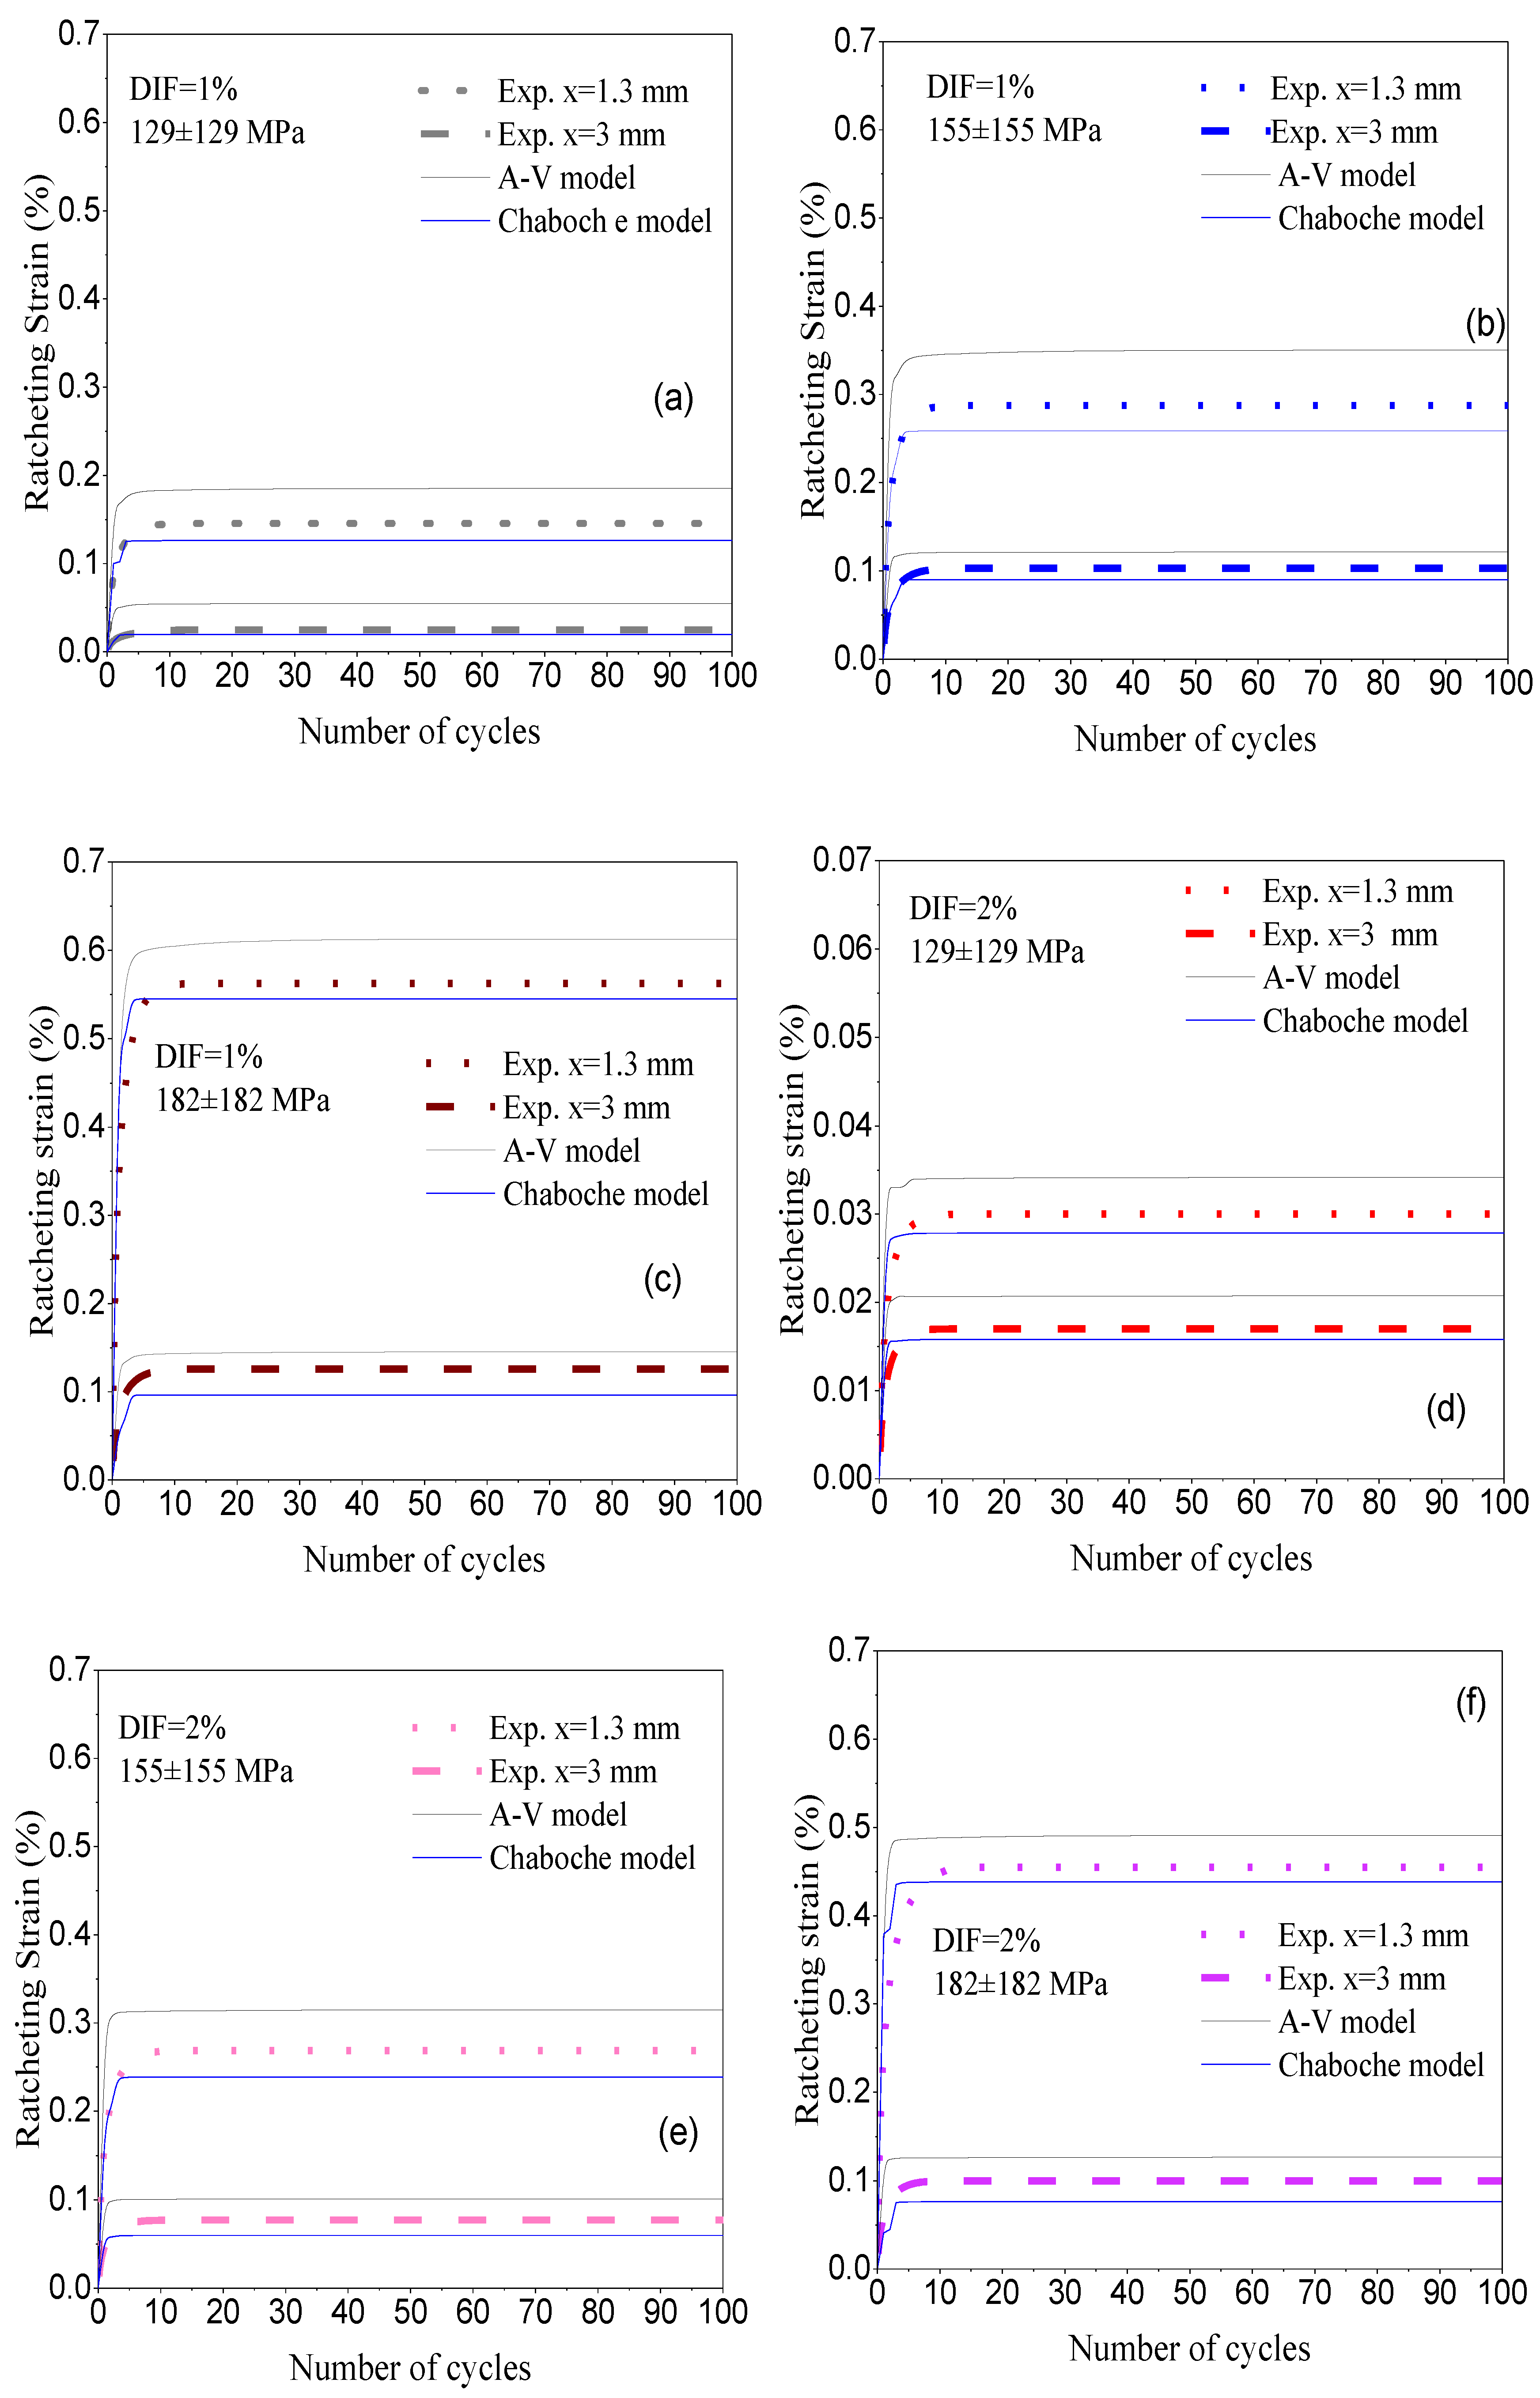
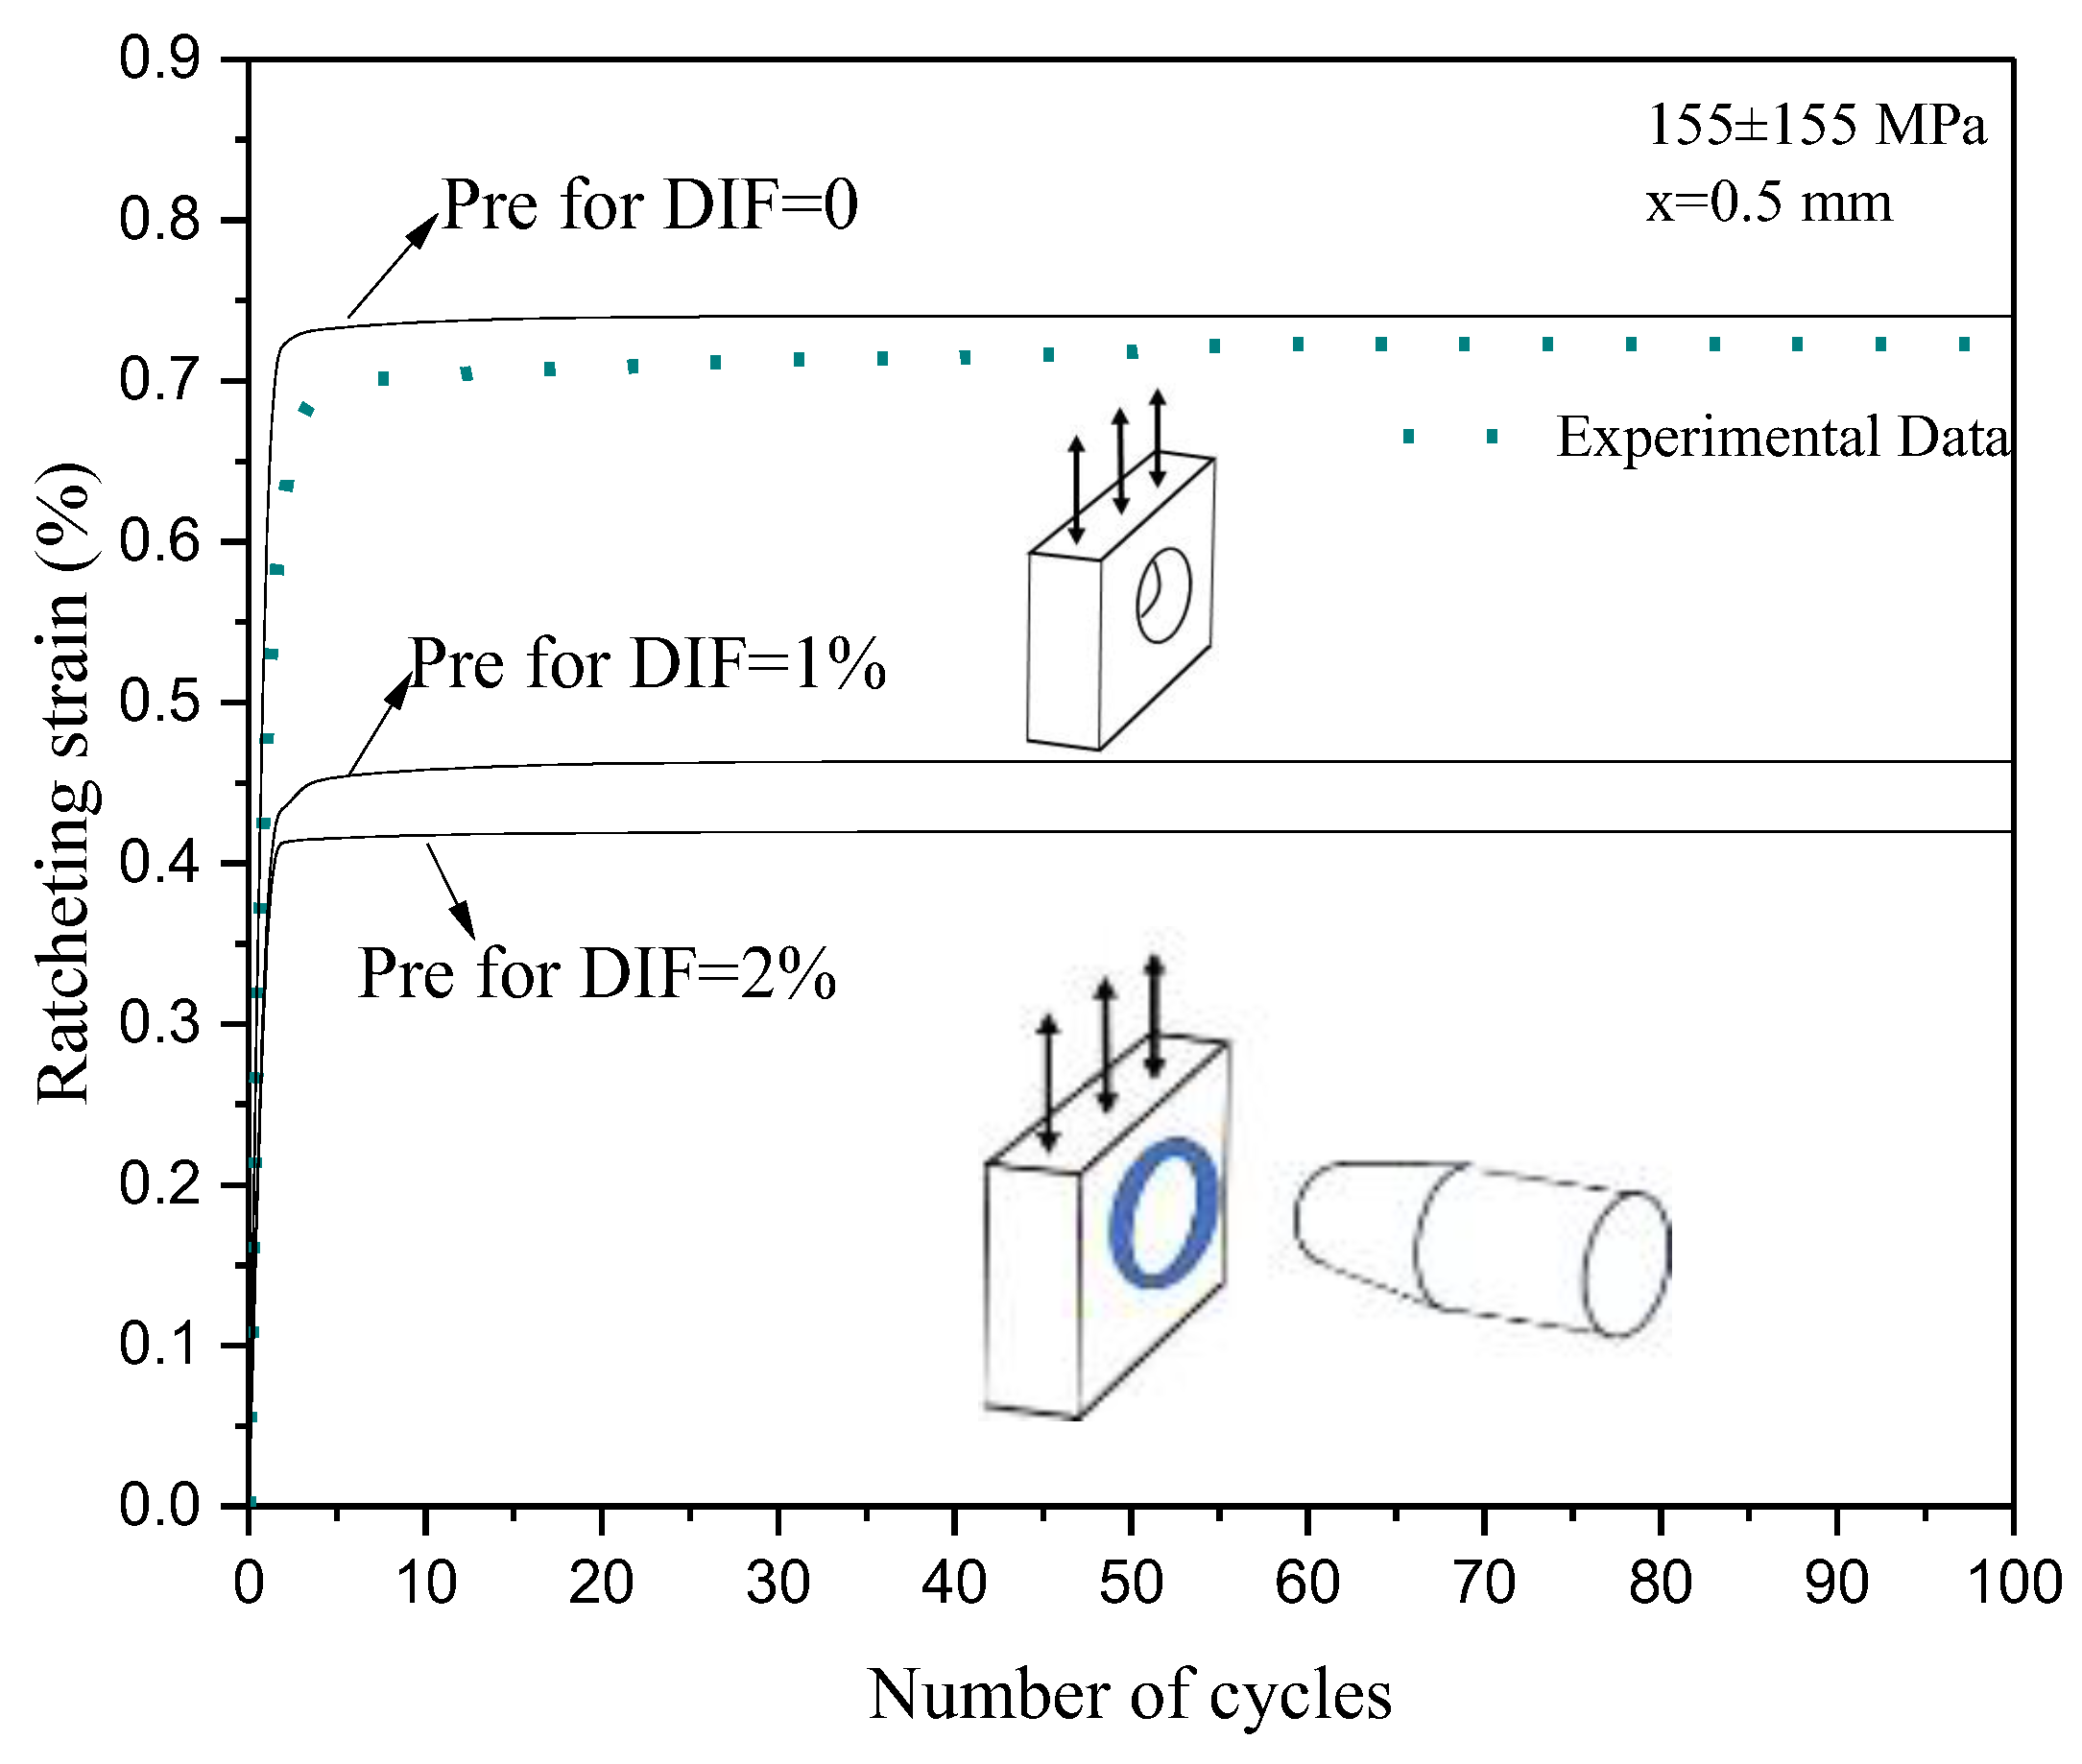
To evaluate the ratcheting response of pinned and unpinned Al 7075-T6 specimens subjected to asymmetric stress cycles, the A-V and Chaboche kinematic hardening rules were coupled with Neuber’s rule. Figure 11 presents the predicted and experimental ratcheting results at various stress levels and DIFs. Over the first few cycles (stage I), the predicted local ratcheting strain showed a sudden increase; shortly after, the ratcheting rate dropped, and the ratcheting progress rate remained almost constant (a plateau in stage II) as the number of cycles increased. This response is attributed to the press-fitted notch edge resisting the ratcheting progress. The predicted ratcheting curves through the A-V kinematic hardening model shifted above the measured values while those predicted by Chaboche’s model fell below the experimental data consistently. The local ratcheting strains dropped in magnitudes as distances x from the notch roots increased. The applied cyclic stress level noticeably influenced ratcheting strain at the notch region. For tests conducted with the DIF = 1%, as stress level increased 129 ± 129 MPa → 155 ± 155 MPa → 182 ± 182 MPa, the A-V predicted ratcheting curve at x = 1.3 mm elevated, respectively from 0.25% → 0.35% → 0.60%. The Predicted ratcheting through Chaboche’s model led to 0.12% → 0.24% → 0.53% at this distance. The predicted ratcheting curves at the notch edge x = 0.5 mm of unpinned (DIF = 0) and pinned samples of Al 7075-T6 (DIF = 1% and 2%) tested at 155 ± 155 MPa are presented in Figure 12. This figure presents a set of measured data for an aluminum sample tested at DIF = 0. In this figure, as the DIFs increased from 0 → 1% → 2%, the predicted local ratcheting at x = 0.5 mm decreased from 0.73% → 0.46% → 0.42%. These results show how the press-fitted samples with DIF = 2% improved materials response against ratcheting as high as 74%. The press-fitted samples slowed down the progressive plastic strain over loading cycles and improved the life of the notched samples.
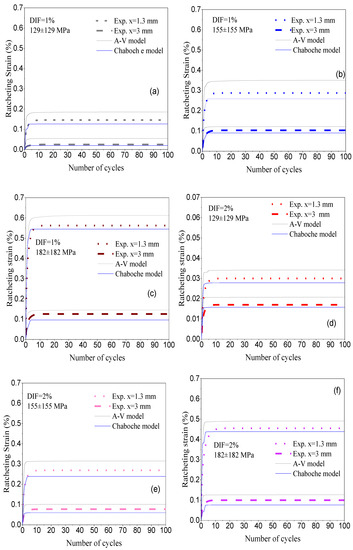
Figure 11.
Predicted ratcheting curves for pinned and unpinned samples of Al7075-T6 by means of the A-V and Chaboche kinematic hardening rules: (a–c) DIF = 1% and different stress levels of 129 ± 129 MPa, 155 ± 155 MPa, and of 182 ± 182 MPa, (d–f) DIF = 2% and different stress levels of 129 ± 129 MPa, 155 ± 155 MPa, and of 182 ± 182 MPa.
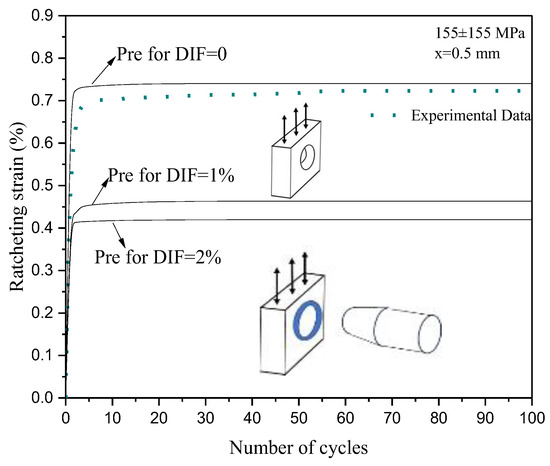
Figure 12.
Predicted ratcheting curves in the vicinity of notch root through the A-V model for unpinned sample (DIF = 0) and pinned samples (DIF = 1% and 2%) of Al7075-T6 subjected to 155 ± 155 MPa.
The choice of interference fit noticeably improved the materials resistance against local ratcheting at the perimeter of the press-fitted holes. The press-fitting process of the hole perimeter increased the onset of yielding at the notch region and shortened the yield surface motion as the backstress increments dropped in magnitudes. The stress–strain hysteresis loops generated on samples with the DIF = 2% possessed lower width as compared with the loops of unpinned samples (DIF = 0). At farther distances, the lower plastic strain range resulted in the formation of narrower loops. The higher DIFs led to lower backstress, and its evolution was stabilized at a smaller number of cycles. At a given distance x, an increase in the DIF dropped the local stress level at the notch region resulting in stress relaxation.
This study intended to explore possibilities of minimizing the materials damage and plastic deformation at the notch root of samples undergoing asymmetric loading cycles through press-fitting of holes with different degrees. Authors believe that more investigation into the influence of the press-fitting process on local ratcheting is promising and will promote the safe design of machinery components such as fasteners and rivets against the ratcheting phenomenon and failure. There are several technical parameters and affecting variables in the analysis of ratcheting in the press-fitted samples to fully understand. The evaluation of local ratcheting of load-bearing notched components becomes crucial particularly in the presence of variables such as shape and size of stress raisers, elevated temperatures, multiaxiality and loading steps, and degree of press-fitting. As the next immediate research step, the present authors plan to conduct more experiments and to further promote research on ratcheting of the press-fitted samples under various loading conditions.
4. Conclusions
Local ratcheting at the notch root of Al 7075-T6 specimens was examined under applied uniaxial asymmetric loading cycles and at various press-fitted degrees. The press-fitted samples were axially loaded after the steel pin was detached from the press-fitted hole. This ensured no shear and frictional loads are induced during loading cycles. As the DIF degree on the test samples increased from 0% → 1% → 2%, the local ratcheting at the notch region dropped noticeably. The biaxial state of stress at the notch root was simplified to an axial state as the local strains measured through the axial strain gauge were highly dominant as compared with those measured values by the lateral strain gauge. The axial local ratcheting at the non-press-fitted and press-fitted samples was evaluated through the use of the A-V and Chaboche hardening models coupled with the Neuber model. The highest magnitude of ratcheting was achieved for the unpinned samples (DIF = 0%). The press-fitted samples, however, resulted in lower ratcheting as the DIF increased from 1% to 2%. Test samples with higher DIFs and a farther distance from the notch edge possessed narrower stress–strain hysteresis loops and smaller ratcheting magnitude. The predicted ratcheting curves by means of the A-V and Chaboche hardening rules, respectively, fell above and below the measured values. The lower ratcheting magnitude at the press-fitted samples was attributed to the higher materials resistance against ratcheting deformation at the press-fitted hole region. The choice of press-fitting post-treatment in the notched components was found essential to strengthen materials against ratcheting deformation and damage.
Author Contributions
Writing—original draft, F.H.; Writing—review and editing, A.V.-F. All authors have read and agreed to the published version of the manuscript.
Funding
This research was funded by Natural Sciences and Engineering Research Council of Canada (NSERC) through A. Varvani, grant number RGPIN-2021-03047.
Data Availability Statement
Data will be made available on request.
Acknowledgments
Authors wish to acknowledge the financial support through Natural Sciences and Engineering Research Council of Canada (NSERC) through Varvani (RGPIN-2021-03047). A special thanks goes to A. Shekarian (defended in 2021) for conducting ratcheting tests on notched Al7075-T6 samples.
Conflicts of Interest
The authors declare no conflict of interest.
Nomenclature
| Total strain increment tensor | |
| Elastic strain increment tensor | |
| Plastic strain increment tensor | |
| E | Modulus of elasticity |
| Plastic modulus | |
| Backstress tensor | |
| Stress tensor | |
| Unit tensor | |
| Poisson’s ratio | |
| G | Shear modulus |
| Deviatoric stress tensor | |
| Initial yield strength | |
| d | Circular notch diameter |
| Coefficients of the A-V model | |
| , | Chaboche materials coefficients |
| Stress concentration factor | |
| Internal variable of the A-V model tensor | |
| Ramberg-Osgood coefficients | |
| S,e | Nominal stress and strain |
| R | Stress ratio |
| , | Stress and strain concentration factors |
| Uniaxial local stress and strain at the notch root | |
| Strain energy per unit volume at the notch root | |
| Elastic strain energy per unit volume due to the nominal remote stress |
References
- Chakherlou, T.N.; Oskouei, R.H.; Vogwell, J. Experimental and numerical investigation of the effect of clamping force on the fatigue behaviour of bolted plates. Eng. Fail. Anal. 2008, 15, 563–574. [Google Scholar] [CrossRef]
- Chakherlou, T.N.; Abazadeh, B.; Vogwell, J. The effect of bolt clamping force on the fracture strength and the stress intensity factor of a plate containing a fastener hole with edge cracks. Eng. Fail. Anal. 2009, 16, 242–253. [Google Scholar] [CrossRef]
- Chakherlou, T.N.; Vogwell, J. A novel method of cold expansion which creates near-uniform compressive tangential residual stress around a fastener hole. Fatigue Fract. Eng. Mater. Struct. 2004, 27, 343–351. [Google Scholar] [CrossRef]
- Chakherlou, T.N.; Aghdam, A.B. An experimental investigation on the effect of short time exposure to elevated temperature on fatigue life of cold expanded fastener holes. Mater. Design 2008, 29, 1504–1511. [Google Scholar] [CrossRef]
- Wang, C.; Zou, F.; Zhou, E.; Fan, Z.; Ge, E.; An, Q.; Ming, W.; Chen, M. Effect of split sleeve cold expansion on microstructure and fatigue performance of 7075-T6 aluminum alloy holes. Int. J. Fatigue 2023, 167, 107339. [Google Scholar] [CrossRef]
- Zhang, Q.; Zuo, Y. Fatigue behavior investigation of interference fitted pinned joints with extremely small edge distance. J. Mater. Eng. Perform. 2023, 21, 865–872. [Google Scholar] [CrossRef]
- Chakherlou, T.N.; Mirzajanzadeh, M.; Saeedi, K.H. Fatigue crack growth and life prediction of a single interference fitted holed plate. Fatigue Fract. Eng. Mater. Struct. 2010, 33, 633–644. [Google Scholar] [CrossRef]
- Hassanifard, S.; Adibeig, M.R.; Mohammadpour, M.; Varvani-Farahani, A. Fatigue life of axially loaded clamped rivet-nut joints: Experiments and analyses. Int. J. Fatigue 2019, 129, 105254. [Google Scholar] [CrossRef]
- Chakherlou, T.N.; Alvandi-Tabrizi, Y.; Kiani, A. On the fatigue behavior of cold expanded fastener holes subjected to bolt tightening. Int. J. Fatigue 2011, 33, 800–810. [Google Scholar] [CrossRef]
- Kolasangiani, K.; Varvani-Farahani, A. Local ratcheting assessment of steel samples undergoing various step and block loading conditions. Theor. Appl. Fract. Mech. 2020, 107, 102533. [Google Scholar] [CrossRef]
- Shekarian, A.; Varvani-Farahani, A. Ratcheting prediction at the notch root of steel samples over asymmetric loading cycles. J. Eng. Mater. Technol. Trans. 2020, 142, 021009. [Google Scholar] [CrossRef]
- Varvani-Farahani, A. Nonlinear kinematic hardening cyclic plasticity. In Cyclic Plasticity of Metals Modeling Fundamentals and Applications; Jahed, H., Roostaei, A.A., Eds.; Elsevier: Amsterdam, The Netherlands, 2021; pp. 139–174. [Google Scholar]
- Shekarian, A.; Varvani-Farahani, A. Ratcheting behavior of notched stainless-steel samples subjected to asymmetric loading cycles. J. Iron Steel Res. Int. 2021, 28, 86–97. [Google Scholar] [CrossRef]
- Shekarian, A.; Varvani-Farahani, A. Ratcheting response of SS316 steel samples with different notch shapes under various loading spectra. J. Mater. Eng. Perform. 2021, 30, 3524–3535. [Google Scholar] [CrossRef]
- Neuber, H. Theory of stress concentration for shear-strained prismatical bodies with arbitrary nonlinear stress-strain law. J. Appl. Mech. 1961, 28, 544–550. [Google Scholar] [CrossRef]
- Chaboche, J. On some modifications of kinematic hardening to improve the description of ratcheting effects. Int. J. Plast. 1991, 7, 661–678. [Google Scholar] [CrossRef]
- Ahmadzadeh, G.R.; Varvani-Farahani, A. Ratcheting assessment of materials based on the modified Armstrong—Frederick hardening rule at various uniaxial stress levels. Fatigue Fract. Eng. Mater. Struct. 2013, 36, 1232–1245. [Google Scholar] [CrossRef]
- Wang, C.H.; Rose, L.R.F. Transient and steady-state deformation at notch root under cyclic loading. Mech. Mater. 1998, 30, 229–241. [Google Scholar]
- Hu, W.; Wang, C.H.; Barter, S. Analysis of Cyclic Mean Stress Relaxation and Strain Ratchetting Behavior of Aluminum 7050; Aeronautical and Maritime Research Lab: Melbourne, VIC, Australia, 1999. [Google Scholar]
- Rahman, S.M.; Hassan, T. Advanced cyclic plasticity models in simulating ratcheting responses of straight and elbow piping components, and notched plates. In Proceedings of the ASME Pressure Vessels and Piping Conference, Denver, CO, USA, 17–21 July 2005; pp. 421–427. [Google Scholar]
- Ohno, N.; Wang, J.D. Kinematic hardening rules with critical state of dynamic recovery, part I: Formulations and basic features for ratcheting behavior. Int. J. Plast. 1993, 9, 375–390. [Google Scholar] [CrossRef]
- Ohno, N.; Abdel Karim, M. Uniaxial ratcheting of 316FR steel at room temperature—Part II: Constitutive modeling and simulation. ASME J. Appl. Mech. 2000, 122, 35–41. [Google Scholar]
- Firat, M. A notch strain calculation of a notched specimen under axial-torsion loadings. Mater. Des. 2011, 32, 3876–3882. [Google Scholar] [CrossRef]
- Barkey, M.E. Calculation of Notch Strains under Multiaxial Nominal Loading. Ph.D. Thesis, Department of Theoretical and Applied Mechanics, University of Illinois at Urbana, Champaign, IL, USA, 1993. [Google Scholar]
- Liu, C.; Chen, X.; Chen, W.; Shi, L.; Su, X.; Ogonmola, O.; Shan, L. Ratcheting-fatigue behavior and life prediction of Z2CN18. 10 austenitic stainless steel elbow Int. J. Press. Vessel. Pip. 2023, 204, 104985. [Google Scholar] [CrossRef]
- Chen, X.; Jiao, R.; Kim, K.S. On the Ohno-Wang kinematic hardening rules for multiaxial ratcheting modeling of medium carbon steel. Int. J. Plast. 2005, 21, 161–184. [Google Scholar] [CrossRef]
- Hatami, F.; Varvani-Farahani, A. Accumulation of plastic strain at notch root of steel specimens undergoing asymmetric fatigue cycles: Analysis and simulation. Materials 2023, 16, 2153. [Google Scholar] [CrossRef] [PubMed]
- Chakherlou, T.N.; Ajri, M. Strain ratcheting and stress relaxation around interference-fitted single-holed plates under cyclic loading: Experimental and numerical investigations. Fatigue Fract. Eng. Mater. Struct. 2012, 36, 327–339. [Google Scholar] [CrossRef]
- Varvani-Farahani, A. A comparative study in descriptions of coupled kinematic hardening rules and ratcheting assessment over asymmetric stress cycles. Fatigue Fract. Eng. Mater. Struct. 2017, 40, 882–893. [Google Scholar] [CrossRef]
- Ramberg, W.; Osgood, W.R. Description of Stress-Strain Curves by Three Parameters; NACA Technical Note No. 902; NASA: Washington, DC, USA, 1943. [Google Scholar]
- Kolasangiani, K.; Shariati, M.; Varvani-Farahani, A. Ratcheting examination of 1045 notched steel plates under Low-High and High-Low sequences. J. Test Eval. 2021, 49, 3685–3700. [Google Scholar] [CrossRef]
- Agius, D.; Wallbrink, C.; Kourousis, K.I. Cyclic elastoplastic performance of aluminum 7075-T6 under strain- and stress-controlled loading. J. Mater. Eng. Perform. 2017, 26, 5769–5780. [Google Scholar] [CrossRef]
- Benedettia, M.; Bertob, F.; Le Bonec, L.; Santusc, C. A novel Strain-Energy-Density based fatigue criterion accounting for mean stress and plasticity effects on the medium-to-high-cycle uniaxial fatigue strength of plain and notched components. Int. J. Fatigue 2020, 133, 105397. [Google Scholar] [CrossRef]
- Benedetti, M.; Menapace, C.; Fontanari, V.; Santus, C. On the variability in static and cyclic mechanical properties of extruded 7075-T6 aluminum alloy. Fatigue Fract. Eng. Mater. Struct. 2021, 44, 2975–2989. [Google Scholar] [CrossRef]
- Zhoua, J.; Suna, Z.; Kanoutéa, P.; Retraint, D. Experimental analysis and constitutive modelling of cyclic behaviour of 316 L steels including hardening/softening and strain range memory effect in LCF regime. Int. J. Plast. 2018, 107, 54–78. [Google Scholar] [CrossRef]
- Rajaeian, M.; Parsa, M.H. Experimental analysis and constitutive modeling of cyclic behavior of 304 L stainless steel: Introduction of isotropic hardening fading effect. J. Pres V. Tech. 2023, 145, 011508. [Google Scholar] [CrossRef]
- ABAQUS User’s Manual, Version 6.13. Hibbitt, Karlsson and Sorensen. 2016. Available online: http://130.149.89.49:2080/v6.13/pdf_books/CAE.pdf (accessed on 5 July 2020).
- Neuber, H. Theory of Notch Stresses; Edwards: Ann Arbor, MI, USA, 1946. [Google Scholar]
- Chmelko, V.; Harakaľ, M.; Žlábek, P.; Margetin, M.; Ďurka, R. Simulation of stress concentrations in notches. Metals 2022, 12, 43. [Google Scholar] [CrossRef]


Disclaimer/Publisher’s Note: The statements, opinions and data contained in all publications are solely those of the individual author(s) and contributor(s) and not of MDPI and/or the editor(s). MDPI and/or the editor(s) disclaim responsibility for any injury to people or property resulting from any ideas, methods, instructions or products referred to in the content. |
© 2023 by the authors. Licensee MDPI, Basel, Switzerland. This article is an open access article distributed under the terms and conditions of the Creative Commons Attribution (CC BY) license (https://creativecommons.org/licenses/by/4.0/).