Article

Efficient Gallium Recovery from Aqueous Solutions Using Polyacrylonitrile Nanofibers Loaded with D2EHPA

by
Bibiane Nardes Segala
1,
Bruno München Wenzel
2,
Nicholas P. Power
3,
Satheesh Krishnamurthy
4,
Daniel Assumpção Bertuol
1 and
Eduardo Hiromitsu Tanabe
1,*
1
Environmental Processes Laboratory (LAPAM), Chemical Engineering Department, Federal University of Santa Maria (UFSM), Santa Maria 97105-900, RS, Brazil
2
Postgraduate Program in Environment and Sustainable Technologies, Federal University of Fronteira Sul (UFFS), Cerro Largo 97900-000, RS, Brazil
3
School of Life, Health & Chemical Sciences, The Open University, Milton Keynes MK7 6AA, UK
4
School of Engineering and Innovation, The Open University, Milton Keynes MK7 6AA, UK
*
Author to whom correspondence should be addressed.
Metals 2023, 13(9), 1545; https://doi.org/10.3390/met13091545
Submission received: 22 July 2023 / Revised: 21 August 2023 / Accepted: 29 August 2023 / Published: 1 September 2023
(This article belongs to the Special Issue Advances in Recycling of Valuable Metals—2nd Edition)

Abstract

:
Centrifugal spinning was utilized in producing polyacrylonitrile (PAN) nanofibers loaded with extractant di-(2-ethylhexyl) phosphoric acid (D2EHPA) for efficient adsorption recovery of gallium from aqueous solutions. The adsorption experimental data were best fitted by a pseudo-second-order kinetic model and the BET equilibrium isotherm model. Optimal adsorption performance by the PAN/D2EHPA nanofibers exhibited an adsorption capacity of 33.13 mg g−1 for the recovery of gallium at pH 2.5 and 55 °C. The thermodynamic parameters demonstrated that adsorption was endothermic, spontaneous, and favorable. The stability and reusability of the nanofibers was assessed, demonstrating retention of structural and functional integrity for the nanofibers over five cycles of an adsorption/desorption process, whilst retaining adsorption efficiency. The results demonstrate that PAN/D2EHPA nanofibers have excellent potential for utilization in an efficient adsorption process for gallium recovery, offering significant positive environmental impact over conventional liquid–liquid extraction methods.

1. Introduction

Gallium-based components can be found with extensive applications in a wide array of products including semiconductors, integrated circuits, laser diodes, LEDs, photovoltaic cells, and multitudes of other various electronic components. Additionally, gallium-based compounds are utilized in medical imaging, pharmaceuticals, as well as catalysts for chemical reactions. The versatility and unique properties of gallium make it a crucial element in numerous technological advancements and innovative products for a diverse range of industries and sectors [1,2,3,4,5].
The demand for gallium has seen significant growth in recent years in line with the rapid advancements and demand for electronic devices, lighting technologies, and photovoltaic energy. However, the widespread use of gallium-based products can also lead to the release of industrial effluents containing this metal, posing a potential risk of polluting the aquatic environment [6,7,8,9,10,11]. Gallium discharged into arable soils or groundwater has been shown to have significant negative impact on plant growth in the diminishment of root development, transpiration, nutrient uptake, and biomass accumulation. The presence of gallium in aquatic systems is also a growing concern, with numerous reports noting its increasing occurrence and concentrations alongside other technology-critical metals posing serious and significant health risk for aquatic ecosystems [12,13,14,15,16,17].
The retrieval of gallium from water is typically accomplished via chemical precipitation, complexation, ion exchange, solvent extraction, and adsorption, all of which possess their own advantages and disadvantages [18]. However, there is greater demand for new technologies for the recovery of technologically critical metals with lower costs that are more effective in reducing metal content from electronic waste and industrial effluents, thus reducing contamination of the environment [19,20]. Adsorption is considered a suitable technique for metal ion removal from solution in the elimination of contaminants even at very low concentrations [21]. This approach presents significant advantages over other methodologies, including high efficacy, straightforward operation, minimal energy usage, environmentally benign properties, as well as offering a diverse range of materials for the creation of various adsorbents that are adaptable and tunable to the conditions required [22]. However, the development of the properties of adsorbent materials can be challenging in terms of optimizing adsorption equilibrium time, selectivity, efficiency, and regeneration capacity [23].
Polymeric nanofibers have seen increased attention in adsorption applications, reflecting their ease of production, high specific surface area, simple regeneration, and regular pore structure [24,25]. Many studies have reported excellent results for polymeric nanofiber applications in wastewater treatment containing metal ions [26,27]. The typical method for preparation of nanofibers is electrospinning, but centrifugal spinning is gaining more attention as it utilizes centrifugal force rather than an electric field [28,29,30,31,32] as it offers increased productivity, simplified handling, and the removal of the hazard of high voltage in the generation of nanofibers [26,33,34].
Di-(2-ethylhexyl) phosphoric acid, commercially known as D2EHPA, is an alkyl phosphoric extractant commonly used in liquid–liquid extraction, which is readily available in commercial quantities at a reasonable cost. D2EHPA has been employed for the retrieval of a variety of metals, including uranium, cobalt, nickel, zinc, beryllium, vanadium, gallium, indium, and rare earth elements [35]. Although the liquid–liquid technique is widely used for metal separation and extraction, it can be detrimental to human health and the environment due to the emissions of volatile organic compounds into the atmosphere. On an industrial scale, these processes require substantial quantities of organic solvents, with significant losses either via the aqueous solution or evaporation [35].
Polymeric nanofibers for adsorption applications can be produced by impregnation of the nanofiber with a liquid extractant [36]. This modification of nanofibers with D2EHPA can provide tunable materials that not only offer excellent efficiency in the recovery of metals but also offer an excellent alternative to the solvent–solvent extraction process, thus further reducing the environmental impact for gallium recovery by removal of the need for solvents in the process. Whilst there have been some studies of D2EHPA impregnated polymeric nanofibers for metal recovery [37,38], there are no reports for their application in gallium recovery. Furthermore, D2EHPA is considered to be a better extractant for separation of a matrix of metals with indium, gallium, and zinc, for example, when compared with other acidic organophosphates [3].
Herein, this study presents the development of an effective nanomaterial capable of adsorbing and recovering gallium from aqueous solutions. Polyacrylonitrile (PAN) nanofibers were loaded using a range of D2EHPA extractant concentrations by centrifugal spinning to determine synthetic and performance optimization. A range of variables for experimental conditions including pH, temperature, and contact time were also explored. The nanofibers were characterized to confirm the presence of functional groups, their morphology, and their thermal stability and degradation, via FT-IR, SEM, and TGA techniques, respectively. The adsorption kinetics, equilibrium, and thermodynamics were studied by applying nonlinear regression methods. The reusability of the nanofibers was also assessed through consecutive cycles of gallium adsorption and desorption.

2. Materials and Methods

2.1. Materials

The nanofibers were fabricated using N,N-dimethylformamide (98%) (DMF) and polyacrylonitrile (PAN), purchased from Proquímios (Rio de Janeiro, Brazil) and Sigma-Aldrich (St. Louis, MO, USA), respectively. The di-(2-ethylhexyl) phosphoric acid (D2EHPA, 97%) was acquired from Albright & Wilson Americas, Inc. For the adsorption and desorption experiments, gallium ion solutions were prepared using ICP gallium standard, obtained from Sigma-Aldrich. Solutions with concentrations of 1, 3, and 5 M were prepared using analytical grade reagents such as sodium hydroxide (98%, Alphatec, Paraná, Brazil) and nitric acid (65%, Synth, São Paulo, Brazil). Desorption was carried out using a 1 M solution of hydrochloric acid (37%, Neon, São Paulo, Brazil).

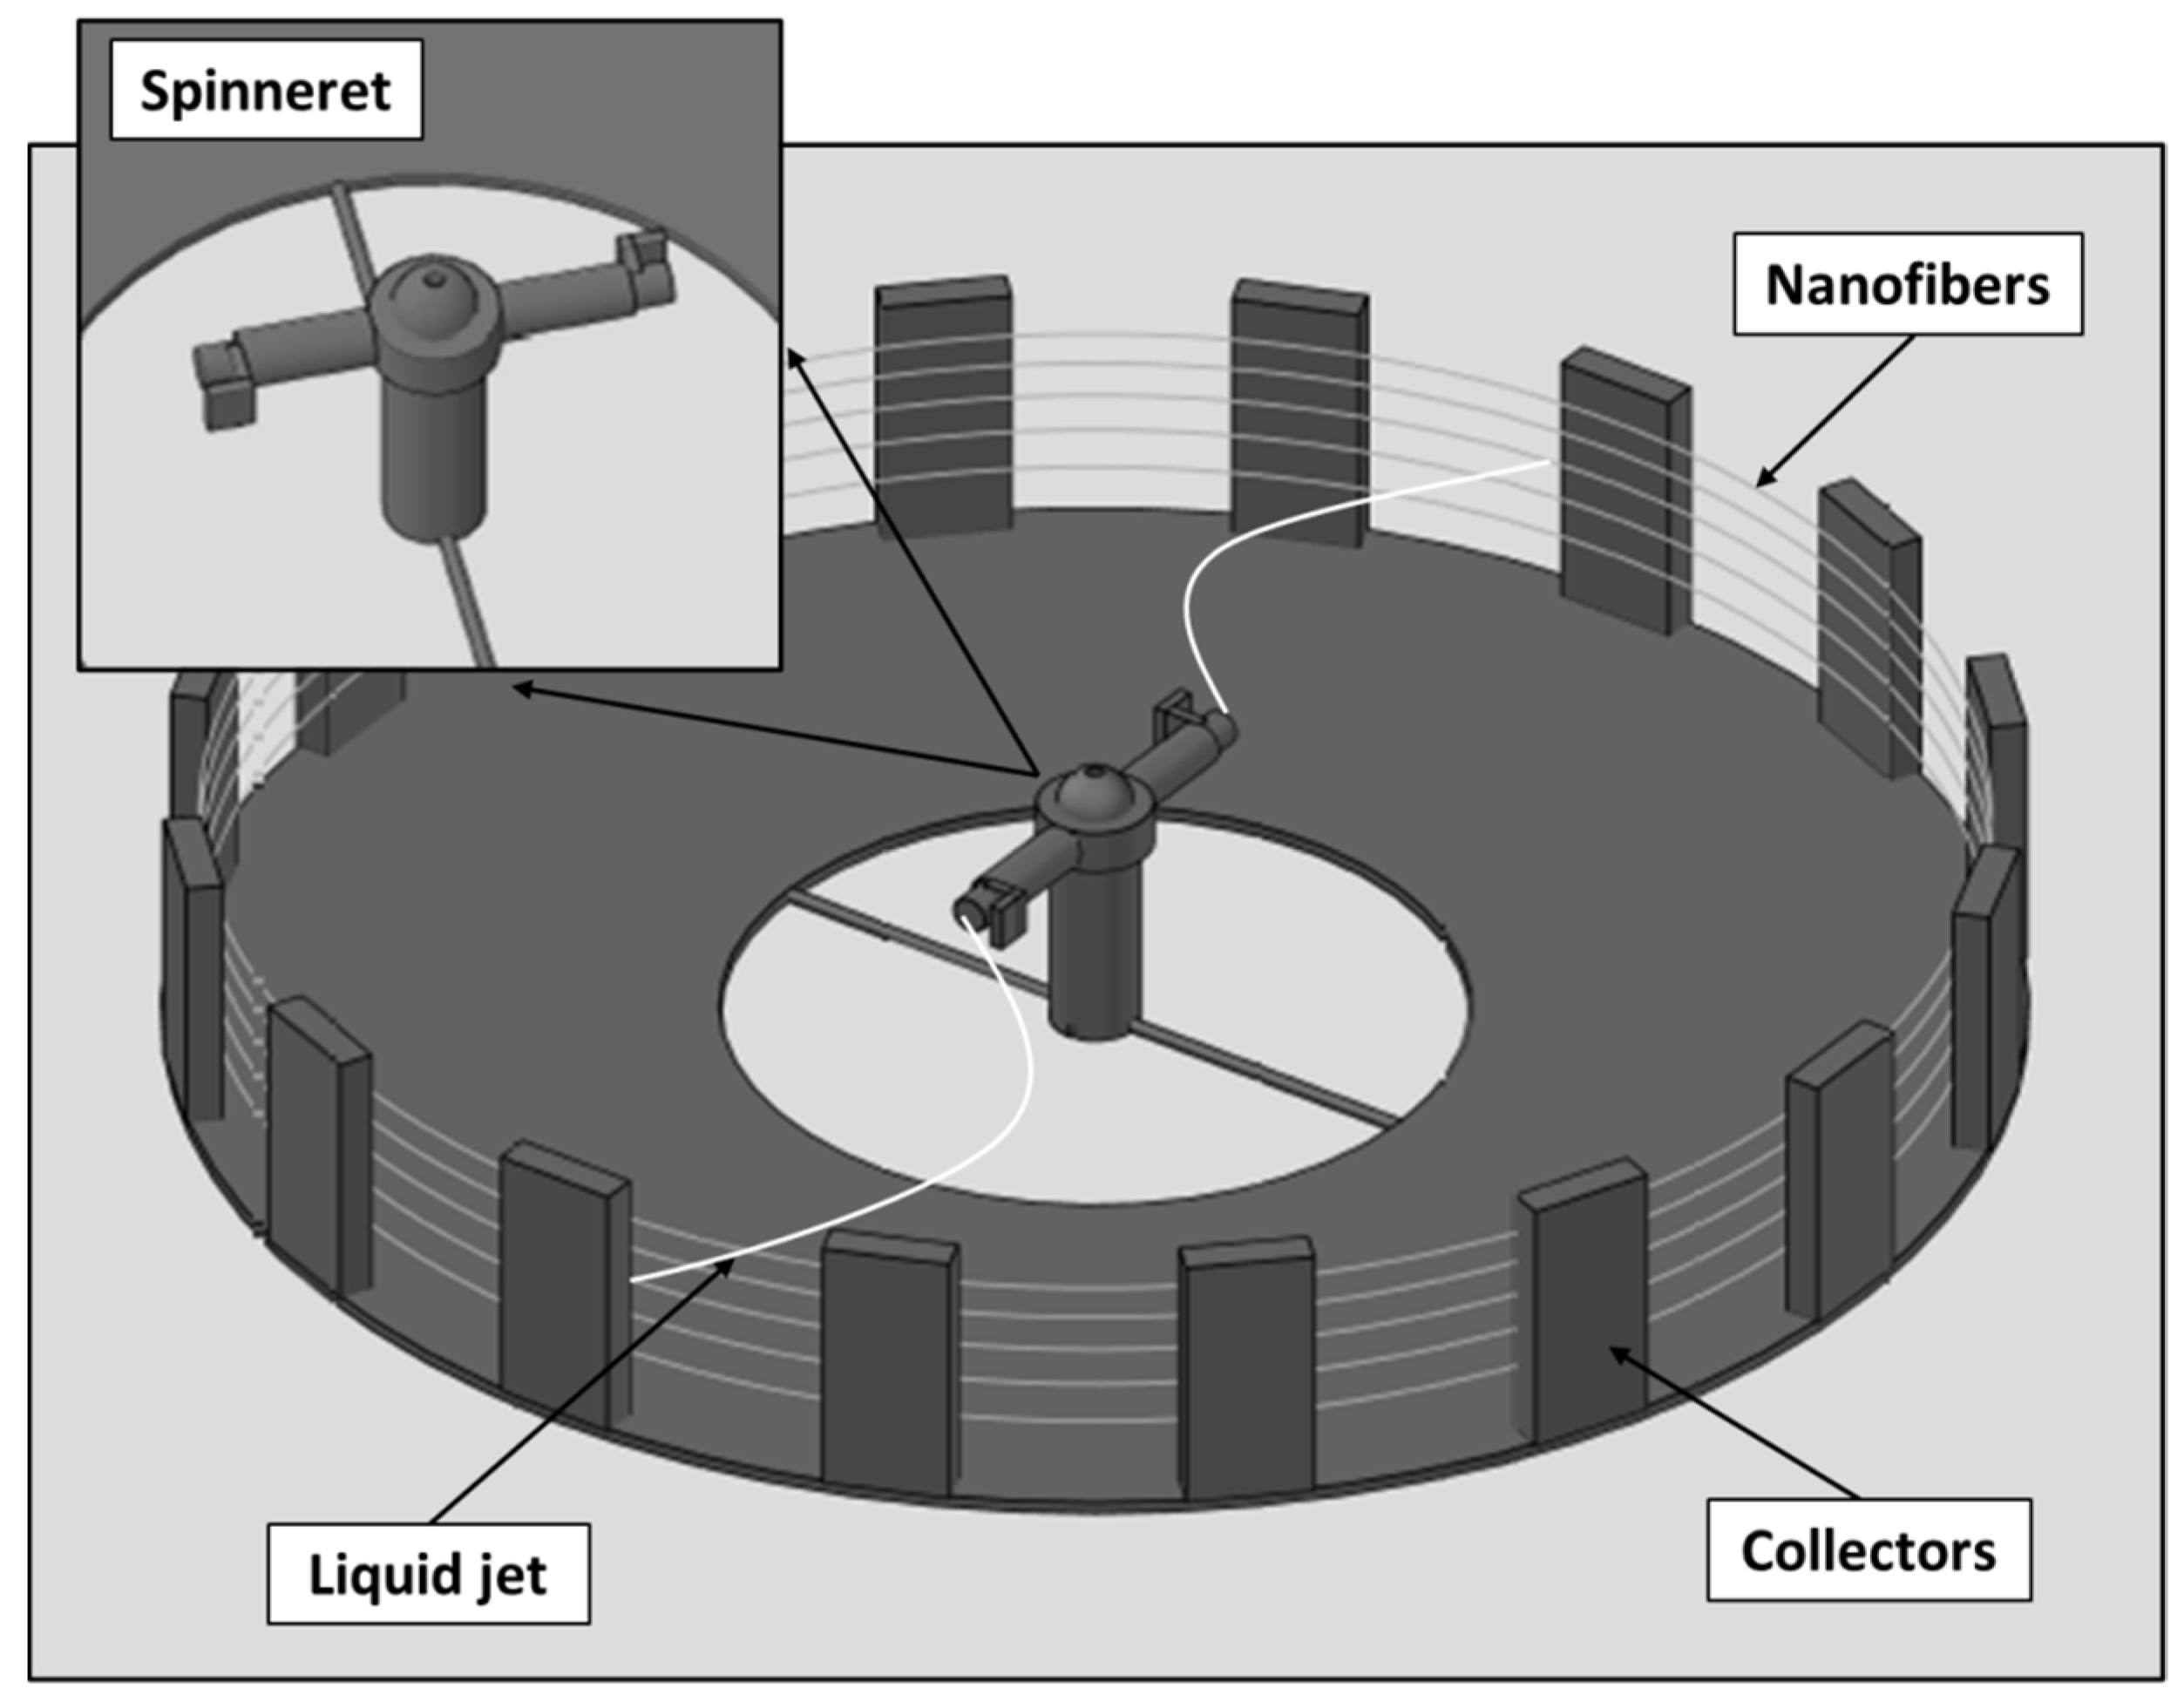
2.2. Preparation of the Nanofibers

Polyacrylonitrile (PAN) was selected as a polymer for production of the nanofibers due to its high mechanical resistance and stability, which would allow for repeated cycles of reuse [39]. The polymeric solution was produced by stirring the required proportions of PAN, extractant (D2EHPA), and solvent (DMF) for 4 h at 60 °C using a heating plate.
PAN nanofibers without the D2EHPA extractant were prepared using 12 wt% polymer and 88 wt% DMF solvent [40]. For the PAN nanofibers loaded with D2EHPA, the DMF solvent proportion was kept fixed at 88 wt%, whilst 12 wt% consisted of PAN and extractant mix at PAN/extractant ratios (% w/w) of 70/30, 80/20, and 90/10 [41,42].
The nanofibers were obtained by use of a centrifugal spinning machine from Forcespinning® equipment (L1000-MS, FibeRio, Mcallen, TX, USA) (Figure 1).
The spinneret consisted of two opposing orifices (i.d. of 0.30 mm), which was loaded with 2 mL of polymeric solution. A rotational speed of 8000 rpm was applied for the spinneret, whilst solution refills (5 refills) were made to provide the desired mass of nanofibers. The extruded nanofiber were collected on sixteen collection plates (114 mm(H) × 19 mm(W) × 6.4 mm(D)) located 12.5 cm from the spinneret orifice [37,38,40].

2.3. Characterization of the Nanofibers

Thermogravimetric analysis (TGA) (Model TGA-50/Shimadzu, Kyoto, Japan) was used to analyze the thermal degradation of the polymers. Samples were heated from ambient temperature to 800 °C, in an alumina holder at a rate of 10 °C min−1 under nitrogen atmosphere (50 mL min−1). Fourier transform infrared spectroscopy (FT-IR) (Prestige-21 instrument, Shimadzu, Japan) was employed to analyze the chemical composition of the nanofibers. The surface morphologies of the nanofibers were investigated by scanning electron microscopy (SEM) (VEGA-3G microscope (TESCAN, Brno, Czech Republic). The diameters of the nanofibers were obtained from the SEM images, using ImageJ software version 1.8.0 (NIH Image, Washington, DC, USA). The aqueous gallium solutions were analyzed using atomic absorption spectrometry (Model 240FS AA/Agilent Technologies, Santa Clara, CA, USA).

2.4. Adsorption Experiments

Adsorption tests were accomplished over 240 min, using approximately 0.06 g of nanofibers, and 30 mL of gallium solution (20 mg L−1), with a constant 1:500 g mL−1 of solid:liquid ratio, with stirring at 240 rpm under initial conditions of pH 2.5 and 25 °C, for determination of the optimal performing prepared polymer/extractant nanofibers. For the best-performing nanofiber identified, the influence of pH was examined within the range of 0.5 to 3.0 (pH adjustments with HNO3 and NaOH) to determine the optimal process pH [42].
Kinetic curves were obtained by maintaining the initial gallium concentration constant at 20 mg L−1, with a contact time of 240 min and stirred at optimal pH for different temperatures (25, 35, 45, and 55 °C).
For the equilibrium curves, the following parameters were evaluated: initial gallium concentrations (20, 40, 60, 80, 100, 120, and 150 mg L−1) and stirred for a range of temperatures (25, 35, 45, and 55 °C) at optimal pH for 240 min.
After the adsorption experiments, the suspensions were filtered, and the solid phase was separated. Elemental analysis was conducted using atomic absorption spectroscopy (AAS). All experiments were conducted in triplicate to ensure the reproducibility and accuracy of the experimental data.
The percentage of gallium adsorbed (R%) was determined according to Equation (1) [43], and the adsorption capacity (qe) of gallium ions was calculated by using Equation (2) [43,44],
R % = ( C 0 C e ) C 0 × 100
q e = ( C 0 C e ) × V m
where Ce (mg L−1) is the equilibrium concentration of gallium ions, C0 (mg L−1) is the initial concentration of gallium ions, V(L) is the volume of the initial solution, and m (g) is the weight of adsorbent.

2.5. Kinetics Studies

For kinetic evaluation of gallium adsorption, the data were fitted to pseudo-first-order (PFO) (Equation (3)), pseudo-second-order (PSO) (Equation (4)), and Elovich (Equation (5)) model equations.
The PFO model is considered valid for the initial adsorption stage, which assumes that adsorption occurs as a consequence of a concentration gradient between the solute and adsorbent surface [45]. However, for most pollutant adsorption application studies, the PSO model tends to provide the best fit [45].
Adsorption kinetics can also be effectively represented by the Elovich model, which is commonly used to represent a generic kinetic order, especially when dealing with heterogeneous surfaces [46].
q t = q 1 ( 1 exp k 1 t )
q t = t 1 k 2 q 2 2 + ( t q 2 )
q t = 1 a ln ( 1 + a b t )
The term qt (mg g−1) is the amount of gallium adsorbed at time t; q1 and q2 (mg g−1) are the theoretical values of adsorption capacity of PFO and PSO models, respectively. The parameters k1 (min−1) and k2 (g mg−1 min−1) are the rate constants of the PFO and PSO models, respectively. The parameter “a” is associated with the initial velocity (mg g−1 min−1) in the Elovich model, and parameter “b” is Elovich’s desorption constant (g mg−1).

2.6. Equilibrium Studies

Equilibrium isotherm curves were adjusted to the experimental data using Langmuir (Equation (6)), Freundlich (Equation (7)), and BET (Equation (8)) models. The Langmuir isotherm indicates that adsorption occurs in a monolayer on a homogeneous adsorbent surface. Furthermore, it assumes that the active sites on the surface of adsorbent have the same affinity and energy for adsorption. [47]. The Freundlich isotherm is not restricted to a single layer formation and assumes that the adsorbent surface is heterogeneous [48]. Brunauer, Emmett, and Teller (1938) proposed a theory for the adsorption phenomenon based on the same mechanism of Langmuir’s theory, although this model assumes that molecules are adsorbed in overlapping layers, which means a layer has the great ability to generate adsorption sites, causing the deposition of one onto another [49].
q e = q m k L C e 1 + ( k L C e )
q e = k F C e 1 n F
q e = q m k S C e ( 1 k R C e ) ( 1 k R C e + k S C e )
where qm (mg g−1) is the capacity adsorbed per unit of mass of the adsorbent in equilibrium, Ce (mg L−1) is the equilibrium concentration of gallium in the solution, kL (L mg−1) is the equilibrium constant of the Langmuir model, kF ((mg g−1)(mg L−1)−1/n) is the equilibrium constant for the Freundlich model that provides a measure of capacity, 1/nF is the heterogeneity factor that indicates the intensity of adsorption, and kS and kR are the equilibrium constants of BET isotherm for the first layer and upper layers, respectively.

2.7. Thermodynamics Parameters Estimation

Thermodynamic parameters were investigated based on the values of enthalpy variation (∆H0, kJ mol−1), Gibbs free energy variation (∆G0, kJ mol−1), and entropy variation (∆S0, kJ mol−1 K−1), as determined from Equations (9)–(11) [50], respectively:
G 0 = R T l n ( K e )
G 0 = H 0 T S 0
ln K e = S 0 R H 0 R T
where Ke represents the thermodynamic equilibrium constant (non-dimensional), T is temperature (K), and R is the gas constant (8.3144 × 10⁻³ kJ mol−1 K−1).

2.8. Modeling and Parameter Estimation

The experimental values were fitted to the respective equilibrium and kinetic models using nonlinear regression, which involved minimizing the least-squares function. The quality of the adjustment was measured using the adjusted coefficient of determination (R2adj), coefficient of determination (R2), average relative error (ARE) (Equation (12)), and mean sum-of-squares error (MSE) (Equation (13)) [45].
A R E = 1 n i = 1 n q e x p q c a l q e x p
M S E = 1 n i = 1 n q c a l q e x p 2
qexp is the value of q measured experimentally, qcal is the value of q determined by the adjustment, and n is the number of experimental data.

2.9. Desorption and Regeneration of Adsorbent

The stability and durability analysis of the nanofibers involved five cycles of adsorption/desorption using an orbital shaker (Model SL-222, Solab, Aberdeen, UK). For adsorption analysis, 0.06 g of nanofibers was added to 30 mL of gallium solution (20 mg L−1 at PH = 2.5) giving a solid-to-liquid (S:L) ratio of 1:500 g mL−1. The solution was mixed using a shaker for 60 min at 240 rpm and 55 °C. The gallium-loaded nanofibers were then transferred to 15 mL 1 M HCl eluent for desorption (S:L ratio of 1:250 g mL−1) and agitated for 5 min at 240 rpm and 25 °C [3,51].

3. Results

3.1. Materials Characterization

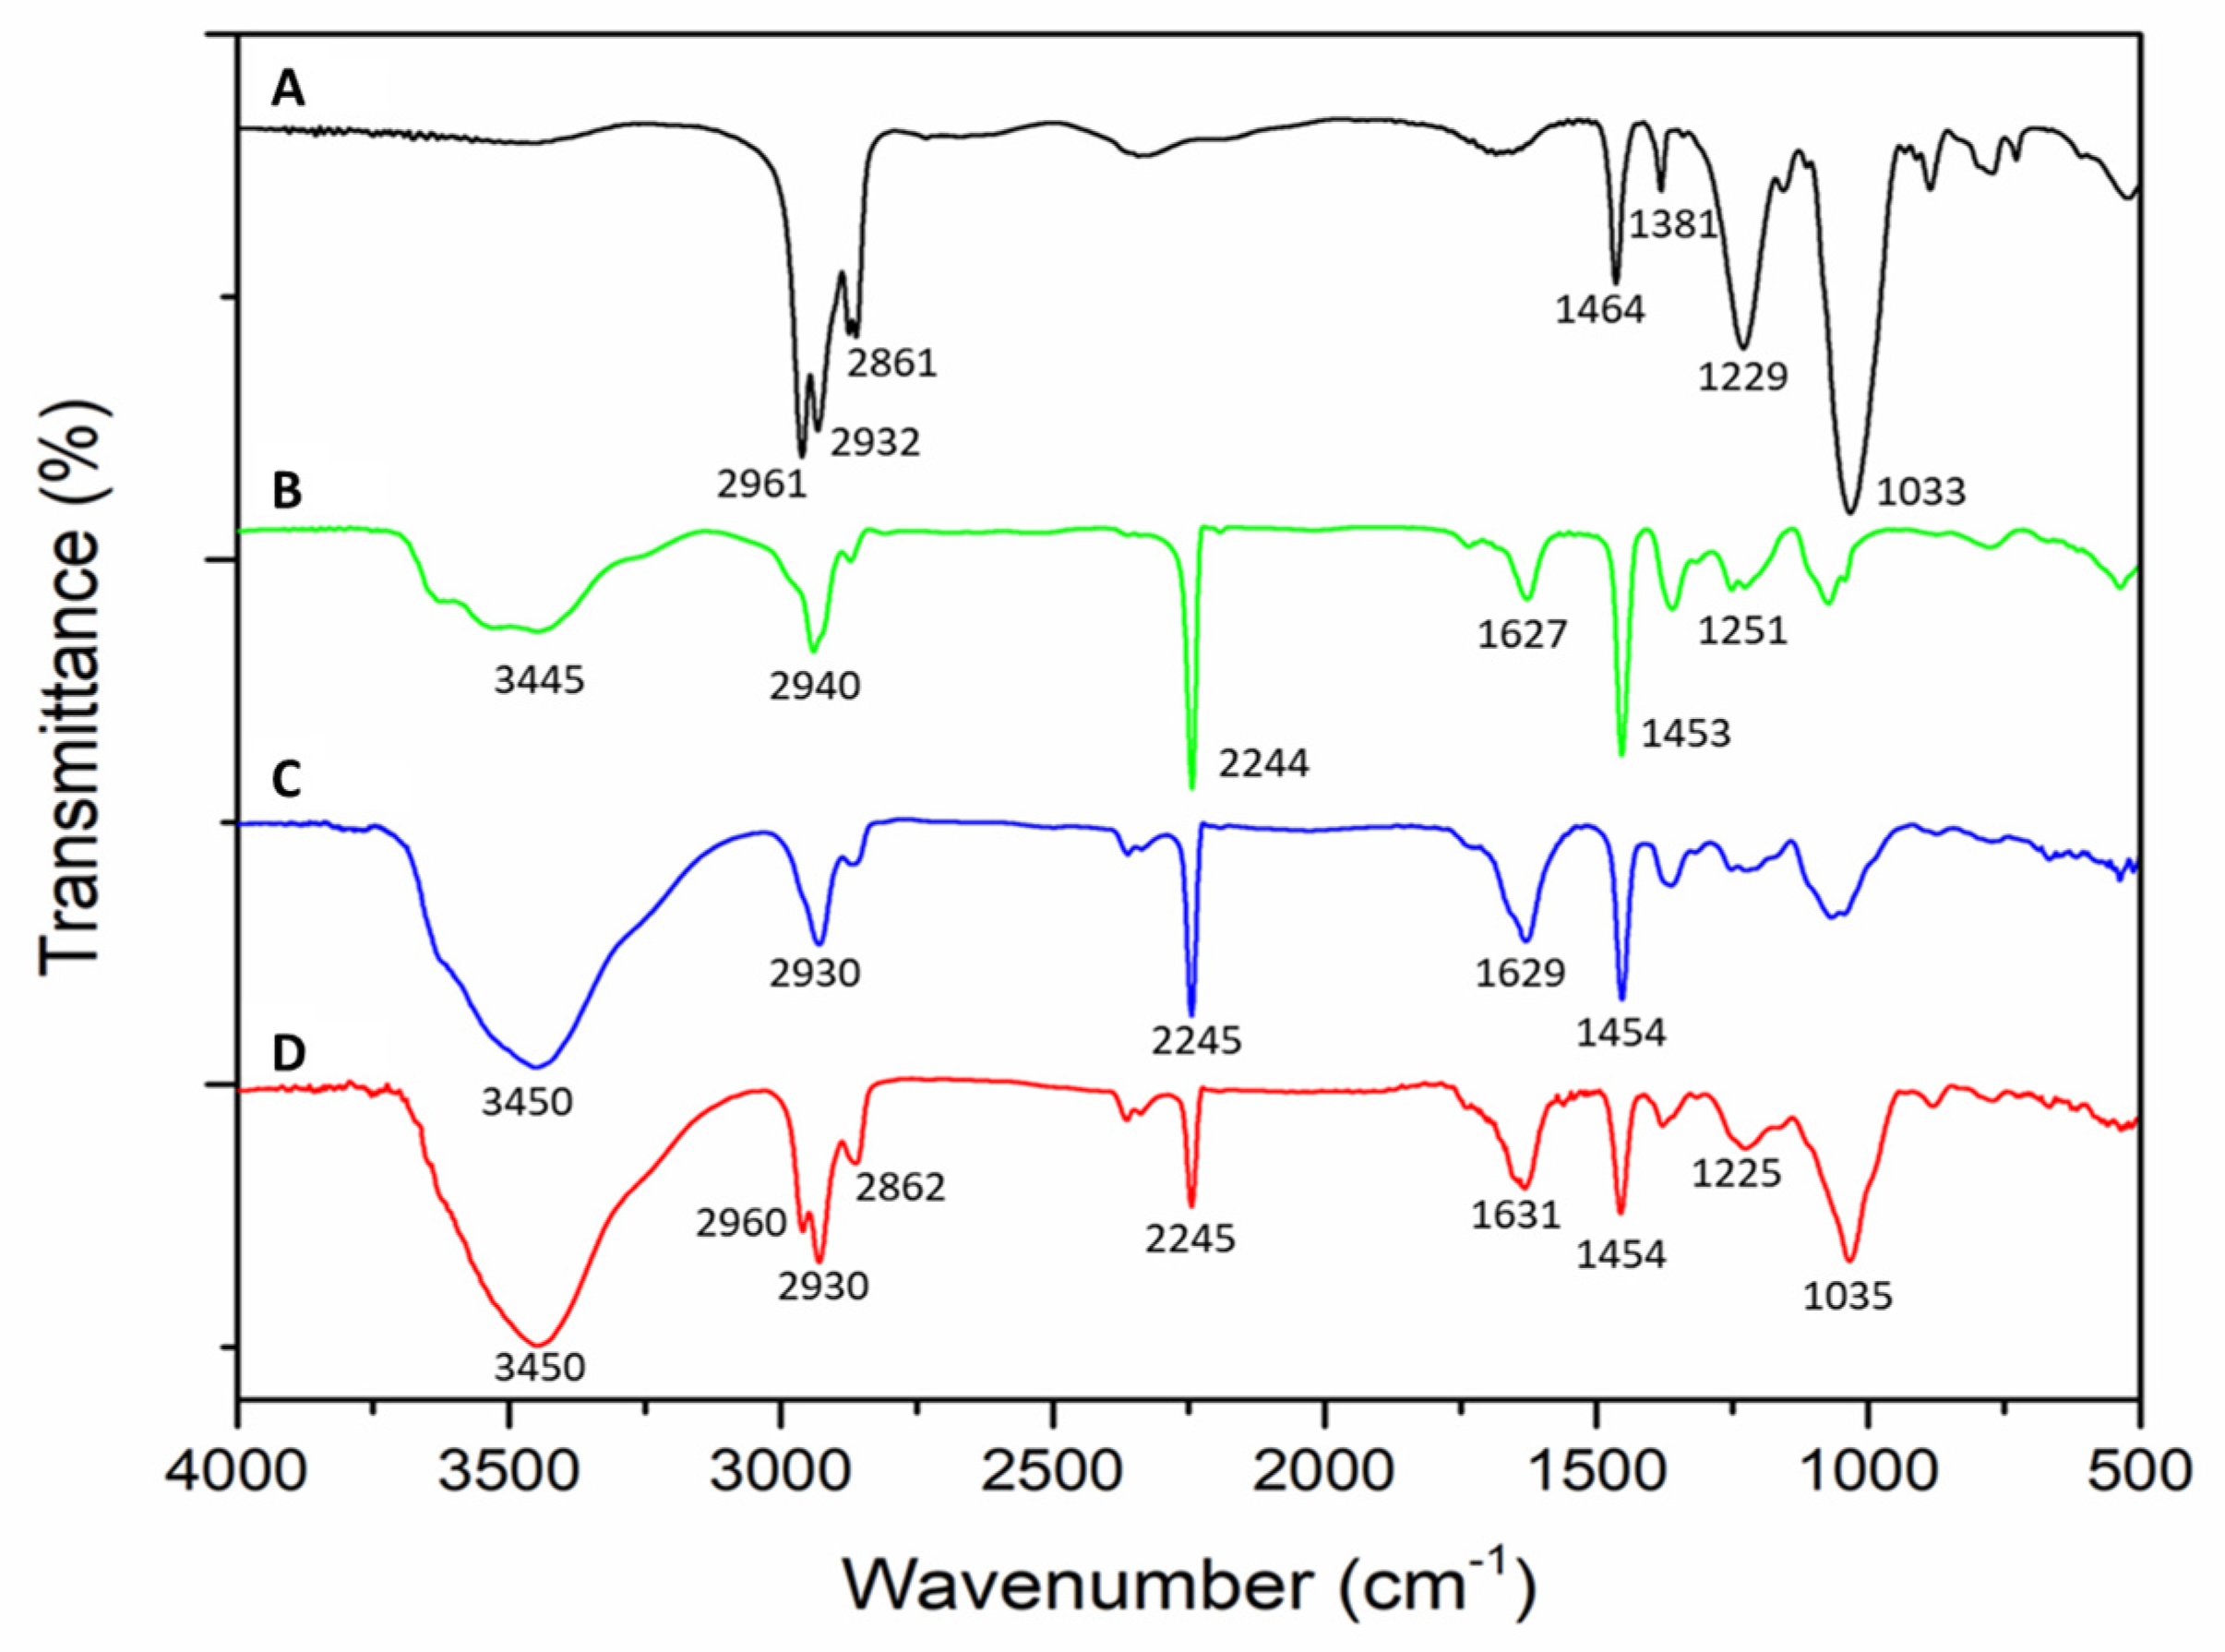
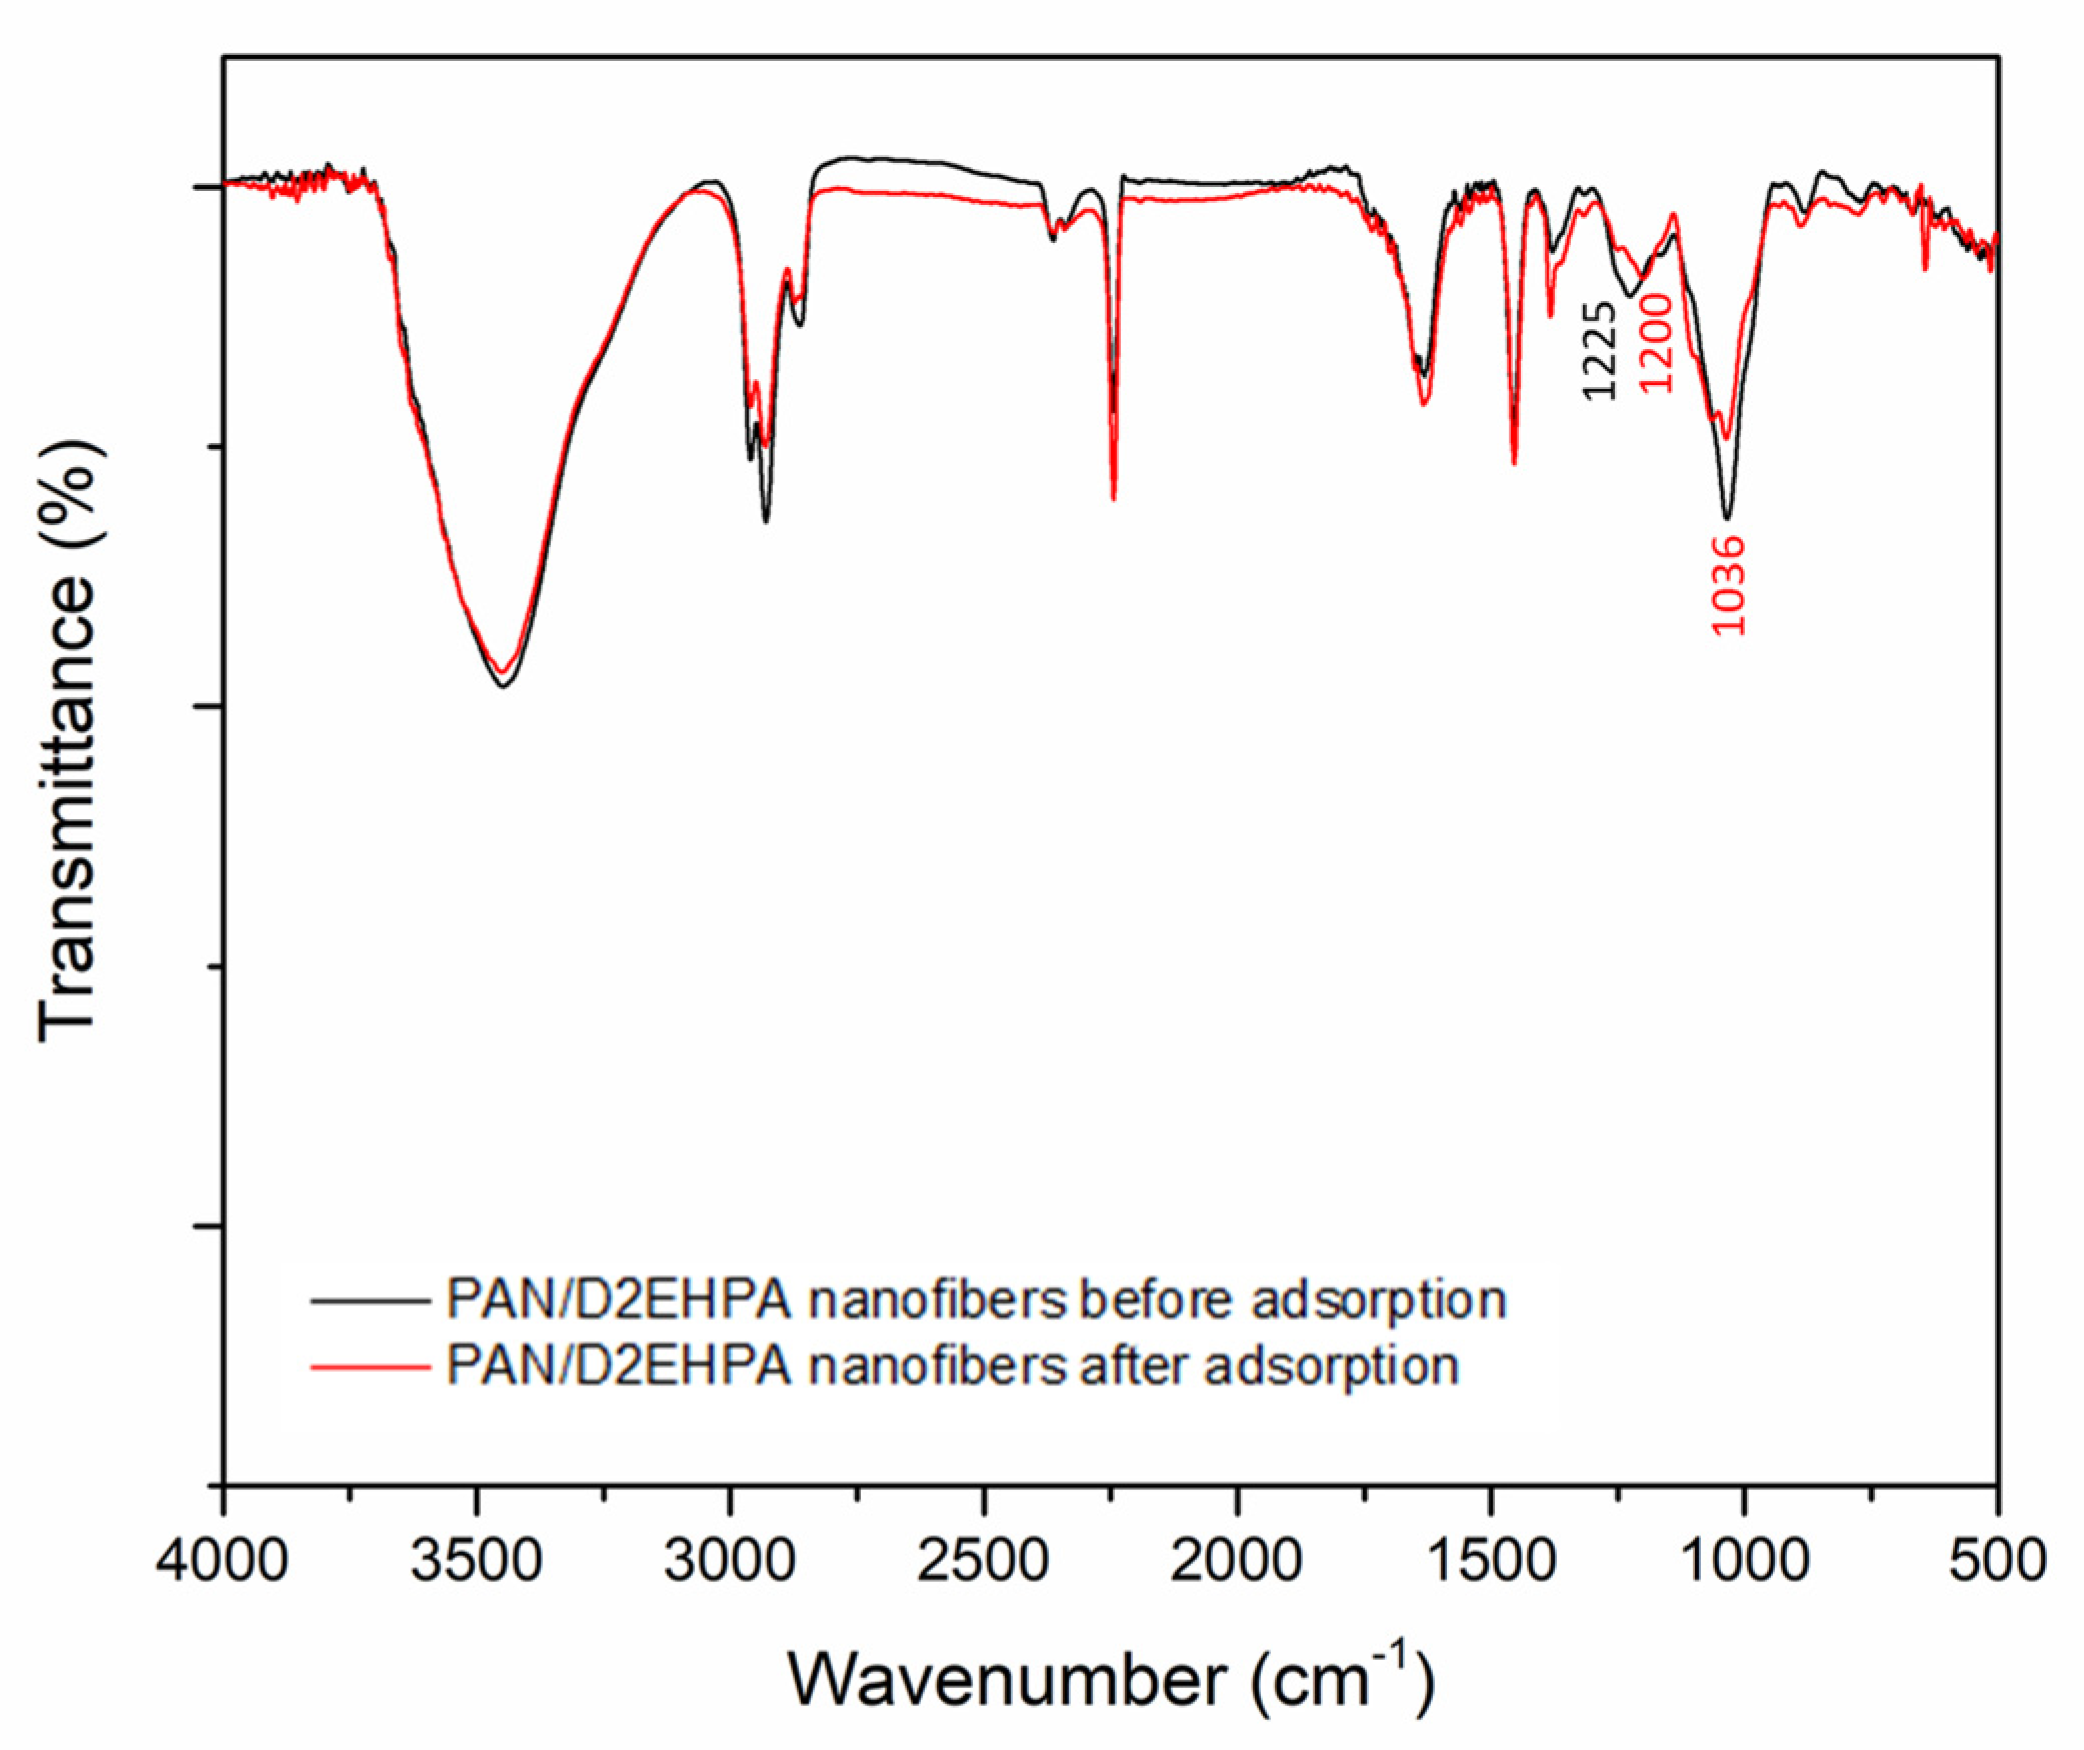
3.1.1. Infrared Spectroscopy (FT-IR) Analysis

The FT-IR spectrum for D2EHPA (Figure 2A) revealed peaks at 2961, 2932, 2861, 1464, and 1381 cm−1, which can be assigned to C-H vibrations of the CH3 and CH2 groups. The characteristic bands at 1229 and 1033 cm−1 correspond to stretching vibrations of P=O and P-OH, respectively [38,52,53].
The PAN spectrum (Figure 2B) showed characteristic bands for N-H at 3445 cm−1 and stretches for C-H at 2940 cm−1 and 1453 cm−1, for C≡N at 2244 cm−1, C=C at 1627 cm−1, and C-N at 1251 cm−1 [54,55].
The PAN nanofiber spectrum (Figure 2C) displayed similar expected characteristic stretches at 3450 cm−1 (N-H), 2930 cm−1 (C-H in CH2), 2245 cm−1 (-CN), 1454 cm−1 (bending of C-H in CH2), but with an exception for the appearance of a carbonyl stretch (C=O) at 1629 cm−1 (C=O) reflecting residual DMF from synthesis [32,55,56,57,58,59].
The spectrum for the PAN/D2EHPA nanofibers (Figure 2D) reflected the sum of the respective spectra for D2EHPA and the PAN nanofibers, confirming the intimacy of the two substances connected through intermolecular interactions, without the breaking of any bonds [60].
The interactions involving the PAN/D2EHPA nanofibers, before and after metal adsorption, were examined (Figure 3). The P=O bond stretching vibration originally observed at 1225 cm−1 for the nanofibers was shifted to a lower frequency of 1200 cm−1 on gallium adsorption, reflecting oxygen coordination with the metal [38]. Furthermore, the decreased magnitude of the 1036 cm−1 peak (associated with P-OH stretching) suggests substitution of hydrogen ions by the metal ions in the cation exchange mechanism [61].
In addition, the main reaction of the D2EHPA extractant with the metal (Ga3+) is shown in Equation (14) [3]:
G a 3 + + 2 ( R H ) 2 G a R 3 R H + 3 H +

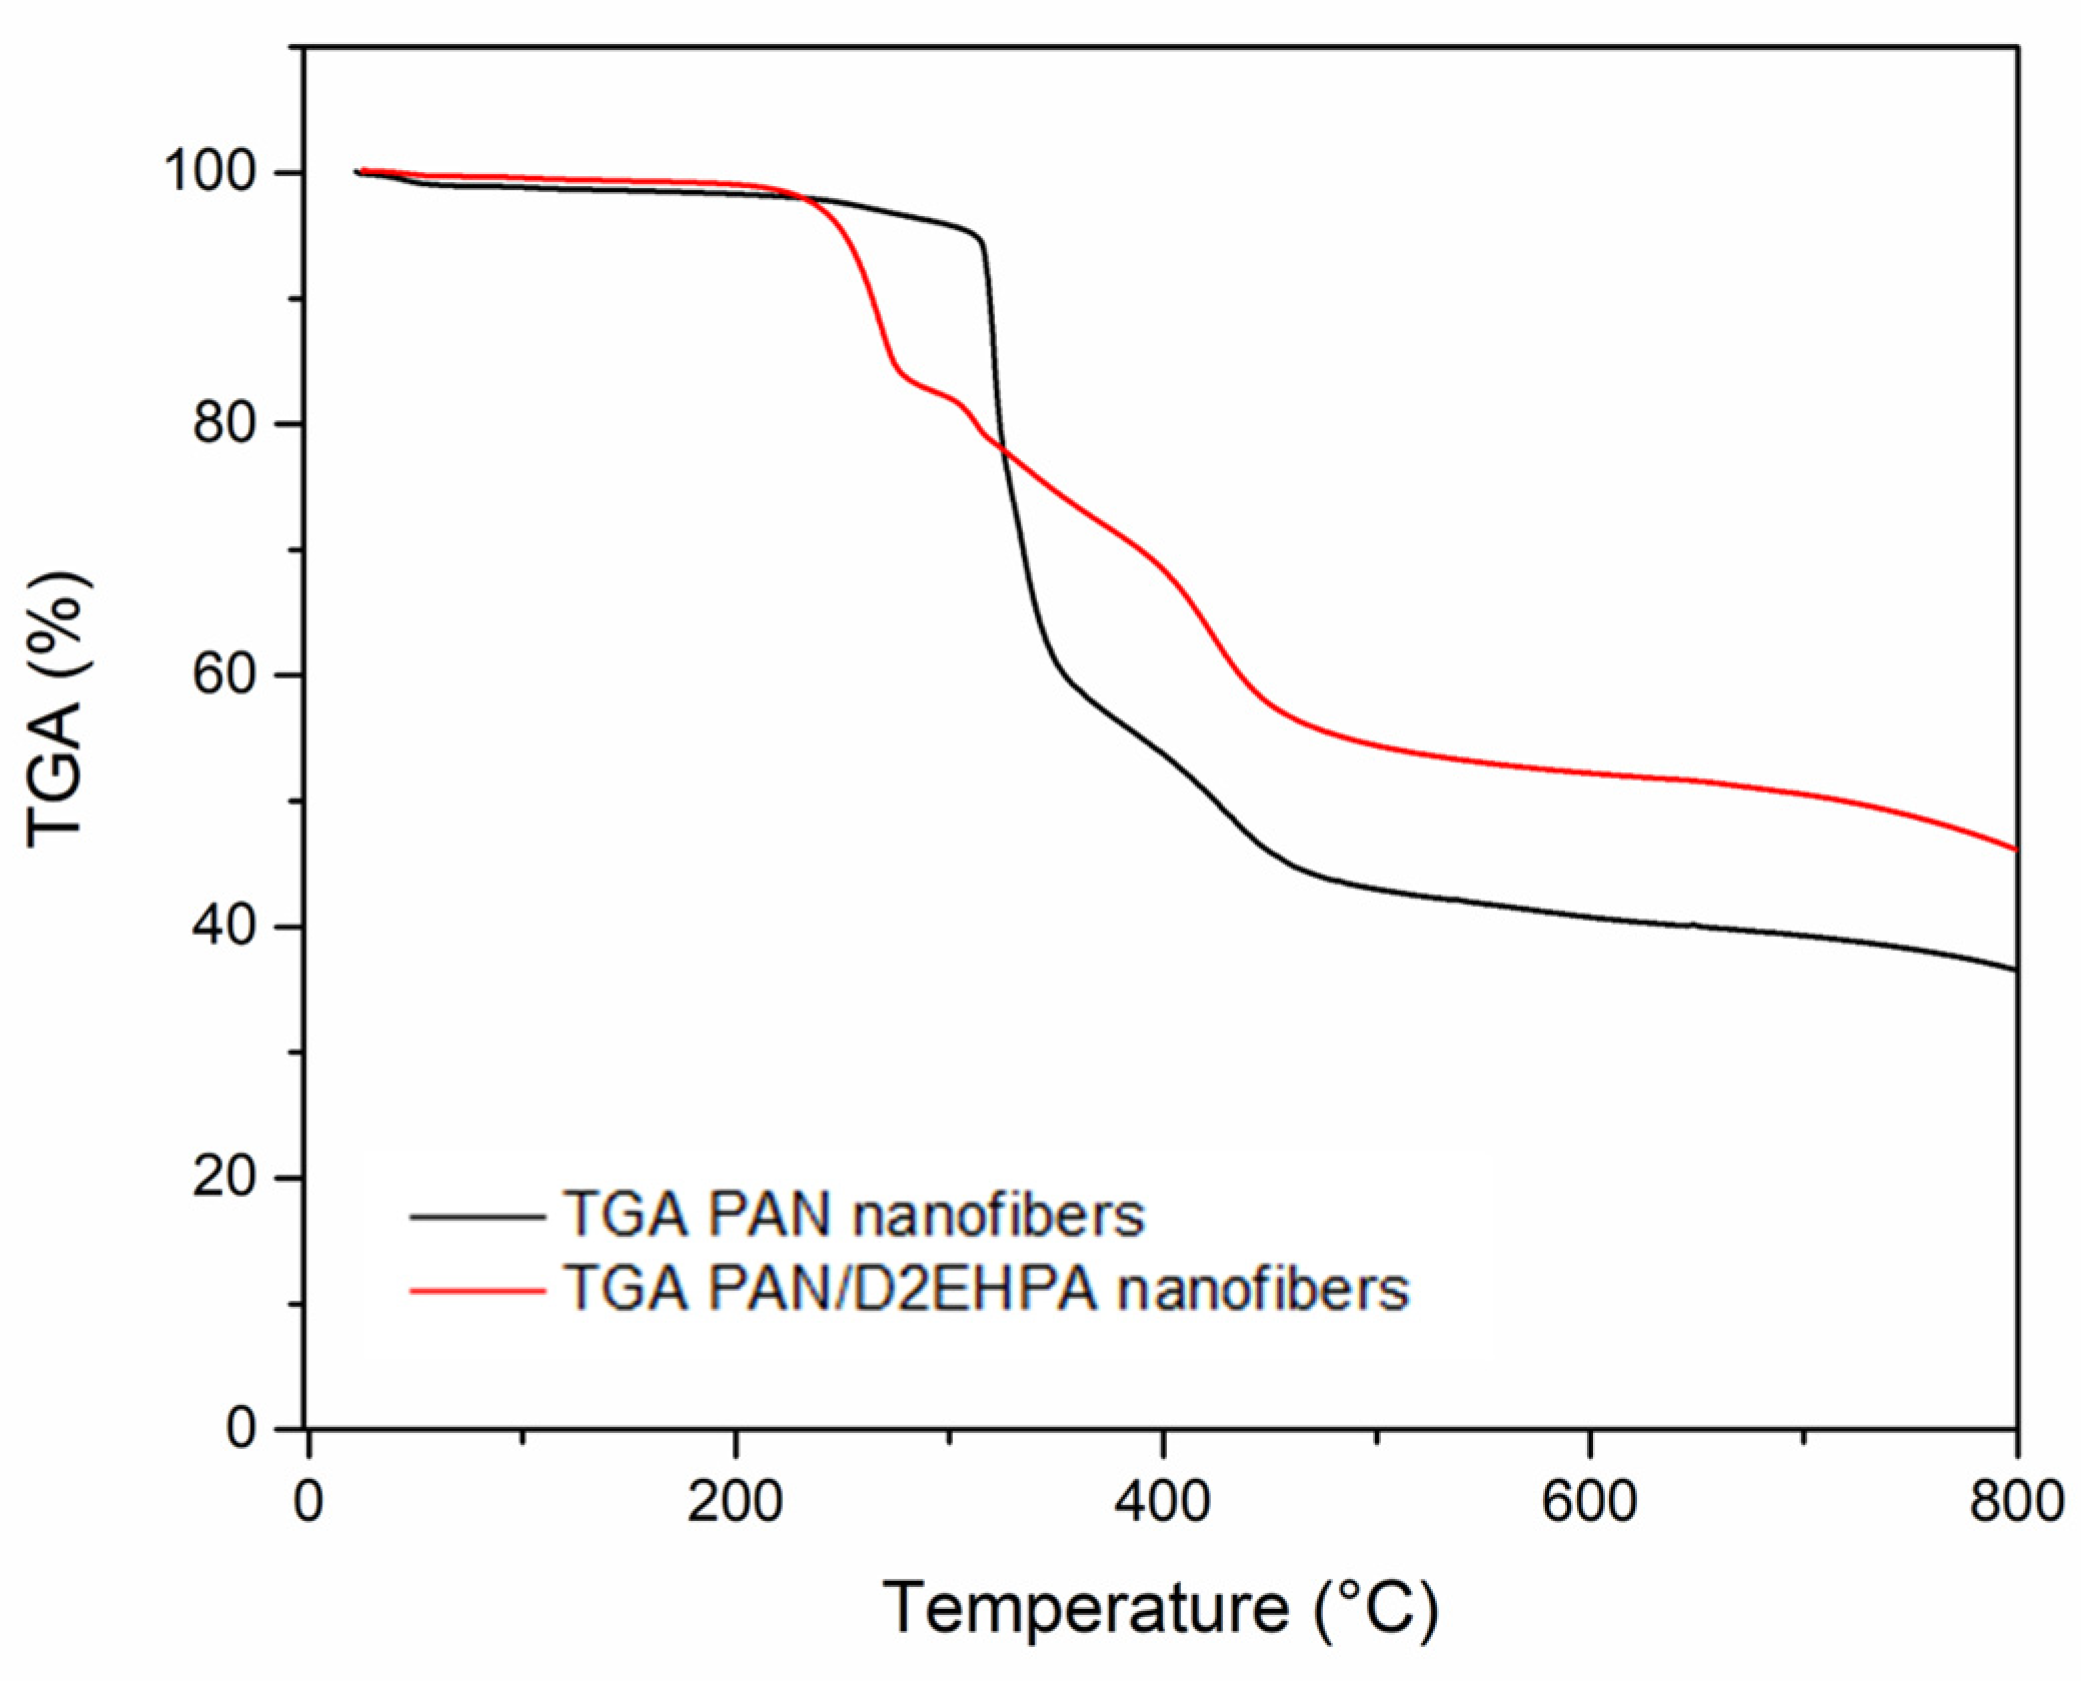
3.1.2. Thermogravimetric Analysis (TGA)

Figure 4 shows the thermogravimetric (TGA) curves for PAN nanofibers and PAN/D2EHPA nanofibers with polymer/extractant ratio of 80/20 (% w/w). The curves present an initial weight loss of up to 5% between 30 and 310 °C and between 30 and 240 °C for the PAN nanofibers and the PAN/D2EHPA nanofibers, respectively. This initial weight loss may be attributed to the removal of water and residual DMF in the polymer [31].
The PAN/D2EHPA nanofibers revealed three further stages of weight loss. The stage from 240 to 300 °C reflected the decomposition of D2EHPA within the nanofibers [42]. This was followed by further weight loss between 300 and 450 °C due to PAN degradation or dissociation [31]. The final stage occurred between 450 and 700 °C and corresponds with the slowed disintegration of D2EHPA and the PAN dissociation until stabilization [44].
Whilst the D2EHPA-loaded nanofiber degradation process started at a lower temperature, the quantity of residue at temperatures above 500 °C that remained was higher for these nanofibers compared to the pure nanofibers. According to Singh et al. (2013), the TGA results of pure D2EHPA indicate that at a temperature of 500 °C, the resulting final mass is ~25–30% of the initial mass. As can be seen in the TGA (Figure 4) at 500 °C, the PAN nanofibers have a final mass of ~40% of the initial mass, while the PAN/D2EHPA nanofibers have a final mass of ~55% of the initial mass. This 15% difference between the final masses may be due to the presence of a remaining portion of D2EHPA in the modified fibers [62]. This portion of remaining organic solvent may have been loaded into the pores of the adsorbent material, resulting in greater thermal stability [63]. In addition, the weight loss verified for the PAN/D2EHPA nanofibers was lower than for the PAN nanofibers. Overall, this profile is indicative of good thermal stability and strength of the PAN/D2EHPA nanofibers for the process application studied herein.

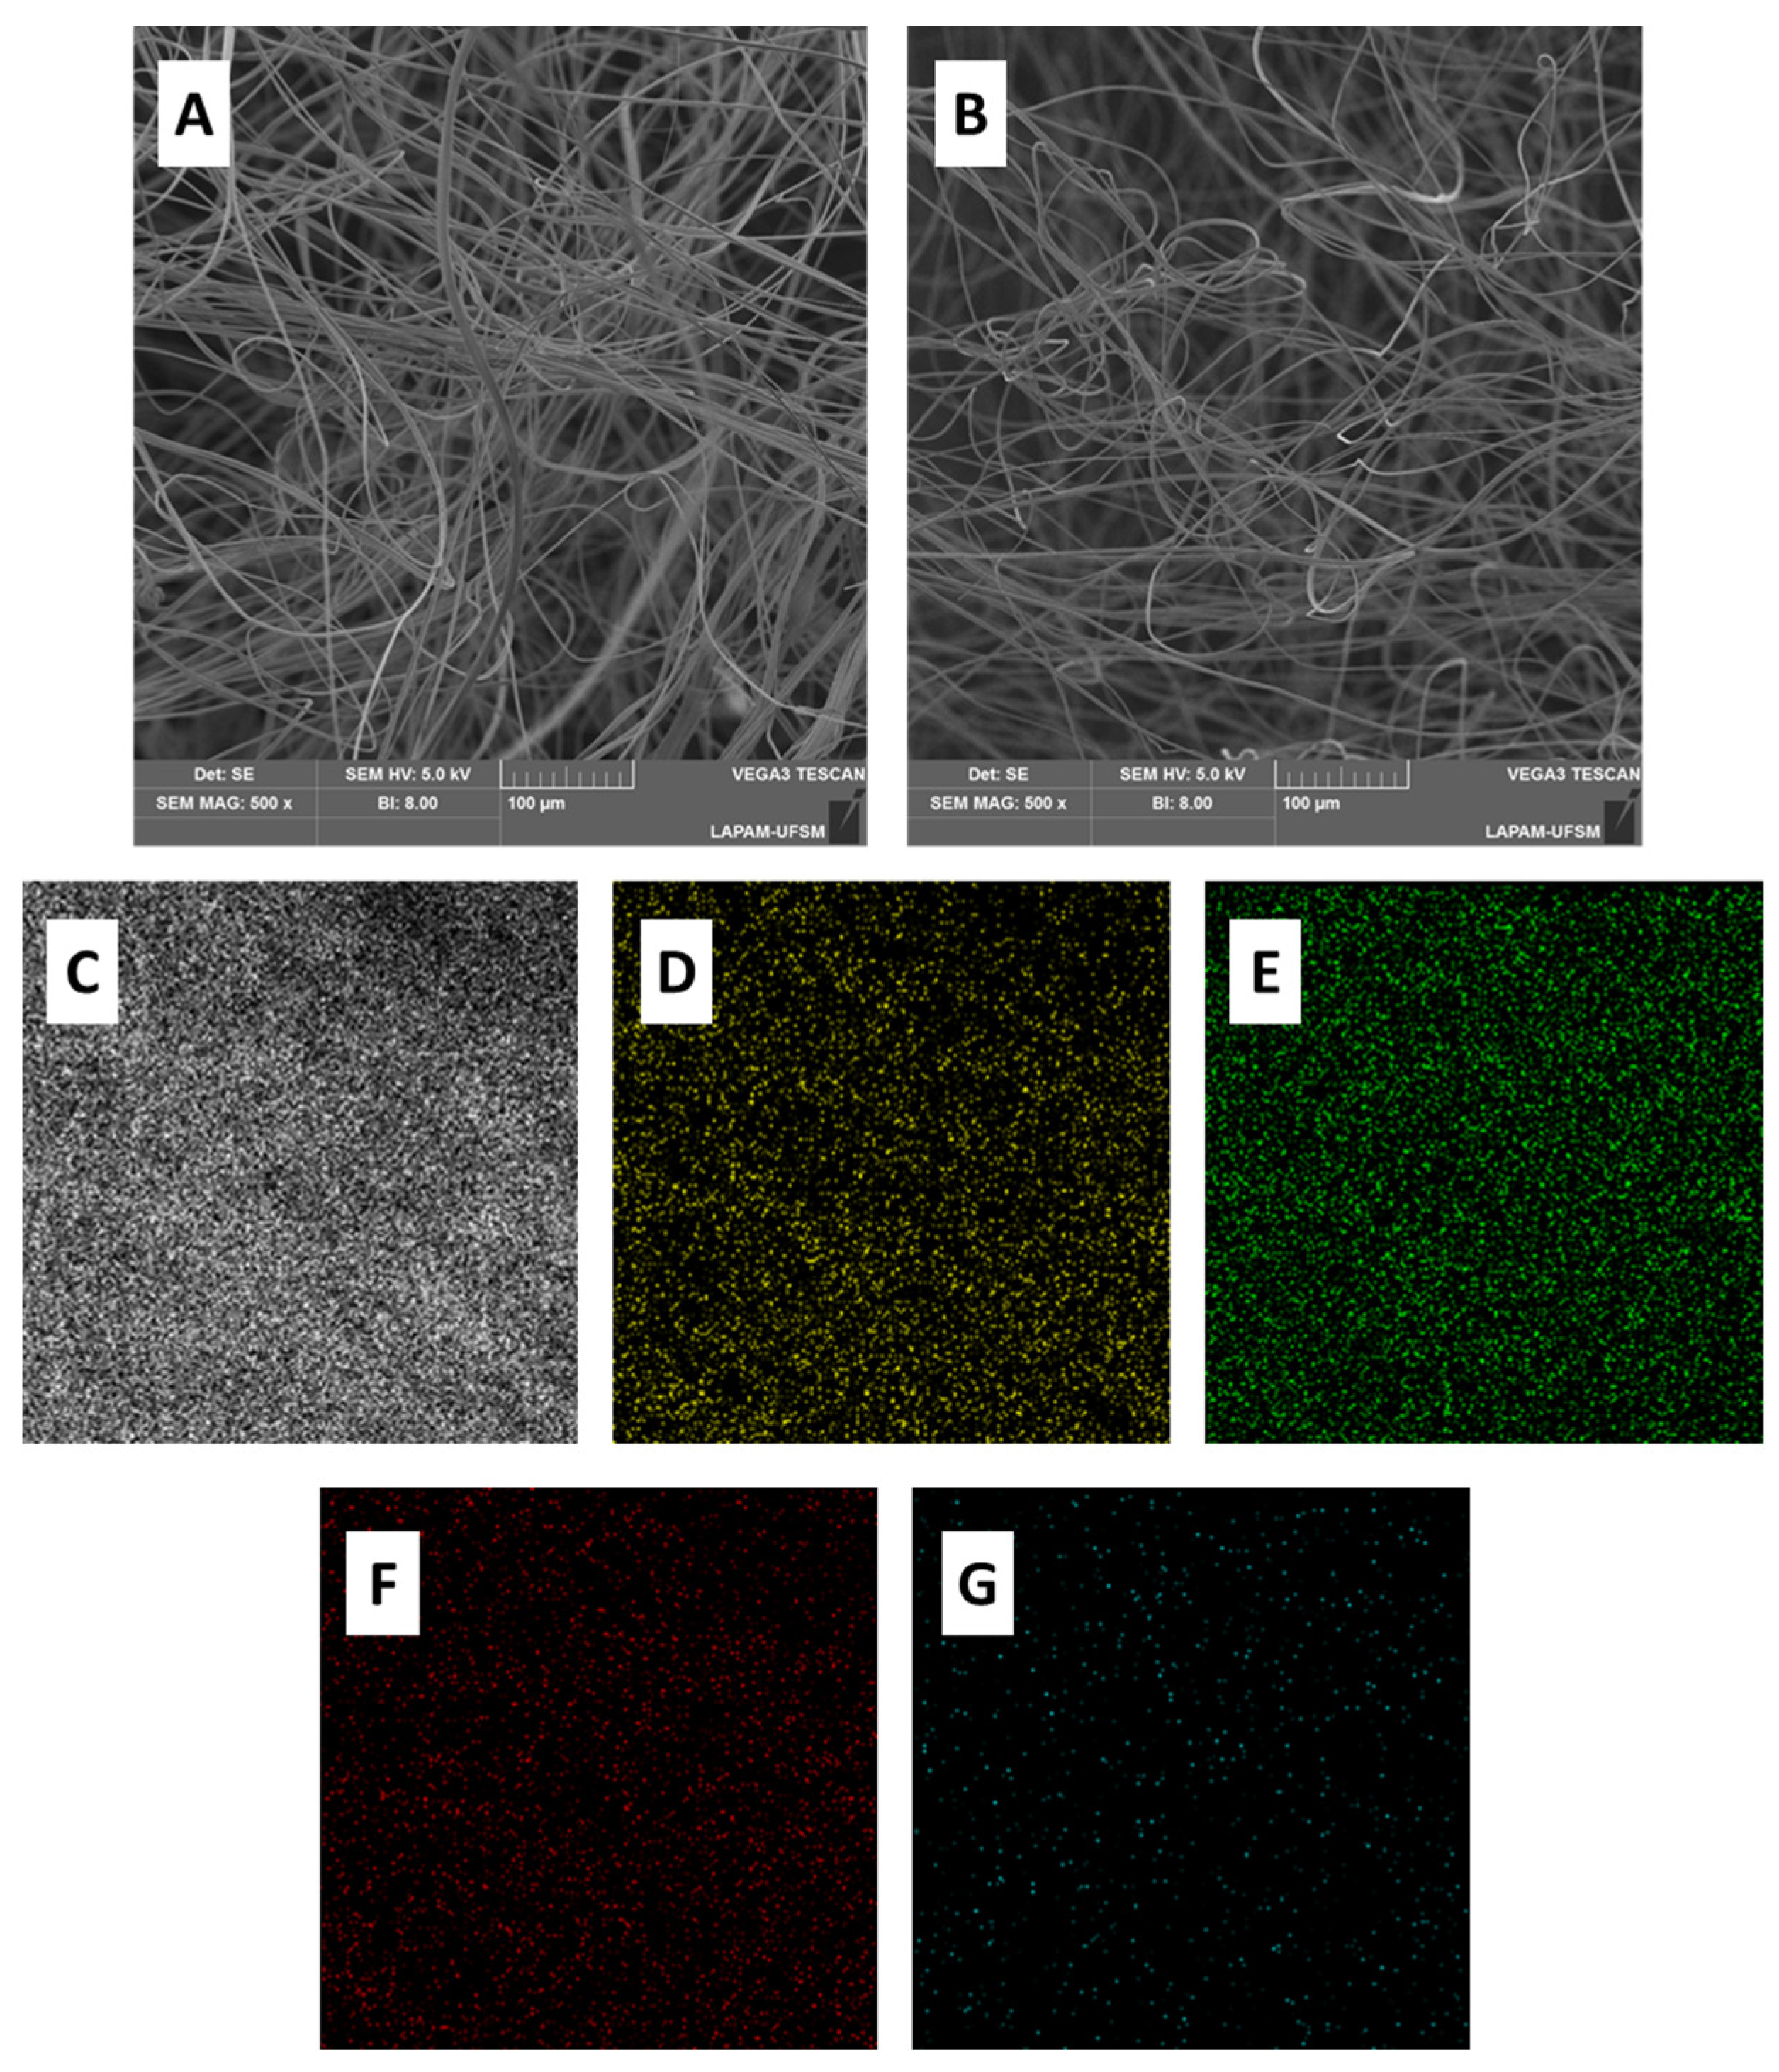
3.1.3. Scanning Electron Microscopy (SEM)

The SEM images of the nanofibers (Figure 5) showed homogeneous structures of the PAN (Figure 5A) and PAN/D2EHPA (Figure 5B) nanofibers. There was no evidence of agglomeration or granule formation along the respective nanofiber structures. The PAN/D2EHPA nanofiber diameters ranged between 530 and 950 nm, whilst the pure PAN nanofibers had a narrower diameter range between 900 and 1100 nm, the difference being attributed to the addition of D2EHPA, which is considered to have reduced the viscosity of the polymeric solution, leading to alterations in the nanofiber structure and resulting in a smaller diameter [64].
The SEM-EDS mapping of the PAN/D2EHPA nanofibers after adsorption of the metal showed (Figure 5C–F) good uniformity in distribution along the nanofiber surface for carbon, nitrogen (present in the polyacrylonitrile), phosphorus, and oxygen (D2EHPA). This confirmed that the extractant was well adhered to the fibers’ structure along their entire length. Significantly, gallium (Figure 5G) was also observed uniformly distributed along the nanofiber surface after adsorption.

3.2. Adsorption of Gallium

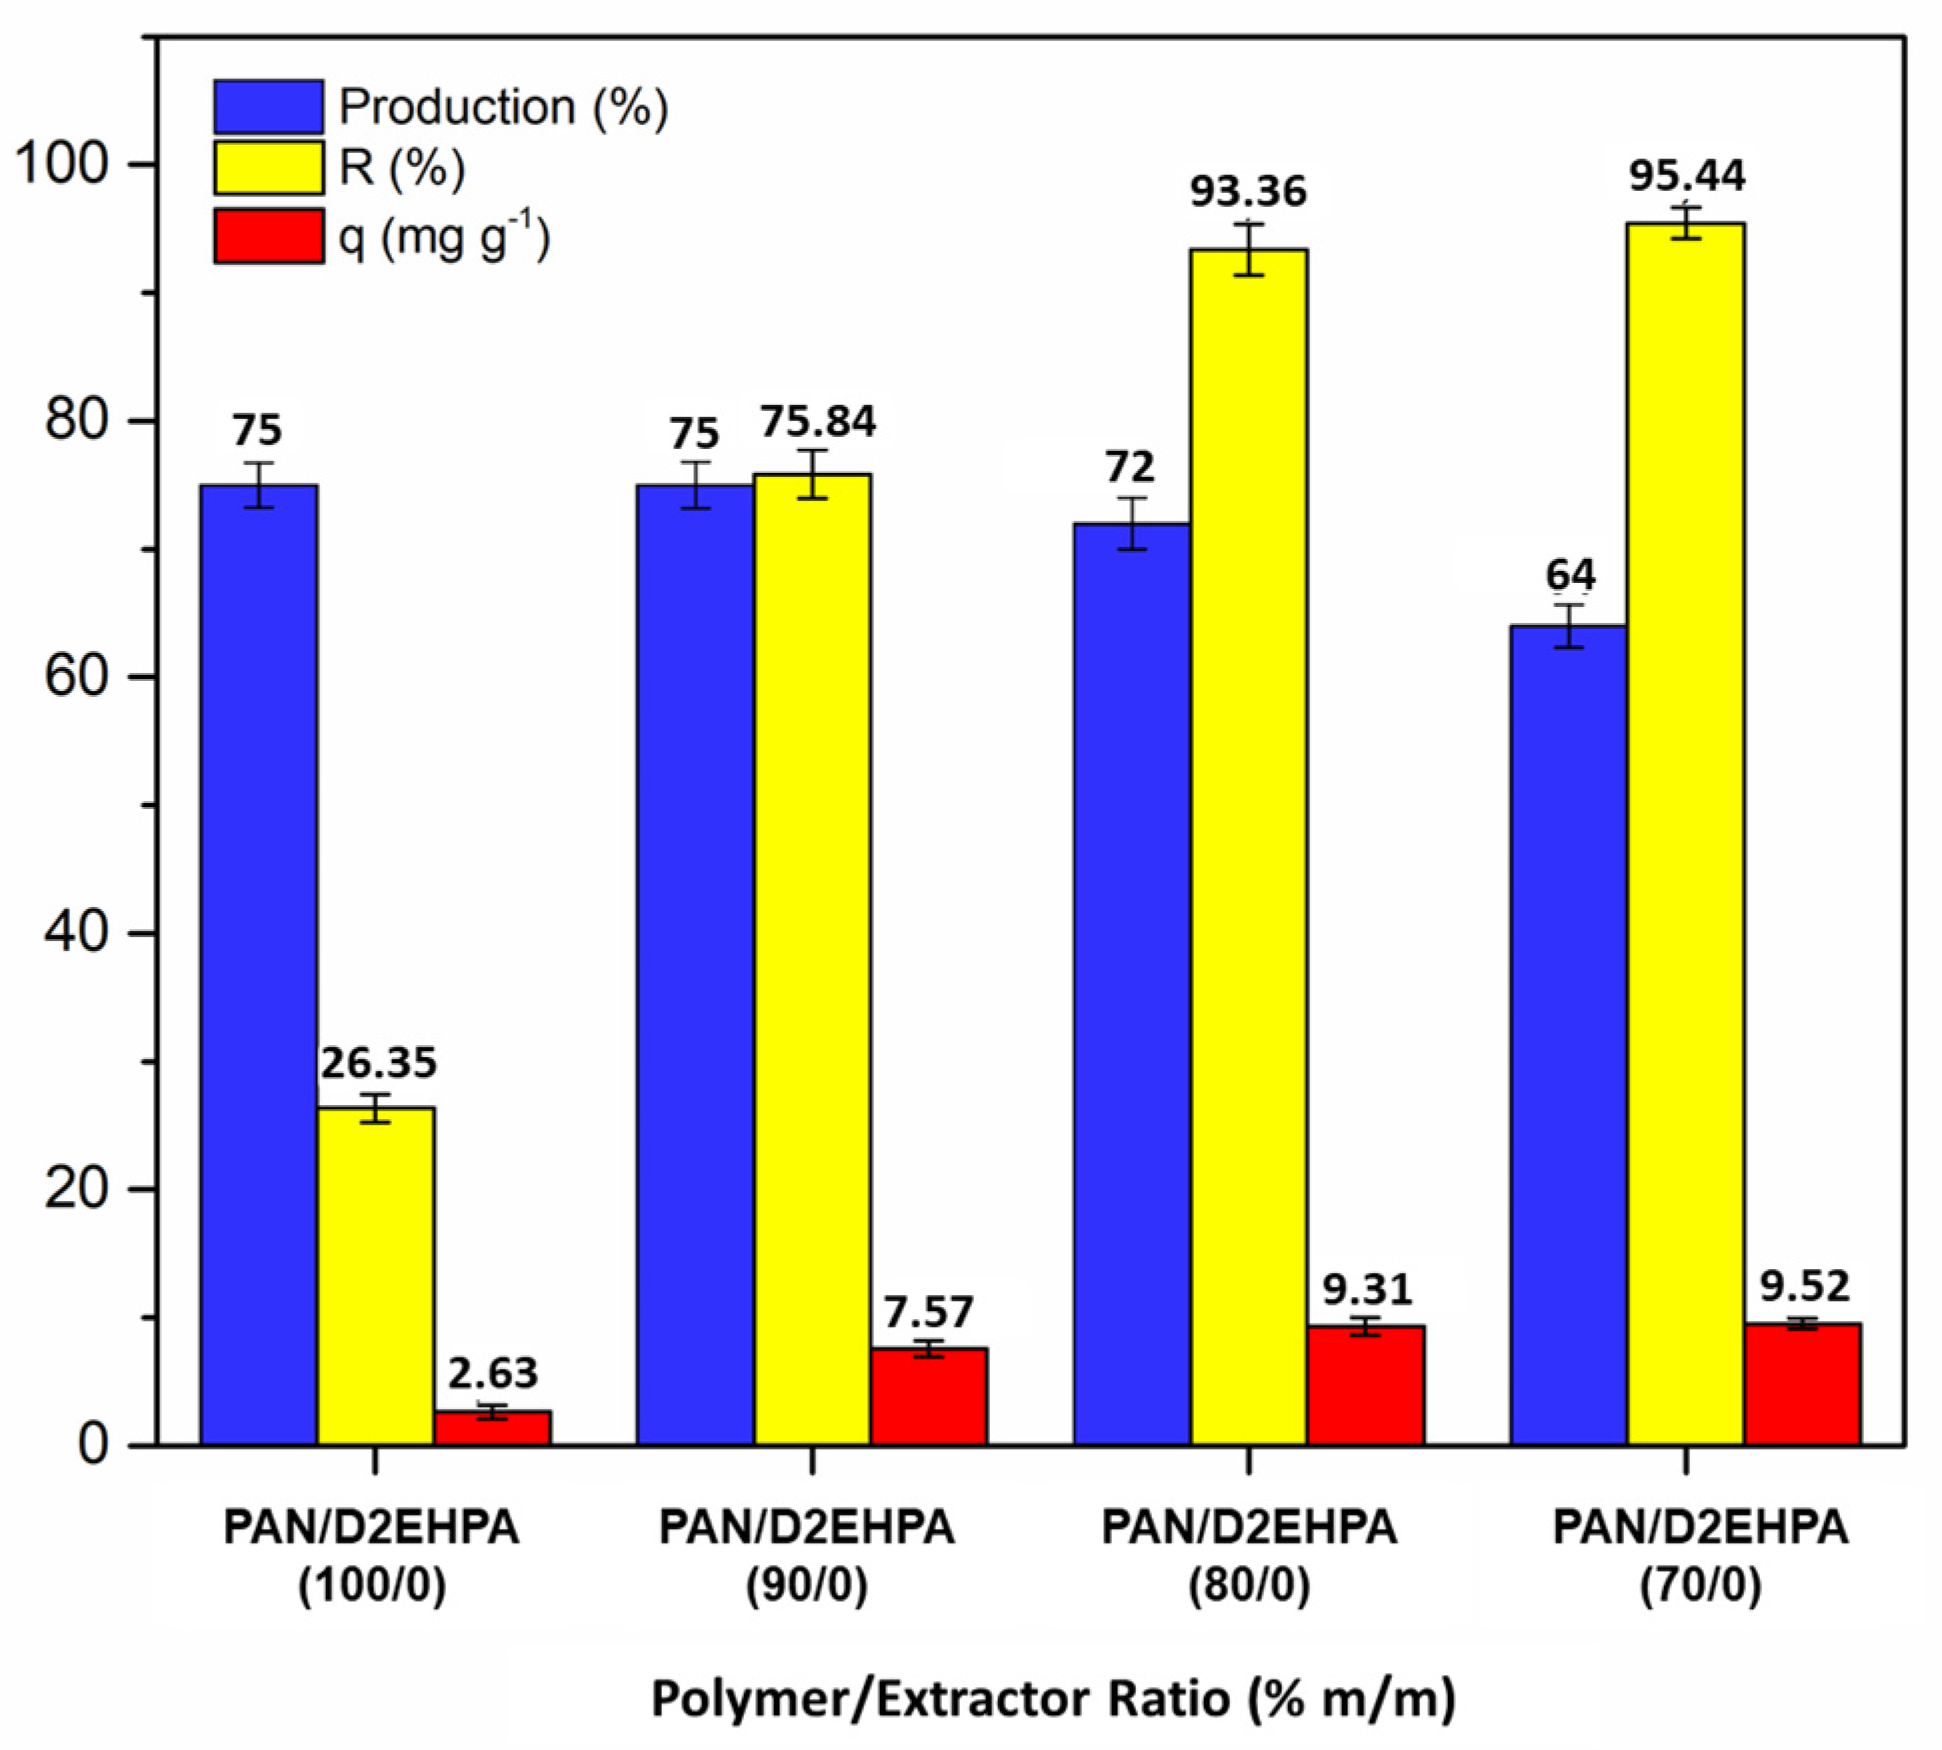
3.2.1. Effect of Polymer/Extractant Ratio
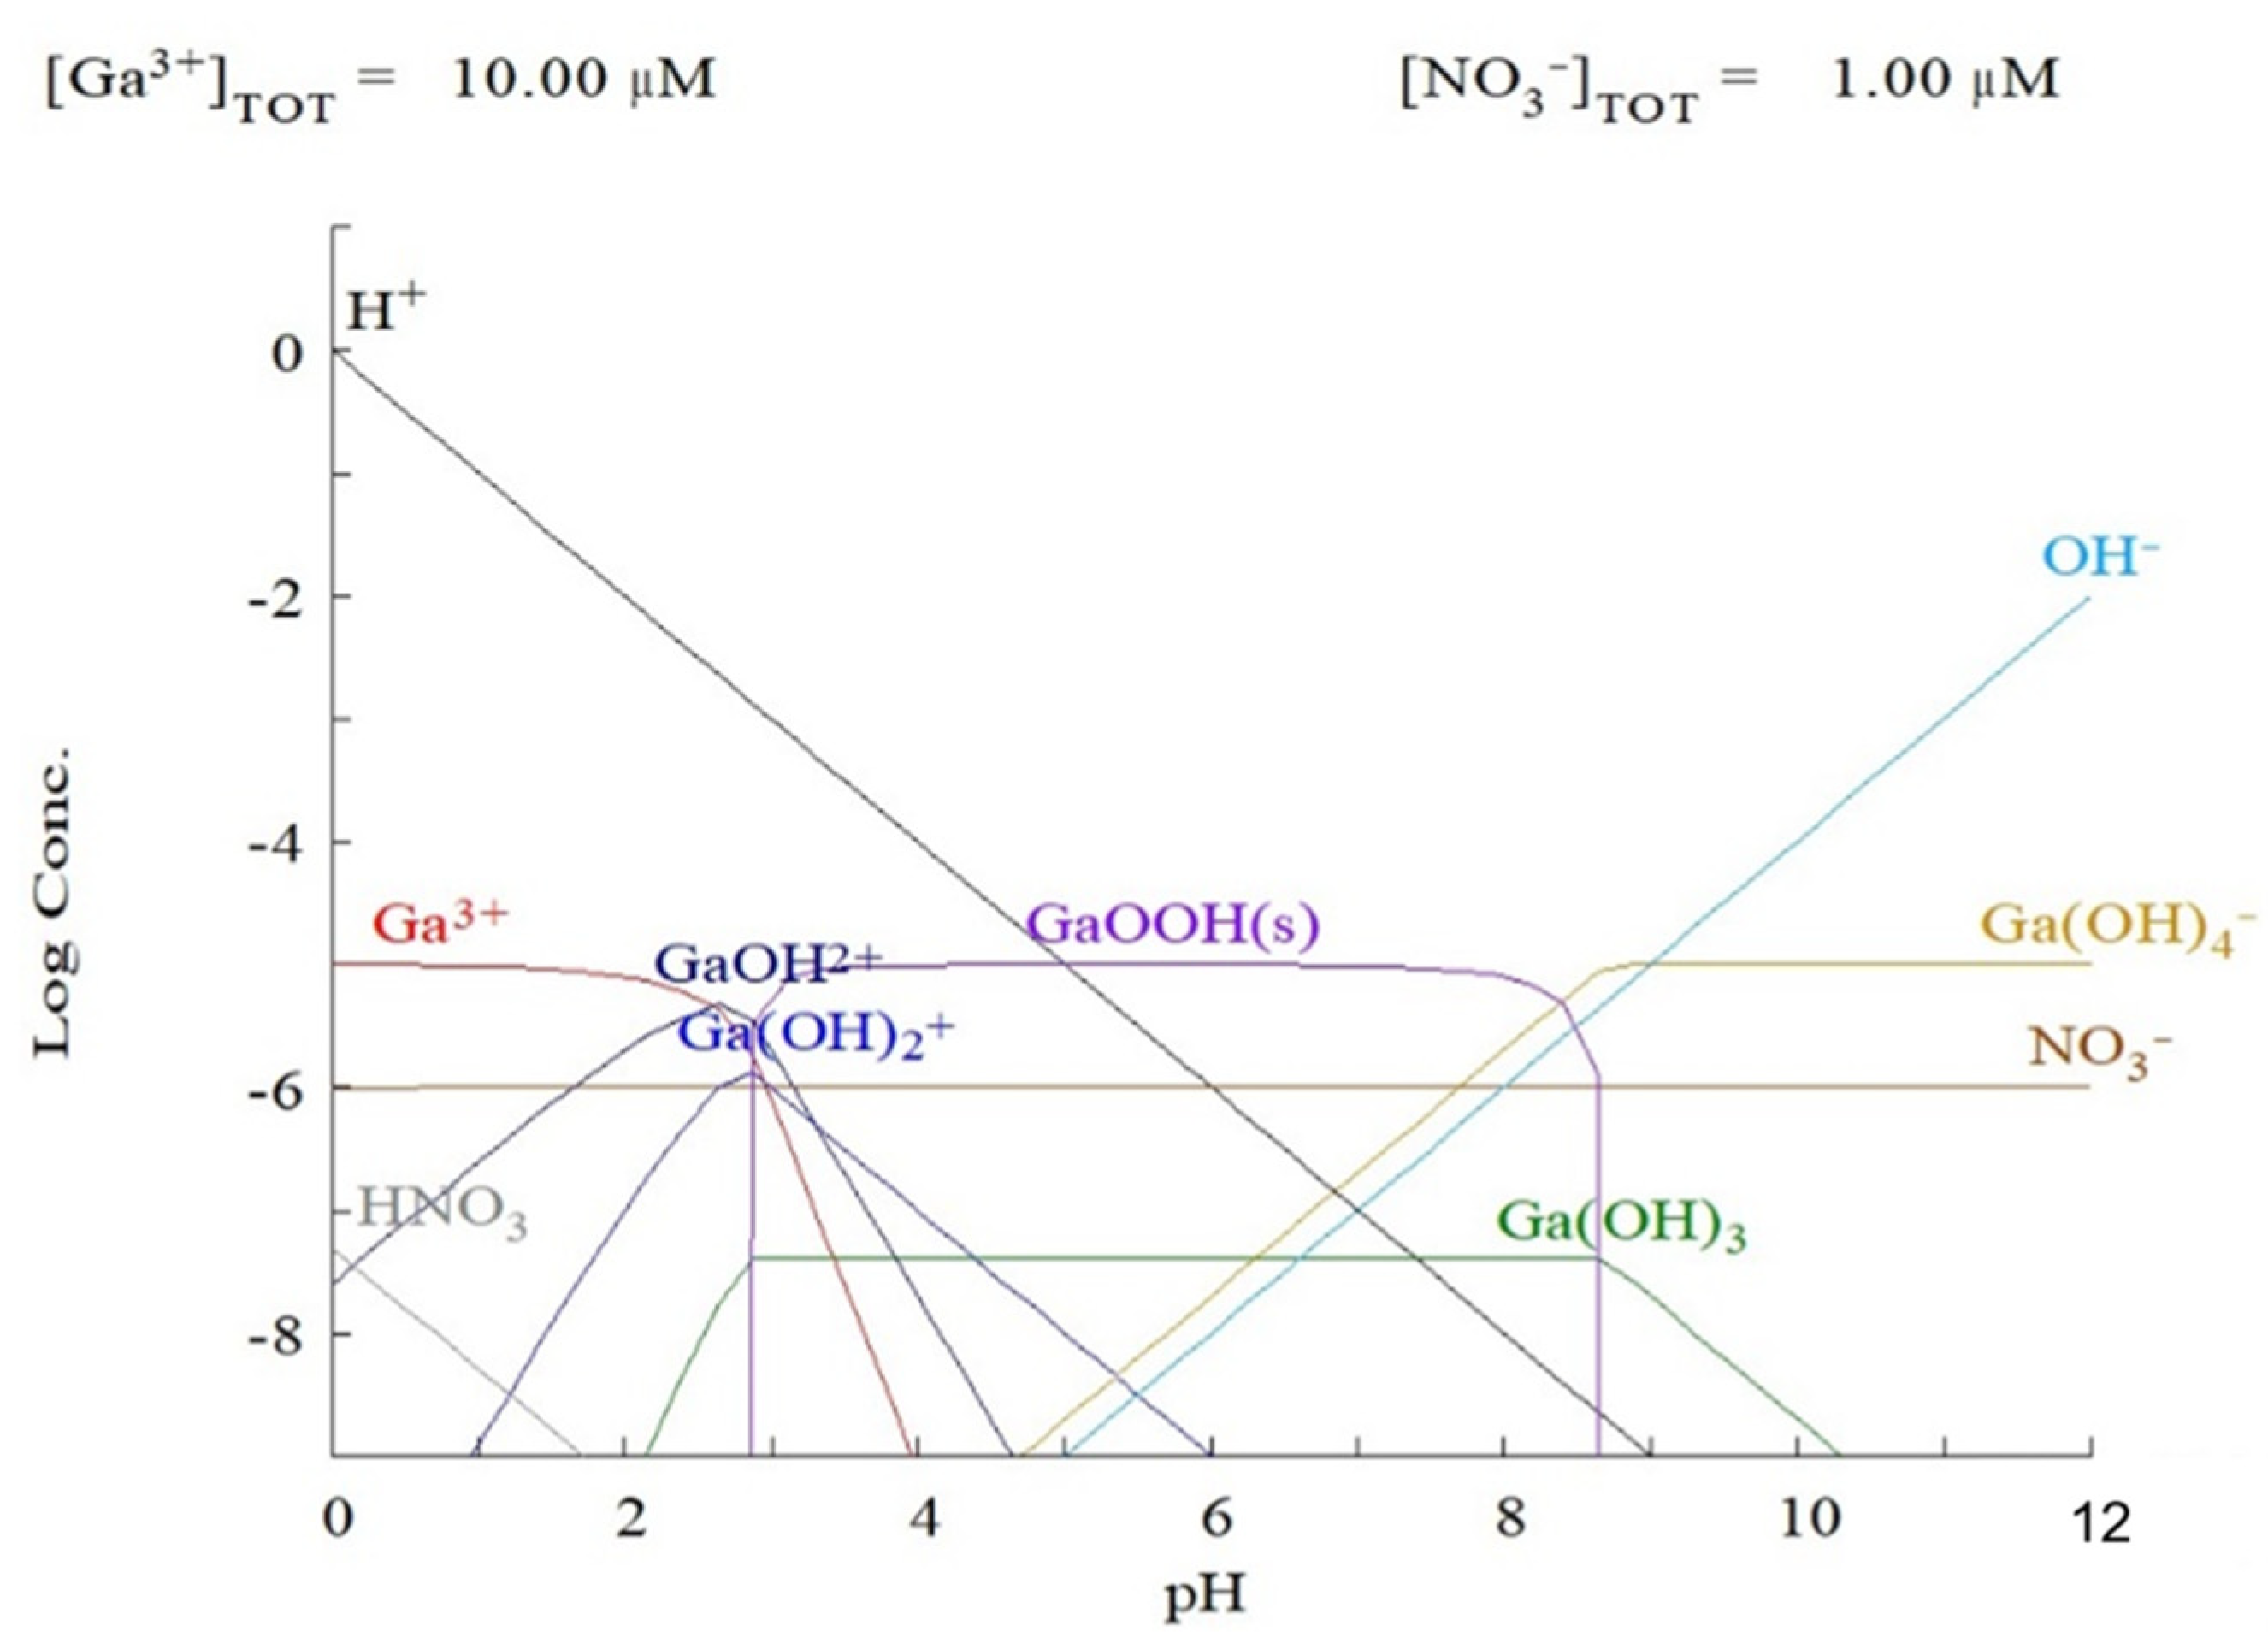
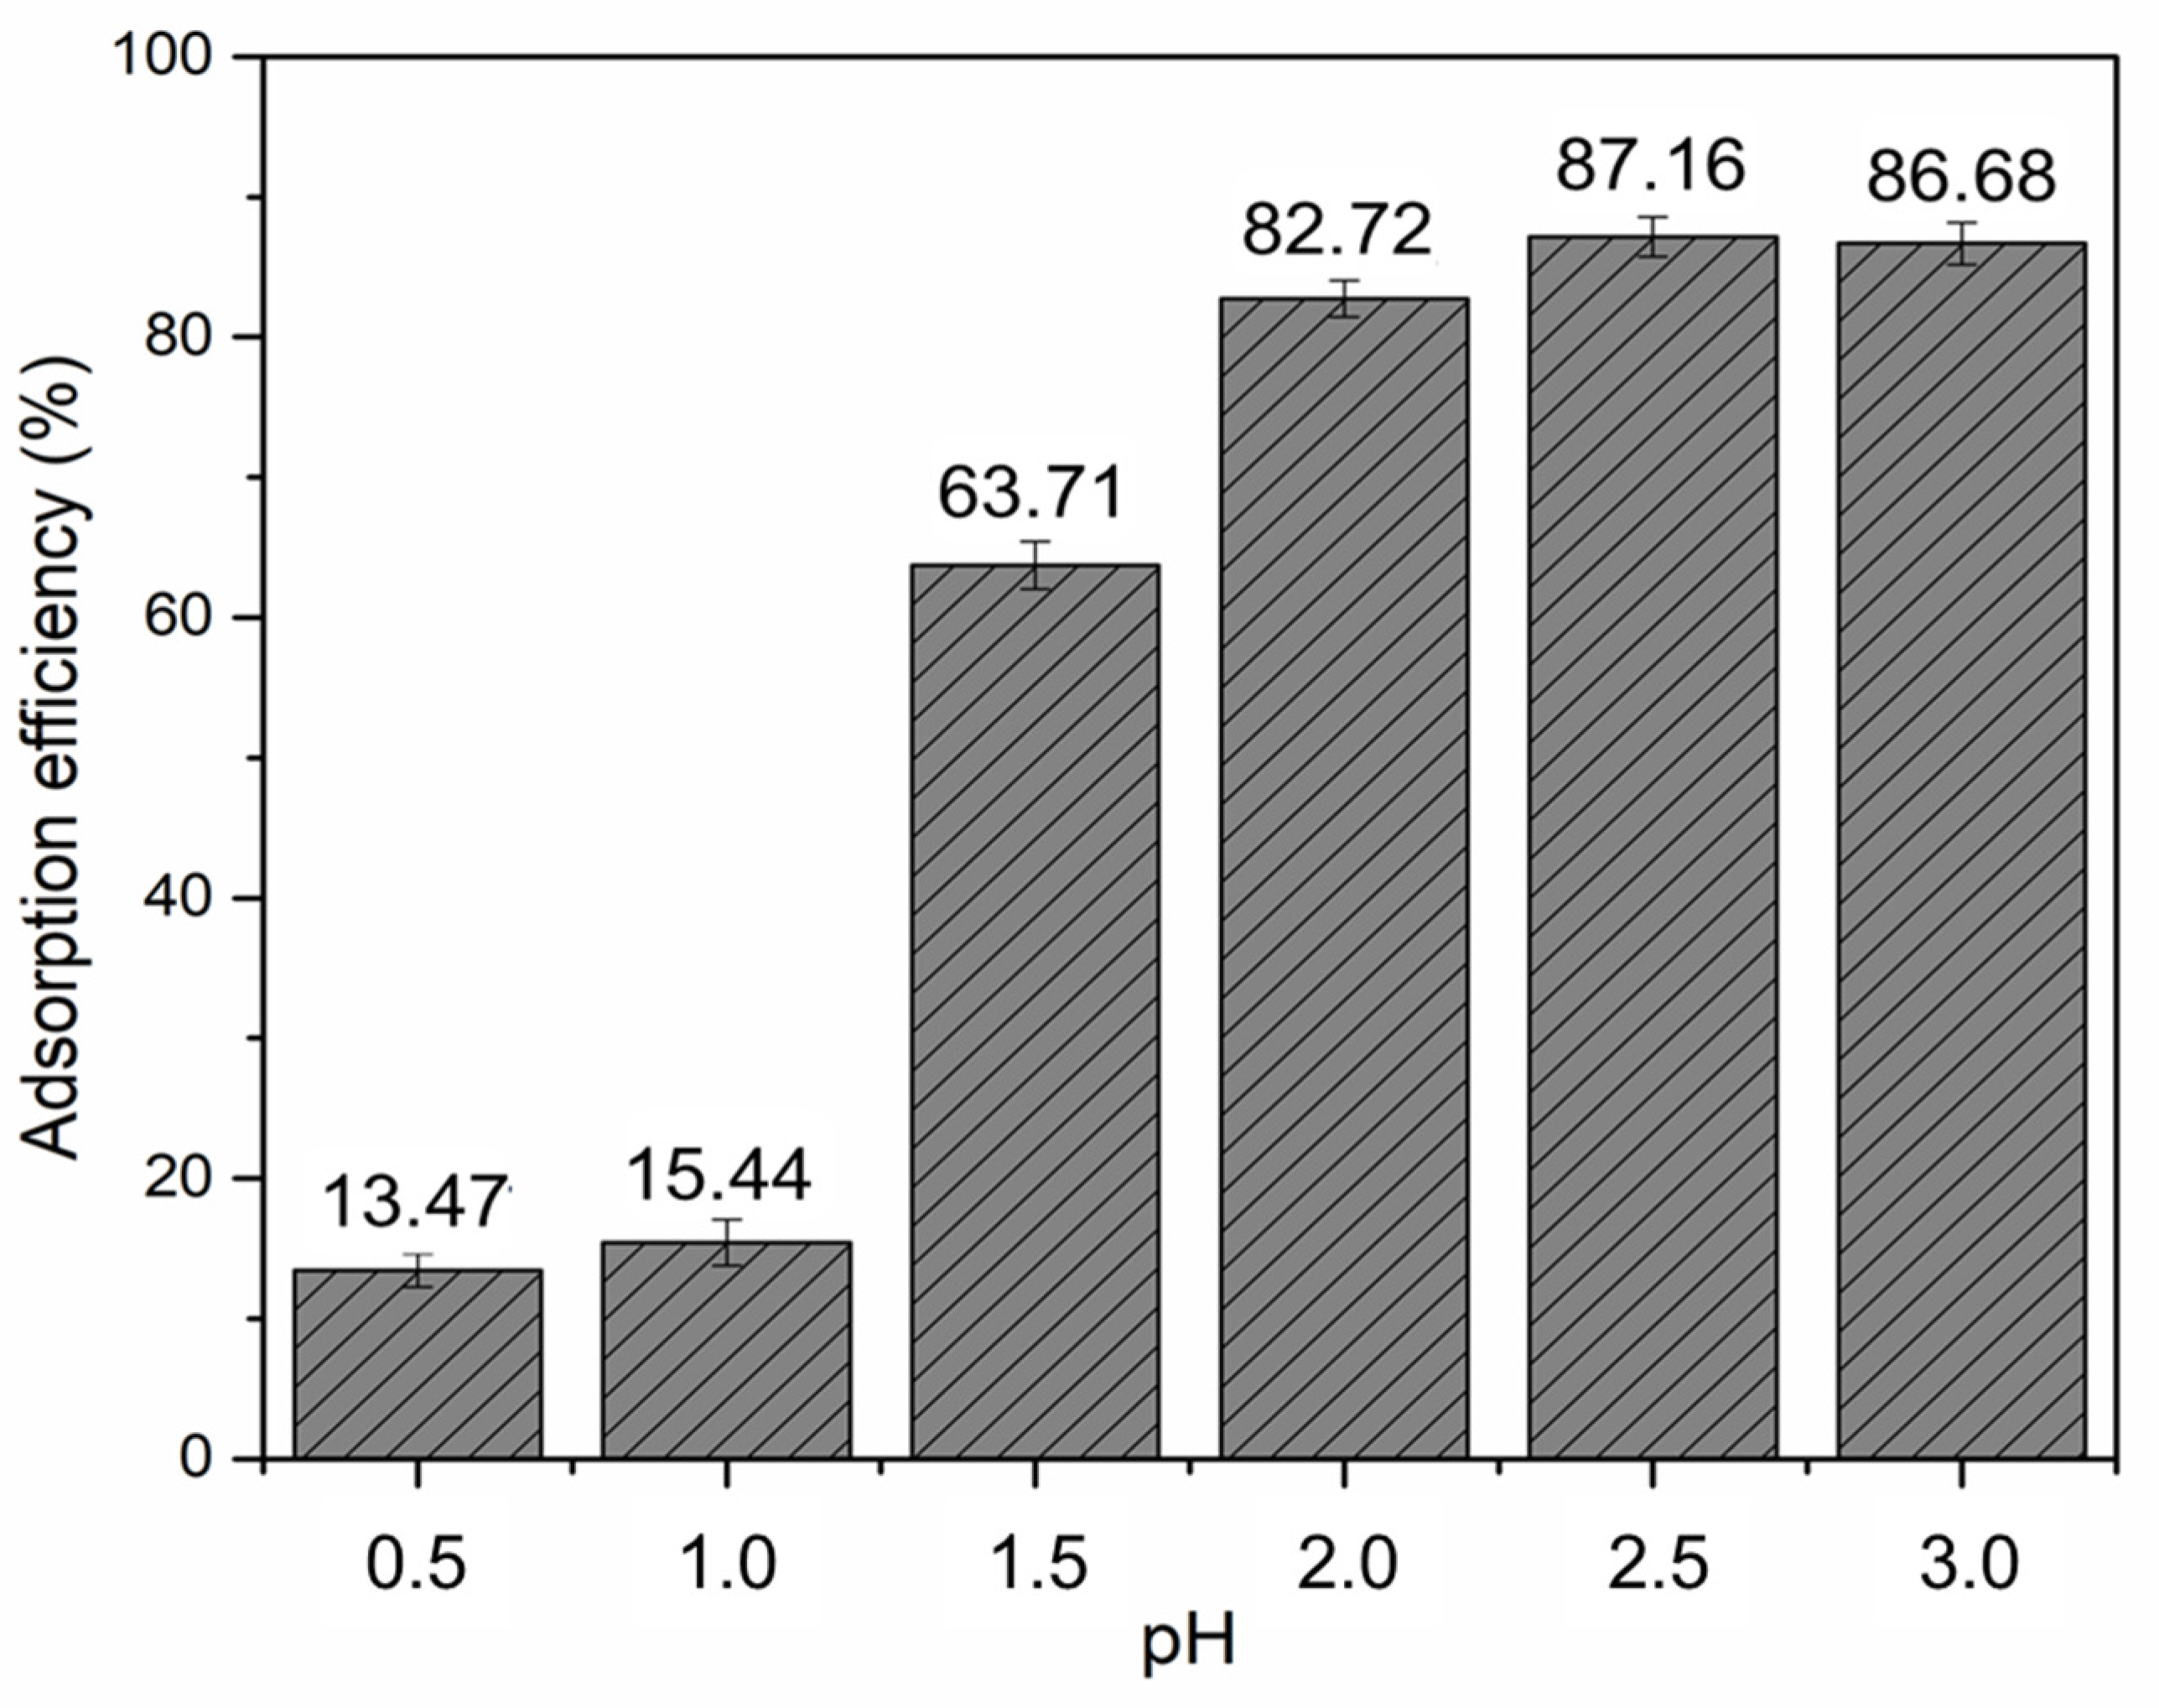
Figure 6 shows the gallium adsorption capacities and removal efficiencies for the nanofibers using different polymer/extractant ratios. The nanofiber production yield was also evaluated according to the percentage of extractant in the polymeric solution.
Increasing the D2EHPA concentration in the nanofiber composition resulted in an increase in the efficiency of metal adsorption, where D2EHPA concentrations of 20 and 30% demonstrated the greater adsorption of gallium. However, increasing D2EHPA concentration in nanofiber production led to lower nanofiber yields with decreased fiber diameter and lower uniformity. The formation of nanofibers was impossible when the extractant proportion surpassed 30% by weight [65]. Therefore, the nanofibers containing 20% of extractant were selected for use in the subsequent experiments, since they provided high metal adsorption efficiency, without significant loss of production capacity.
It is notable that nanofibers without any D2EHPA extractant content show some capacity, although low, for metal adsorption. This can be attributed to the inherent chemical and physical characteristics of the PAN nanofibers that facilitate some metal adsorption [23].

3.2.2. Effect of pH

A chemical speciation diagram for gallium (Figure 7) was generated using Hydra/Medusa software version 2.0 to identify the optimal solution pH for the adsorption of gallium ions onto PAN/D2EHPA nanofibers. Ga3+ species was identified as being available in solutions below pH 4; however, precipitation of the metal could occur at pH above ~3.0, which could lead to a false increase in the adsorption capacity values.
A study on the effects of pH on gallium adsorption (Figure 8) revealed that pH 2.5 was optimal for maximum Ga adsorption efficiency, which was in agreement with the literature [3,20,51]. A lower pH introduces competition from greater concentrations of H+ ions with gallium ions, thus preventing adsorption of the Ga3+ cations [20,51]. Thus, pH 2.5 as the optimal value was used for the subsequent adsorption experiments.

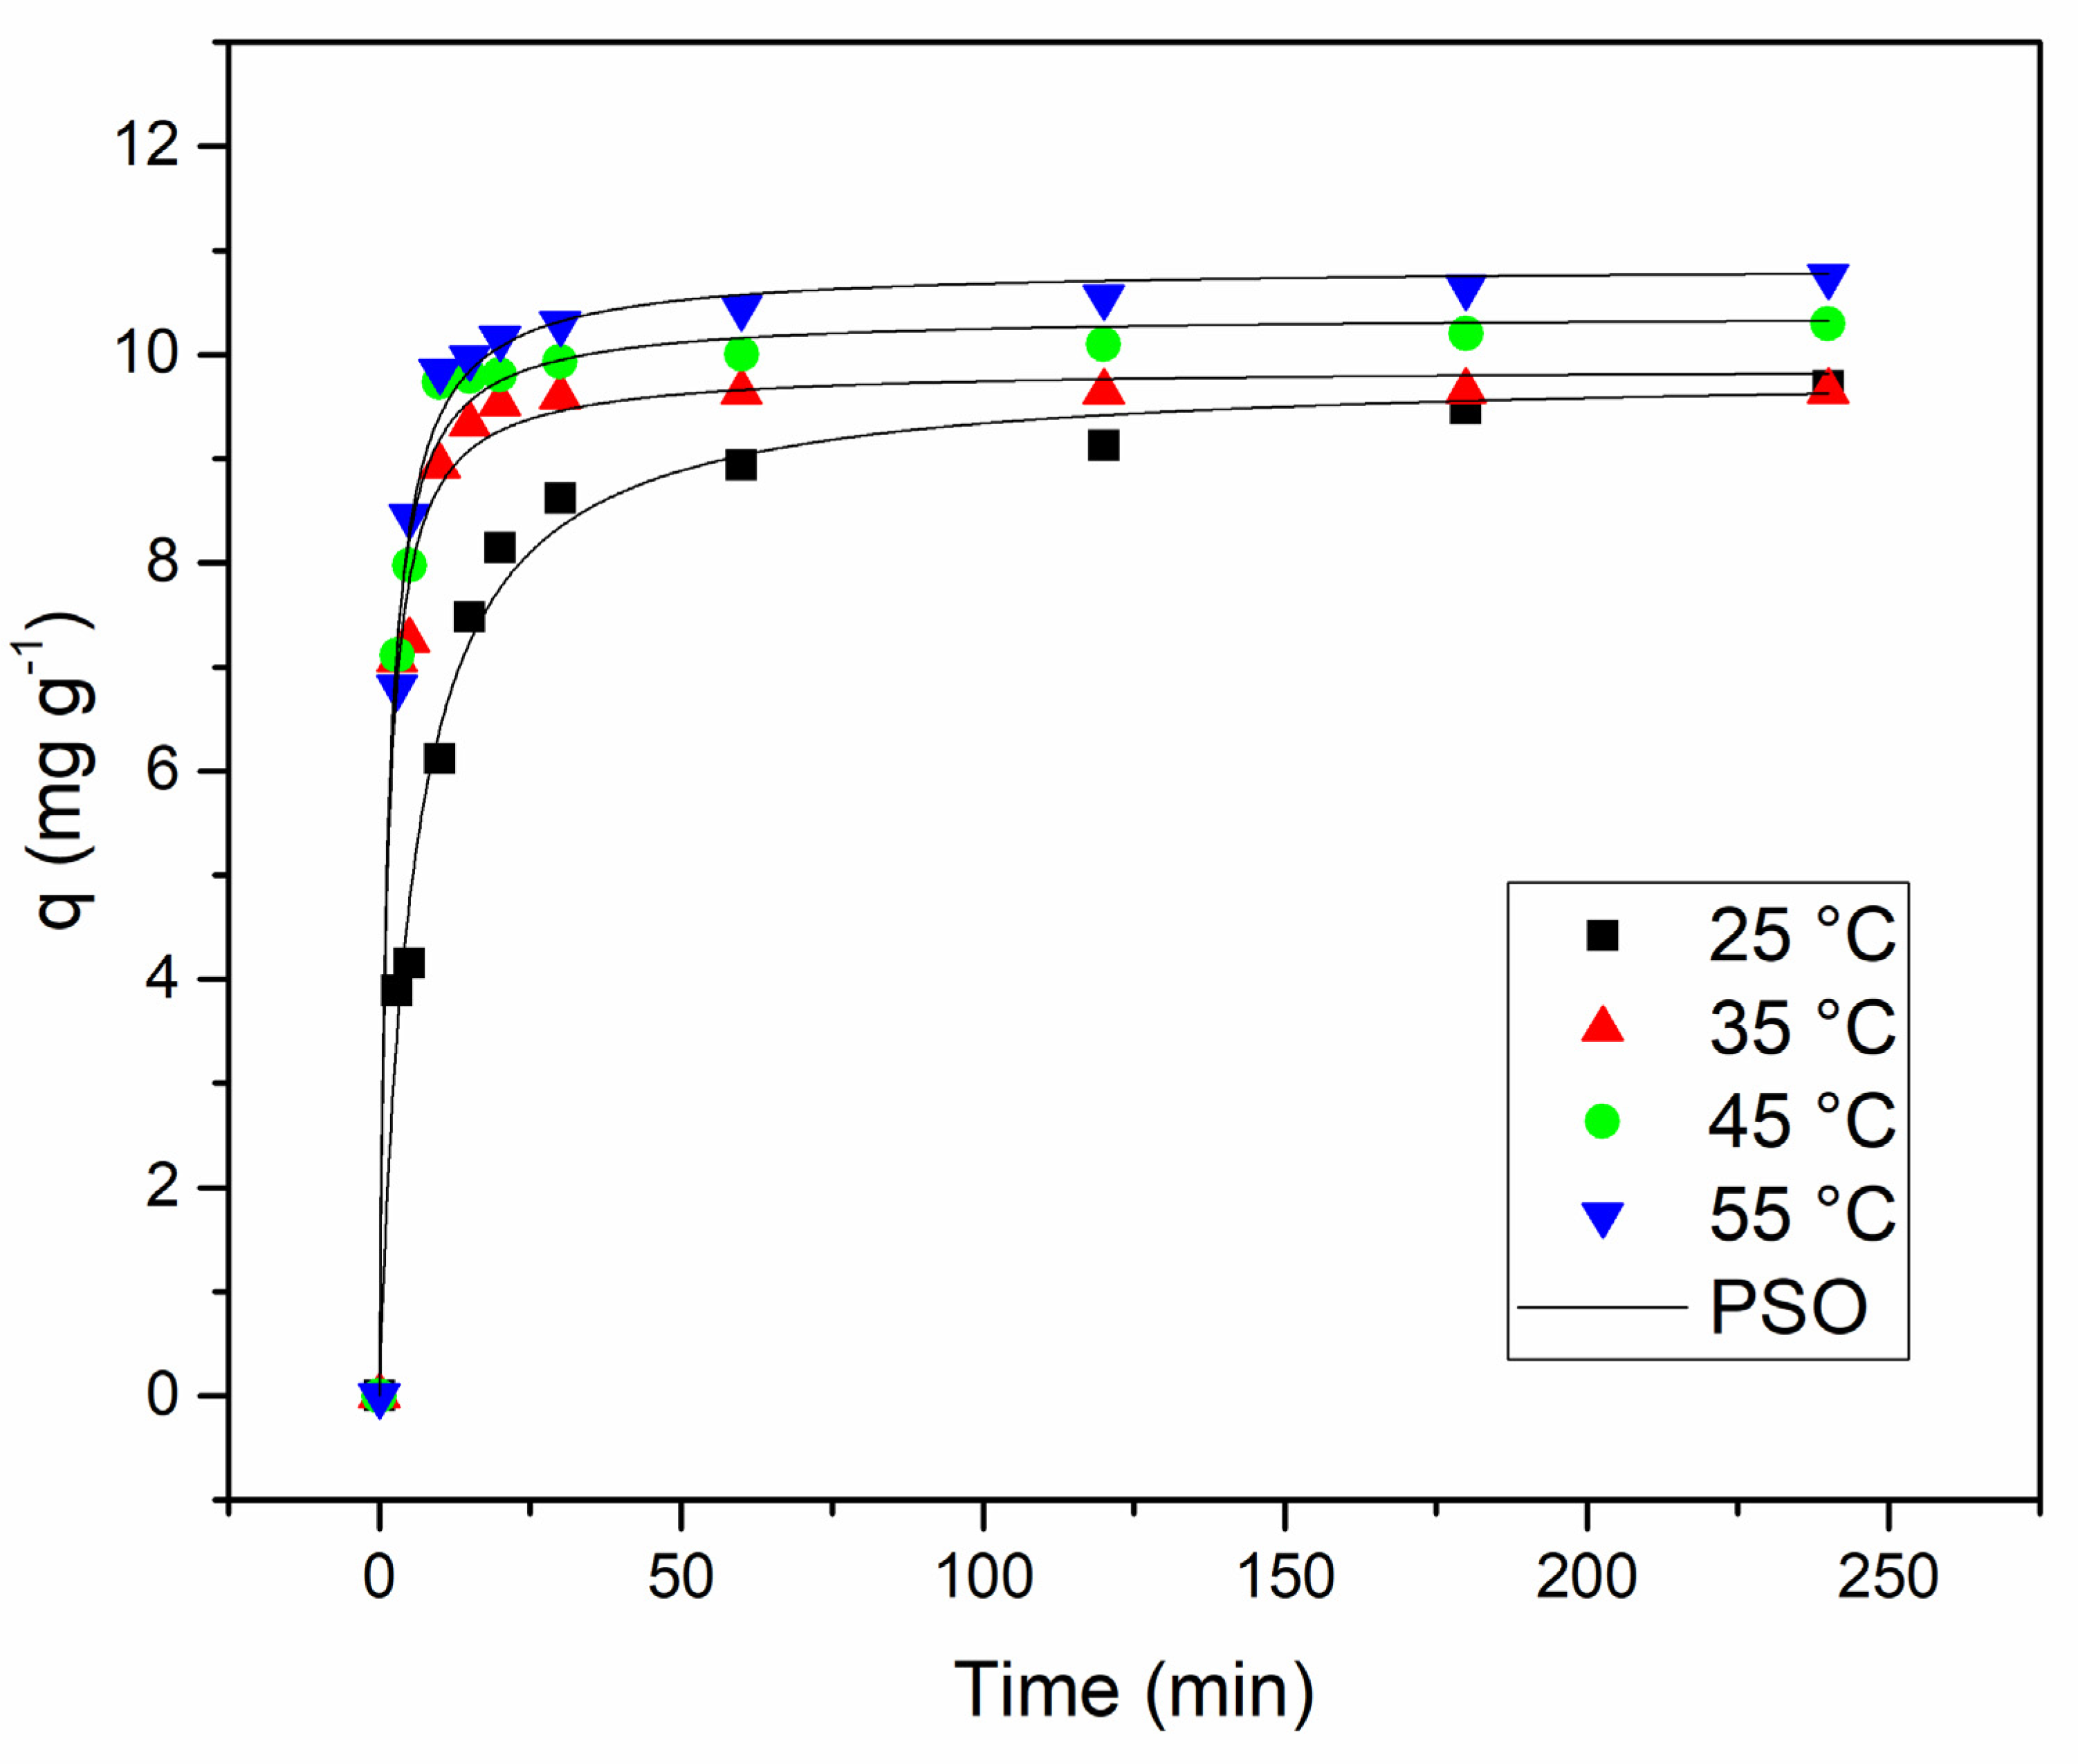
3.2.3. Adsorption Kinetics: Model Selection and Fitting

The adsorption kinetic data for gallium adsorption onto PAN/D2EHPA nanofibers were obtained by maintaining the initial gallium concentration at 20 mg L−1. The contact time monitored was from 0 to 240 min for each experiment, for a range of temperatures (25, 35, 45, and 55 °C) at pH 2.5.
Table 1 presents the kinetic parameters determined for the PFO, PSO, and Elovich models. The pseudo-second-order (PSO) model was found to provide the most accurate description for the experimental data. The criteria used for model selection considered the highest values of the adjusted coefficient of determination (R2adj) and coefficient of determination (R2), as well as the lowest values of the mean sum-of-squares error (MSE) and average relative error (ARE).
Figure 9 depicts the kinetic curves illustrating the Ga adsorption by the PAN/D2EHPA nanofibers. The adsorption process exhibited rapid initial adsorption rates within the first 30 min, followed by a gradual decrease in the adsorption rate due to the PAN/D2EHPA nanofiber sites being gradually saturated with increased contact time. Equilibrium was achieved at approximately 60 min for all the temperatures investigated. Equilibrium was reached due to the low number of active sites on nanofiber and a decrease in the concentration gradient. The parameters of the PSO model demonstrated that the adsorption rate (k2) and adsorption capacity (q2) increased with increasing temperature, indicating higher temperatures favored adsorption [66].

3.2.4. Adsorption Equilibrium: Model Selection and Fitting

The application of isotherm models to adsorption equilibria can provide useful information about the mechanisms involved and are widely used in assessing the performance of adsorbents. The adsorption isotherms for PAN/D2EHPA nanofibers are illustrated by Langmuir, Freundlich, and BET models. The experimental data were fitted for a range of temperatures (25, 35, 45, and 55 °C), for a range of gallium concentrations (20 to 150 mg L−1), for 240 min, and at pH 2.5.
Selection of the most suitable model (for each curve) involved a nonlinear regression fitting procedure. The results (Table 2) showed that BET model presented the highest values for the coefficient of determination (R2adj) and coefficient of determination (R2). Furthermore, the lowest values for the average relative error (ARE) and mean sum-of-squares error (MSE) were observed in the BET model. This model proposes some simplifying assumptions for the mechanism of Langmuir’s theory and admits the possibility that a layer has the ability to produce adsorption sites, generating the deposition of one layer over the other [49]. Consequently, the BET model was considered the most suitable for describing the equilibrium of the system.
Highlighted in Figure 10 are the equilibrium adsorption data and the fitted curves obtained using the Langmuir, Freundlich, and BET models for each temperature studied. The results obtained suggested that with the increase in initial concentration of the Ga in solution, the adsorption capacity (qm) of the nanofibers also increased gradually. Moreover, higher temperatures were found to enhance the adsorption capacity (qm). This can be related to the fact that increased temperature leads to activation of the adsorbent surface and/or an enlargement of the pore size. As such, the increased frequency of collisions between the adsorbent surface and the molecules facilitates their movement towards the surface and enhances their penetration into the adsorbent material [66]. This observation is consistent with the isotherm parameters, as the equilibrium constant (ks) value increased with increasing temperature, indicating a higher affinity between the adsorbent and adsorbate at higher temperatures. Specifically, the highest adsorbate–adsorbent affinity was observed at 55 °C for the temperatures studied.
In this study, the PAN/D2EHPA nanofibers demonstrated a superior maximum experimental adsorption capacity (q) of 33.13 mg g−1 for gallium compared to the other adsorbents under the specified experimental conditions studied (Table 3). This indicates that the PAN/D2EHPA nanofibers are highly effective in adsorbing gallium from aqueous solutions.

3.2.5. Thermodynamics Studies

The thermodynamics parameters of Ga adsorption on the PAN/D2EHPA nanofibers provide information explaining the adsorption behavior [70]. The equilibrium constant (Ke) was estimated [50] using the results obtained by the BET model, which presented the best fit. The slope of the plot for ln (Ke) versus 1/T and y-intercept (Van ’t Hoff equation) were used to calculate the thermodynamic parameters, and the results are presented in Table 4.
The obtained negative ∆G0 values reflected a spontaneous and favorable nature for the adsorption process. Furthermore, the increasingly negative ∆G0 values that correlated with increasing temperature indicated that the adsorption process was most favorable at 55 °C for the temperatures studied.
The positive value obtained for ∆H0 indicated that the adsorption was an endothermic process. Furthermore, it is possible to infer from the magnitude of ∆H0 the interactions that occur between the adsorbate and the adsorbent. Physisorption is frequently associated with the lower magnitude of ∆H0 (5–40 kJ.mol−1), whilst chemisorption can be associated with higher values related to chemical bond strength (40–800 kJ.mol−1) [71]. Therefore, the magnitude of ∆H0 (32.82 kJ.mol−1) determined for the gallium adsorption in this study can be described as physical adsorption between adsorbent and adsorbate. As mentioned previously, the unadulterated PAN polymer matrix presents a heterogeneous surface with high surface area and high porosity, which favors adsorption (Figure 6) [23]. Considering the results presented herein, physisorption should be considered the predominant mechanism of Ga3+ adsorption on the PAN/D2EHPA nanofibers.
The positive ∆S0 value suggests a moderate increase in random behavior at the solid–solution interface during the adsorption of the gallium [43,71].

3.2.6. Desorption and Regeneration of Adsorbent

The reuse of the PAN/D2EHPA nanofibers were studied over five sequential cycles of adsorption and desorption (Figure 11). The nanofibers maintained an adsorption efficiency above 78% during the five cycles (Figure 11A), whilst the desorption efficiency remained constant with values in the range 91–97% (Figure 11B). This suggested the PAN/D2EHPA nanofibers maintained good stability as an adsorbent material exhibiting consistent and reliable adsorption and desorption capacity for gallium over time. This stability is crucial for practical applications and underscores the potential of the PAN/D2EHPA nanofibers as an effective and durable adsorbent for gallium recovery.
The main limitation of this study was the structural sensitivity of the polymeric nano-fibers to higher concentrations of HCl above 2 M [38], which could lead to degradation and rupture of the polymer chains with progressive loss of mass [44]. Consequently, the optimal HCl concentration selected for desorption studies was 1.0 M, which allowed for effective desorption of gallium in a timely manner (5 min). However, it is worth noting that further optimization of the desorption conditions should be explored in future studies.
The PAN/D2EHPA nanofibers retained good stability during the cycles with no significant change in the metal adsorption capacity. These results provide strong evidence for the outstanding potential of PAN/D2EHPA nanofibers in adsorption applications, as they enable efficient metal recovery while retaining excellent stability over numerous reuse cycles. The consistent performance and stability of these nanofibers highlight their suitability for sustainable and reliable metal recovery processes.

4. Conclusions

D2EHPA-modified nanofibers were produced using force-spinning equipment for the efficient recovery of gallium from aqueous solutions. The FTIR analysis of the PAN/D2EHPA nanofibers demonstrated the combined characteristics present in the individual spectra of D2EHPA and the PAN nanofibers. This confirmed the close association of the two substances through intermolecular interactions, while maintaining the integrity of their chemical bonds. PAN nanofiber diameters ranged between 900 and 1100 nm. D2EHPA-modified nanofibers exhibited homogeneous and smooth nanofiber structures without any formation of agglomeration points or granules with fiber diameters between 530 to 950 nm. This diameter variation between pure nanofibers and modified nanofibers can be attributed to the decrease in viscosity of the polymeric solution due to the addition of D2EHPA. As a result, there were modifications in the structure of the nanofiber, leading to a reduction in diameter. At 500 °C, TGA showed that there is ~15% difference in final mass between PAN nanofibers and PAN/D2EHPA nanofibers. This is due to the presence of a remaining portion of D2EHPA in the modified fibers. The Hydra/Medusa software revealed that gallium precipitation can occur at pH above ~3.0, which can lead to a false increase in the adsorption capacity values. Furthermore, the study of the effects of pH on gallium adsorption revealed that pH 2.5 was ideal for maximum Ga adsorption efficiency. Increasing the concentration of D2EHPA in the nanofiber composition led to an increase in metal adsorption efficiency but resulted in lower yields of nanofibers with a decrease in fiber diameter and lower uniformity. The nanofibers prepared from PAN/D2EHPA ratios of 80/20 (% w/w) demonstrated the best performance in terms of nanofiber production yield (72%) and gallium metal adsorption capacity (33.13 mg g−1, at pH 2.5 and 45 °C). Pseudo-second-order (PSO) model adsorption kinetics provided the most accurate depiction of the kinetic data. The BET equilibrium isotherm model provided the best fit to the experimental data, which also lends support to the possibility for deposition of layers, one over another. Thermodynamic parameters confirmed that the adsorption was favorable, spontaneous, and endothermic. The nanofibers also demonstrated stability and reusability with no notable depletion of D2EHPA throughout five cycles of adsorption and desorption whilst also maintaining near-constant adsorption efficiency. As such, polyacrylonitrile nanofibers loaded with the commercial extractant, D2EHPA, have demonstrated excellent potential as stable adsorbents for the recovery of gallium with the added promise of a significantly lower environmental impact compared to conventional liquid–liquid extraction.

Author Contributions

B.N.S.: conceptualization, methodology, experimental, formal analysis, and writing; B.M.W.: methodology, simulation, and writing—review and editing; N.P.P.: writing—review and editing; S.K.: writing—review and editing; D.A.B.: conceptualization, writing—review and editing, and supervision; E.H.T.: conceptualization, funding acquisition, writing—review and editing, and supervision. All authors have read and agreed to the published version of the manuscript.

Funding

This research received no external funding.

Data Availability Statement

Not applicable.

Acknowledgments

The authors are grateful for the financial support provided by FAPERGS (Foundation for Research Support of the State of Rio Grande do Sul), SDECT (Department of Economic Development, Science and Technology of the State of Rio Grande do Sul), CAPES (Brazilian Agency for Improvement of Graduate Personnel), and CNPq (National Council of Scientific and Technological Development.

Conflicts of Interest

The authors declare no conflict of interest.

References

  1. Gladyshev, S.; Akcil, A.; Abdulvaliev, R.; Tastanov, Y.; Beisembekova, K.; Temirova, S. Kinetic study of gallium electrochemical reduction in alkaline solution. Hydrometallurgy 2013, 140, 95–101. [Google Scholar] [CrossRef]
  2. Gupta, B.; Mudhar, N.; Begum, Z.; Singh, I. Extraction and recovery of Ga (III) from waste material using Cyanex 923. Hydrometallurgy 2007, 87, 8–26. [Google Scholar] [CrossRef]
  3. Chen, W.-S.; Wang, Y.-C.; Chiu, K.-L. The separation and recovery of indium, gallium, and zinc from spent GZO(IGZO) targets. J. Environ. Chem. Eng. 2017, 5, 381–390. [Google Scholar] [CrossRef]
  4. Zhao, F.; Zou, Y.; Lv, X.; Liang, H.; Jia, Q.; Ning, W. Synthesis of CoFe2O4−Zeolite Materials and Application to the Adsorption of Gallium and Indium. J. Chem. Eng. Data 2015, 60, 1338–1344. [Google Scholar] [CrossRef]
  5. Zhang, Z.; Zhang, H.; Hu, Y.; Yang, X.; Yao, S. Novel surface molecularly imprinted material modified multi-walled carbon nanotubes as solid-phase extraction sorbent for selective extraction gallium ion from fly ash. Talanta 2010, 82, 304–311. [Google Scholar] [CrossRef] [PubMed]
  6. Yang, T.; Wang, L.; Liang, M.; Chen, Y.; Zou, H. Cross-linked polyvinyl amidoxime fiber: A highly selective and recyclable adsorbent of gallium from Bayer liquor. Iran. Polym. J. 2018, 27, 589–597. [Google Scholar] [CrossRef]
  7. Lu, F.; Xiao, T.; Lin, J.; Li, A.; Long, Q.; Huang, F.; Xiao, L.; Li, X.; Wang, J.; Xiao, Q.; et al. Recovery of gallium from Bayer red mud through acidic-leaching-ion exchange process under normal atmospheric pressure. Hydrometallurgy 2018, 175, 124–132. [Google Scholar] [CrossRef]
  8. Mahamuni, S.V.; Wadgaornkar, P.P.; Anuse, M.A. Liquid–liquid extraction and recovery of gallium (III) from acid media with 2-octylaminopyridine in chloroform: Analysis of bauxite ore. J. Serbian Chem. Soc. 2010, 75, 1099–1113. [Google Scholar] [CrossRef]
  9. Zeng, C.; Gonzalez-Alvarez, A.; Orenstein, E.; Field, J.A.; Shadman, F.; Sierra-Alvarez, R. Ecotoxicity assessment of ionic As (III), As (V), In (III) and Ga (III) species potentially released from novel III-V semiconductor materials. Ecotoxicol. Environ. Saf. 2017, 140, 30–36. [Google Scholar] [CrossRef]
  10. Wang, Y.; Zhu, L.; Song, Y.; Lou, Z.; Shan, W.; Xiong, Y. Novel chitosan-based ions imprinted bio-adsorbent for enhanced adsorption of gallium (III) in acidic solution. J. Mol. Liq. 2020, 320, 114413. [Google Scholar] [CrossRef]
  11. Sun, W.; Qi, M.; Cheng, S.; Li, C.; Dong, B.; Wang, L. Gallium and gallium compounds: New insights into the ‘‘Trojan horse” strategy in medical applications. Mat. Des. 2023, 227, 111704. [Google Scholar] [CrossRef]
  12. Syu, C.-H.; Chen, P.-W.; Huang, C.-C.; Lee, D.-Y. Accumulation of gallium (Ga) and indium (In) in rice grains in Ga- and In-contaminated paddy soils. Environ. Pollut. 2020, 261, 114189. [Google Scholar] [CrossRef] [PubMed]
  13. Chang, H.F.; Wang, S.L.; Yeh, K.C. Effect of Gallium Exposure in Arabidopsis thaliana is Similar to Aluminum Stress. Environ. Sci. Technol. 2017, 51, 1241–1248. [Google Scholar] [CrossRef] [PubMed]
  14. Syu, C.-H.; Chien, P.-C.; Huang, C.-C.; Jiang, P.-Y.; Juang, K.-W.; Lee, D.-Y. The growth and uptake of Ga and In of rice (Oryza sative L.) seedlings as affected by Ga and In concentrations in hydroponic cultures. Ecotoxicol. Environ. Saf. 2017, 135, 32–39. [Google Scholar] [CrossRef]
  15. Batley, G.E.; Campbell, P.G.C. Metal contaminants of emerging concern in aquatic systems. Environ. Chem. 2022, 19, 23–40. [Google Scholar] [CrossRef]
  16. Yang, J.-L. Comparative acute toxicity of gallium(III), antimony(III), indium(III), cadmium(II), and copper(II) on freshwater swamp shrimp (Macrobrachium nipponense). Biol. Res. 2014, 13, 47. [Google Scholar] [CrossRef]
  17. Bu-Olayan, A.H.; Thomas, B.V. Bourgeoning impact of the technology critical elements in the marine environment. Environ. Pollut. 2020, 265, 115064. [Google Scholar] [CrossRef]
  18. Ahmed, I.M.; El-nadi, Y.A.; El-hefny, N.E. Extraction of gallium (III) from hydrochloric acid by Cyanex 923 and Cyanex 925. Hydrometallurgy 2013, 131–132, 24–28. [Google Scholar] [CrossRef]
  19. Liu, J.S.; Chen, H.; Chen, X.Y.; Guo, Z.L.; Hu, Y.C.; Liu, C.P.; Sun, Y.Z. Extraction and separation of In (III), Ga (III) and Zn (II) from sulfate solution using extraction resin. Hydrometallurgy 2006, 82, 137–143. [Google Scholar] [CrossRef]
  20. Lee, C.H.; Lin, H.Y.; Cadogan, E.I.; Popuri, S.R.; Chang, C.Y. Biosorption Performance of Biodegradable Polymer Powders for the Removal of Gallium (III) ions from Aqueous Solution. Pol. J. Chem. Technol. 2015, 17, 124–132. [Google Scholar] [CrossRef]
  21. Fiyadh, S.S.; AlSaadi, M.A.; Jaafar, W.Z.; Alomar, M.K.; Fayaed, S.S.; Mohd, N.S.; Hin, L.S.; El-Shafie, A. Review on heavy metal adsorption processes by carbon nanotubes. J. Clean. Prod. 2019, 230, 783–793. [Google Scholar] [CrossRef]
  22. Meili, L.; Lins, P.V.S.; Costa, M.T.; Almeida, R.L.; Abud, A.K.S.; Soletti, J.I.; Dotto, G.L.; Tanabe, E.H.; Sellaoui, L.; Carvalho, S.H.V.; et al. Adsorption of methylene blue on agroindustrial wastes: Experimental investigation and phenomenological modelling. Prog. Biophys. Mol. Biol. 2018, 141, 60–71. [Google Scholar] [CrossRef] [PubMed]
  23. Liu, F.; Wang, X.; Chen, B.-Y.; Zhou, S.; Chang, C.-T. Removal of Cr (VI) using polyacrylonitrile chloride composite nanofibers. J. Taiwan Inst. Chem. Eng. 2017, 70, 401–410. [Google Scholar] [CrossRef]
  24. Dastbaz, A.; Keshtkar, A.R. Adsorption of Th4+, U6+, Cd2+ and Ni2+ from aqueous solution by anovel modified polyacrylonitrile composite nanofiber adsorbent prepared by electrospinning. Appl. Surf. Sci. 2010, 293, 336–344. [Google Scholar] [CrossRef]
  25. Haddad, M.; Alharbi, H. Enhancement of heavy metal ion adsorption using electrospun polyacrylonitrile nanofibers loaded with ZnO nanoparticles. J. Appl. Polym. Sci. 2018, 136, 1–11. [Google Scholar] [CrossRef]
  26. Kummer, G.; Schonhart, C.; Fernandes, M.G.; Dotto, G.L.; Missio, A.L.; Bertuol, D.A.; Tanabe, E.H. Development of Nanofibers Composed of Chitosan/Nylon 6 and Tannin/Nylon 6 for Effective Adsorption of Cr (VI). J. Polym. Environ. 2018, 26, 4073–4084. [Google Scholar] [CrossRef]
  27. Martins, T.R.; Costa, P.S.; Bertuol, D.A.; Aguiar, M.L.; Tanabe, E.H. Development of Recycled Expanded Polystyrene Nanofibers Modified by Chitosan for the Removal of Lead (II) from Water. Metals 2022, 12, 1334. [Google Scholar] [CrossRef]
  28. Alnaqbi, M.A.; Greish, Y.E.; Mohsin, M.; Elumalai, E.J.; Blooshi, A. Morphological variations of micro-nanofibrous sorbents prepared by electrospinning and their effects on the sorption of crude oil. J. Environ. Chem. Eng. 2016, 4, 1850–1861. [Google Scholar] [CrossRef]
  29. Riahi, D.N. Modeling and computation of nonlinear rotating polymeric jets during forcespinning process. Int. J. Non-Linear Mech. 2017, 92, 1–7. [Google Scholar] [CrossRef]
  30. Zander, N.E. Formation of melt and solution spun polycaprolactone fibers by centrifugal spinning. J. Appl. Polym. Sci. 2015, 132, 1–9. [Google Scholar] [CrossRef]
  31. Zhang, X.; Lu, Y. Centrifugal Spinning: An Alternative Approach to Fabricate Nanofibers at High Speed and Low Cost. Polym. Rev. 2014, 54, 677–701. [Google Scholar] [CrossRef]
  32. Alabduljabbar, F.A.; Haider, S.; Alghyamah, A.A.; Haider, A.; Khan, R.; Almasry, W.A.; Patel, R.; Mujtaba, I.M.; Ali, F.A.A. Ethanol amine functionalized electrospun nanofibers membrane for the treatment of dyes polluted wastewater. Appl. Nanosci. 2022, 12, 3153–3166. [Google Scholar] [CrossRef]
  33. Padron, S.; Fuentes, A.; Caruntu, D.; Lozano, K. Experimental study of nanofiber production through force spinning. J. Appl. Phys. 2013, 113, 024318. [Google Scholar] [CrossRef]
  34. Salussoglia, A.I.P.; Tanabe, E.H.; Aguiar, M.L. Evaluation of a vacuum collection system in the preparation of PAN fibers by forcespinning for application in ultrafine particle filtration. J. Appl. Polym. Sci. 2020, 137, 49334. [Google Scholar] [CrossRef]
  35. Nakamura, T.; Sakai, A.; Nishihama, S.; Yoshizuka, K. Solvent Extraction of Indium, Gallium, and Zinc Ions with Acidic Organophosphates having Bulky Alkyl Groups. Solvent Extr. Ion Exch. 2009, 27, 501–512. [Google Scholar] [CrossRef]
  36. Yadav, K.K.; Singh, D.K.; Anitha, M.; Varshney, L.; Singh, S. Studies on separation of rare earths from aqueous media by polyethersulfone beads containing D2EHPA as extractant. Sep. Purif. Technol. 2013, 118, 350–358. [Google Scholar] [CrossRef]
  37. Cadore, J.S.; Bertuol, D.A.; Tanabe, E.H. Recovery of indium from LCD screens using solid-phase extraction onto nanofibers modified with Di-(2-ethylhexyl) phosphoric acid (DEHPA). Process Saf. Environ. Prot. 2019, 127, 141–150. [Google Scholar] [CrossRef]
  38. Silva, F.N.; Bassaco, M.M.; Bertuol, D.A.; Tanabe, E.H. An eco-friendly approach for metals extraction using polymeric nanofibers modified with di-(2 ethylhexyl) phosphoric acid (DEHPA). J. Clean. Prod. 2019, 210, 786–794. [Google Scholar] [CrossRef]
  39. Nataraj, S.K.; Yang, K.S.; Aminabhavi, T.M. Polyacrylonitrile-based nanofibers—A state-of-the-art review. Prog. Polym. Sci. 2012, 37, 487–513. [Google Scholar] [CrossRef]
  40. Lu, Y.; Li, Y.; Zhang, S.; Xu, G.; Fu, K.; Lee, H.; Zhang, X. Parameter study and characterization for polyacrylonitrile nanofibers fabricated via centrifugal spinning process. Eur. Polym. J. 2013, 49, 3834–3845. [Google Scholar] [CrossRef]
  41. Agubra, V.A.; De la Garza, D.; Gallegos, L.; Alcoutlabi, M. ForceSpinning of polyacrylonitrile for mass production of lithium-ion battery separators. J. Appl. Polym. Sci. 2016, 133, 1–8. [Google Scholar] [CrossRef]
  42. Segala, B.N.; Bertuol, D.A.; Tanabe, E.H. Production of polyacrylonitrile nanofibres modified with Cyanex 272 for recovery of gallium from solution. Environ. Technol. 2022, 43, 737–750. [Google Scholar] [CrossRef] [PubMed]
  43. Tran, H.N.; You, S.J.; Hosseini-Bandegharaei, A.; Chao, H.P. Mistakes and inconsistencies regarding adsorption of contaminants from aqueous solutions: A critical review. Water Res. 2017, 120, 88–116. [Google Scholar] [CrossRef] [PubMed]
  44. Zhao, Z.; Li, X.; Chai, Y.; Hua, Z.; Xiao, Y.; Yang, Y. Adsorption Performances and Mechanisms of Amidoxime Resin toward Gallium (III) and Vanadium (V) from Bayer Liquor. ACS Sustain. Chem. Eng. 2016, 4, 53–59. [Google Scholar] [CrossRef]
  45. Tan, K.L.; Hameed, B.H. Insight into the adsorption kinetics models for the removal of contaminants from aqueous solutions. J. Taiwan Inst. Chem. Eng. 2017, 74, 25–48. [Google Scholar] [CrossRef]
  46. Chien, S.H.; Clayton, W.R. Application of Elovich Equation to the Kinetics of Phosphate Release and Sorption in Soils. Soil Sci. Soc. Am. J. 1980, 44, 265. [Google Scholar] [CrossRef]
  47. Langmuir, I. The adsorption of gases on plane surfaces of glass, mica and platinum. J. Am. Chem. Soc. 1918, 40, 1361–1403. [Google Scholar] [CrossRef]
  48. Freundlich, H.M.F. Over the adsorption in solution. J. Phys. Chem. 1906, 57, 385–470. [Google Scholar]
  49. Brunauer, S.; Emmett, P.H.; Teller, E. Adsorption of Gases in Multimolecular Layers. J. Am. Chem. Soc. 1938, 60, 309–319. [Google Scholar] [CrossRef]
  50. Lima, E.C.; Hosseini-Bandegharaei, A.; Moreno-Piraján, J.C.; Anastopoulos, I. A critical review of the estimation of the thermodynamic parameters on adsorption equilibria. Wrong use of equilibrium constant in the Van’t Hoof equation for calculation of thermodynamic parameters of adsorption. J. Mol. Liq. 2019, 273, 425–434. [Google Scholar] [CrossRef]
  51. Zhang, Y.; Long, Z.; Yue, W.; Zhenning, L.; Weijun, S.; Ying, X.; Yu, F. Preparation of a biomass adsorbent for gallium (III) based on corn stalk modified by iminodiacetic acid. J. Taiwan Inst. Chem. Eng. 2018, 91, 291–298. [Google Scholar] [CrossRef]
  52. Qin, J.; Liu, G.; Fan, H.; Tan, W. The hydrophobic mechanism of di(2-ethylhexyl) phosphoric acid to hemimorphite flotation. Colloids Surf. A. 2018, 545, 68–77. [Google Scholar] [CrossRef]
  53. Elias, A.; Didi, M.A.; Villemin, D.; Semaoune, T.; Ouattas, S. Synthesis of mono-and dialkylphosphates by the reactions of hydroxycompounds with the phosphorus pentaoxide under microwave irradiation. Phosphorus Sulfur Silicon Relat. Elem. 2010, 179, 2599–2607. [Google Scholar] [CrossRef]
  54. Martín, D.M.; Faccini, M.; García, M.A.; Amantia, D. Highly efficient removal of heavy metal ions from polluted water using ion-selective polyacrylonitrile nanofibers. J. Environ. Chem. Eng. 2018, 6, 236–245. [Google Scholar] [CrossRef]
  55. Karbownik, I.; Rac-Rumijowska, O.; Fiedot-Toboła, M.; Rybicki, T.; Teterycz, H. The Preparation and Characterization of Polyacrylonitrile-Polyaniline (PAN/PANI) Fibers. Materials 2019, 12, 664. [Google Scholar] [CrossRef]
  56. Zhang, L.; Zhang, X.; Li, P.; Zhang, W. Effective Cd2+ chelating fiber based on polyacrylonitrile. React. Funct. Polym. 2009, 69, 48–54. [Google Scholar] [CrossRef]
  57. Zheng, P.; Zhang, W.; Li, C.; Wang, N.; Li, J.; Qin, Z.; An, Q. Efficient bio ethanol recovery by non-contact vapor permeation process using membranes with tailored pore size and hydrophobicity. Chem. Eng. Sci. 2019, 207, 448–455. [Google Scholar] [CrossRef]
  58. Dutta, M.; Bhattacharjee, S.; De, S. Separation of reactive dyes from textile effluent by hydrolyzed polyacrylonitrile hollow fiber ultrafiltration quantifying the transport of multicomponent species through charged membrane pores. Sep. Purif. Technol. 2020, 234, 116063. [Google Scholar] [CrossRef]
  59. An, Q.; Sun, W.; Zhao, Q.; Ji, Y.; Gao, C. Study on a novel nanofiltration membrane prepared by interfacial polymerization with zwitterionic amine monomers. J. Mem. Sci. 2013, 431, 171–179. [Google Scholar] [CrossRef]
  60. Kebiche-Senhadji, O.; Bey, S.; Clarizia, G.; Mansouri, L.; Benamor, M. Gas permeation behavior of CTA polymer inclusion membrane (PIM) containing an acidic carrier for metal recovery (DEHPA). Sep. Purif. Technol. 2011, 80, 38–44. [Google Scholar] [CrossRef]
  61. Satpathy, S.; Mishra, S. Extractive separation studies of Ga (III) and Ni (II) in the presence of lactic acid using DEHPA in petrofin. Sep. Purif. Technol. 2017, 179, 513–522. [Google Scholar] [CrossRef]
  62. Singh, K.K.; Pathak, S.K.; Kumar, M.; Mahtele, A.K.; Tripathi, S.C.; Bajaj, P.N. Study of uranium sorption using D2EHPA-impregnated polymeric beads. J. Appl. Polym. Sci. 2013, 130, 3355–3364. [Google Scholar] [CrossRef]
  63. Zhang, W.; Ye, G.; Chen, J. Preparation of Cyanex 272-containing silica composite by sol–gel method for neodymium adsorption. J. Radioanal. Nucl. Chem. 2013, 295, 1667–1672. [Google Scholar] [CrossRef]
  64. Natarajan, T.S.; Bhargava, P. Influence of spinning parameters on synthesis of alumina fibers by centrifugal spinning. Ceram. Int. 2018, 44, 11644–11649. [Google Scholar] [CrossRef]
  65. Zhang, H.; Li, S.; White, C.J.B.; Ning, X.; Nie, H.; Zhu, L. Studies on electrospun nylon-6/chitosan complex nanofiber interactions. Electrochim. Acta 2009, 54, 5739–5745. [Google Scholar] [CrossRef]
  66. Li, W.; Tang, Y.; Zeng, Y.; Tong, Z.; Liang, D.; Cui, W. Adsorption behavior of Cr (VI) ions on tannin-immobilized activated clay. Chem. Eng. J. 2012, 193–194, 88–95. [Google Scholar] [CrossRef]
  67. Chegrouche, S.; Bensmaili, A. Removal of Ga (III) from aqueous solution by adsorption on activated bentonite using a factorial design. Water Res. 2002, 36, 2898–2904. [Google Scholar] [CrossRef]
  68. Chou, W.L.; Wang, C.T.; Huang, Y.H. Removal of gallium ions from aqueous solutions using tea waste by adsorption. Fresenius Environ. Bull. 2010, 19, 2848–2856. [Google Scholar]
  69. Zhang, L.; Zhu, Y.; Li, H.; Liu, N.; Liu, X.; Guo, X. Kinetic and thermodynamic studies of adsorption of gallium (III) on nano-TiO2. Rare Met. 2010, 29, 16–20. [Google Scholar] [CrossRef]
  70. Tran, H.N.; Lima, E.C.; Juang, R.-S.; Bollinger, J.-C.; Chao, H.-P. Thermodynamic parameters of liquid-phase adsorption process calculated from different equilibrium constants related to adsorption isotherms: A comparison study. J. Environ. Chem. Eng. 2021, 9, 106674. [Google Scholar] [CrossRef]
  71. Inglezakis, V.J.; Poulopoulos, S.G. Adsorption, Ion Exchange and Catalysis: Design of Operations and Environmental Applications, 6th ed.; Elsevier: Amsterdam, The Netherlands, 2006; p. 602. [Google Scholar]
Figure 1. Schematic illustration of the Forcespinning® equipment.
Metals 13 01545 g001
Figure 2. FT-IR spectra of (A) D2EHPA, (B) PAN, (C) PAN nanofibers, and (D) PAN/D2EHPA nanofibers.
Metals 13 01545 g002
Figure 3. FT-IR spectra of the PAN/D2EHPA nanofibers, before and after Ga adsorption.
Metals 13 01545 g003
Figure 4. TGA curves for the PAN and PAN/D2EHPA nanofibers.
Metals 13 01545 g004
Figure 5. SEM images of (A) PAN nanofibers and (B) PAN/D2EHPA nanofibers. EDS elemental survey of PAN/D2EHPA nanofibers post-extraction for (C) carbon, (D) nitrogen, (E) phosphorus, (F) oxygen, and (G) gallium.
Metals 13 01545 g005
Figure 6. Effect of polymer/extractant ratio on metal adsorption capacity (mg g−1), metal removal efficiency (R%), and nanofiber production (%). Conditions: concentration of gallium = 20 mg L−1; pH = 2.5; S:L ratio = 1:500 (g mL−1); contact time = 240 min; temperature = 25 °C; polymer/extractant ratio = 70/30, 80/20, 90/10, and 100/0 (% w/w).
Metals 13 01545 g006
Figure 7. Chemical speciation diagram for Ga, generated using Hydra/Medusa software.
Metals 13 01545 g007
Figure 8. Influence of pH on Ga adsorption efficiency. Conditions: concentration of Ga= 20 mg L−1; polymer/extractant ratio = 80/20 (% w/w); S:L ratio = 1:500 (g mL−1); temperature = 25 °C; contact time = 240 min; pH = 0.5, 1.0, 1.5, 2.0, 2.5, and 3.0.
Metals 13 01545 g008
Figure 9. PSO kinetic model for Ga adsorption by the PAN/D2EHPA nanofibers. Conditions: concentration of Ga = 20 mg L−1; polymer/extractant ratio = 80/20 (% w/w); S:L ratio = 1:500 (g mL−1); pH = 2.5; temperature = 25, 35, 45 and 55 °C; contact time = 0, 3, 5, 10, 15, 20, 30, 60, 120, 180, and 240 min.
Metals 13 01545 g009
Figure 10. Adsorption Isotherms of Ga by the PAN/D2EHPA nanofibers at different temperatures: (A) 25 °C, (B) 35 °C, (C) 45 °C, and (D) 55 °C. Conditions: pH = 2.5; polymer/extractant ratio = 80/20 (% w/w); S:L ratio = 1:500 (g mL−1); contact time = 240 min; concentration of Ga in solution = 20, 40, 60, 80, 100, 120, and 150 mg L−1.
Metals 13 01545 g010
Figure 11. Desorption and regeneration of PAN/D2EHPA nanofibers: (A) adsorption and (B) desorption efficiencies during five cycles of reuse. Adsorption conditions: concentration of Ga = 20 mg L−1; polymer/extractant ratio = 80/20 (% w/w); pH = 2.5; S:L ratio = 1:500 (g mL−1); contact time = 60 min; temperature = 55 °C. Desorption conditions: polymer/extractant ratio = 80/20 (% w/w); S:L ratio = 1:250 (g mL−1); temperature = 25 °C; contact time = 5 min.
Metals 13 01545 g011
Table 1. Kinetic model fitting data of gallium adsorption by the PAN/D2EHPA nanofibers.
ModelTemperature (°C)
25354555
PFO
q1 (mg g−1)9.1583 ± 0.20659.5110 ± 0.137410.0030 ± 0.092510.3919 ± 0.08546
k1 (min−1)0.1222 ± 0.01120.3699 ± 0.03400.3713 ± 0.02190.3415 ± 0.0171
R20.97960.98470.99370.9952
R a d j 2 0.97730.98300.99300.9947
ARE (%)5.493.242.181.96
MSE0.190.130.060.05
PSO
q2 (mg g−1)9.8419 ± 0.17999.8698 ± 0.117310.3803 ± 0.107710.8444 ± 0.09912
k2 (g mg−1 min−1)0.0189 ± 0.00200.0779 ± 0.00950.0813 ± 0.01090.0604 ± 0.0052
R20.98990.99260.99440.9958
R a d j 2 0.98870.99180.99380.9953
ARE (%)4.512.421.851.77
MSE0.090.060.050.04
Elovich
a (mg g−1 min−1)0.7536 ± 0.10271.8346 ± 0.44321.7258 ± 0.40891.4505 ± 0.3184
b (g mg−1)13.5961 ± 9.16382.95 × 105 ± 1.10802.61 × 105 ± 9.54 × 1053.50 × 104 ± 1.02 × 10⁵
R20.94140.96240.96300.9590
R a d j 2 0.93480.95820.95890.9544
ARE (%)10.086.025.735.95
MSE0.550.310.040.05
Table 2. Isotherm parameters for the adsorption of Ga by the PAN/D2EHPA nanofibers.
ModelTemperature (°C)
25354555
Langmuir
qm (mg g−1)26.0781 ± 2.004428.2560 ± 1.717029.8030 ± 1.366230.0122 ± 1.4174
kL (L mg−1)0.4702 ± 0.27010.5307 ± 0.20392.0421 ± 0.65712.6579 ± 0.9394
R20.77420.85110.89020.8814
R a d j 2 0.72910.82130.86820.8577
ARE (%)14.669.239.957.88
MSE9.017.076.006.72
Freundlich
kF (mg g−1) (mg L−1)−1/nF10.9141 ± 1.277812.2427 ± 1.592916.8224 ± 1.897617.1351 ± 1.6963
1/nF0.21560.20830.15190.1501
R20.93710.91090.87610.9051
R a d j 2 0.92450.89310.85130.8861
ARE (%)6.7310.4712.3610.02
MSE2.514.236.775.38
BET
qm (mg g−1)19.2934 ± 1.012422.4484 ± 1.643626.0702 ± 1.690625.7405 ± 1.1103
kS (L mg−1)1.4101 ± 0.45190.9657 ± 0.33242.7847 ± 0.84873.8718 ± 0.8709
kR (L mg−1)0.0042 ± 5.44864 × 10−40.0036 ± 8.47457 × 10−40.0026 ± 9.3356 × 10−40.0029 ± 5.75802 × 10⁻⁴
R20.97270.95910.95460.97761
R a d j 2 0.95900.93870.93190.96642
ARE (%)3.746.307.135.10
MSE1.091.942.481.27
qexperimental30.1931.9632.9233.13
Table 3. Comparison of adsorption capacities of various adsorbents for removal of Ga.
AdsorbentpHT (°C)Ce (mg L−1)q (mg g−1)Reference
P507 extraction resin3.04093.330.4[19]
Amidoxime resin (LSC700)2.04529029.24[44]
Bentonite2.520203.7710.67[67]
Discarded tea3.0258010.9[68]
Nano-TiO23.04010.08.00[69]
Polyacrylonitrile nanofibers with D2EHPA2.54585.033.13This work
Table 4. Thermodynamic parameters for Ga adsorption using PAN/D2EHPA nanofibers.
Temperature (K)G0 (kJ mol−1)H0 (kJ mol−1)S0 (kJ mol−1 K−1)
298−29.4632.820.21
308−31.55
318−34.69
328−35.73
Disclaimer/Publisher’s Note: The statements, opinions and data contained in all publications are solely those of the individual author(s) and contributor(s) and not of MDPI and/or the editor(s). MDPI and/or the editor(s) disclaim responsibility for any injury to people or property resulting from any ideas, methods, instructions or products referred to in the content.

