Article

Novel Powder Feedstock towards Microstructure Engineering in Laser Powder Bed Fusion: A Case Study on Duplex/Super Duplex and Austenitic Stainless-Steel Alloys

by
Leonidas Gargalis
1,
Leonidas Karavias
1,
Joachim S. Graff
2,
Spyros Diplas
2,
Elias P. Koumoulos
3 and
Evangelia K. Karaxi
1,*
1
Conify, Lavrion Technological and Cultural Park (LTCP), Lavrion Ave. 1, 19500 Lavrion, Greece
2
SINTEF Industry, Forskningsveien 1, 0373 Oslo, Norway
3
IRES—Innovation in Research & Engineering Solutions, Rue Koningin Astritlaan 59B, 1780 Wemmel, Belgium
*
Author to whom correspondence should be addressed.
Metals 2023, 13(9), 1546; https://doi.org/10.3390/met13091546
Submission received: 27 July 2023 / Revised: 22 August 2023 / Accepted: 25 August 2023 / Published: 1 September 2023

Abstract

:
Additive manufacturing of Duplex Stainless Steels (DSS) and Super Duplex Stainless Steels (SDSS) has been successfully demonstrated using LPBF in recent years, however, both alloys feature an almost fully ferritic microstructure in the as-built condition due to the fast cooling rates associated with the Laser Powder Bed Fusion (LPBF) process. Blends of DSS and SDSS powders were formulated with austenitic stainless-steel 316L powder, aiming to achieve increased austenite formation during in the LPBF as-built condition to potentially minimize the post heat treatments (solution annealing and quenching). Powder characteristics were investigated and process parameters were optimized to produce near fully dense parts. Nanoindentation (NI) tests were conducted to measure, not only the local mechanical properties and correlate them with the as-built microstructure, but also to gain a deeper understanding in the deformation behavior of individual phases that cannot be studied directly by macroscopic tensile tests. Scanning Electron Microscopy (SEM) and Electron Backscatter Diffraction (EBSD) were employed for microstructural analysis and phase quantification. The microstructural analysis and EBSD phase maps revealed an increase in austenite in the as-built microstructures. Blend 1 resulted in a duplex microstructure consisting of 10% austenite at the XY plane and 20% austenite at the XZ plane. The austenite content increased with increasing proportion of 316L stainless steel in the powder blends. The DSS blend required a much higher volumetric energy density for the fabrication of near fully dense parts. This imposed a slower solidification and a higher melt pool homogeneity, allowing for adequate diffusion of the austenite stabilizing elements. The presented workflow and findings from this study provide valuable insights into powder mixing for the development of custom alloys for rapid material screening in LPBF.

1. Introduction

In contrast to traditional manufacturing techniques, Additive Manufacturing (AM) relies on the sequential addition and consolidation of powdered feedstock in small increments. This layer-by-layer approach is employed to fabricate intricate shapes and achieve high density in the final parts [1,2]. Laser Powder Bed Fusion (LPBF), also known as Selective Laser Melting (SLM), is an Additive Manufacturing (AM) technique that involves melting a thin layer of powder using a high-power laser beam. This process takes place under an inert gas atmosphere, while the laser beam scans across the powder bed according to a predetermined scanning pattern [3].
Moreover, the LPBF process is distinguished by the swift melting and subsequent solidification of small material volumes, leading to significant thermal gradients. High localized heating and cooling rates control the resulting microstructure, grain size and orientation and may cause compositional segregation or the formation of non-equilibrium trapped phases. Cooling rates as high as 106 K/s, owing to small melt pool size and high laser scanning speeds, result in fine and anisotropic microstructures, typically dominated by cellular or dendritic solidification structures [4,5,6,7,8].
Under these high cooling rates, DSS and SDSS fabricated using LPBF predominantly exhibit a ferritic structure (>95%) [9,10]; it is well known that ferritic stainless steels exhibit a significantly lower elongation at fracture. This limits the utilization of their full property potential, which is derived from the two-phase microstructure consisting of a balanced fraction of ferrite and austenite. Nitrogen (N) supersaturation in the ferrite matrix causes precipitation of chromium nitride [11], which contributes to increased strength but decreased ductility in LPBF DSS compared to conventionally manufactured DSS. Ferrite is the dominant phase in SDSS in the as-built condition and to restore the balance between austenite and ferrite, and therefore regain desired ductility, high-temperature annealing at approximately 1100 °C followed by water quenching are common post-processing steps. The austenitic phase contributes to toughness and resistance against corrosion whilst ferrite improves strength but decreases crack susceptibility and toughness. Hence, the above unique properties offered by the balanced phase fraction, together with good weldability and higher strength than any comparable austenitic or ferritic stainless steels, make DSS and SDSS suitable for applications in the chemical and petrochemical industry, pulp and paper industry, power generation, marine constructions and offshore structural industries [12]. Due to their lower thermal expansion coefficient and relatively higher thermal conductivity in comparison to austenitic stainless steels, DSSs are well suited for additive manufacturing in applications requiring complex and thin-walled geometries, such as heat exchangers [13]. The volume fraction, morphology and chemistry of the two phases can be adjusted primarily by controlling the chemical composition and the path of the ferrite-to-austenite phase transformation [14,15]. Interestingly, although heat-treated duplex steels show a high elongation at fracture, the thermal effect decreases the dislocation density and thus lowers strength [16].
Conventional wrought or cast alloys are not always suitable for metal AM processes due to the trade-offs between fundamental material properties and manufacturability under rapid cooling rates. As a result, the pursuit of new alloys for AM presents an opportunity to tap into the growing AM market, enabling part manufacturers to tailor the composition of the feedstock material for developing an optimal alloy for their specific applications. A key advantage of studying alloy development through powder blending and screening lies in the mitigation of potential uncertainties and costs associated with their production. These uncertainties, primarily linked to the atomization process, encompass factors such as the feasibility of atomizing a novel alloy, process yield, compatibility of powder morphology with LPBF process specifications and compositional consistency of the powder batch. These uncertainties often impose significant lead times and expenses on innovative projects, impeding their market viability. By adopting such an accelerated alloy screening methodology, it becomes possible to gain deeper understanding of the intricate relationship between process-driven phenomena and material structure. This, in turn, sheds light on how these interactions influence part performance while enabling the construction of a comprehensive testing matrix for novel materials, allowing for the identification of robust additive manufacturing (AM) parameters tailored to yield desirable material properties.
This efficient approach enables the development of new alloys suitable for LPBF by dry mixing of elemental powders and/or pre-alloyed powders, allowing us to create custom blends with tailored chemical compositions. This approach facilitates high-throughput alloy design and screening of new material compositions, featuring mechanical and functional property combinations not found in conventional, commercial alloys. These properties can be intentionally varied by modifying the concentration of one or more of the elements towards engineered microstructures of interest resulting from the LPBF process [17].
Several previous studies have demonstrated the successful utilization of powder blends as input materials for LPBF for all alloy classes [18]; to name a few, in [19] the primary focus was on the processability of elemental powder blends of a Al-C-Co-Fe-Mn-Ni system and the influence of process parameters on the mechanical properties of lattice structures; results were found comparable to high-Manganese steel samples, achieving an increase in energy absorption equal to 75% in comparison with the commonly used 316L. They also highlighted the influence of higher energy density on the chemical homogeneity and elemental distribution of the studied high entropy alloys. According to another study [20], an alternative alloying concept for Aluminum-based alloys was demonstrated to combat the challenges present in its AM processing such as its low laser absorption, high thermal conductivity and reduced powder flowability, responsible for its poor processability [21]. Through the addition of nanodiamonds and graphene powder, the processing of AlSiMg alloy powder was successful at lower energy densities, since the energy absorption of the material was effectively increased. Nevertheless, it was concluded that the decrease in relative density was due to the addition of graphene, which might cause fusion defects. Most importantly, the formation of a graphene network in the material structure and the in situ formation of Al4C3 phases was identified and linked to the Orowan strengthening mechanism, leading to >40% increase in material hardness compared to the virgin AlSi10Mg alloy. However, the authors concluded that additional efforts are needed for the optimization of the blended fractions to secure a homogeneous distribution of the strengthening phases [20]. In similar studies, Montero Sistiaga et al. and Aversa et al. [22,23] modified the composition of the 7075 alloy, increasing the Si content to change the solidification range and the fluidity of the molten phase, Martin et al. [24] introduced hydrogen stabilized Zr nanoparticles to the powder batches in aluminum series 7075 and 6061, Zhang et al. [25] and Nie et al. [26] introduced Zr into Al-Cu-Mg powder samples for grain refinement through the Al3Zr precipitates which act as seeds for the heterogeneous nucleation, while Wang et al. [27] investigated the addition of Si and in Al-Cu-Mg alloy and its effect on its processability, consolidation and microstructure. Hence, numerous concepts can be found in the literature for the modification of aluminum alloys towards developing new compositions specifically designed for laser-based powder bed AM processes. However, to the best of our knowledge, limited publications exist for duplex and super duplex stainless-steel powder blends.
In the work of Köhler et al. [28], various mixture ratios of austenitic stainless-steel powder (AISI 316L) with a duplex stainless-steel powder (AISI 318LN) were studied in order to attain a duplex microstructure in the as-built state with the use of different energy densities during LPBF. The authors reported that the addition of 30 wt% AISI 318LN to AISI 316L led to the formation of a duplex (roughly 50/50) microstructure in the as-built condition. The strength and corrosion resistance of this new alloy was superior to that of pure AISI 316L. In addition, it was shown that the formation of the duplex microstructure was extremely sensitive to different energy inputs. It was concluded that different cooling rates along with different cooling modes caused by the varying energy inputs, had the main impact on the microstructural phase formation. Cui et al. [29] demonstrated the successful AM processing of different ratios of X2CrNiMo17-12-2 powder and the super duplex stainless-steel X2CrNiMoN25-7-4 powder for tuning the solidification and percentages of ferrite/austenite microstructural phases. Chemical homogeneity of the powder mixture is another factor determining phase formation during fabrication of the parts. For this reason, it is of interest to gain a deeper understanding of how different chemical compositions and different laser energy inputs influence the phase composition of LPBF processed DSS and SDSS alloys. In this context, it is important to understand how energy density-dependent chemical heterogeneities at the powder bed affect the phase formation when using powder mixtures [29].
Although the mechanical properties of DSSs have been studied at the macroscale, the number of works involving low-scale mechanical characterization is quite low for such a material [30,31,32]. In this regard, the reported results of mechanical properties of constitutive phases (ferrite or austenite) at the nanoscale are diverse. The austenitic phase may exhibit a higher, lower or equal hardness/elastic modulus when compared with the ferritic phase, depending on different variables such as selected manufacturing process, formulation/chemical compositions (mostly N content) and microstructural/crystallographic texture of the individual phases (e.g., orientation). For this reason, the aim in [10,11] was to achieve a two-phase microstructure of ferrite and austenite (in the PBF-LB state) to combine the high strength in the LPBF state resulting from the high cooling rates (high dislocation density and small grains) with the aforementioned advantages of a two-phase microstructure [10,11].
The focus of this study is to minimize or even eliminate the post-process annealing and achieve a dual phase microstructure of LPBF processed DSS and SDSS parts by blending pre-alloyed DSS/SDSS powders with austenitic stainless-steel 316L (SS316L) powder. The primary idea was to increase the nickel content, to induce in situ austenite formation at the end of solidification since Ni is an austenite stabilizer. SS316L powder was selected, due to its higher nickel content in comparison to DSS/SDSS [33]. Moreover, its low concentration of Mo, Cr, C, N chemical elements, will not affect the final microstructure of the blends with deleterious intermetallic phases and carbide/nitride precipitates [34,35,36]. Nanoindentation studies on custom powder blends reveal the mechanical behavior of constituent phases at the micro-scale as a key parameter for optimizing the microstructural design of these materials, while a comprehensive literature review on the subject is provided. In order to attain reliable values of the hardness and elastic modulus of each constitutive phase, a coupling of techniques is here employed for assessing small-scale mechanical properties, providing information about the content and distribution of constitutive phases by linking different discerned responses exhibited by distinct mechanical phases. The methodology can be replicated for a variety of pre-alloyed/elemental powders as a rapid alloy screening workflow via LPBF, enabled through powder blending. This approach facilitates the creation of a targeted Design of Experiments (DOE) matrix for the purpose of developing a comprehensive ‘powder toolkit’. This toolkit establishes a link between composition, properties and microstructure, thereby aiding in the selection of optimal alloys for parts processed through Additive Manufacturing (AM) prior to selected atomization experiments for producing pre-alloyed powders.

2. Materials and Methods

2.1. Feedstock Materials

Gas atomized duplex stainless-steel grade 2205 (1.4462) (MARS F51, Mimete S.r.l., Biassono, Italy), super duplex stainless-steel 2507 (1.4410) (MARS F53, Mimete S.r.l., Biassono MB, Italy) and stainless-steel 316L (1.4404) (Metalpine 316L, Metalpine GmbH, Graz, Austria) powders were utilized (Table 1). Two mixtures were selected for blending; DSS blended with 316L (Blend 1) and SDSS with SS316L (Blend 2) powder in a weight fraction of 50–50 and 80–20 ratio, respectively. Prior to dry mixing, the as-received materials were inspected with respect to the bulk powder characteristics and particulate properties, presented in Table 2.

2.2. Blending of As-Received Powder Feedstock and Powder Characterization

The blending process was performed in a tumbling mixer at low rpm (~30 rpm). The mixing time was 15 min for each blend. The amount of each blend was 4 kg in order to have an adequate amount of powder for the process optimization of each blend via LPBF.
Both blends were studied in terms of their bulk powder characteristics (apparent density, tap density, flowability, particle size distribution). Tap and apparent density were measured according to ASTM B527 and ASTM B212 standards, respectively. The flowability test was performed according to ASTM B213 standard. D10, D50, D90 values were measured through static image analysis according to the ISO 13,322 standard. A Scanning Electron Microscope (SEM, Thermo Fisher Scientific Inc., Waltham, MA, USA) equipped with a 15 kV acceleration voltage, was used to characterize the powders regarding their morphology and shape. Based on the chemical compositions of the feedstock materials, calculations of nominal chemical composition for the selected ratios of DSS/SDSS with SS316L have been performed and they are presented in Table 3.

2.3. LPBF System and Parameter Study

In this study a LPBF machine (INTECH, SF1 iFusion150, Intech Additive Solutions Ltd., Bangalore, India) was used to process the powders, equipped with a 500 W Ytterbium fiber laser (1064 nm) with a laser spot size of 80 μm. The samples were built on a platform of AISI 304 stainless steel with a diameter of 150 mm. The build plate was preheated to 150 °C and it was maintained at this temperature during manufacturing. An inert atmosphere inside the build chamber was ensured with the use of pure argon gas (grade 5, 99.9% pure) and the oxygen levels were kept below 0.5% ppm. To define the optimum process parameter set for each new alloy, the Volumetric Energy Density (VED) was used as the main design parameter, and it was calculated based on Εquation (1):
E = P v h t J / mm 3  
where P is the laser power in W, v is the laser scan speed in mm/s, h is the hatch distance between adjacent laser scan tracks in mm and t is the layer thickness of the powder in mm. The pre-defined optimum parameters for 316L, DSS and SDSS were used as benchmark to narrow down the process window. It must be noted that the varying energy densities were a result of laser power, scan speed and hatching distance. The layer thickness was the only parameter kept constant at 0.4 mm and hatch distance at 0.1 mm. Cylindrical samples with a diameter of 12.5 mm and a height of 8 mm were produced on 3 mm support structures for easier removal from the substrate. The experimental plan was divided into 2 builds per alloy. Three-dimensional maps depicting selected laser power, scanning speed and corresponding color-coded volumetric energy density utilized in the current study for (a) Blend 1 and (b) Blend 2 are shown in Figure 1. After the printing process was completed, the parts were removed from the substrate by cutting the supports with a wet cutting bandsaw machine (FEMI N310 DA DG, Castel Guelfo di Bologna, Italy).
Laser power, scanning speed and hatch distance were the principal process parameters having a direct, decisive effect on the specimens produced by the LPBF process. Therefore, the current research determined the laser power, scanning speed and hatch distance that could be used to produce defect free nearly fully dense samples of the selected powder blends, as presented in Table 4. The above parameters will pave the way for the production of dense parts from custom DSS and SDSS alloys, thus promoting the widespread industrial application of the selected or similar alloy compositions.

2.4. Material Characterization of LPBF Parts

Metallographic preparation including cutting (Mecatome T210, precision micro-cutting machine, PRESI, Paris, France), mounting, grinding and polishing (Tegramin, STRUERS, Birmensdorf, Switzerland), was conducted for all samples in order to assess and quantify types of defects such as cracks or pores. The density of the printed parts was measured from cross-sectional optical images in the XY and XZ planes for each sample with the use of ImageJ (FIJI), an open source software (1.54d, NIH and LOCI, Maryland and Wisconsin, USA) for image analysis. The same metallographic preparation was performed for the microstructural analysis of the parts with an additional step of etching. Each specimen was ground to a 2000 grit finish, prior to polishing with a 3 μm diamond paste followed by a final 1 μm fumed silica polishing. The polished samples were chemically etched with Beraha’s etchant (80 mL H2O + 40 mL HCL + 1 g Potassium Metabisulfite) to reveal the microstructure and achieve the best phase contrast between austenite and ferrite. The etching time was 5–10 s depending on the freshness of the etching solution and mostly on the time interval between the last polishing step and etching. Based on the literature, Beraha’s etchant colorizes (darkens) ferrite phase leaving the austenite phase untouched (bright) [37]. Optical 40–800 X Trinocular Metallurgical Polarization Microscope equipped with a 18 MP Digital Camera, AMScope(United Scope LLC, Irvine, CA, USA) and scanning electron microscopy (Thermo Fisher Scientific, Phenom ProX, Waltham, MA, USA) were utilized for metallographic imaging. Light Optical Microscopy (LOM) was implemented with images taken between 50× and 500× magnification, providing images of the holistic microstructure of the sample. The scanning electron microscope was used for higher magnification imaging of the metallographic features. Electron Dispersive X-ray Spectroscopy was utilized for the compositional analysis of microstructural phases and constituents. EDS can offer semi-quantitative outcomes but lacks the capability to detect interstitial elements with low atomic numbers such as carbon, oxygen and nitrogen. The characterization of phases was validated by Electron Backscatter Diffraction (EBSD).
Electron Backscatter Diffraction (EBSD) imaging was conducted on a FEI Nova NanoSEM 650 scanning electron microscope (FEI, Brno, Czech Republic) with a TSL EBSD camera to measure grain sizes and gain knowledge on the ferrite–austenite fraction and on how these phases are formed and arranged. The acceleration voltage of the electron beam was 20 keV, and the working distance was 20 mm with a step distance of 0.5 µm, a binning factor of 4 × 4 and an exposure time of 8 ms/px. The EBSD data analysis was conducted using Aztec software (version 3.3, Oxford Instruments, PLC, Abingdon, Oxfordshire, United Kingdom). For EBSD samples, the same metallographic preparation was followed except etching, but with an extra polishing step using a colloidal silica suspension (0.04 μm). The Polishing with colloidal silica was carried out in order to eliminate scratches from the previous grinding and polishing steps and create a clean and flat surface appropriate for EBSD.
A Bruker TS77 TriboLab® Nanomechanical Test Instrument (Minneapolis, MN, USA) was utilized for the nanoindentation testing (the instrument capabilities enable loading from 1 × 10⁻³ mN to 30 mN and with a high load and displacement resolution of 1 nN and 0.04 nm, respectively). The instrument is equipped with a scanning probe microscope, in which a probe tip moves in a scan pattern across the sample surface using a three-axis piezo positioner. Here, a Berkovich tip of 80 nm radius is selected. Nanomechanical properties were assessed using the Oliver–Pharr model [38]. A grid mapping protocol of a 20 by 20-point array was selected, with 10 microns spacing, employing 40 s in loading, 3 s hold time and 40 s unloading time under displacement control (set at 200 nm of displacement). The load range was carefully selected according to [39], where values of reduced modulus were stable within the 3000–7000 μN range. At first, contour maps were generated in order to reproduce the surface topographical variation of local mechanical properties, due to distinct phase occurrence. Within the maps, recurrent patterns were identified and correlated with SEM images of the grid (nanoindented samples were subjected to SEM analysis after the measurements).

3. Results

3.1. Powder Blend Characterization

The SEM micrographs presented in Figure 2 illustrate the morphology of both powder blends. The particles are mostly spherical, although very small amounts of satellites, agglomerations as well as broken particles can be detected in each sample.
Table 5 and Table 6 show the bulk powder properties and for Blend 1 and Blend 2. The apparent density is 4.3 and 4.15 g/cm3, respectively, and their tapped densities and flowabilities are almost identical. It is observed that the obtained results concerning the powders’ flowability and apparent density are in good agreement with the as-received feedstock.
Static image analysis was employed to obtain the Circle Equivalent (CE) diameter for particles of each blend. The values of minimum, maximum and mean diameter of each powder blend were calculated, as well as the D10, D50 and D90 values, and are presented in Table 6. The D10, D50 and D90 values of each powder were obtained from the cumulative curves of the volumetric particle size distribution (Figure 3). Similar minimum circle equivalent diameter and mean circle equivalent diameter values were presented for both blends. The maximum circle equivalent diameter of Blend 1 was 30 μm higher than that of Blend 2. There were deviations between Blend 1 and Blend 2 regarding the D10, D50 and D90 values. D10, D50 and D90 values of Blend 2 were 7 μm, 11 μm and 20 μm higher than the Blend 1 corresponding values. The higher weight concentration of SS316L (50%) in Blend 1 resulted in a lower PSD range in comparison with Blend 2, where the SS316L weight concentration was 20%.

3.2. Density–Porosity Analysis of LPBF Samples

The porosity of the as-built samples for Blend 1 with various processing conditions is presented in Figure 4. It is evident that porosity is influenced by the volumetric energy input during the LPBF process. Two types of pores were identified in the LPBF samples, metallurgical pores and keyhole pores. Metallurgical pores are spherically shaped and small in size (less than 100 μm), whereas keyhole pores are irregularly shaped and large in size (above 100 μm) [39,40,41]. The sectioned and polished samples revealed the evolution of porosity according to the VED resulting from the variation of processing parameters. When VED values below 50 J/mm3 are used the relative density falls drastically under 98%. Relative density increases along with the increase of VED. The relative density of the specimen fabricated by 81.6 J/mm3 is 99.9%, which is the maximum value reached in this research study. However, as the VED increases further, the relative density begins to decrease. Relative density decreased to 98.7% when the VED was raised to 90 J/mm3. In brief, the relative density of the specimen increased first and then decreased with the increase in VED. It is evident that the combination of laser power and scanning speed causes the variation of sample density, which is directly related to the melting regime (keyhole or conduction) and the formation of pores. Figure 4 shows the porosity evolution of five cross sectioned samples in the XZ plane, produced with a wide range of VED values. For low VED values, the pores are large in size and highly irregular and, in certain cases, unfused powder particles are entrapped in the pores. With the increase in VED values, the number and the size of the pores decrease gradually up to the optimum VED value of 81.68 J/mm3. When the VED is increased further, lots of metallurgical pores are detected along with keyhole pores.
For Blend 1, the optimum VED was found to be 81.6 J/mm3 and resulted in a relative density of 99.90% in the XY plane and 99.94% in the XZ plane. For Blend 2, the optimum VED was 56.82 J/mm3, significantly lower, resulting in a relative density of 99.98% in the XY and 99.96% in the XZ plane, respectively, as presented in Figure 5.

3.3. Microstructural Analysis

3.3.1. Blend 1

In Figure 6, the microstructure of Blend 1 is shown, where the white/bright phase is austenite and the colored phase (brown/yellow) is ferrite. The initial ferrite formation is followed by austenite nucleation and growth at ferrite–ferrite grain boundaries [42]. The columnar ferrite grains along with grain boundary austenite grow from both sides of the melt pool and are slightly angled towards the center of the melt pool in the XY plane (Figure 6). In the XZ plane, the columnar grains grow, following the direction of the heat source [43]. The columnar grains follow epitaxial growth across several melt pools [42]. The austenite morphologies were better observed in higher magnifications (SEM micrographs). In Figure 6b, it was observed that the Grain Boundary Austenite (GBA) is allotriomorphic and there are areas where the secondary austenite γ2 has been nucleated along with Widmanstätten Austenite (WA). The melt pool boundaries and laser melt tracks are more clearly visible in SEM micrographs. Austenite and ferrite presented similar weight and atomic concentrations in most of their common chemical elements (chromium and nickel) based on EDS analysis (Table 7). The main difference between austenite and ferrite was observed in the molybdenum (Mo) content. Molybdenum is the principal ferrite stabilizer along with chromium and silicon considering their contribution to the Cr equivalent formula of the Schaeffler diagram [44]. Ferrite exhibited a higher Mo concentration compared to austenite. In general, there were compositional variations in the austenite and ferrite from region to region with respect to nickel and chromium content, except for molybdenum. A constant difference in the molybdenum content between austenite and ferrite was observed.
EBSD phase and Inversed Pole Figure (IPF) maps of Blend 1 are presented in Figure 7. EBSD phase maps revealed that the Blend 1 as-built microstructure consisted of 89.7% ferrite and 10.2% austenite at the XY plane and 70.8% ferrite and 22.5% austenite at the XZ plane (build direction). Austenite has grown mainly along the <101> crystallographic direction whilst ferrite showed a favored grain growth along the <001> crystallographic direction.

3.3.2. Blend 2

Blend 2 exhibited a similar microstructure to Blend 1 but with a smaller austenite volume fraction. The grain boundary austenite was thinner compared to Blend 1 and there were less nucleation sites of γ2 and WA (Figure 8). Moreover, Blend 2 as-built microstructure revealed micro-segregations. Based on the EDS analysis shown in Table 8, the micro-segregation exhibited a similar chemical composition to the SS316L powder. As was the case for Blend 1, EDS analysis showed similar variations in chemical composition from region to region for austenite and ferrite phases, except for molybdenum. Additionally, the Blend 2 microstructure displayed zones of cellular grains near the melt pool boundaries and near the boundaries of laser melt tracks. The melt pool boundaries and laser melt tracks were better defined as compared to Blend 1.
EBSD phase and Inversed Pole Figure (IPF) maps of Blend 2 are presented in Figure 9. EBSD phase maps revealed that the Blend 2 as-built microstructure consisted of 95% ferrite and 5% austenite at the XY plane and 95.4% ferrite and 3.6% austenite at the XZ plane (build direction). Austenite is grown mainly along the <101> crystallographic direction similar to Blend 1. Ferrite grains featured a mixed growth orientation along the <001>, <101> and <111> crystallographic directions.

3.4. Nanomechanical Properties

Combining EBSD and SEM with nanoindentation enables a statistically valid experiment to be performed with ease. No phase transformation of austenite to martensite is observed in the deformed regions. The recorded indentation curves are utilized to quantify the elastic and plastic properties of the phases. Ferrite is found to have a higher elastic modulus; in principle, although ferrite is generally considered as the strong phase, duplex stainless-steel samples could be expected to show the opposite behavior [45] where austenite has higher strength. This can be attributed to the role that nitrogen plays as an austenite phase stabilizer, acting also as a planar glide promoter, which enhances the strength of the austenite. Pile up of austenite dislocations at the phase boundary is reported [39] to induce dislocation generation in ferrite, while ferrite grains could also be sheared by the dislocation traces of the surrounding austenite. Ferrite demonstrates a higher elastic modulus and strain hardening than austenite but they both exhibit very similar yield strength. Moreover, the difference often observed in the values of hardness (H) between these phases is attributed to the elastic and hardening differences between them.
At first, contour maps were generated in order to reproduce the surface topographical variation of local mechanical properties due to distinct phase (and orientation) occurrence. Within the maps, reoccurring patterns were identified and correlated with SEM images of the grid (nanoindented samples were subjected to SEM analysis after the measurements). In Figure 10, the SEM image of the grid (nanoindented samples were subjected to SEM analysis after the measurements) is shown, along with EBSD map and overlap of the nanoindentation grid and the IPFz map. Additionally, through superpositioning of the modulus onto the EBSD map, variations of values inside intergranular austenite (in green), which directly correspond to separate grains, are revealed, validated by respective color variation also in the EBSD (noted with black arrows). In Figure 10f, superpositioning of the modulus (E) onto EBSD map for Blend 2 XY is presented.
The nanoindentation testing of Young’s modulus of austenite and ferrite in duplex stainless steel is reported not to be affected by sample surface treating methods, i.e., mechanical polishing, electrolytic polishing and chemical etching, whereas this is not valid for hardness; the nanoindentation testing of hardness of austenite and ferrite in duplex stainless steel is affected by surface treatment, here, mechanical polishing [46]. Therefore, the elastic modulus (E) is selected in order to generate the 3D map representation, denoting the difference in nanoindentation response due to phase properties underneath the indenter, for (a) Blend 1 XY, (b) Blend 1 XZ, (c) Blend 2 XY plane, (d) Blend 2 XZ plane (Figure 11).
In Figure 12, the onset of plasticity (in the form of yield type pop-in/initial change of slope) for three different indentations (Nos. 385, 387, 379 of the dataset are evidenced, at different displacements (7, 12 and 5 nm respectively) is identified, denoting distinct transition points from the elastic to elastoplastic region, beneath the indenter.
The extent of contact depth can be directly attributed to plastic deformation at the nanoscale; higher contact depth range corresponds to higher plasticity. The plastic deformation and residual form of ferrite are evidenced as more obvious than those of austenite (calculated yield strength and work-hardening exponent of ferrite are lower than those of austenite) [39]. Relative studies in the literature often lead to the conclusion that both phases exhibit similar values drawn from nanomechanical testing, and these can vary; as a controversy, ferrite is reported either to be easier [39] or to be harder [47] to penetrate than austenite. The average elastic modulus of the ferrite phase is reported in the literature to be slightly higher than that of the austenite phase (ferrite is 206.94 GPa and austenite is 199.84 GPa), while the average nanohardness is reported to be lower (ferrite is 3.95 GPa and austenite is 4.1 GPa); however, these values are indicative.

4. Discussion

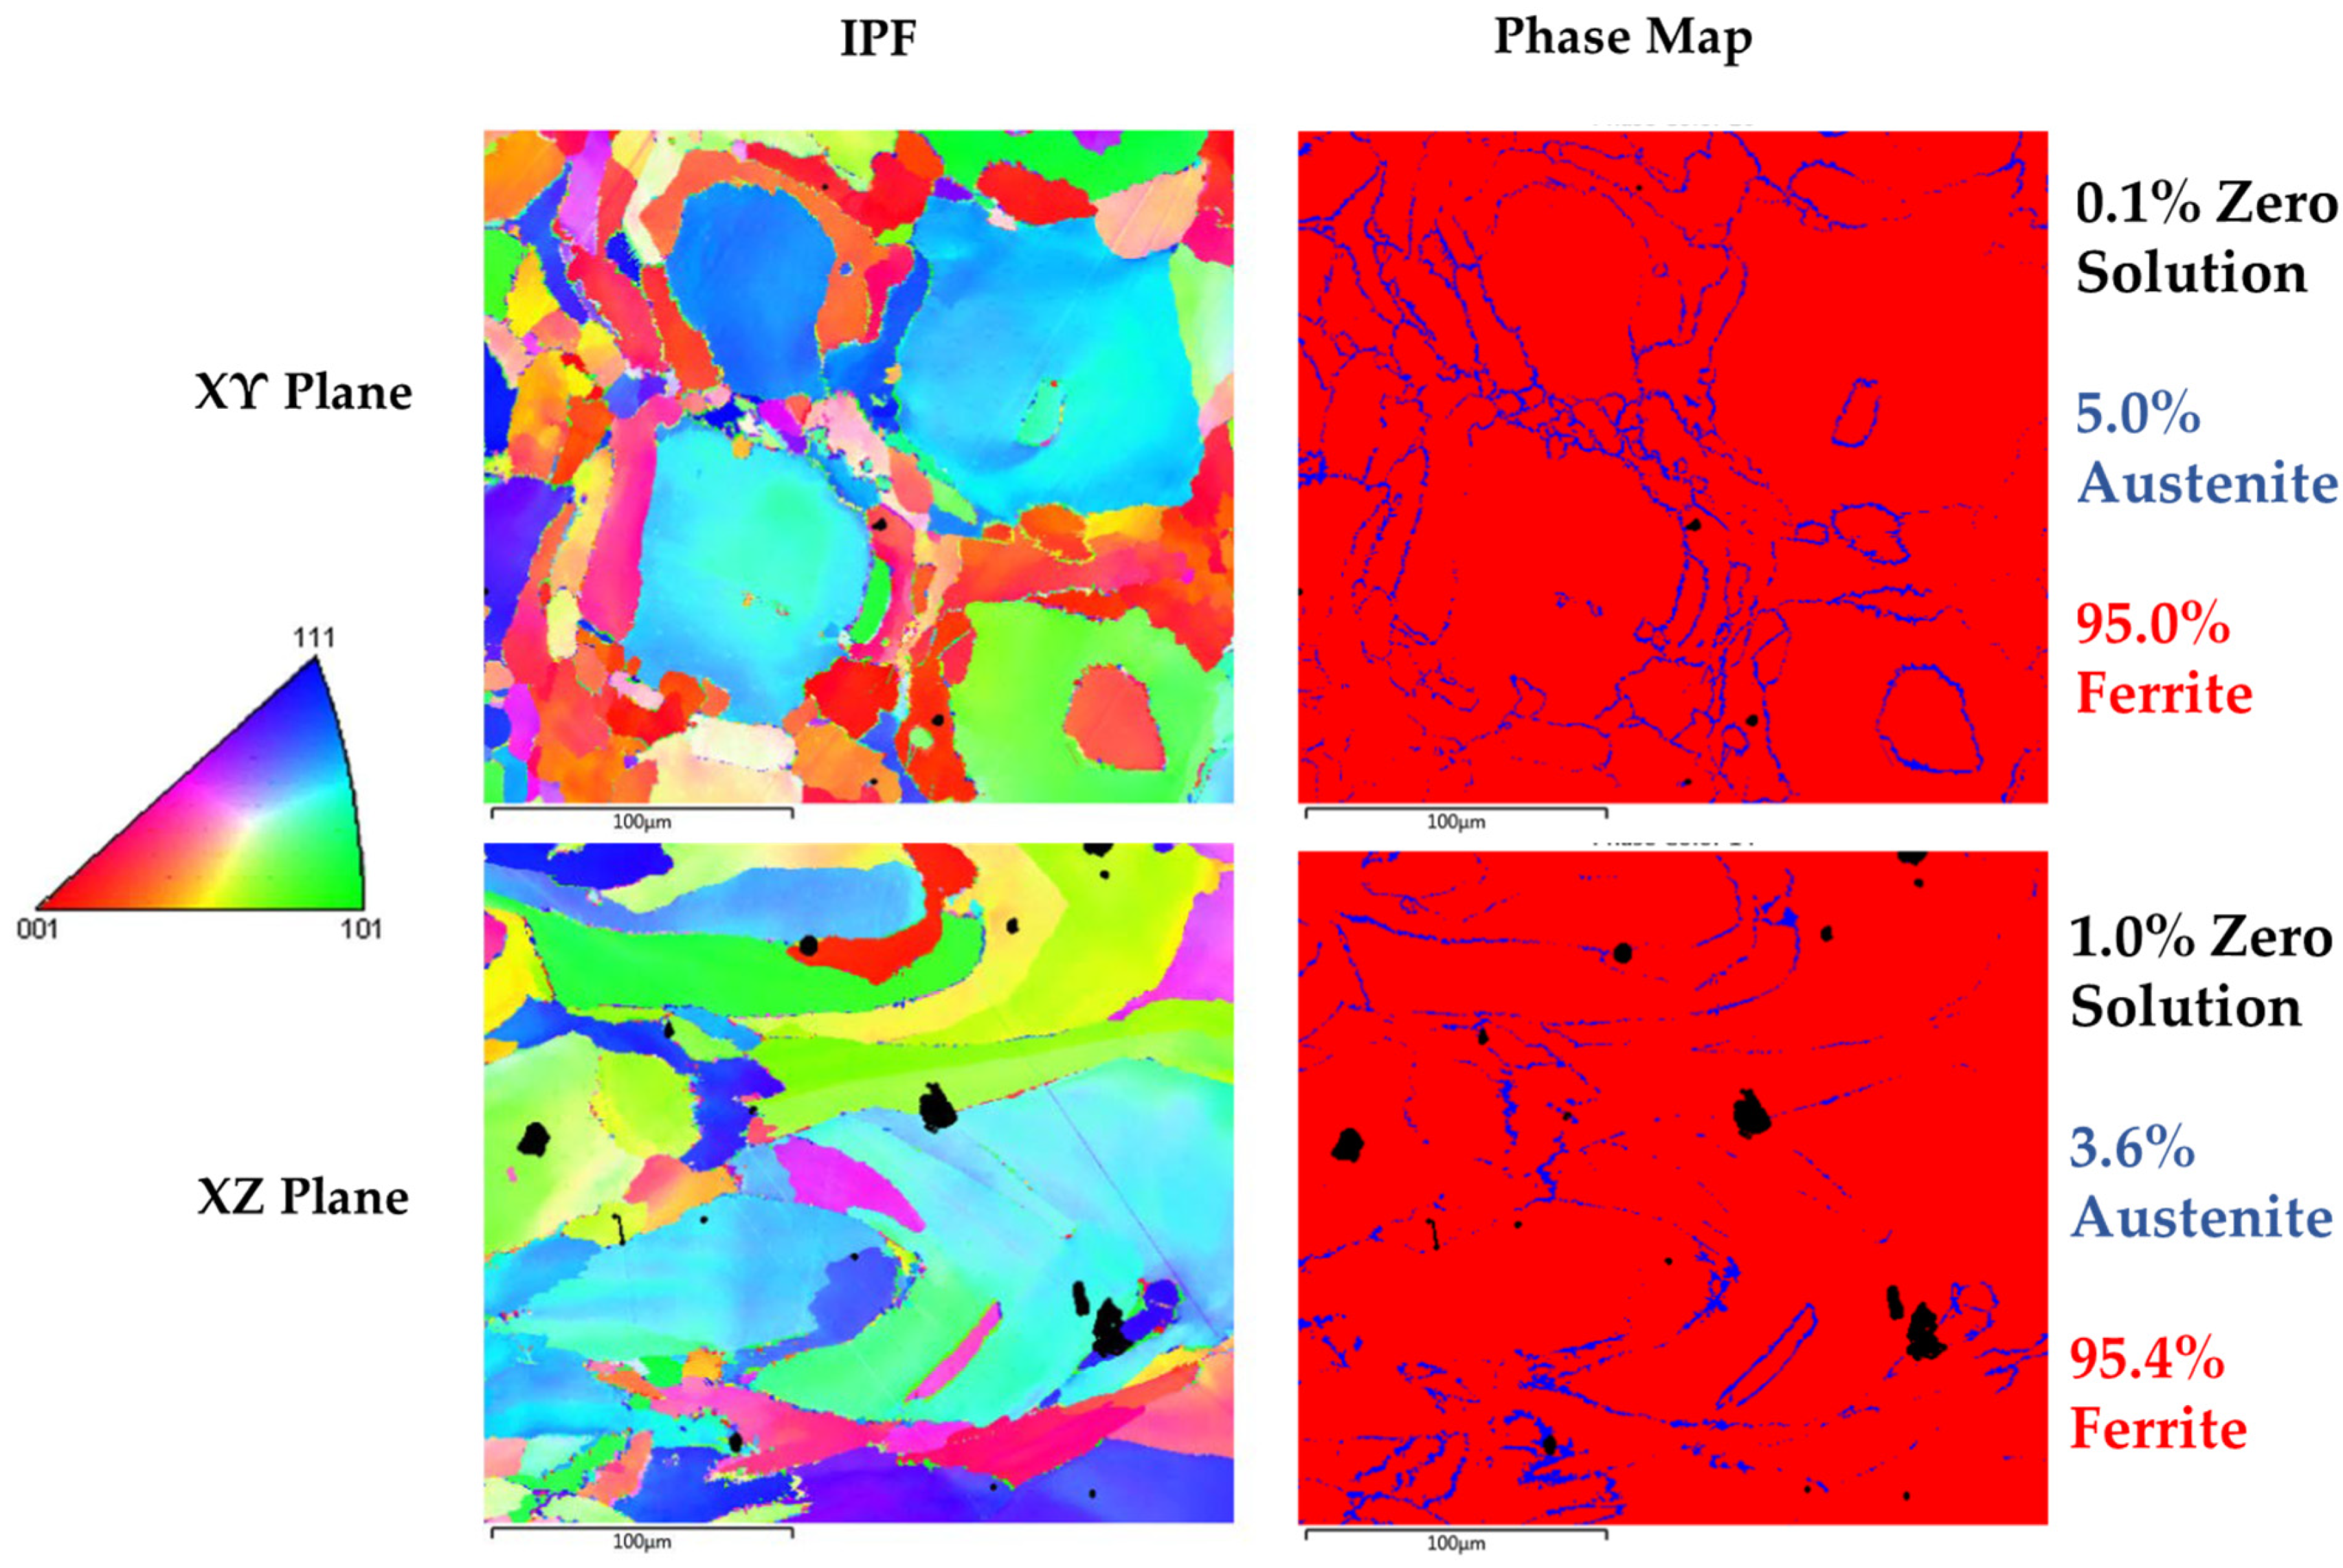
The microstructure of both alloys revealed increased austenite content due to the addition of austenitic stainless-steel powder compared to LPBF as-built DSS and SDSS microstructures which are mentioned in the literature [48,49,
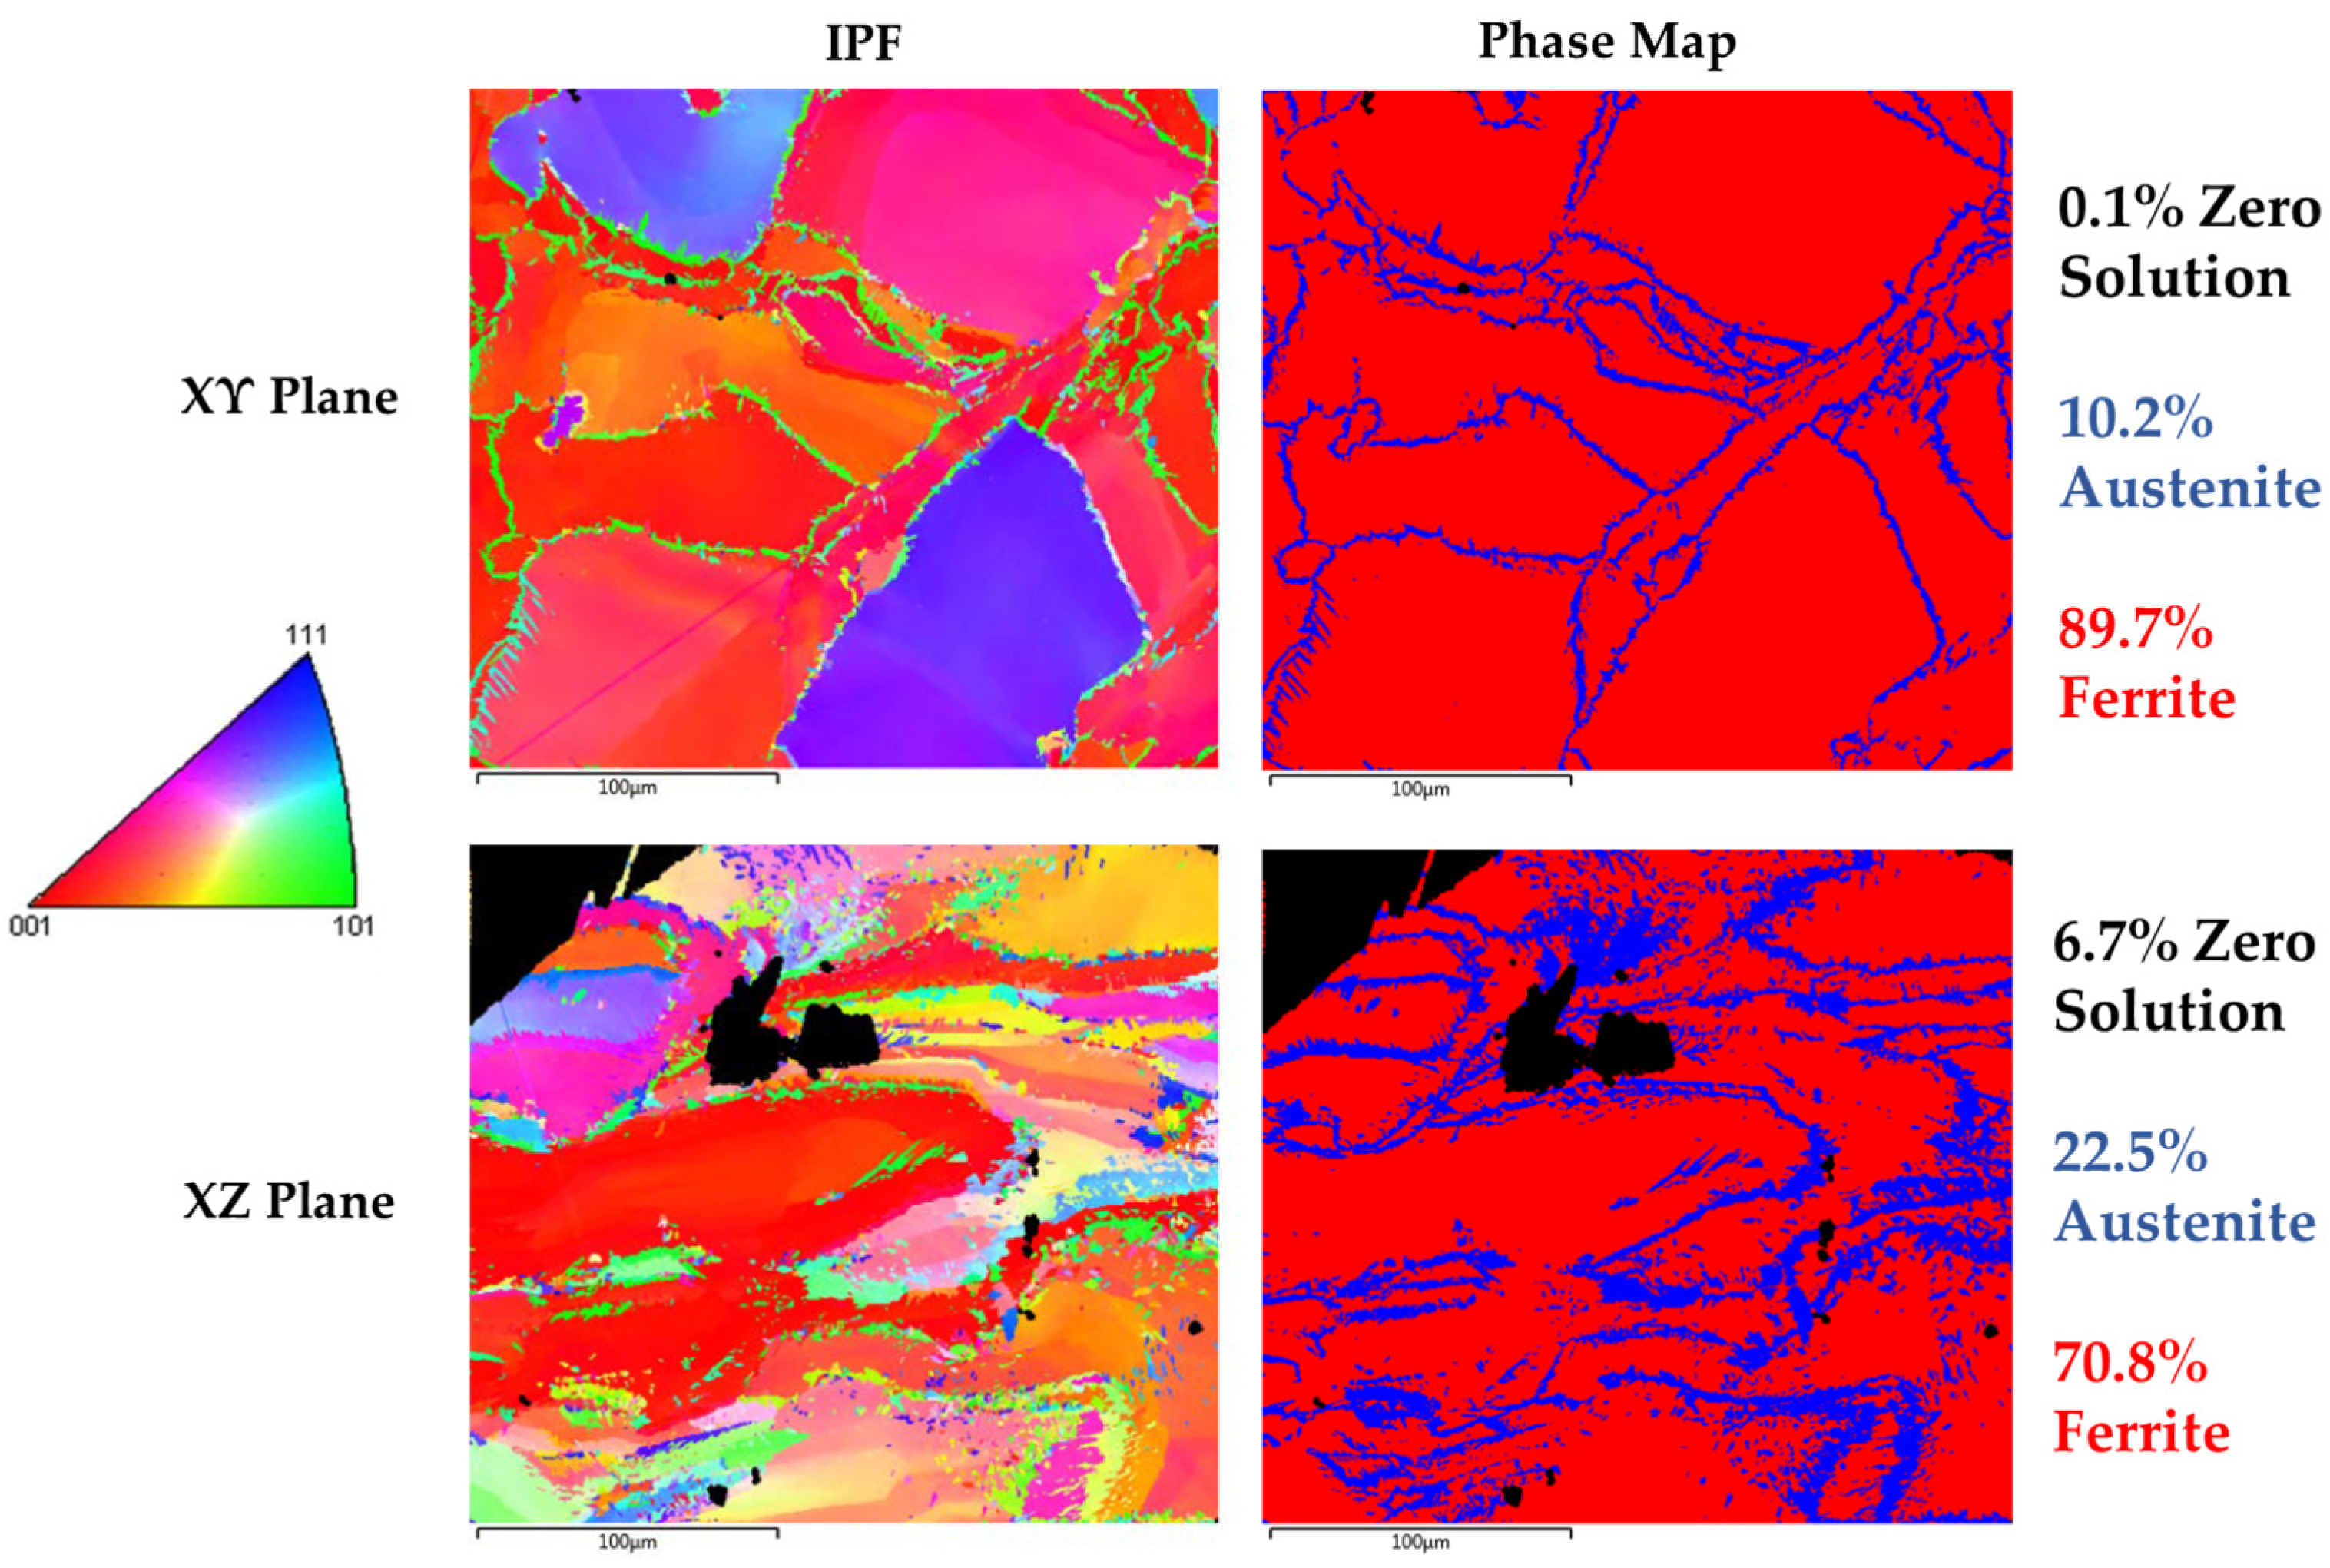
50]. Blend 1 presented higher austenite content in comparison to Blend 2. EBSD confirmed the austenite and ferrite phases that were observed with LOM and SEM. More specifically, EBSD phase maps (Figure 7) showed an austenite content equal to 10.2% at the XY plane and 22.5% at the XZ plane for Blend 1 while, for Blend 2, the EBSD phase map (Figure 9) showed an austenite content of 5% at the XY plane and 3.6% at the XZ plane. The phase characterization was validated by EDS, where the ferrite exhibited higher Mo content (ferrite stabilizer) in comparison to the austenite for both blends. The higher nickel content in Blend 1 compared to Blend 2 can justify the increased austenite volume fraction in the as-built microstructure, as shown in Table 3 for the calculated theoretical chemical composition of blended powder mixtures. The higher content of SS316L in the blend resulted in the generation of higher nickel content and in turn in higher austenite content in the as-built microstructure of Blend 1 compared to Blend 2. The composition equivalents, nickel (Nieq) and chromium (Creq), were calculated, where all alloying elements in steels are grouped into Ni-like and Cr-like elements, so-called austenite and ferrite stabilizers, and their contributions to Nieq and Creq are weighted by certain empirical coefficients obtained from mass of experiments [
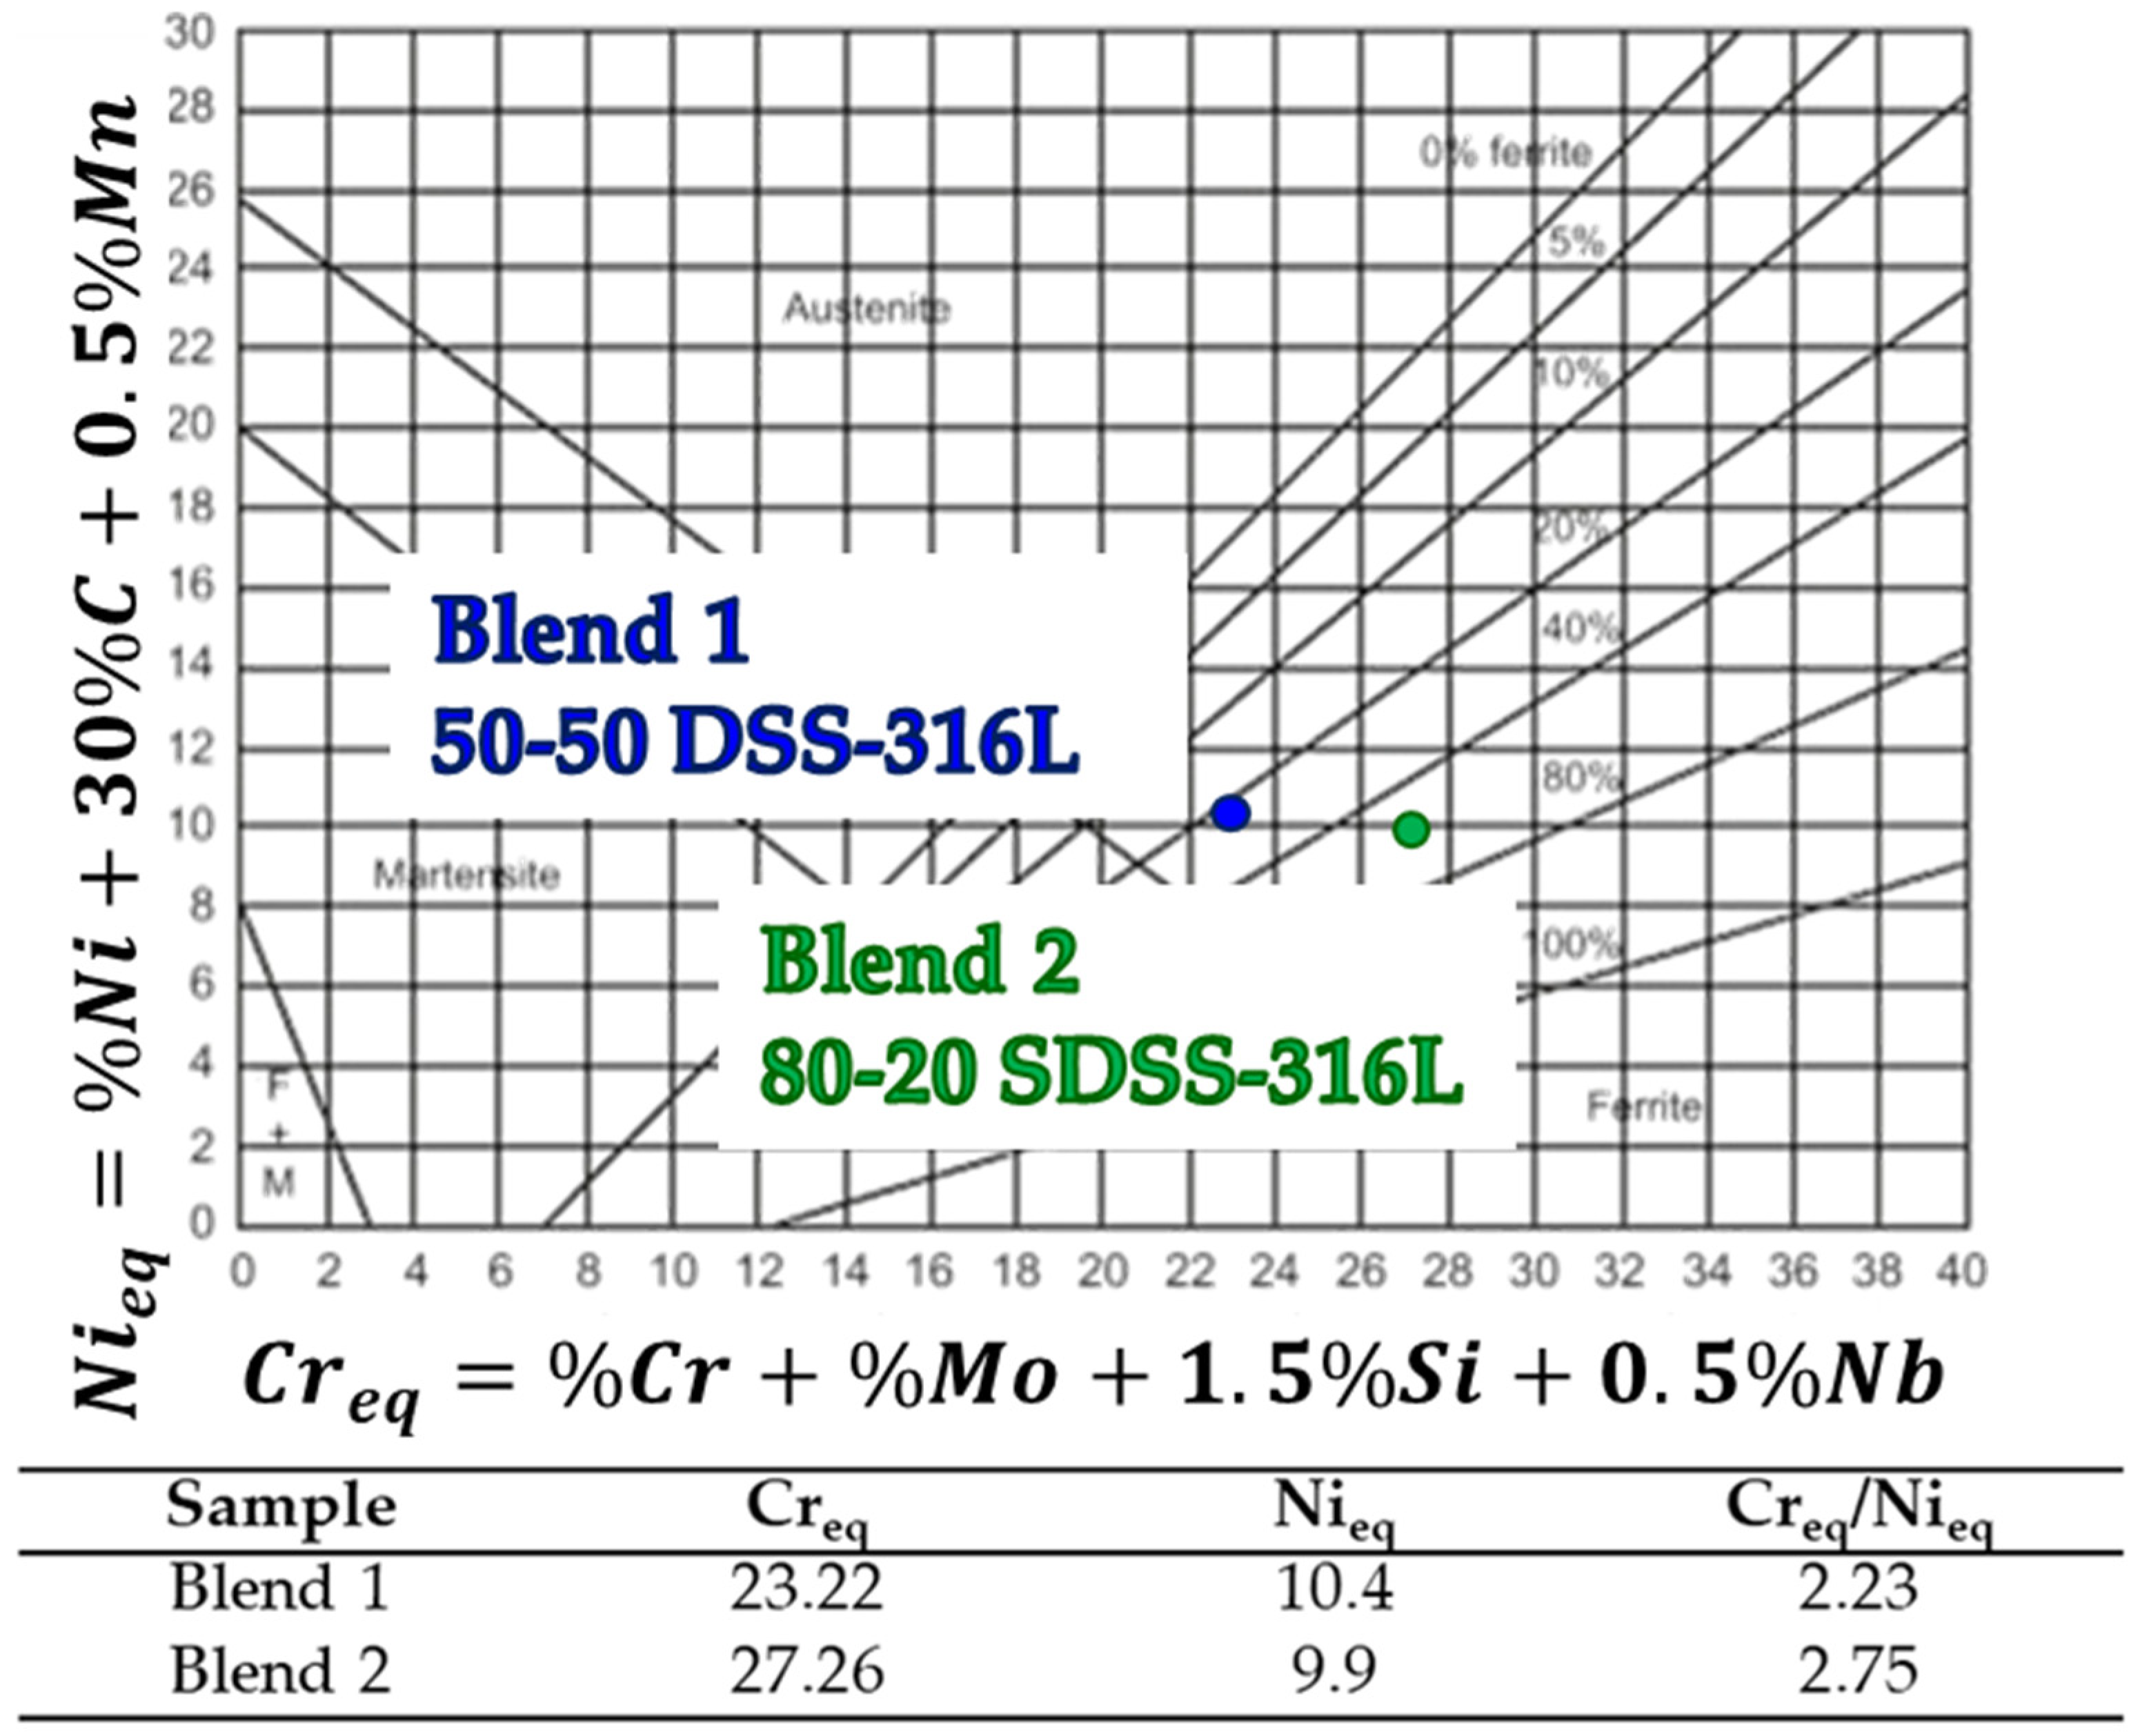
51]. Based on the nominal material compositions shown in Table 3, the ferrite/austenite contents of the LPBF samples were estimated by the Schaeffler diagram, as shown in Figure 13.
As previously reported [52], the use of a Schaeffler diagram to estimate the ferrite/austenite fraction has revealed two drawbacks. First, the strongly austenite-stabilizing element N is not considered in the Ni equivalent. Second, the austenite-stabilizing effect of Mn on the high-temperature reaction δ-Fe → γ-Fe is overestimated. The Ni equivalent based on the Schaeffler diagram equation was slightly higher for Blend 2 than Blend 1. The lower Cr equivalent and the slightly higher Ni equivalent of Blend 1 in comparison to Blend 2 can be considered as an indication of the theoretical higher austenite content in Blend 1. On the contrary, the Schaeffler diagram does not consider the solidification rate (cooling rate) of the LPBF part. The high solidification rates alter the as-built microstructure by suppressing the solidification mode. In our case (Blend 1 and Blend 2), the solidification mode was a suppressed ferrite to austenite (FA) solid transformation. In DSS and SDSS as-built microstructures the solidification mode FA suppressed and changed to only ferrite (F) [53]. The change in solidification mode modifies the volume fractions of austenite and ferrite. Therefore, as-built microstructures exhibited a 80–20 and 95–5 ferrite/austenite ratio while Schaeffler predictions exhibited a 25–75 and 60–40 ferrite/austenite ratio for Blend 1 and Blend 2, respectively. There are deviations between the Schaeffler predictions and EBSD phase quantification results for as-built microstructures, but both led to the result that the austenite content of Blend 1 was higher than the austenite content of Blend 2. Hence, the Schaeffler diagrams can be considered an approximate phase prediction study for powder blending of stainless-steel alloys.
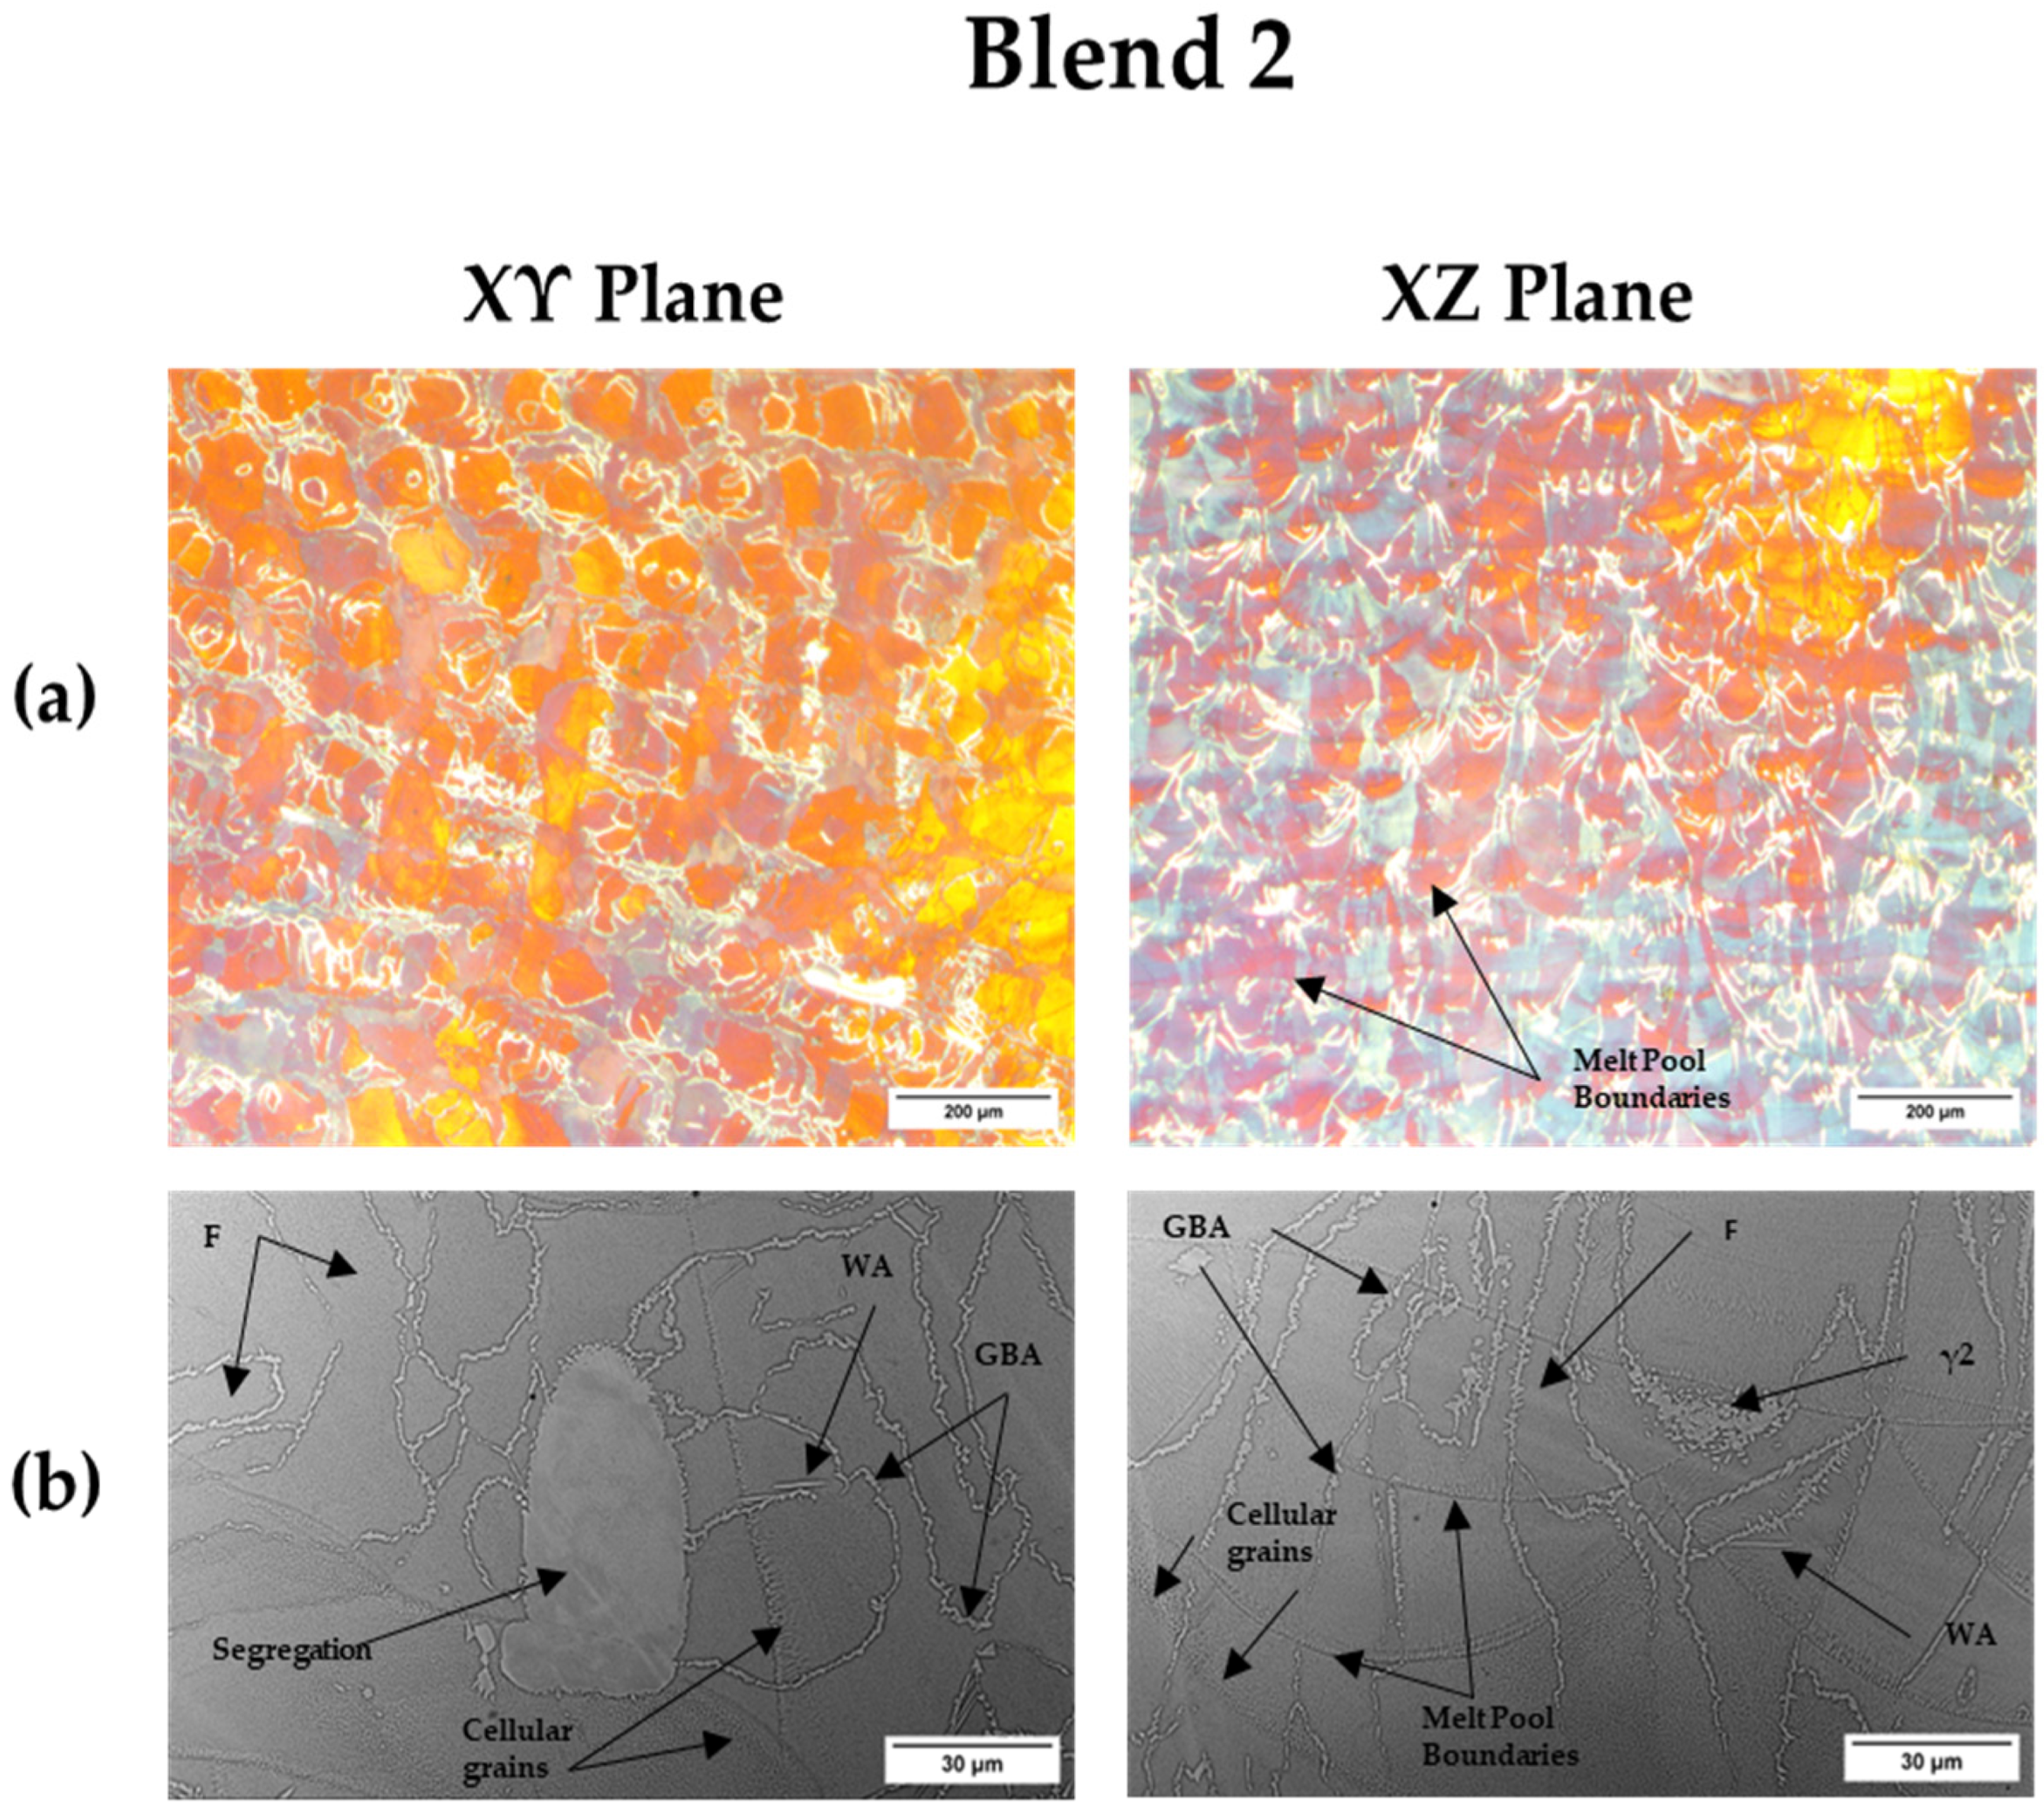
Blend 2 revealed SS316L micro-segregations in the microstructure. However, there were no traces of SS316L or DSS segregations in Blend 1. The segregations in the Blend 2 microstructure may be attributed to the fact that the amount of SDSS is higher than SS316L in the mixture and it is difficult to maintain an equal distribution between the two powders with the re-coater of the LPBF machine spreading the powder layer. In order to have an equal arrangement of particles between the two powders, it is favored to keep an equal amount, such as in the case of Blend 1 [29]. Local inhomogeneities or micro-segregations influence the microhardness uniformity of the as-built blended material [54]. In addition, Blend 2 cellular grains were observed near the melt pool and laser melt track boundaries. These fine cellular grain structures are typical microstructures of the LPBF process, due to constitutional supercooling together with a high solidification rate [55,56]. As previously reported, the fine cellular grains of LPBF as-built SS316L increase the yield strength [57]. Other reports mentioned that the boundaries of the SS316L LPBF as-built cellular grains were enriched with high density dislocations and presented chromium and molybdenum segregations [57,58].
No intermetallic phases were observed in both as-built microstructures (Blend 1 and Blend 2) because the precipitates are too fine to observe under SEM; however, chromium nitride precipitation in the DSS as-built microstructure has been reported and can be observed and identified via a Transmission Electron Microscope (TEM) [59]. Nitrogen content in the SDSS is twice as much compared to DSS and, in turn, the Blend 2 nitrogen content is twice as much compared to Blend 1. Increasing the nitrogen content in the DSS results in an increased fraction of chromium nitrides after non-equilibrium cooling rates [60]. The precipitation of chromium nitrides increases the yield and tensile strength and reduces the ductility [61]. Nitrogen is much more soluble in austenite than in ferrite [62,63]. Therefore, it is expected that chromium nitrides are present in the microstructure of both blends, and especially in Blend 2. Blend 2 contained the highest nitrogen content and showed increased ferrite content when compared to Blend 1, where a significant amount of N is assumed to be dissolved in austenite.
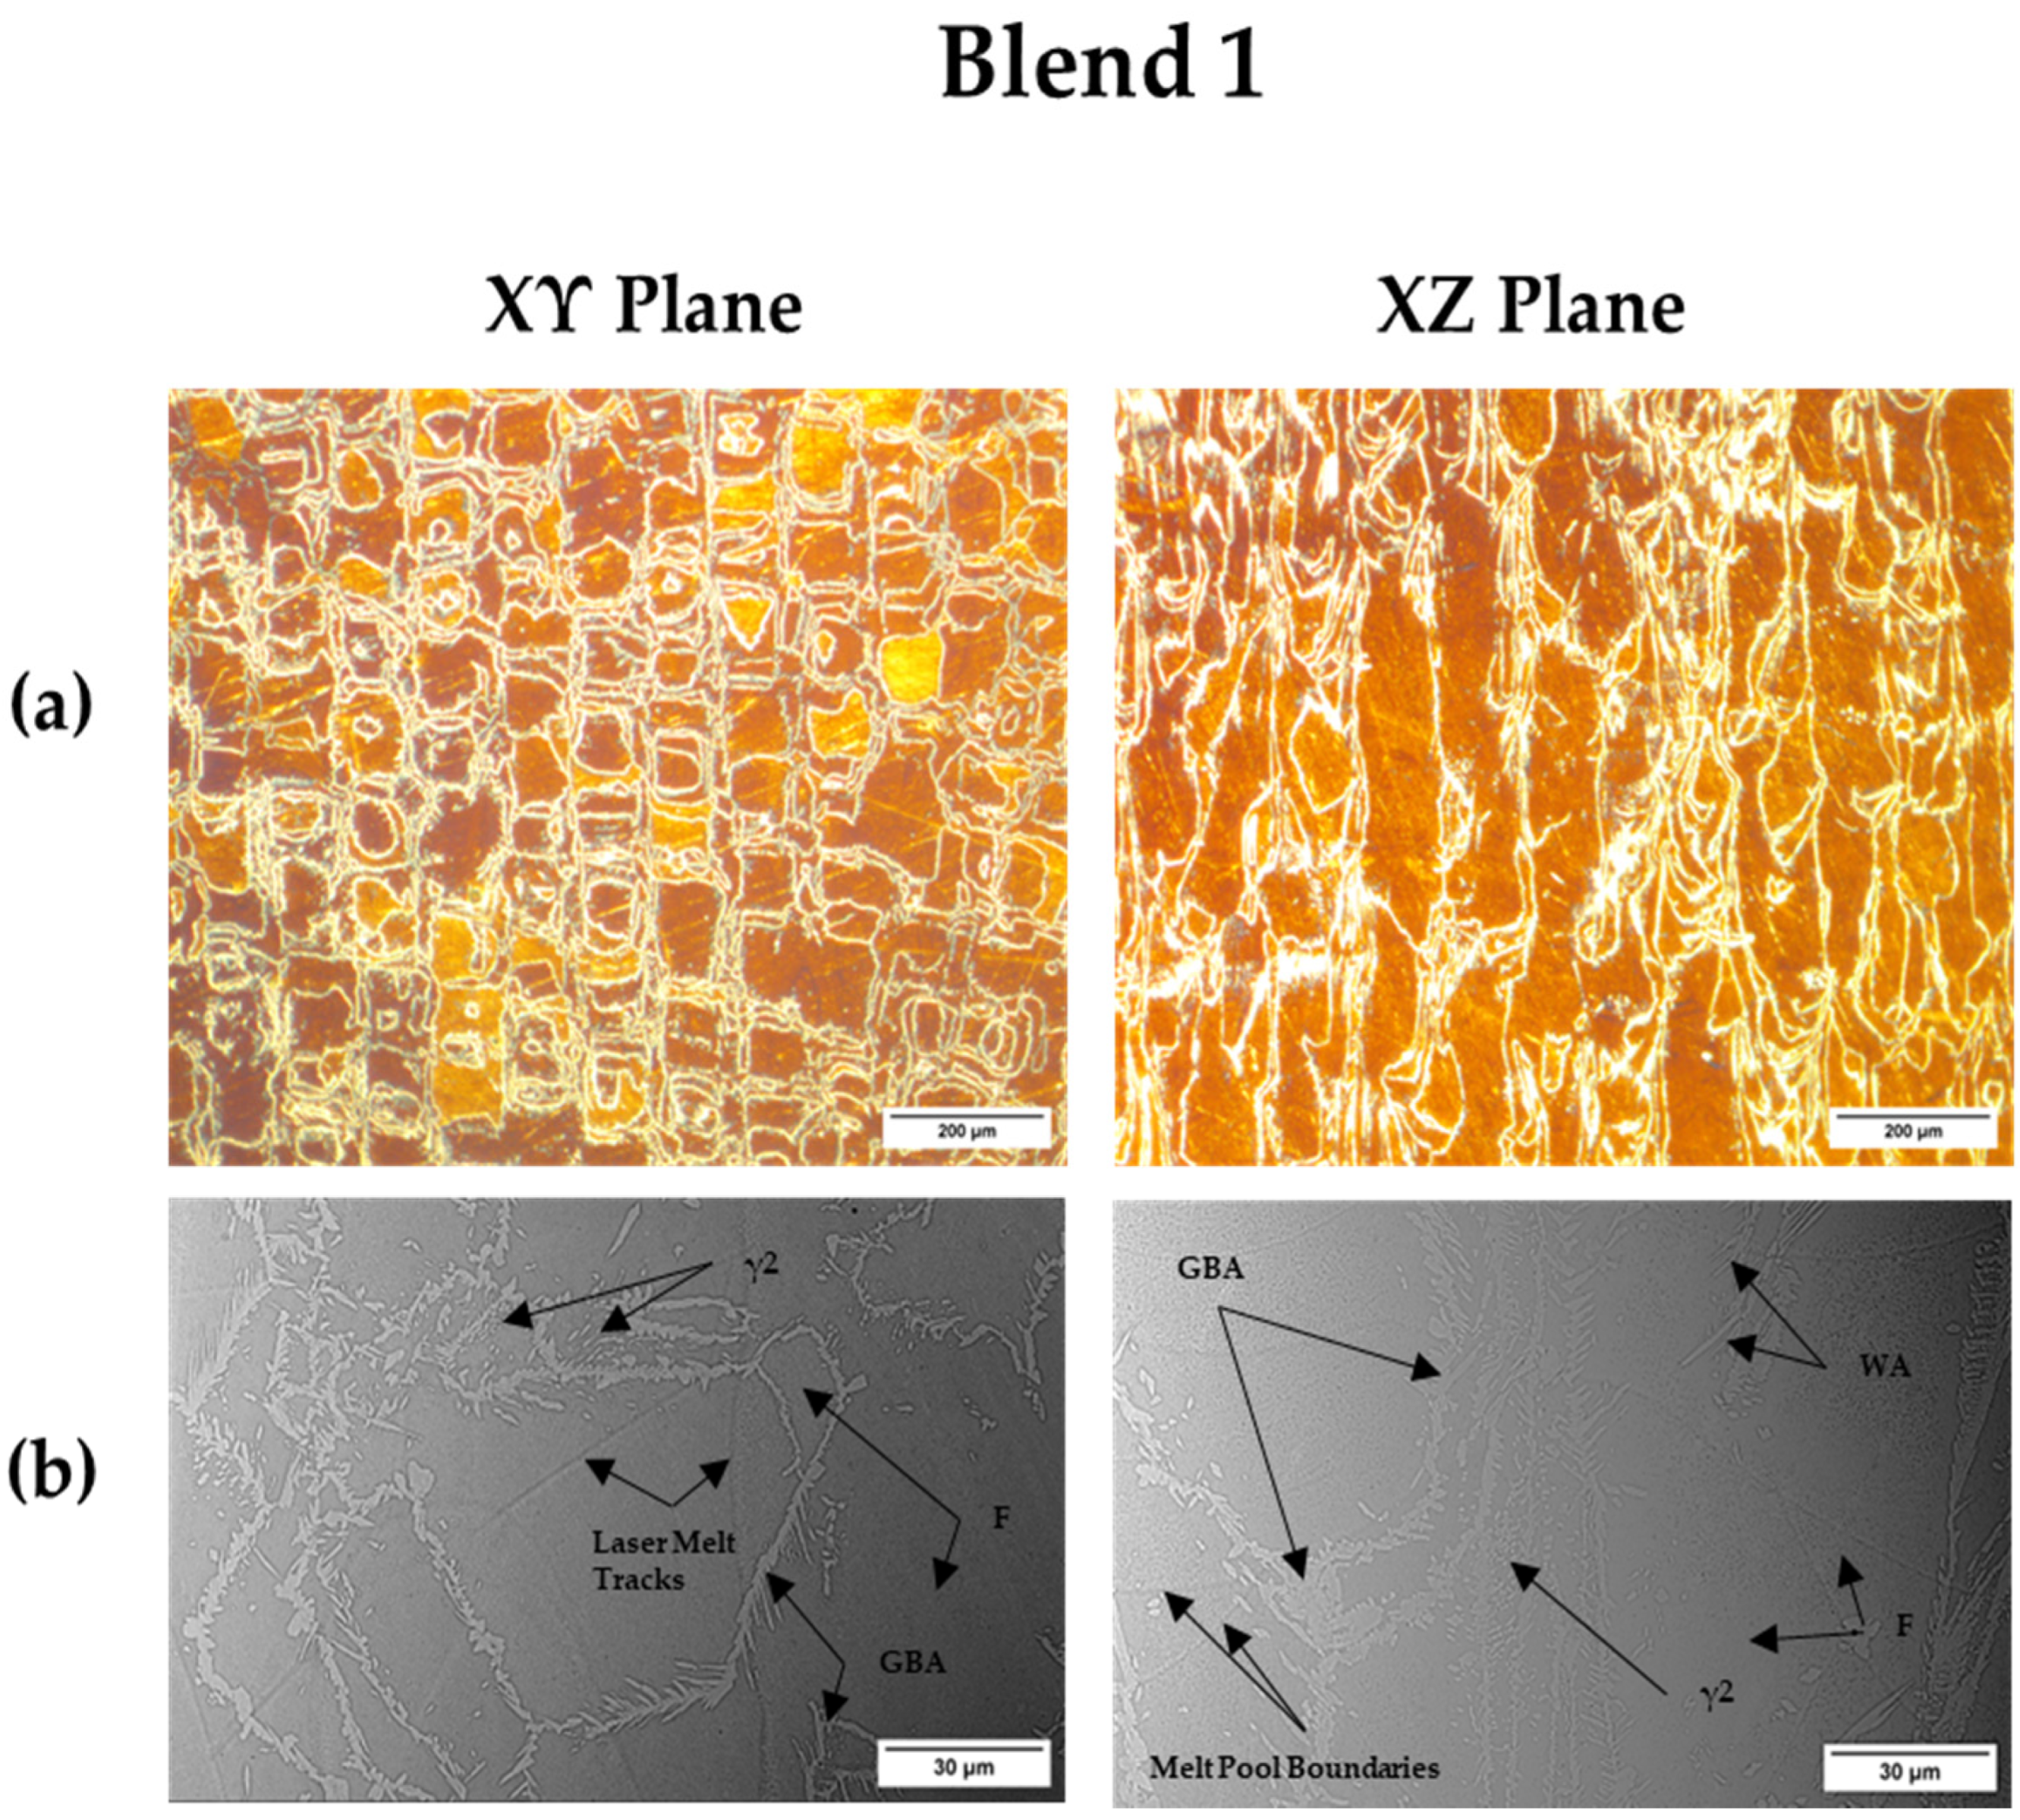
Both blends showed the same austenite morphologies (GBA, WA and γ2). Blend 2 exhibited a thinner GBA and reduced nucleation sites of γ2 and WA in comparison to Blend 1. The reduced nucleation sites of WA in Blend 2 are attributed to lower nickel content [64]. Moreover, the thinner GBA of Blend 2 compared to Blend 1 could be associated with the lower amount of SS316L powder particles in the blend. The SS316L alloy has lower thermal conductivity than DSS/SDSS [65,66]. The overall thermal conductivity of Blend 2 will be higher compared to Blend 1. The lower thermal conductivity reduces the cooling rate of the microstructure and increases the transformation time of ferrite to austenite [67]. Fewer powder particles of SS316L that exhibit higher thermal conductivity and lower nickel content will result in reduced volume fractions of GBA, γ2 and WA in the Blend 2 microstructure. Secondary γ2 austenite was formed at lower temperatures while WA and GBA were formed at higher temperatures [68].
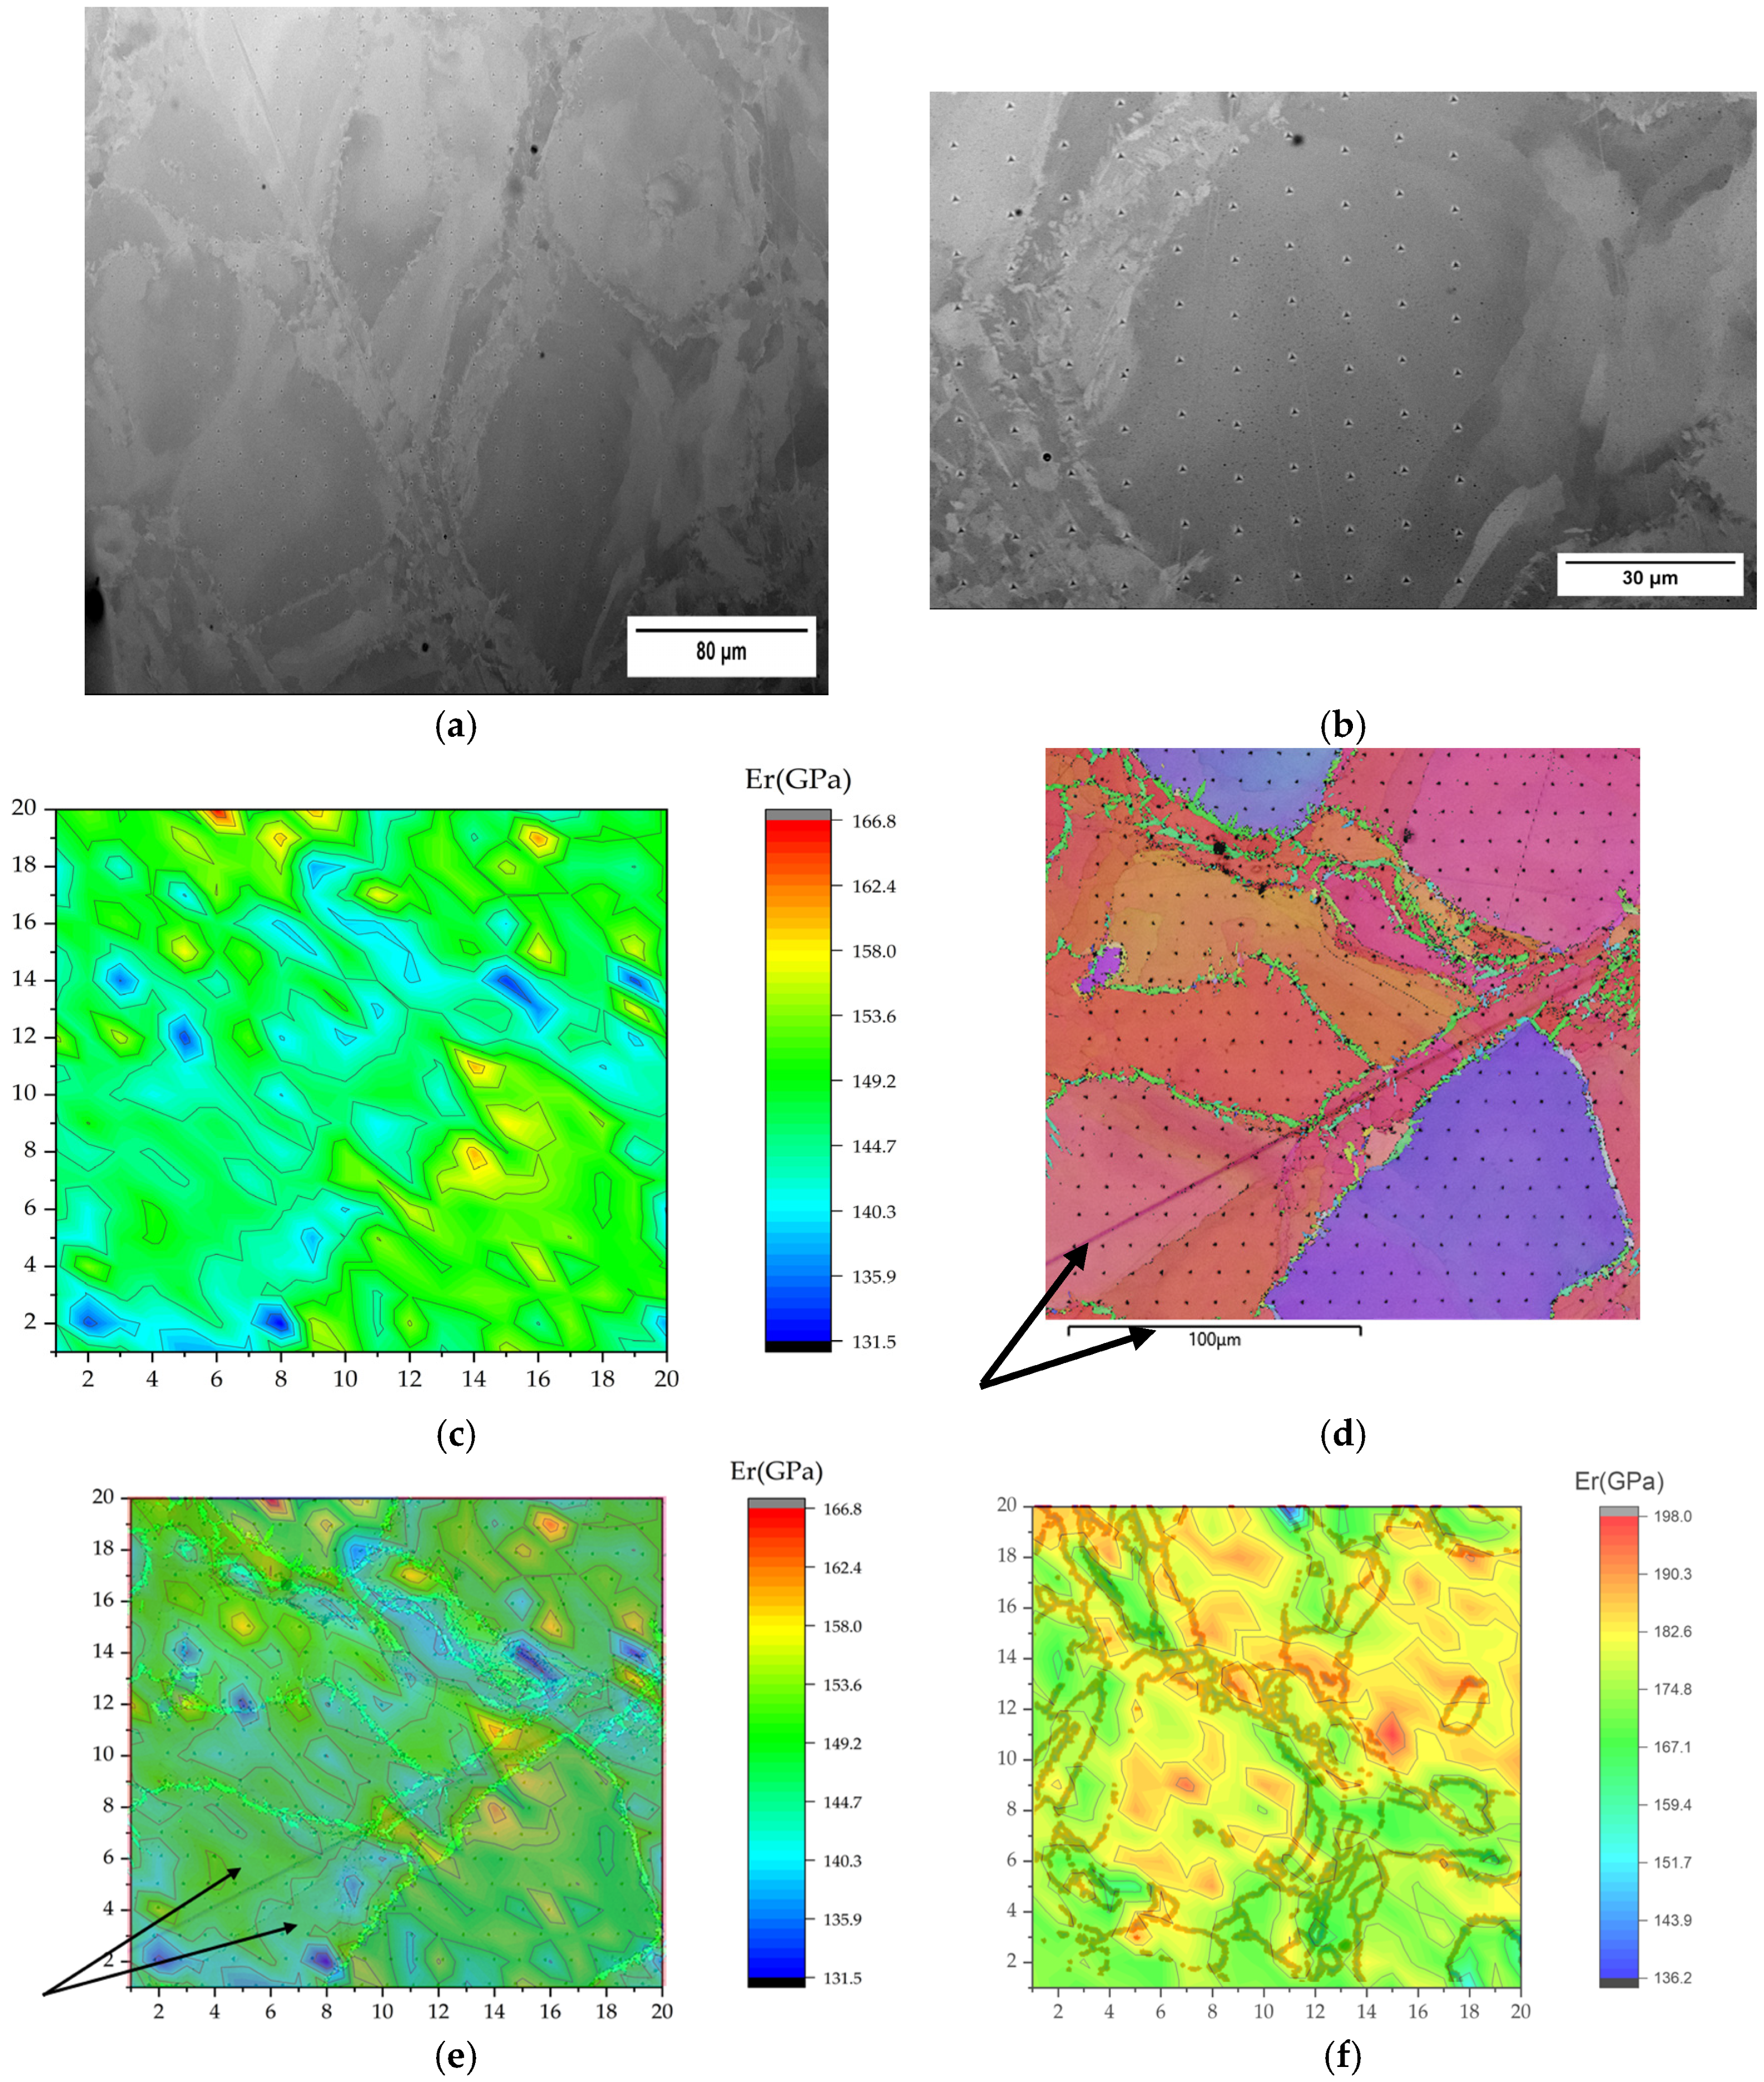
Austenite is reported to exhibit a higher H/E ratio than ferrite [30]; one has also to consider that indentations formed also on the phase boundaries, and whose plastic zones included both phases, yielding a composite-like (containing α/γ interphase boundaries) response. Ferrite is reported to exhibit a higher E (20 GPa) due to its BCC crystal structure, which has a lower interatomic distance (smaller lattice parameter) than the FCC crystal structure of austenite; the crystallographic texture induced by the deformation itself could also be recalled as a possible reason for explaining the above literature findings. Geometrically Necessary Dislocations (GND) are developed in the sample at the indenter probe/sample interface in order to accommodate local strain conditions, resulting in significant local hardening, while at shallow indentation displacements, the proportion of work-hardened material to the total effective volume of material being probed can be considerable [69]. The presence of grain boundaries starts to make a measurable contribution to the response as compared with its giant grain counterpart. It is important to note that, at these indentation depths (depending on the grain size), for laser-processed materials (especially SLM), the response is always a combination of grain size effects coupled with cell size effects, in addition to any interactions that may be present between the two. It is seen that, for hc below ~150 nm, the hardness responses are statistically indistinguishable, attributed possibly to the indentation size effect whereby GNDs generated to accommodate the contact strain at or near the probe interface give rise to significant work hardening, thus dominating the overall hardness response. At indentation contact depths greater than 150 nm, a clear divergence is observed beginning at about 500 nm, with the steady-state hardness value for the nominal grain base plate exceeding that of the giant grain by approximately 30%; these size effects are due to the indenter, characteristic sub-structural length and grain size. Both the elastic recovery energy and the plastic energy dissipation of the indenter onto the austenite phase are reported to be larger than those onto ferrite phase, whereas pile-up phenomena exist in both phases. The physical explanation for this is that, when the materials were work hardened during the indentation tests, the dislocation mobility was reduced, and the dislocations were confined to the surface, causing pile up. During the quasi-static single and cyclic indentation tests, the major deformation mechanisms are the nucleation, multiplication and propagation of dislocations in both the austenite phase and ferrite phase as well as dislocation activation; especially for the case of ferrite, additional propagation of slip bands occurs. After single indentation tests, heterogeneous dislocations are concentrated under the indenter; discrete dislocations in the ferrite phase are reported to bundle and form the slip bands with a relatively higher dislocation density [47]. In 
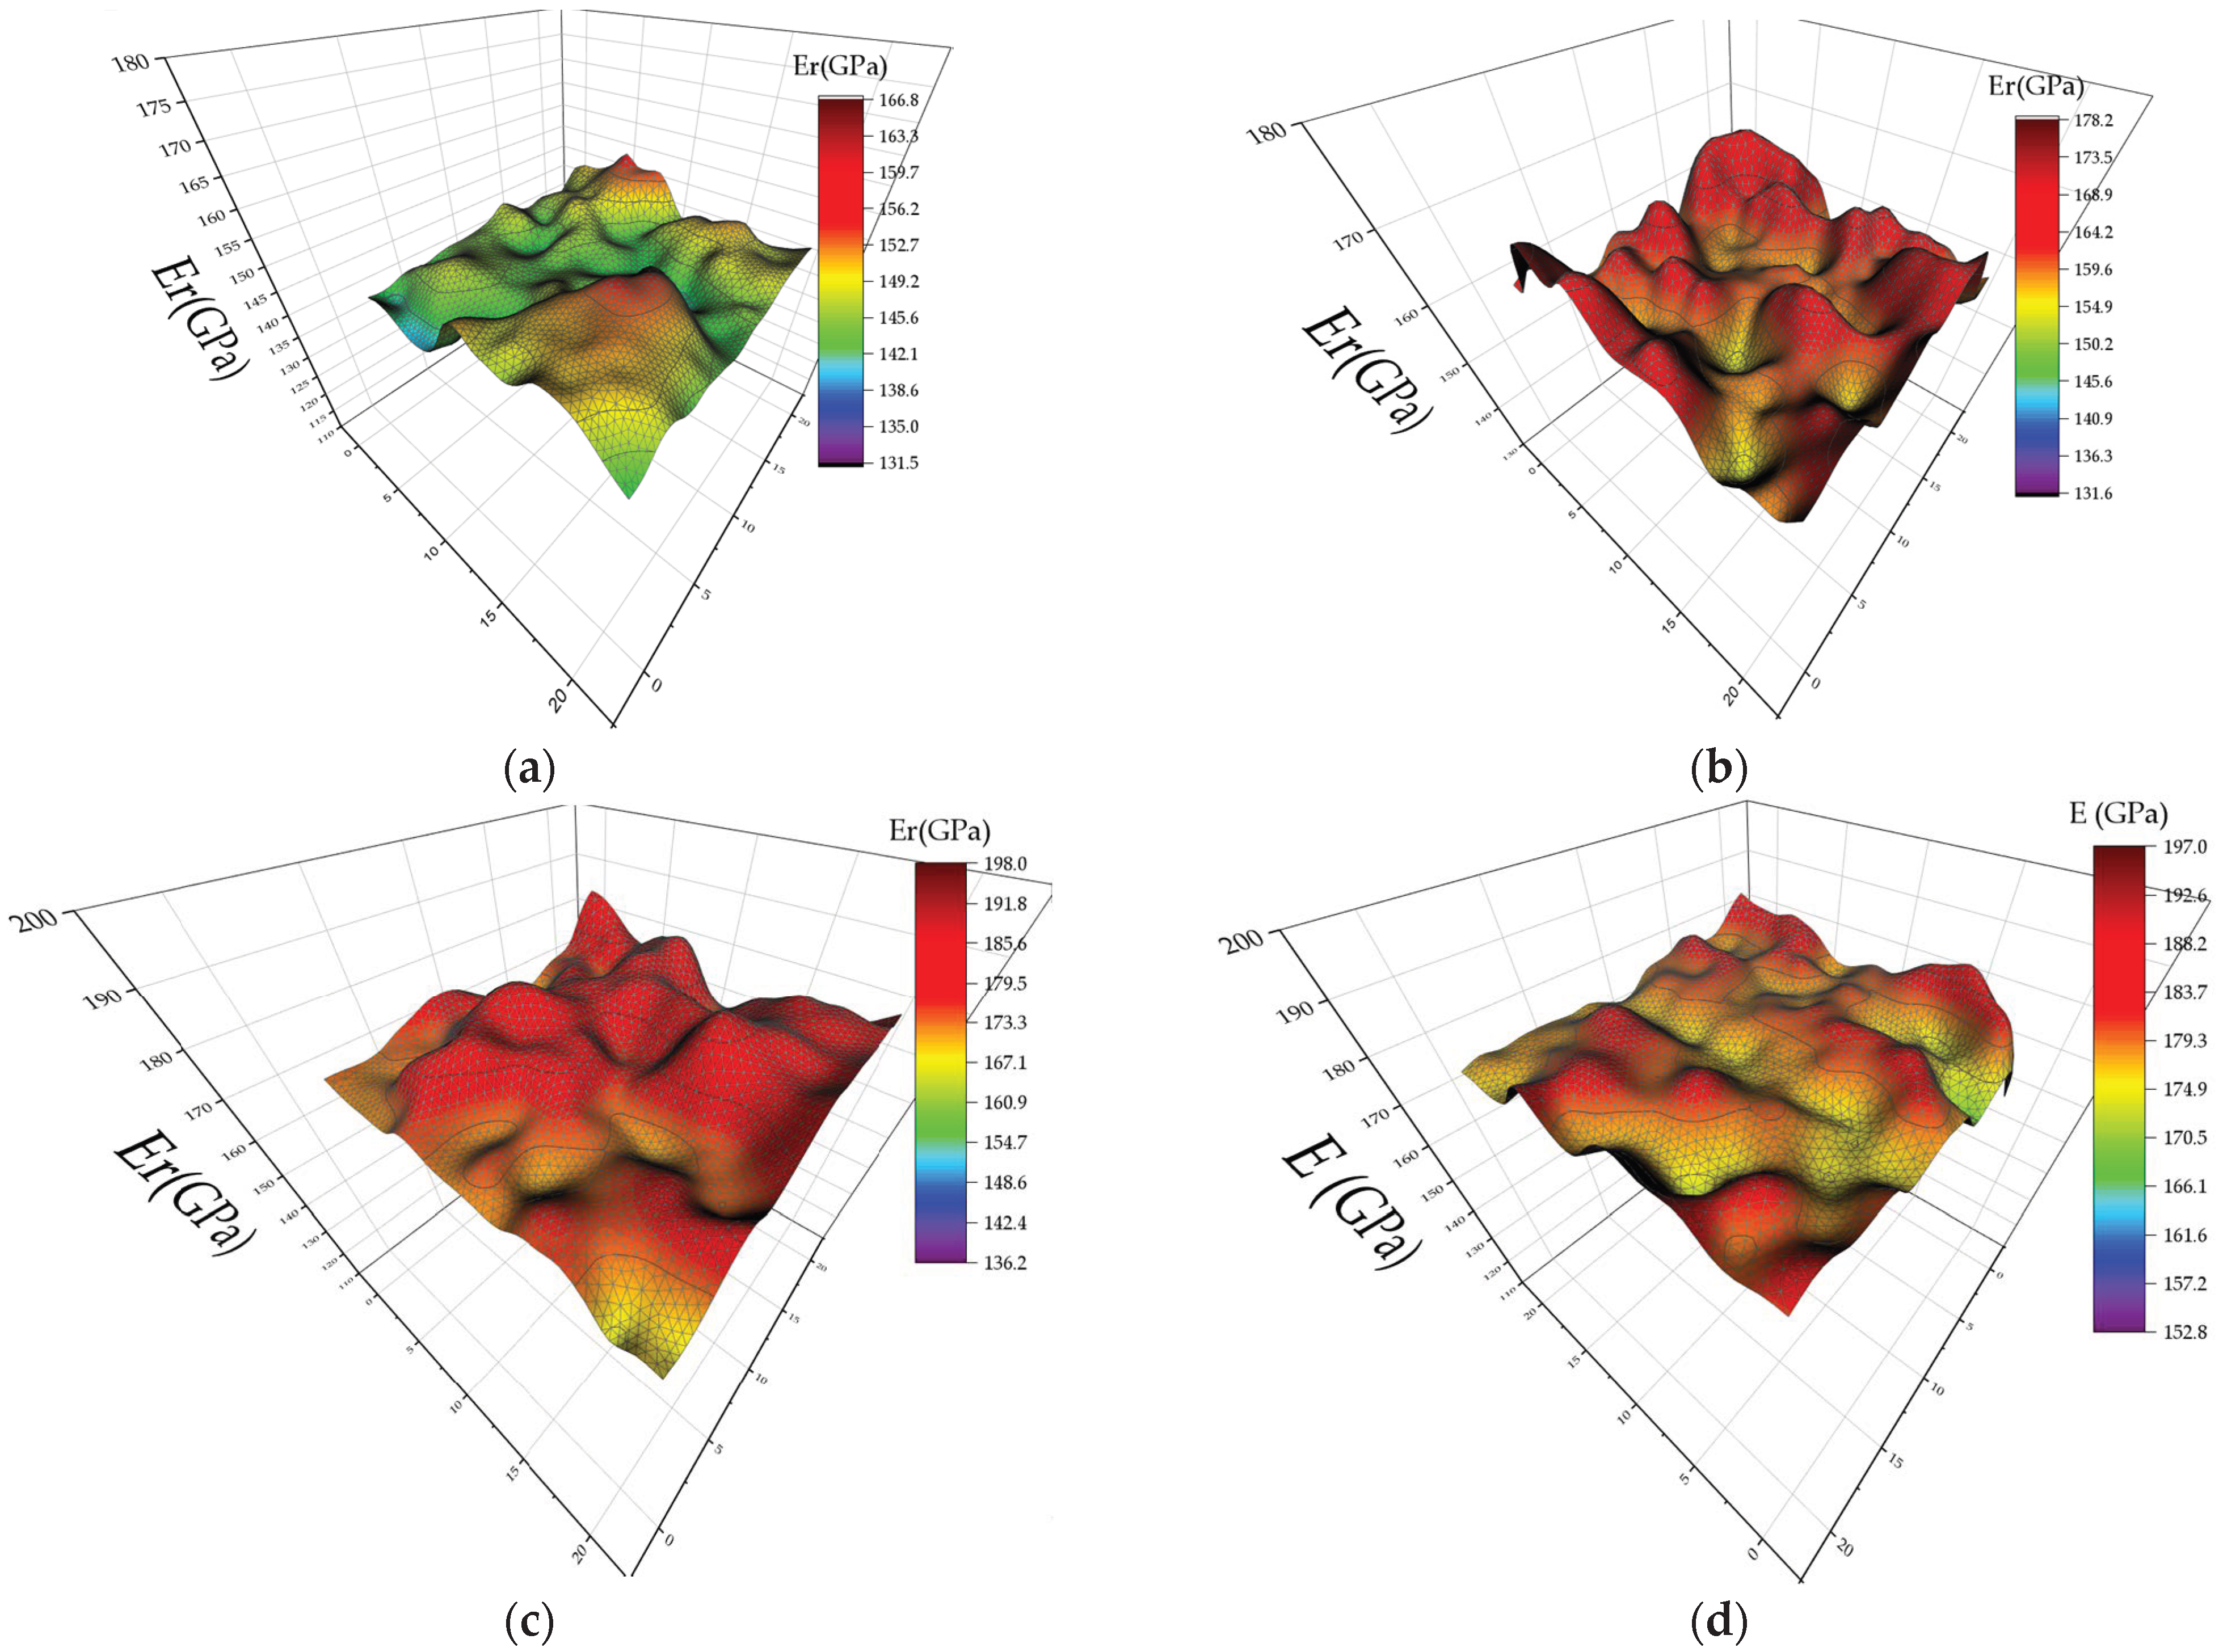
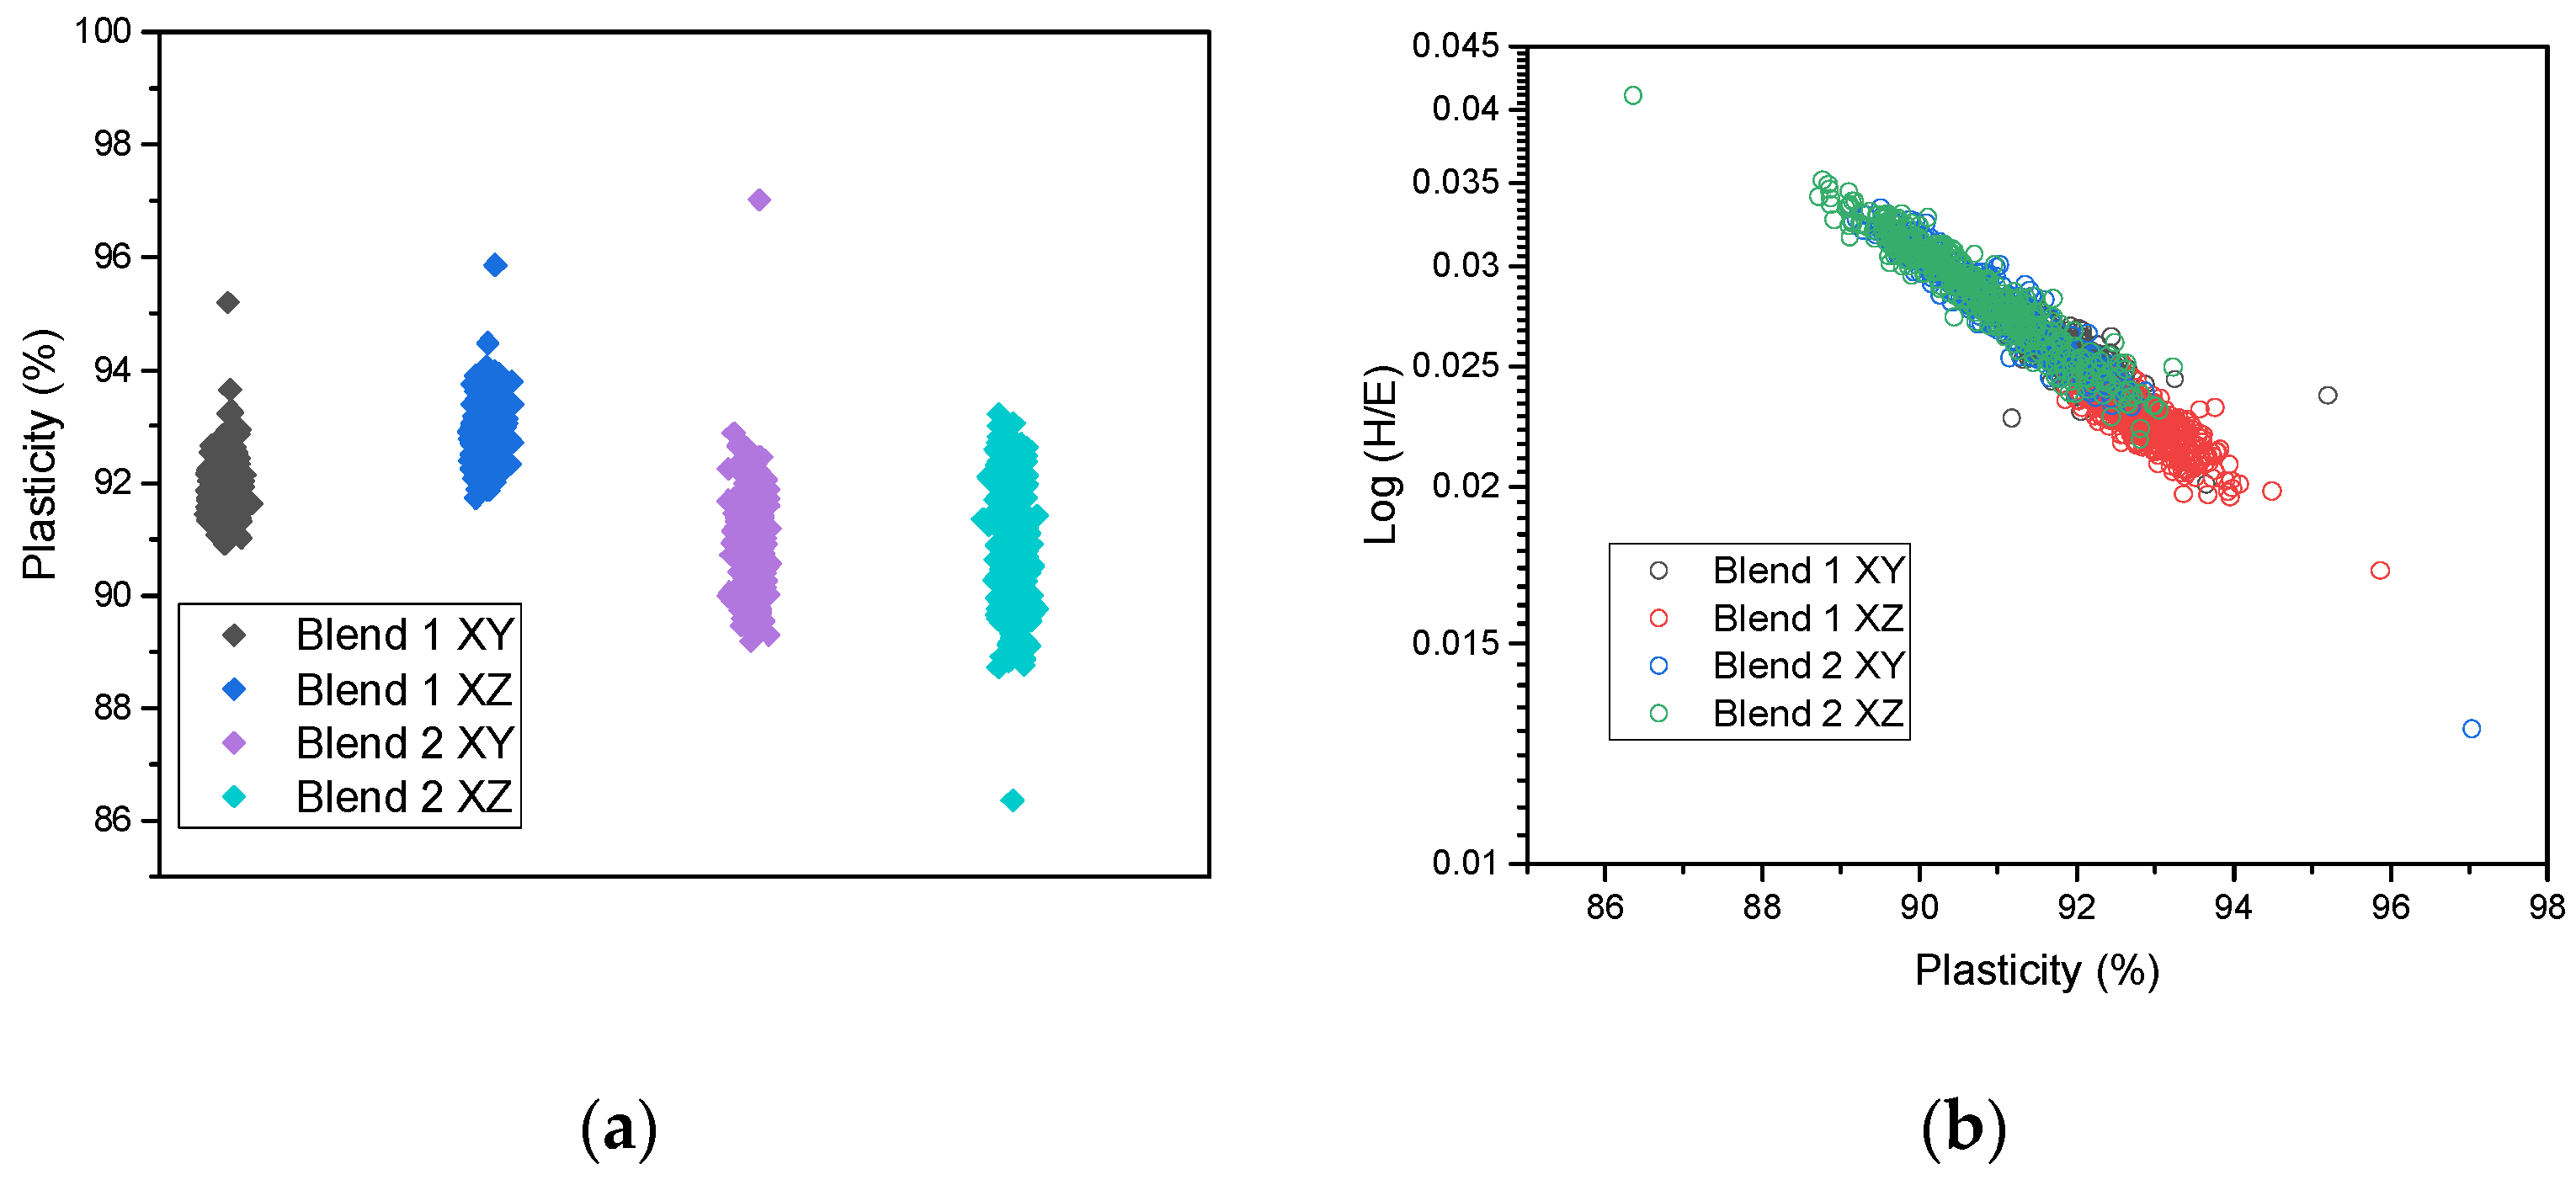
Figure 14, plasticity and the H/E ratio distribution of the grid mapping for Blend 1 and Blend 2 in the XY and XZ planes respectively, are presented. Higher stresses are expected at high hardness to modulus ratio (also referred to as the plasticity index), in brittle or hard materials (that exhibit sink-in), and high stress concentrations develop toward the indenter probe, whereas in the case of low H/E, i.e., ductile, or soft materials (pile-up), the stresses are lower and are distributed more evenly across the cross-section of the material. When the plasticity index H/E is much less than unity, the deformation is likely to be entirely elastic, when it is significantly greater than one, the deformation is predominantly plastic; in Figure 14b the linear trend is confirmed [70].

5. Conclusions

The duplex stainless-steel powder and the super duplex stainless-steel powder were mixed in different proportions with austenitic stainless steel to achieve the duplex microstructures in the as-built condition. The blends were processed via LPBF under different processing conditions by varying the volumetric energy density. The optimal process parameters for dense parts were determined using light optical microscopy and density measurements. Nearly full dense parts were successfully manufactured for both blends, although a significant difference was observed in the VED values. The phase transformation of the mixed alloys was significantly influenced by the chemical composition of the alloys and the solidification rate of the samples. A balanced (roughly 50/50) austenite/ferrite microstructure was not achieved with the powder ratios used in this research, nevertheless, an increase of austenite content was observed for both custom materials in as-built condition. The tuning of the process parameters and the post-processing heat treatments make it possible to control the final microstructure. In future work, the impact of inert gas (nitrogen vs. argon) and an increase in the amount of SS316L in the blends on the formation of austenite in the process will be investigated. In addition, the use of different scan strategies that will allow us to preheat or remelt a specific layer, enabling slower cooling and more time for the promotion of austenite during the LPBF process, is an area that presents great interest.
Moreover, an investigation was conducted to correlate the microstructure with the nano-mechanical properties. Nanoindentation hardness and modulus were used to gain a deeper understanding in the deformation behavior of individual phases that cannot be studied directly by macroscopic tensile tests. Through nanoindentation, within the modulus maps, reoccurring patterns were identified and correlated with SEM images of the grid (nanoindented samples were subjected to SEM analysis after the measurements). Additionally, through super-positioning of the modulus onto the EBSD map, variations of values inside the intergranular region (set by austenite, in green), which directly correspond to separate grains, are revealed, validated by color variation in the EBSD. Plasticity was assessed; Blend 1 exhibits a more ductile plastic behavior (low H/E-pile-up dominant), while onset of plasticity varied, confirming the relevant work of literature.
The current research study, focused on the development of duplex and super duplex stainless-steel powder blends, can be used as a workflow for rapid alloy development and screening in the context of LPBF towards the development of a comprehensive ‘powder toolkit’ and material testing matrix. The methodology can be used for the precise modification of feedstock chemistry and component characteristics, creating a design and manufacturing paradigm to engineer materials minimizing lead times, costs and powder production uncertainties, while ensuring a deep understanding of material properties and securing the identification of the best material–application pair prior to atomization or powder blending experiments.

Author Contributions

Conceptualization, L.G. and E.K.K.; methodology, L.G. and E.K.K.; formal analysis, L.G. and L.K.; data curation, S.D. and J.S.G.; writing—original draft preparation, L.G.; writing—review and editing, L.G., L.K., S.D., E.P.K. and E.K.K.; supervision, E.K.K.; project administration, E.K.K.; funding acquisition, E.K.K. All authors have read and agreed to the published version of the manuscript.

Funding

This research was funded by the European Union under the HORIZON2020 Framework Programme Grant Agreement no. 952869. https://www.nanomecommons.net/ (accessed on 26 August 2023).

Data Availability Statement

Not applicable.

Conflicts of Interest

The authors declare no conflict of interest. The funders had no role in the design of the study; in the collection, analysis or interpretation of data; in the writing of the manuscript; or in the decision to publish the results.

References

  1. Herzog, D.; Seyda, V.; Wycisk, E.; Emmelmann, C. Additive manufacturing of metals. Acta Mater. 2016, 117, 371–392. [Google Scholar] [CrossRef]
  2. Gu, D.D.; Meiners, W.; Wissenbach, K.; Poprawe, R. Laser additive manufacturing of metallic components: Materials, processes and mechanisms. Int. Mater. Rev. 2013, 57, 133–164. [Google Scholar] [CrossRef]
  3. Gibson, I.; Rosen, D.; Stucker, B. Additive Manufacturing Technologies; Springer: Berlin/Heidelberg, Germany, 2015. [Google Scholar]
  4. Murr, L.E.; Gaytan, S.M.; Ramirez, D.A.; Martinez, E.; Hernandez, J.; Amato, K.N.; Shindo, P.W.; Medina, F.R.; Wicker, R.B. Metal Fabrication by Additive Manufacturing Using Laser and Electron Beam Melting Technologies. J. Mater. Sci. Technol. 2012, 28, 1–14. [Google Scholar] [CrossRef]
  5. Vrancken, B.; Thijs, L.; Kruth, J.-P.; Van Humbeeck, J. Heat treatment of Ti6Al4V produced by Selective Laser Melting: Microstructure and mechanical properties. J. Alloys Compd. 2012, 541, 177–185. [Google Scholar] [CrossRef]
  6. Mulay, R.P.; Moore, J.A.; Florando, J.N.; Barton, N.R.; Kumar, M. Microstructure and mechanical properties of Ti–6Al–4V: Mill-annealed versus direct metal laser melted alloys. Mater. Sci. Eng. A 2016, 666, 43–47. [Google Scholar] [CrossRef]
  7. Ly, S.; Rubenchik, A.M.; Khairallah, S.A.; Guss, G.; Matthews, M.J. Metal vapor micro-jet controls material redistribution in laser powder bed fusion additive manufacturing. Sci. Rep. 2017, 7, 4085. [Google Scholar] [CrossRef] [PubMed]
  8. Voisin, T.; Calta, N.P.; Khairallah, S.A.; Forien, J.-B.; Balogh, L.; Cunningham, R.W.; Rollett, A.D.; Wang, Y.M. Defects-dictated tensile properties of selective laser melted Ti-6Al-4V. Mater. Des. 2018, 158, 113–126. [Google Scholar] [CrossRef]
  9. Xiang, H.; Chen, G.; Zhao, W.; Wu, C. Densification Behavior and Build Quality of Duplex Stainless Steel Fabricated by Laser Powder Bed Fusion. Metals 2023, 13, 741. [Google Scholar] [CrossRef]
  10. Richter, J.; Bartzsch, G.; Scherbring, S.; Bolender, A.; Vollmer, M.; Mola, J.; Volkova, O.; Niendorf, T. Metastable CrMnNi steels processed by laser powder bed fusion: Experimental assessment of elementary mechanisms contributing to microstructure, properties and residual stress. Sci. Rep. 2022, 12, 21862. [Google Scholar] [CrossRef]
  11. Pettersson, N.; Pettersson, R.F.A.; Wessman, S. Precipitation of Chromium Nitrides in the Super Duplex Stainless Steel 2507. Metall. Mater. Trans. A 2015, 46, 1062–1072. [Google Scholar] [CrossRef]
  12. Saeidi, K.; Kevetkova, L.; Lofaj, F.; Shen, Z. Novel ferritic stainless steel formed by laser melting from duplex stainless steel powder with advanced mechanical properties and high ductility. Mater. Sci. Eng. A 2016, 665, 59–65. [Google Scholar] [CrossRef]
  13. Johansson, J.; Odén, M.; Zeng, X.H. Evolution of the residual stress state in a duplex stainless steel during loading. Acta Mater. 1999, 47, 2669–2684. [Google Scholar] [CrossRef]
  14. Pan, M.; Zhang, X.; Chen, P.; Su, X.; Misra, R.D.K. The effect of chemical composition and annealing condition on the microstructure and tensile properties of a resource-saving duplex stainless steel. Mater. Sci. Eng. A 2020, 788, 139540. [Google Scholar] [CrossRef]
  15. Freitas, G.C.L.D.; Fonseca, G.S.d.; Moreira, L.P.; Leite, D.N.F. Phase transformations of the duplex stainless steel UNS S31803 under non-isothermal conditions. J. Mater. Res. Technol. 2021, 11, 1847–1851. [Google Scholar] [CrossRef]
  16. Kunz, J.; Boontanom, A.; Herzog, S.; Suwanpinij, P.; Kaletsch, A.; Broeckmann, C. Influence of hot isostatic pressing post-treatment on the microstructure and mechanical behavior of standard and super duplex stainless steel produced by laser powder bed fusion. Mater. Sci. Eng. A 2020, 794, 139806. [Google Scholar] [CrossRef]
  17. Glerum, J.A.; Hocine, S.; Chang, C.S.T.; Kenel, C.; Van Petegem, S.; Casati, N.; Sanchez, D.F.; Van Swygenhoven, H.; Dunand, D.C. Operando X-ray diffraction study of thermal and phase evolution during laser powder bed fusion of Al-Sc-Zr elemental powder blends. Addit. Manuf. 2022, 55, 102806. [Google Scholar] [CrossRef]
  18. Li, H.; Brodie, E.G.; Hutchinson, C. Predicting the chemical homogeneity in laser powder bed fusion (LPBF) of mixed powders after remelting. Addit. Manuf. 2023, 65, 103447. [Google Scholar] [CrossRef]
  19. Ewald, S.; Kies, F.; Hermsen, S.; Voshage, M.; Haase, C.; Schleifenbaum, J.H. Rapid Alloy Development of Extremely High-Alloyed Metals Using Powder Blends in Laser Powder Bed Fusion. Materials 2019, 12, 1706. [Google Scholar] [CrossRef]
  20. Spierings, A.B.; Ozherelkov, D.Y.; Kneubühler, F.; Eremin, S.A.; Pelevin, I.A.; Nalivaiko, A.Y.; Petrov, E.A.; Gromov, A.A.; Wegener, K. Laser powder bed fusion of AlSi10Mg-based composites with graphene and nanodiamond additions. J. Alloys Compd. 2023, 947, 169421. [Google Scholar] [CrossRef]
  21. Aversa, A.; Marchese, G.; Saboori, A.; Bassini, E.; Manfredi, D.; Biamino, S.; Ugues, D.; Fino, P.; Lombardi, M. New Aluminum Alloys Specifically Designed for Laser Powder Bed Fusion: A Review. Materials 2019, 12, 1007. [Google Scholar] [CrossRef] [PubMed]
  22. Montero-Sistiaga, M.L.; Mertens, R.; Vrancken, B.; Wang, X.; Van Hooreweder, B.; Kruth, J.-P.; Van Humbeeck, J. Changing the alloy composition of Al7075 for better processability by selective laser melting. J. Mater. Process. Technol. 2016, 238, 437–445. [Google Scholar] [CrossRef]
  23. Aversa, A.; Marchese, G.; Manfredi, D.; Lorusso, M.; Calignano, F.; Biamino, S.; Lombardi, M.; Fino, P.; Pavese, M. Laser Powder Bed Fusion of a High Strength Al-Si-Zn-Mg-Cu Alloy. Metals 2018, 8, 300. [Google Scholar] [CrossRef]
  24. Martin, J.H.; Yahata, B.D.; Hundley, J.M.; Mayer, J.A.; Schaedler, T.A.; Pollock, T.M. 3D printing of high-strength aluminium alloys. Nature 2017, 549, 365–369. [Google Scholar] [CrossRef]
  25. Zhang, H.; Zhu, H.; Nie, X.; Yin, J.; Hu, Z.; Zeng, X. Effect of Zirconium addition on crack, microstructure and mechanical behavior of selective laser melted Al-Cu-Mg alloy. Scr. Mater. 2017, 134, 6–10. [Google Scholar] [CrossRef]
  26. Nie, X.; Zhang, H.; Zhu, H.; Hu, Z.; Ke, L.; Zeng, X. Analysis of processing parameters and characteristics of selective laser melted high strength Al-Cu-Mg alloys: From single tracks to cubic samples. J. Mater. Process. Technol. 2018, 256, 69–77. [Google Scholar] [CrossRef]
  27. Wang, P.; Gammer, C.; Brenne, F.; Prashanth, K.G.; Mendes, R.G.; Rümmeli, M.H.; Gemming, T.; Eckert, J.; Scudino, S. Microstructure and mechanical properties of a heat-treatable Al-3.5Cu-1.5Mg-1Si alloy produced by selective laser melting. Mater. Sci. Eng. A 2018, 711, 562–570. [Google Scholar] [CrossRef]
  28. Köhler, M.L.; Kunz, J.; Herzog, S.; Kaletsch, A.; Broeckmann, C. Microstructure analysis of novel LPBF-processed duplex stainless steels correlated to their mechanical and corrosion properties. J. Mater. Sci. Eng. A 2021, 801, 140432. [Google Scholar] [CrossRef]
  29. Cui, C.; Becker, L.; Gärtner, E.; Boes, J.; Lentz, J.; Uhlenwinkel, V.; Steinbacher, M.; Weber, S.; Fechte-Heinen, R. Laser Additive Manufacturing of Duplex Stainless Steel via Powder Mixture. J. Manuf. Mater. Process. 2022, 6, 72. [Google Scholar] [CrossRef]
  30. Besharatloo, H.; Carpio, M.; Cabrera, J.-M.; Mateo, A.M.; Fargas, G.; Wheeler, J.M.; Roa, J.J.; Llanes, L. Novel Mechanical Characterization of Austenite and Ferrite Phases within Duplex Stainless Steel. Metals 2020, 10, 1352. [Google Scholar] [CrossRef]
  31. Gadelrab, K.; Li, G.; Chiesa, M.; Souier, T. Local characterization of austenite and ferrite phases in duplex stainless steel using MFM and nanoindentation. J. Mater. Res. 2012, 27, 1573–1579. [Google Scholar] [CrossRef]
  32. Schwarm, S.C.; Kolli, R.P.; Aydogan, E.; Mburu, S.; Ankem, S. Characterization of phase properties and deformation in ferritic-austenitic duplex stainless steels by nanoindentation and finite element method. J. Mater. Sci. Eng. A 2017, 680, 359–367. [Google Scholar] [CrossRef]
  33. Llorca-Isern, N.; López-Luque, H.; López-Jiménez, I.; Biezma, M.V. Identification of sigma and chi phases in duplex stainless steels. Mater. Charact. 2016, 112, 20–29. [Google Scholar] [CrossRef]
  34. Hsieh, C.-C.; Wu, W. Overview of Intermetallic Sigma (σ) Phase Precipitation in Stainless Steels. ISRN Metall. 2012, 2012, 732471. [Google Scholar] [CrossRef]
  35. Knyazeva, M.; Pohl, M. Duplex Steels. Part II: Carbides and Nitrides. Metallogr. Microstruct. Anal. 2013, 2, 343–351. [Google Scholar] [CrossRef]
  36. A Hosseini, V.; Hurtig, K.; Eyzop, D.; Östberg, A.; Janiak, P.; Karlsson, L. Ferrite content measurement in super duplex stainless steel welds. Weld. World 2018, 63, 551–563. [Google Scholar] [CrossRef]
  37. Oliver, W.C.; Pharr, G.M. An improved technique for determining hardness and elastic modulus using load and displacement sensing indentation experiments. J. Mater. Res. 2011, 7, 1564–1583. [Google Scholar] [CrossRef]
  38. Tao, P.; Gong, J.-M.; Wang, Y.-F.; Jiang, Y.; Li, Y.; Cen, W.-W. Characterization on stress-strain behavior of ferrite and austenite in a 2205 duplex stainless steel based on nanoindentation and finite element method. Results Phys. 2018, 11, 377–384. [Google Scholar] [CrossRef]
  39. Ferro, P.; Meneghello, R.; Savio, G.; Berto, F. A modified volumetric energy density–based approach for porosity assessment in additive manufacturing process design. Int. J. Adv. Manuf. Technol. 2020, 110, 1911–1921. [Google Scholar] [CrossRef]
  40. Ghayoor, M.; Lee, K.; He, Y.; Chang, C.-H.; Paul, B.K.; Pasebani, S. Selective laser melting of 304L stainless steel: Role of volumetric energy density on the microstructure, texture and mechanical properties. Addit. Manuf. 2020, 32, 101011. [Google Scholar] [CrossRef]
  41. Haghdadi, N.; Ledermueller, C.; Chen, H.; Chen, Z.; Liu, Q.; Li, X.; Rohrer, G.; Liao, X.; Ringer, S.; Primig, S. Evolution of microstructure and mechanical properties in 2205 duplex stainless steels during additive manufacturing and heat treatment. Mater. Sci. Eng. A 2022, 835, 142695. [Google Scholar] [CrossRef]
  42. Akram, J.; Chalavadi, P.; Pal, D.; Stucker, B. Understanding grain evolution in additive manufacturing through modeling. Addit. Manuf. 2018, 21, 255–268. [Google Scholar] [CrossRef]
  43. Zhang, S.; Wang, Q.; Yang, R.; Dong, C. Composition equivalents of stainless steels understood via gamma stabilizing efficiency. Sci. Rep. 2021, 11, 5423. [Google Scholar] [CrossRef] [PubMed]
  44. Stegall, D.E.; Mamun, M.A.; Crawford, B.; Elmustafa, A. Indentation size effect in FCC metals: An examination of experimental techniques and the bilinear behavior. J. Mater. Res. 2012, 27, 1543–1552. [Google Scholar] [CrossRef]
  45. Wang, X.F.; Yang, X.P.; Guo, Z.D.; Zhou, Y.C.; Song, H.W. Nanoindentation Characterization of Mechanical Properties of Ferrite and Austenite in Duplex Stainless Steel. Adv. Mater. Res. 2007, 26–28, 1165–1170. [Google Scholar] [CrossRef]
  46. Cui, Y.-Y.; Jia, Y.-F.; Xuan, F.-Z. Micro-deformation evolutions of the constituent phases in duplex stainless steel during cyclic nanoindentation. Sci. Rep. 2018, 8, 6199. [Google Scholar] [CrossRef]
  47. Hengsbach, F.; Koppa, P.; Duschik, K.; Holzweissig, M.J.; Burns, M.; Nellesen, J.; Tillmann, W.; Tröster, T.; Hoyer, K.-P.; Schaper, M. Duplex stainless steel fabricated by selective laser melting—Microstructural and mechanical properties. Mater. Des. 2017, 133, 136–142. [Google Scholar] [CrossRef]
  48. Nigon, G.N.; Burkan Isgor, O.; Pasebani, S. The effect of annealing on the selective laser melting of 2205 duplex stainless steel: Microstructure, grain orientation, and manufacturing challenges. Opt. Laser Technol. 2021, 134, 106643. [Google Scholar] [CrossRef]
  49. Freitas, B.J.M.; Rodrigues, L.C.M.; Claros, C.A.E.; Botta, W.J.; Koga, G.Y.; Bolfarini, C. Ferritic-induced high-alloyed stainless steel produced by laser powder bed fusion (L-PBF) of 2205 duplex stainless steel: Role of microstructure, corrosion, and wear resistance. J. Alloys Compd. 2022, 918, 165576. [Google Scholar] [CrossRef]
  50. Hung, T.-S.; Chen, T.-C.; Chen, H.-Y.; Tsay, L.-W. The effects of Cr and Ni equivalents on the microstructure and corrosion resistance of austenitic stainless steels fabricated by laser powder bed fusion. J. Manuf. Process. 2023, 90, 69–79. [Google Scholar] [CrossRef]
  51. Becker, L.; Röttger, A.; Boes, J.; Weber, S.; Theisen, W. Processing of a newly developed nitrogen-alloyed ferritic-austenitic stainless steel by laser powder bed fusion—Microstructure and properties. Addit. Manuf. 2021, 46, 102185. [Google Scholar] [CrossRef]
  52. David, S.A.; Vitek, J.M.; Reed, R.W.; Hebble, T.L. Effect of rapid solidification on stainless steel weld metal microstructures and its implications on the Schaeffler diagram. Weld. J. 1987, 66, 289–300. [Google Scholar]
  53. Chmielewska, A.; Wysocki, B.; Buhagiar, J.; Michalski, B.; Adamczyk-Cieślak, B.; Gloc, M.; Święszkowski, W. In situ alloying of NiTi: Influence of laser powder bed fusion (LBPF) scanning strategy on chemical composition. Mater. Today Commun. 2022, 30, 103007. [Google Scholar] [CrossRef]
  54. Tan, C.; Zhou, K.; Kuang, M.; Ma, W.; Kuang, T. Microstructural characterization and properties of selective laser melted maraging steel with different build directions. Sci. Technol. Adv. Mater. 2018, 19, 746–758. [Google Scholar] [CrossRef]
  55. Lippold, J.C. Welding Metallurgy and Weldability; Wiley: Hoboken, NJ, USA, 2014. [Google Scholar]
  56. Wang, Y.M.; Voisin, T.; McKeown, J.T.; Ye, J.; Calta, N.P.; Li, Z.; Zeng, Z.; Zhang, Y.; Chen, W.; Roehling, T.T.; et al. Additively manufactured hierarchical stainless steels with high strength and ductility. Nat. Mater. 2018, 17, 63–71. [Google Scholar] [CrossRef] [PubMed]
  57. Saeidi, K.; Gao, X.; Zhong, Y.; Shen, Z.J. Hardened austenite steel with columnar sub-grain structure formed by laser melting. Mater. Sci. Eng. A 2015, 625, 221–229. [Google Scholar] [CrossRef]
  58. Sun, Z.; Tan, X.; Tor, S.B.; Yeong, W.Y. Selective laser melting of stainless steel 316L with low porosity and high build rates. Mater. Des. 2016, 104, 197–204. [Google Scholar] [CrossRef]
  59. Zhang, B.; Li, H.; Zhang, S.; Jiang, Z.; Lin, Y.; Feng, H.; Zhu, H. Effect of nitrogen on precipitation behavior of hyper duplex stainless steel S32707. Mater. Charact. 2021, 175, 111096. [Google Scholar] [CrossRef]
  60. Wang, H.; Wang, A.; Li, C.; Yu, X.; Xie, J.; Liu, C. Effect of Secondary-Phase Precipitation on Mechanical Properties and Corrosion Resistance of 00Cr27Ni7Mo5N Hyper-Duplex Stainless Steel during Solution Treatment. Materials 2022, 15, 7533. [Google Scholar] [CrossRef]
  61. Migiakis, K.; Papadimitriou, G.D. Effect of nitrogen and nickel on the microstructure and mechanical properties of plasma welded UNS S32760 super-duplex stainless steels. J. Mater. Sci. 2009, 44, 6372–6383. [Google Scholar] [CrossRef]
  62. Garfias-Mesias, L.F.; Sykes, J.M.; Tuck, C.D.S. The effect of phase compositions on the pitting corrosion of 25 Cr duplex stainless steel in chloride solutions. Corros. Sci. 1996, 38, 1319–1330. [Google Scholar] [CrossRef]
  63. Pilhagen, J.; Sandström, R. Influence of nickel on the toughness of lean duplex stainless steel welds. Mater. Sci. Eng. A 2014, 602, 49–57. [Google Scholar] [CrossRef]
  64. Cui, S.; Pang, S.; Pang, D.; Zhang, Q.; Zhang, Z. Numerical Simulation and Experimental Investigation on 2205 Duplex Stainless Steel K-TIG Welded Joint. Metals 2021, 11, 1323. [Google Scholar] [CrossRef]
  65. Koniorczyk, P.; Sienkiewicz, J.; Zmywaczyk, J.; Dębski, A.; Zieliński, M.; Preiskorn, M. Effect of Microstructure on Thermophysical Properties of Heat-Treated Duplex Steel. Materials 2021, 14, 6043. [Google Scholar] [CrossRef] [PubMed]
  66. Landowski, M.; Świerczyńska, A.; Rogalski, G.; Fydrych, D. Autogenous Fiber Laser Welding of 316L Austenitic and 2304 Lean Duplex Stainless Steels. Materials 2020, 13, 2930. [Google Scholar] [CrossRef]
  67. Khan, W.N.; Mahajan, S.; Chhibber, R. Investigations on reformed austenite in the microstructure of dissimilar super duplex/pipeline steel weld. Mater. Lett. 2021, 285, 129109. [Google Scholar] [CrossRef]
  68. Birnbaum, A.J.; Ryou, H.; Steuben, J.C.; Iliopoulos, A.P.; Wahl, K.J.; Michopoulos, J.G. Nested size effects in the nanoindentation response of additively manufactured 316L stainless steel. Mater. Lett. 2020, 280, 128570. [Google Scholar] [CrossRef]
  69. Koumoulos, E.P.; Dragatogiannis, D.A.; Charitidis, C.A. Nanomechanical Properties and Deformation Mechanism in Metals, Oxides and Alloys. In Nanomechanical Analysis of High Performance Materials; Tiwari, A., Ed.; Springer: Dordrecht, The Netherlands, 2014; pp. 123–152. [Google Scholar]
  70. Yan, C.; Bor, B.; Plunkett, A.; Domènech, B.; Schneider, G.A.; Giuntini, D. Nanoindentation of Supercrystalline Nanocomposites: Linear Relationship Between Elastic Modulus and Hardness. JOM 2022, 74, 2261–2276. [Google Scholar] [CrossRef]
Figure 1. Three-dimensional maps depicting selected laser power, scan speed and corresponding color-coded energy density utilized in the current study for (a) Blend 1 and (b) Blend 2.
Metals 13 01546 g001aMetals 13 01546 g001b
Figure 2. SEM micrographs of (a) Blend 1 and (b) Blend 2 powders.
Metals 13 01546 g002
Figure 3. Volumetric CE particle size distribution for Blend 1 and Blend 2.
Metals 13 01546 g003
Figure 4. Optical micrographs depicting the evolution of relative density and pore morphology of Blend 1 samples built with various process parameters resulting in increasing energy density.
Metals 13 01546 g004
Figure 5. Characteristic optical micrographs of Blend 1 and Blend 2 in the XY and XZ planes processed with the optimum parameter set for each blend and their resulting relative densities.
Metals 13 01546 g005
Figure 6. Blend 1 as-built microstructure. (a) LOM (Light Optical Microscope) and (b) SEM (Scanning Electron Microscope) micrographs transverse to the build direction (XY plane) and parallel to the build direction (XZ plane). F = Ferrite, γ2 = Secondary Austenite, GBA = Grain Boundary Austenite, WA = Widmanstätten Austenite.
Metals 13 01546 g006
Figure 7. EBSD analysis results for Blend 1.
Metals 13 01546 g007
Figure 8. Blend 2 as-built microstructure. (a) LOM (Light Optical Microscope) and (b) SEM (Scanning Electron Microscope) micrographs transverse to the build direction (XY plane) and parallel to the build direction (XZ plane). F = Ferrite, γ2 = Secondary Austenite, GBA = Grain Boundary Austenite, WA = Widmanstätten Austenite.
Metals 13 01546 g008
Figure 9. EBSD analysis results for Blend 2.
Metals 13 01546 g009
Figure 10. (a,b) SEM image of the grid (nanoindented) Blend 1 XY samples were subjected to SEM analysis after the measurements; (c) contour maps were generated in order to reproduce the surface topographical variation of local mechanical properties; (d) overlap of NI grid and IPFz map and (e) superpositioning of the modulus onto the EBSD map, where variations of values inside intergranular (set by austenite, in green) directly correspond to separate grains, validated by color variation in the EBSD (noted with black arrows); (f) superpositioning of the modulus onto the EBSD map for Blend 2 XY.
Metals 13 01546 g010
Figure 11. Three-dimensional map representation of E, denoting the difference in nanoindentation response due to phase properties underneath the indenter, for (a) Blend 1 XY, (b) Blend 1 XZ, (c) Blend 2 XY plane, (d) Blend 2 XZ plane.
Metals 13 01546 g011
Figure 12. Initial part of the loading curve for 3 different points of indentation; the occurrence or lack of pop-ins (or yield type pop-ins) are associated with phase properties underneath the indenter.
Metals 13 01546 g012
Figure 13. The ferrite/austenite contents of the LPBF samples estimated by a Schaeffler diagram.
Metals 13 01546 g013
Figure 14. (a) Plasticity and (b) H/E ratio distribution of the grid mapping for Blend 1 and Blend 2 in the XY and XZ planes.
Metals 13 01546 g014
Table 1. Chemical composition of the as-received powder alloys in weight %.
Duplex Stainless-Steel 2205
CSNCrFeMnMoNiPSiCu
0.0220.0050.1322.1Bal.1.033.25.20.010.51-
Super Duplex Stainless-Steel 2507
0.0130.0050.2924.7Bal.0.773.68.00.0110.450.01
Stainless-Steel 316L (SS316L)
0.0130.0100.04416.7Bal.1.292.1510.70.030.370.50
Table 2. Powder characteristics of the as-received powder alloys.
PowdersApparent Density (g/cm3)Tapped Density (g/cm3)Flowability (Hall, s/50 g)PSD (μm)
D10D50D90
22053.94.318.921.940.462.5
25074.04.418.423.439.459.1
316L4.65.015.417.834.056.0
Table 3. Nominal chemical composition of the selected blends under study.
Dry Blended Powder Mixtures
Blend 1Blend 2
Cr19.5523.16
Mo2.733.33
Ni8.858.90
C0.030.02
N0.120.25
Si0.630.51
Mn1.521.02
P0.020.01
S0.010.01
Cu0.250.11
Fe66.5562.79
Table 4. LPBF optimum process parameters set for Blend 1 and Blend 2.
Optimum LPBF Process Parameters
Blend 1Blend 2
Laser Power (W)247250
Scanning speed (mm/s)7561100
Hatching Distance (μm)100100
Layer Thickness (μm)4040
Scanning strategy67°/layer67°/layer
VED (J/mm3)77.1859.68
Table 5. Blends 1 and 2 powder characteristics.
Bulk Powder CharacteristicsBlend 1Blend 2
Apparent density (g/cm3)4.304.15
Tapped density (g/cm3)5.004.90
Flowability (s/50 g)14.316.4
Table 6. Powder characteristics obtained through static image analysis for both blends.
Particle Size MeasurementsBlend 1Blend 2
Min. Circle Equivalent Diameter (μm)0.50.5
Max. Circle Equivalent Diameter (μm)83.7111.2
Circle Equivalent Diameter Mean (μm)18.022.3
Circle Equivalent D10 (μm)15.122.5
Circle Equivalent D50 (μm)32.043.1
Circle Equivalent D90 (μm)55.575.9
Table 7. EDS analysis results for Blend 1.
Elements
Blend 1CrFeNiMo
Atomic %Weight %Atomic %Weight %Atomic %Weight %Atomic %Weight %
Ferrite22.120.365.164.39.610.03.25.4
Austenite22.220.465.364.79.610.02.94.9
Table 8. EDS analysis results for Blend 2.
Elements
Blend 2CrFeNiMo
Atomic %Weight %Atomic %Weight %Atomic %Weight %Atomic %Weight %
Ferrite25.323.261.260.49.710.03.86.4
Austenite24.322.563.362.89.810.22.64.5
SS316L Segregation19.718.267.667.310.911.41.83.1
Disclaimer/Publisher’s Note: The statements, opinions and data contained in all publications are solely those of the individual author(s) and contributor(s) and not of MDPI and/or the editor(s). MDPI and/or the editor(s) disclaim responsibility for any injury to people or property resulting from any ideas, methods, instructions or products referred to in the content.

