Communication

Investigation of Copper–Carbon Composite Microstructure and Properties

by
Elizaveta Bobrynina
1,2,*,
Tatiana Koltsova
1,2 and
Tatiana Larionova
1
1
Institute of Mechanical Manufacturing, Materials, and Transportation, Peter the Great St. Petersburg Polytechnic University, Saint Petersburg 195251, Russia
2
World-Class Research Center “Advanced Digital Technologies”, State Marine Technical University, Saint Petersburg 190121, Russia
*
Author to whom correspondence should be addressed.
Metals 2023, 13(6), 1052; https://doi.org/10.3390/met13061052
Submission received: 13 April 2023 / Revised: 19 May 2023 / Accepted: 26 May 2023 / Published: 31 May 2023
(This article belongs to the Special Issue Advance of Carbon Reinforced Metal-Matrix Composites)

Abstract

:
This paper presents a study of microstructures and properties of pure copper and copper–fullerene-soot (Cu-FS) composite materials produced by mechanical milling followed by hot pressing. The electrochemical etching method was successfully applied to reveal the fragmented structure of the specimens produced by high-energy ball milling. It is shown the carbon nanoparticles are involved in the composite microstructure formation. Copper–fullerene-soot composite materials have a complex microstructure with a bimodal grain distribution. Both recrystallized (average 3 μm) and polygonized (155 nm) grains are observed in the microstructure. Thus, in the case of pure copper, due to the absence of carbon nanoparticles, only recrystallized grains are observed in the microstructure. The Cu-FS composite has a hardness up to 160 HV and thermal stability up to 700 °C.

1. Introduction

Composite materials based on copper with carbon nanoparticles (carbon content up to 1 wt.%) are mainly produced by mechanical milling because of the method’s simplicity [1,2]. Typically, the carbon nanoparticles are located on the grain boundary, which contributes to grain refinement. Therefore, the most common strengthening mechanism in milled copper–nanocarbon composites is the grain boundary strengthening [1,3]. It is believed that grain refinement occurs due to the presence of carbon nanostructures, which hinder the passage of diffusion processes and thus inhibit grain growth [4,5,6]. On the other hand, it is known that during high-energy milling, an increase in dislocation density occurs due to the plastic deformation [7,8]. The increase in dislocation density leads to processes aimed at stress relief in the material, such as recrystallization and polygonization [8,9]. Usually, the detection of fragmented and defective structures by chemical etching is difficult due to the large number of boundaries, which are etched by different rates.
In this paper, we report for the first time the successful usage of an electrochemical etching method for the study of the microstructure of Cu–fullerene-soot composites produced by the milling method with a carbon content of 0 and 0.5 wt.%. The electrochemical etching is excellent for revealing the fragmented structure that is produced after high-energy ball milling. Finally, the effects of fullerene soot reinforcement on grain size refinement and the properties of Cu-FS composites were discussed.

2. Materials and Methods

Fullerene soot (FS) was supplied by Suzhou Dade Carbon Nanotechnology Co (Suzhou, China). The FS particles had a spherical shape and an average size of 40 nm (Figure 1a). The initial copper powder (dendrite crystals with an average size of 50 µm) was a PMS1-grade commercial powder (GOST 4960–2009, HimSnab, Saint-Petersburg, Russia) shown in Figure 1b. The Cu and FS were mixed in a planetary ball mill (Pulverisette 7, Fritsch, Idar-Oberstein, Germany). A total of 10 g of powder mix was put in a stainless-steel jar of 80 mL volume filled with milling balls of 10 mm diameter; the ball (stainless steel)-to-powder ratio was 8:1. Milling was performed in an argon atmosphere in two stages. The first low-energy stage was conducted at 200 rpm for 60 min and the second—high energy—at 600 rpm for 60 min as well. After milling, the powders were compacted by hot pressing in two stages. The first stage was cold-pressing at 400 MPa in a cylindrical form with a diameter of 40 mm; the form was then loaded into a furnace heated to 750 °C and held for 1 h; then, the hot form was pressed at a pressure of 200 MPa and left to cool at room temperature under pressure. The density of the compact composite was measured by the hydrostatic method. The specimens’ microstructures were revealed by chemical and electrochemical etching. Chemical etching of the specimens was carried out in the following solution: 12 g of FeCl2, 30 mL of HCl, and 100 mL of distilled H2O. The specimens were immersed in the solution for 5–10 s, then washed with distilled water and dried. For electrochemical etching, an electrolyte composition was used: 75 mL of orthophosphoric acid, 20 mL of glycerol, 25 mL of distilled water, and a plate of pure copper was used as a cathode. The studied specimens were immersed in the prepared electrolyte, after which a current (current density—Table 1) was applied for 60 s; then, it was washed and dried.
X-ray diffraction (XRD) analysis was performed using a Bruker D8 Advance diffractometer (Bruker, Billerica, MA, USA) in Cu monochromatic Kα radiation. Optical microscopy was carried out on a Carl Zeiss Observer D1m microscope. Scanning electron microscopy (SEM) with secondary electron (SE) detectors and backscattered electron (BSE) detector images were obtained by a MIRA 3 TESCAN (Brno - Kohoutovice, Czech Republic) with an INCA X-MAX energy-dispersive X-ray spectrometer (Abingdon, UK). The Vickers hardness and microhardness were tested by a ZWICK ZHU (ZWICK, Ulm, Germany) under a load of 10 kgf and 100 gf, respectively. The nanoindentation was conducted on the chemically etched specimen surface using an ASMEC Universal Nanomechanical Tester (Bautzner Landstraße 45, Dresden, Germany) with a Berkovitch indentation tip. The test was performed at a load of 3 mN, the loading and unloading rates were maintained at 2 mN/s, and the specimen area was 30 × 30 μm.

3. Results and Discussions

Figure 1c,d show microphotographs of Cu and Cu-0.5 wt.% FS composite (Cu-FS) powders after mechanical milling, respectively. As can be seen from Figure 1, the size and morphology of the particles depend on the carbon [3]. For comparison with the Cu-FS composite, pure copper powder was milled. The pure Cu particles after milling increase from 50 to 652 μm (Figure 1e) and change their morphology from dendritic to spherical (Figure 1b,c). The after-milled Cu-FS average particle size is 155 μm (Figure 1e) and the morphology changes to a layered structure (inset in Figure 1d). Some directionality is noticeable on the particle slice, which is common for powders produced by milling [8,10].
On the X-ray diffraction patterns, a broadening of the diffraction maxima for all specimens after milling is observed, which is associated with an increase in the material defects number. Milling promotes the formation of point defects and an increase in dislocation density, which leads to the strain hardening of the powders. Thus, the microhardness of pure Cu powder is 120 ± 5 HV and that of composite powder is 221 ± 10 HV (Figure 1f). After the hot pressing, the hardness of compact specimens is 75 and 160 HV for Cu and Cu-FS, respectively. The hardness reduction of compact materials, compared to powders, is explained by the partial stress removal during the hot pressing. The measurements of the composites’ hydrostatic density and the estimation of relative density show that the Cu-0.5 wt.% FS compacted composites has a 98.2% of density. The Cu-FS microstructures of the composite after hot pressing are shown in Figure 2. The specimens show a “marble” pattern, which is formed by a light grid, which consists of recrystallized copper, observed in [11]. Figure 2a shows the SEM image of the structure after chemical etching. After the electrochemical etching, it is noticeable that the structure is heterogeneous and consists of large and small grains (Figure 2b–f).
Figure 2c shows the growth process of recrystallized grains occurring by the aggregation of small crystals. Aboard the recrystallized boundaries, the enlargement of small grains into larger aggregates is observed. The composite structure is heterogeneous, the microimages show “powder heredity” (Figure 2b,d,e); namely, there is some directionality of the grains, which is common for the particle structure after milling (inset in Figure 1d), which was also observed in [7]. In general, the average size of the nanograin is 155 nm (inset in Figure 2f).
The reason for the bimodal grain distribution is the partial recrystallization process. During the hot pressing, the stresses caused by the high-energy ball milling process are relieved by undergoing recrystallization. For recrystallization to occur, two conditions must be met: the presence of a nucleation center and the boundary mobility [9]. The nucleation center, necessary to carry out recrystallization, already exist in the powder after milling. The second condition requires the absence of impurities that impede the movement of boundaries. As we wrote in [11], during hot pressing, a part of the carbon reduces the oxidized surface of the powder, which leads to the area’s formation consisting of only pure copper, and all conditions for the recrystallization process are met. If the recrystallization process is not possible, polygonization takes place. Thus, the structure of the Cu-FS consists of recrystallized copper grains and nanograins, where nanoparticles of FS are evenly distributed. The recrystallized grains are observed only in carbon-depleted areas and it can be concluded that FS is a barrier to recrystallization, which leads to the nanograins’ formation.
The chemical composition is characterized by EDS analysis. The elemental mapping images are presented in Figure 3b–d. It can be obviously seen that the elements Cu, C, and O are distributed evenly across nanograins.
Figure 3f shows the XRD pattern of the composite after hot pressing. There are five diffraction peaks, corresponding to the (111), (200), (220), (311), (222), and (400) crystal planes of Cu (PDF #040836). Because the carbon content is below the detection limit of the XRD, no diffraction peaks of carbon are found. In addition, the peaks of copper oxide are not found.
To study the influence of the FS on the formation of the microstructure, a pure copper specimen was produced by the same technology. Figure 4 shows images of the pure copper structure after electrochemical etching.
The observed grains have a size near 3 μm and a typical texture caused by plastic deformation during milling. Almost the entire pure copper structure consists of recrystallized grains, but traces of polygonization are visible in some places. That indicates that polygonization takes place and it is a process to relieve the stress caused by high-energy ball milling. Since the pure copper specimen is free of impurities and carbon nanoparticles, which are barriers to the recrystallization process, the microstructure consists almost entirely of equiaxed grains.
Figure 5 presents optical (Figure 5a–c) and SEM (Figure 5d) images of the Cu-FS composite. To study the effects of the fullerene soot distribution and grain size on the microhardness, nanoindentation of the Cu-0.5 wt.% FS specimen is measured. Figure 5b,c present optical images of the composite after the nanoindentation test.
The nanoindentation hardness values shown in Figure 5g represent a double Gaussian distribution caused by the microstructural inhomogeneity. The recrystallized grains (average 3 μm) and nanograins (155 nm) are observed in the microstructure. It can be seen on the elemental map (present in Figure 5f) that the recrystallized grains are decarbonized and consist of pure copper, which is why the grains have a lower hardness value (1.43 GPa). The same hardness value of pure copper was demonstrated in [12,13,14], whereas the nanograins’ hardness is 1.97 GPa.
To study the effect of fullerene soot on composite thermostability, annealing was carried out. Specimens of the Cu-0.5 wt.% FS and pure copper were annealed in one atmosphere of flowing Ar/H2 for 1 h at 200–700 °C to determine the thermal stability of the microstructure. The Vickers hardness of the specimens after annealing is shown in Figure 6a. The hardness decreases with the increase in annealing temperature [14,15], for example, the softening temperature of pure copper is 200 °C. Due to the reinforcement of fullerene soot, the thermal stability of composites increases and the softening temperature of Cu-0.5 wt.% FS is higher than 600 °C. The composite hardness decreases to 118 HV with the increase in the annealing temperature to 700 °C. So, the copper–fullerene-soot composite produced by mechanical milling has a better hardness and thermal stability than the pure copper produced by the same technology.
The composite microstructures after annealing are shown in Figure 6b,c. For the Cu-FS composite after annealing at 400 °C (shown in Figure 6b), the size of nanograins does not change (about 160 nm), while, after annealing at 700 °C, the nanograins aggregate (Figure 6c) and the curve of grain distribution has two peaks: the first one is at 193 nm while the second is at 338 nm (Figure 6d). The reason for the decreasing hardness in the composite after annealing at 700 °C is likely a result of the increase in the size of the grains.

4. Conclusions

The method of electrochemical etching was successfully applied to reveal the fragmented structure of the composites produced by high-energy ball milling. The structure of pure Cu consists of only recrystallized grains (average size 3 μm), while the structure of the Cu-0.5 wt.% FS consists of recrystallized (average size 3 μm) and polygonized (average size 155 nm) grains. Since FS is a barrier to recrystallization, recrystallized grains are observed only in carbon-depleted areas, where FS inhibits the growth of grains, which leads to the formation of nanograins. The hardness of the Cu-FS composite increases to 160 HV and the thermal stability increases up to 700 °C.

Author Contributions

Conceptualization, E.B.; data curation, E.B.; investigation, T.K.; writing—original draft, E.B.; writing—review and editing, T.L. All authors have read and agreed to the published version of the manuscript.

Funding

This research was funded by the Ministry of Science and Higher Education of the Russian Federation as part of the World-class Research Center program: Advanced Digital Technologies, grant number 075-15-2020-312 dated 20 April 2022.

Institutional Review Board Statement

Not applicable.

Informed Consent Statement

Not applicable.

Data Availability Statement

Data sharing is not applicable.

Conflicts of Interest

The authors declare no conflict of interest. The funders had no role in the design of the study; in the collection, analyses, or interpretation of data; in the writing of the manuscript, or in the decision to publish the results.

References

  1. Akbarpour, M.R.; Mousa, M.H.; Alipour, S.; Kim, H.S. Enhanced tensile properties and electrical conductivity of Cu-CNT nanocomposites processed via the combination of flake powder metallurgy and high pressure torsion methods. Mater. Sci. Eng. A 2020, 773, 138888. [Google Scholar] [CrossRef]
  2. Deng, H.; Yi, J.; Xia, C.; Yi, Y. Mechanical properties and microstructure characterization of well-dispersed carbon nanotubes reinforced copper matrix composites. J. Alloys Compd. 2017, 727, 260–268. [Google Scholar] [CrossRef]
  3. Yoo, S.J.; Han, S.H.; Kim, W.J. A combination of ball milling and high-ratio differential speed rolling for synthesizing carbon nanotube/copper composites. Carbon 2013, 61, 487–500. [Google Scholar] [CrossRef]
  4. Li, X.; Yan, S.; Chen, X.; Hong, Q.; Wang, N. Microstructure and mechanical properties of graphene-reinforced copper matrix composites prepared by in-situ CVD, ball-milling, and spark plasma sintering. J. Alloys Compd. 2020, 834, 155182. [Google Scholar] [CrossRef]
  5. Larionova, T.; Koltsova, T.; Fadin, Y.; Tolochko, O. Friction and wear of copper–carbon nanofibers compact composites prepared by chemical vapor deposition. Wear 2014, 319, 118–122. [Google Scholar] [CrossRef]
  6. Suryanarayana, C.; Al-Aqeeli, N. Mechanically alloyed nanocomposites. Prog. Mater Sci. 2013, 58, 383–502. [Google Scholar] [CrossRef]
  7. Chen, X.; Tao, J.; Yi, J.; Liu, Y.; Li, C.; Bao, R. Strengthening behavior of carbon nanotube-graphene hybrids in copper matrix composites. Mater. Sci. Eng. A 2018, 718, 427–436. [Google Scholar] [CrossRef]
  8. Friedel, J. Dislocations; Pergamon Press: Oxford, UK, 1964; Volume 70, pp. 275–302. [Google Scholar] [CrossRef]
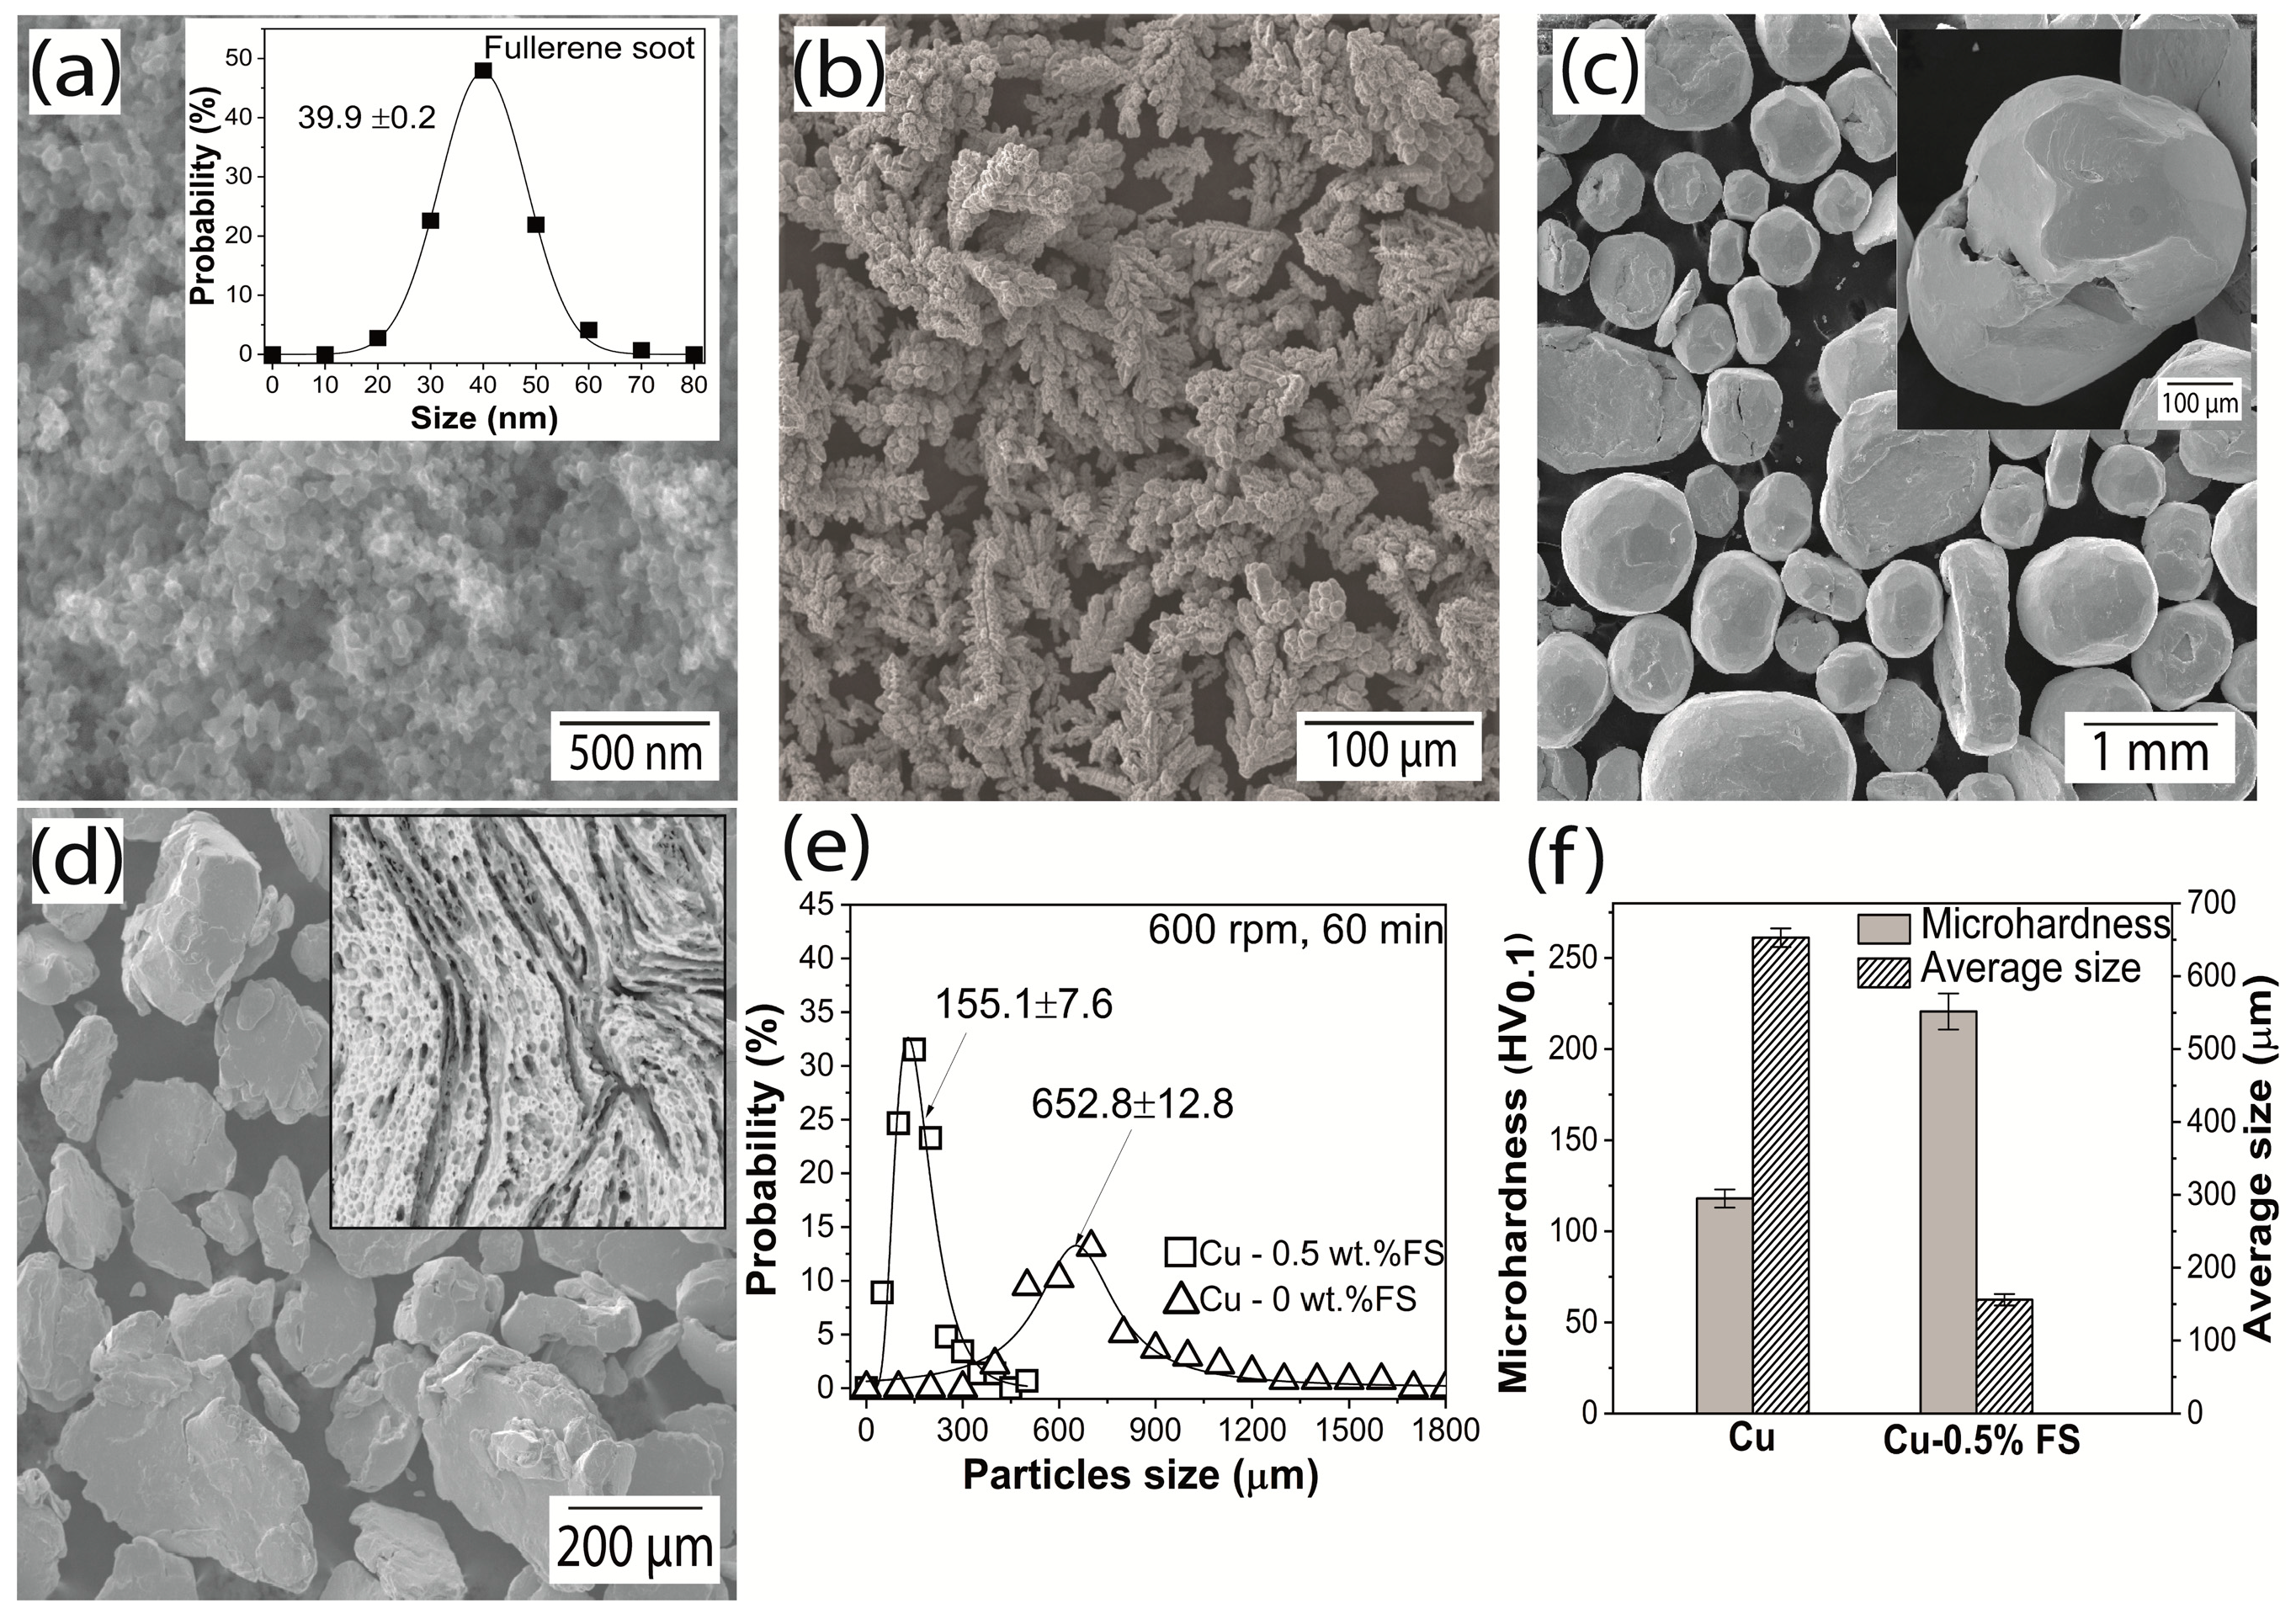
  9. Bobrynina, E.V.; Larionova, T.V.; Koltsova, T.S.; Shamshurin, A.I.; Nikiforova, O.V.; Tolochko, O.V.; Puguang, J.; Fuxing, Y. The Effect of Fullerene Soot Nanoparticles on the Microstructure and Properties of Copper-Based Composites. Nanomaterials 2020, 10, 1929. [Google Scholar] [CrossRef] [PubMed]
  10. Ping-Chi, T.; Yeau-Ren, J.; Jian-Ting, L.; Stachiv, I.; Sittner, P. Effects of carbon nanotube reinforcement and grain size refinement mechanical properties and wear behaviors of carbon nanotube/copper composites. Diam. Relat. Mater. 2017, 74, 197–204. [Google Scholar] [CrossRef]
  11. Rajkovic, V.; Bozic, D.; Jovanovic, M.T. Characterization of prealloyed copper powders treated in high energy ball mill. Mater. Charact. 2006, 57, 94–99. [Google Scholar] [CrossRef]
  12. Zhang, Q.; Qin, Z.; Luo, Q.; Wu, Z.; Liu, L.; Shen, B.; Hu, W. Microstructure and nanoindentation behavior of cu composites reinforced with graphene nanoplatelets by electroless co-deposition technique. Sci. Rep. 2017, 7, 1338. [Google Scholar] [CrossRef] [PubMed]
  13. Yuchen, L.; Sosuke, K.; Hao, Y.; Kiyohiro, Y.; Ryuta, K. Evaluation of irradiation hardening in ODS-Cu and non ODS-Cu by nanoindentation hardness test and micro-pillar compression test after self-ion irradiation. Nucl. Mater. Energy 2021, 26, 100903. [Google Scholar] [CrossRef]
  14. Holtz, R.L.; Barrera, E.V.; Milliken, J.; Provenzano, V. Grain-Size Stability and Microhardness of Copper-Fullerene Nanocomposites. MRS Online Proc. Libr. 1994, 351, 375–380. [Google Scholar] [CrossRef]
  15. Jie, H.; Naiqin, Z.; Chunsheng, S.; Xiwen, D.; Jiajun, L.; Philip, N. Reinforcing copper matrix composites through molecular-level mixing of functionalized nanodiamond by co-deposition route. Mater. Sci. Eng. A 2008, 490, 293–299. [Google Scholar] [CrossRef]
Figure 1. SEM images and size distribution of the FS (a); SEM images of pure copper initially (b) and after milling (c); SEM images of composite powders Cu-0.5 wt.% FS (d); particle size distribution after milling (e); microhardness and average particle size of powders (f).
Metals 13 01052 g001
Figure 2. SEM images of the Cu-0.5 wt.% FS specimen microstructure after chemical (a) and electrochemical (bf) etching (black arrow in (d) show directionality of the grains).
Metals 13 01052 g002
Figure 3. SE image of the specimen showing the element mapping region (a), Cu elemental map (b), C elemental map (c), O elemental map (d), EDS analysis of the mapping region (e) and XRD (f) of the Cu-0.5 wt.% FS specimen.
Metals 13 01052 g003
Figure 4. SEM images of the pure Cu microstructure after electrochemical etching: a low magnification (a) and are magnified images two regions, recrystallized (b,c) and polygonization regions (d).
Metals 13 01052 g004
Figure 5. Optical (ac) and SEM images (d), Cu elemental map (e), C elemental map (f), and hardness distribution determined by nanoindentation (g) of the Cu-0.5 wt.% FS specimen.
Metals 13 01052 g005
Figure 6. Hardness of Cu-0.5 wt.% FS and pure copper after annealing at different temperatures (a), SE image of the Cu-0.5 wt.% FS after annealing at temperatures of 400 °C (b) and 700 °C (c), and grain size distribution (d).
Metals 13 01052 g006
Table 1. Electrochemical etching parameters.
SpecimenEtching Time, sCurrent, ASpecimen Area, cm2Current Density, A/cm2
pure Cu600.33.320.090
Cu-0.5 wt.% FS before annealing600.33.350.089
Cu-0.5 wt.% FS after annealing at 400 °C600.33.620.083
Cu-0.5 wt.% FS after annealing at 700 °C600.32.090.119
Disclaimer/Publisher’s Note: The statements, opinions and data contained in all publications are solely those of the individual author(s) and contributor(s) and not of MDPI and/or the editor(s). MDPI and/or the editor(s) disclaim responsibility for any injury to people or property resulting from any ideas, methods, instructions or products referred to in the content.

