Article

Influence of Deposition Plane Angle and Saline Corrosion on Fatigue Crack Growth in Maraging Steel Components Produced by Laser Powder Bed Fusion

1
Department of Mechanical Engineering, Centre for Mechanical Engineering, Materials and Processes (CEMMPRE), University Coimbra, 3004-516 Coimbra, Portugal
2
Department of Mechanical Engineering, Coimbra Polytechnic–ISEC, Rua Pedro Nunes, 3030-199 Coimbra, Portugal
*
Author to whom correspondence should be addressed.
Metals 2022, 12(3), 433; https://doi.org/10.3390/met12030433
Submission received: 31 December 2021 / Revised: 15 February 2022 / Accepted: 25 February 2022 / Published: 1 March 2022
(This article belongs to the Special Issue High-Strength Low-Alloy Steels: Current and Future Challenges)

Abstract

:
Maraging steels are used in several industries, namely in the molds industry. The determination of fatigue crack propagation resistance in 18Ni300 maraging steel at the Paris regime is a vital issue for safety-relevant components, which are designed to work for a large number of loading cycles before periodic inspections. The main goal of this work is to analyze the influence of the deposition plane angle and saline corrosion on fatigue crack growth in maraging steel samples produced by Laser Powder Bed Fusion (LPBF). The crack closure parameter was used in order to analyze the different fatigue crack growth behaviors, as well as the metallographic, hardness, fractography and corrosion/oxidation analysis. From this work, the main achievement was that the deposition plane angle did not reveal a notable influence in the fatigue crack growth behavior for the fatigue tests unsubmitted to saline corrosion. On the other hand, the fatigue crack growth behavior for the tests under saline corrosion showed an increase in the crack closure parameter due to the appearance of the crack closure induced by oxides, which reduced the fatigue crack growth speed. This phenomenon depends on the deposition plane angle, which controls the martensite amount and consequently controls the level of corrosion/oxidation.

1. Introduction

Laser powder bed fusion (LPBF) allows the generation of complex shape components with a strategy of layer-by-layer building, resulting in lighter components [1]. Since it is an emerging technology used in the automotive, aerospace and molds industries, it requires deep study.
Maraging steels are also used in the aerospace and molds industries due to their good properties of high strength, high toughness, resistance to crack propagation and good weldability [2,3]. The characteristic tooling inserts of the molds industry could have cooling channels and components with high geometrical complexity that enable the use of LPBF. This is justified since the use of the LPBF process allows the creation of these complex geometries that are impossible to archive by traditional methods [4,5]. On the other hand, the molds for injection suffer cyclic loadings throughout the lifespan; for this reason, fatigue crack growth behavior needs to be studied.
This type of component can be produced in different orientations, depending on their shape, making it possible to simplify the process. Nevertheless, the components produced by LPBF have anisotropic behavior, linked to their microstructure, layer orientation and defect distribution [6]. The mechanical properties of the LPBF components are affected by the microstructure that has different grain orientations, depending on its building orientation, since, due to the thermal gradients, the grains elongate perpendicular to the melt-pool boundaries [7].
The monotonic properties of additively manufactured materials can be similar when compared with conventionally processed alloys [8]. However, in applications where the components are submitted to cyclic loadings, the main process’ inherent defects, such as superficial porosity and rough surface, are detrimental to fatigue behavior. The presence of defects, such as lack of fusion, internal porosity and residual stress, which are also the result of the LPBF procedure, also have an impact on fatigue strength [9]. Considering the as-built components, fatigue typically starts from the rough surface or defects in the surface region, although surface roughness can be improved by machining the surfaces, which shows an improvement in the fatigue strength [9,10].
To understand all of these factors, some studies have been done. Santos et al. [11] concluded that internal defects have an impact on the mechanical behavior of maraging steel. Branco et al. [12] studied the multiaxial fatigue behavior of maraging steel and identified that fatigue cracks initiated from notches were caused by un-melted regions at the surface and subsurface zones.
Regarding the impact of the deposition plane of maraging steel, Becker et al. [13] compared the crack growth rates of samples built in vertical and horizontal orientations. The horizontal samples showed a higher crack growth rate in the as-built condition. Damon et al. [14] investigated the fatigue behavior of maraging steel with horizontal and vertical built orientations, and the crack initiation phase is unfavorable in terms of service time in horizontally built samples, due to the grain orientation that is parallel to mode I crack growth. However, Croccolo et al. [15] did not find any effect of building orientation on fatigue strength.
Related to fatigue behavior, Wang et al. [16] studied the optimization of 18Ni300 fatigue strength through aging treatment and found that the highest fatigue strength was obtained in specimens aged at 550 °C for 5 h with a transgranular fracture.
In the molds industry, one of the parameters that needs to be considered is the corrosion of the material. Shahriari et al. [17] studied the corrosion behavior of maraging steel fabricated by LPBF and identified a mechanism of pitting corrosion attack on the melt pool boundaries or in pre-existing pores that are prone to localized corrosion attacks. They have also discovered anisotropic corrosion behavior in the samples, which will be affected by the deposition plane. The parallel surface to the building direction has a better corrosion performance due to the presence of a passive film with a more protective nature when compared to the perpendicular surface.
Bouzakis et al. [18] concluded that the characteristic surface roughness from the AM process originates in inferior fatigue and corrosion-fatigue performance when compared to conventional maraging steel.
Moreover, Maierhofer et al. [19] observed that during cyclic loading applied to the QT steel 25CrMo4, oxide particles are transferred from the fracture surface to the surface of specimens and released into the environment. They studied the influence of oxide on fatigue crack growth in the near threshold region and concluded that the long crack threshold is very sensitive to the influence of oxide effects. In addition, the long crack threshold decreases with decreasing specimen thickness.
Regarding crack closure in maraging steel, Antunes et al. [20] concluded that the influence of the stress ratio and specimen thickness was small, which indicates a reduced level of crack closure.
The objective of this paper is to study the fatigue crack growth (FCGR) of maraging steel components produced by LPBF with different deposition planes in two different environments, namely in an air environment at room temperature and in a simulated corrosion saline environment also at room temperature. For this purpose, the environmental effect and the deposition plane angle in the crack closure were studied, which is responsible for the different crack growth speeds. Moreover, the impact of the microstructure achieved in each deposition plane angle on the potentiodynamic polarization curves was also analyzed.

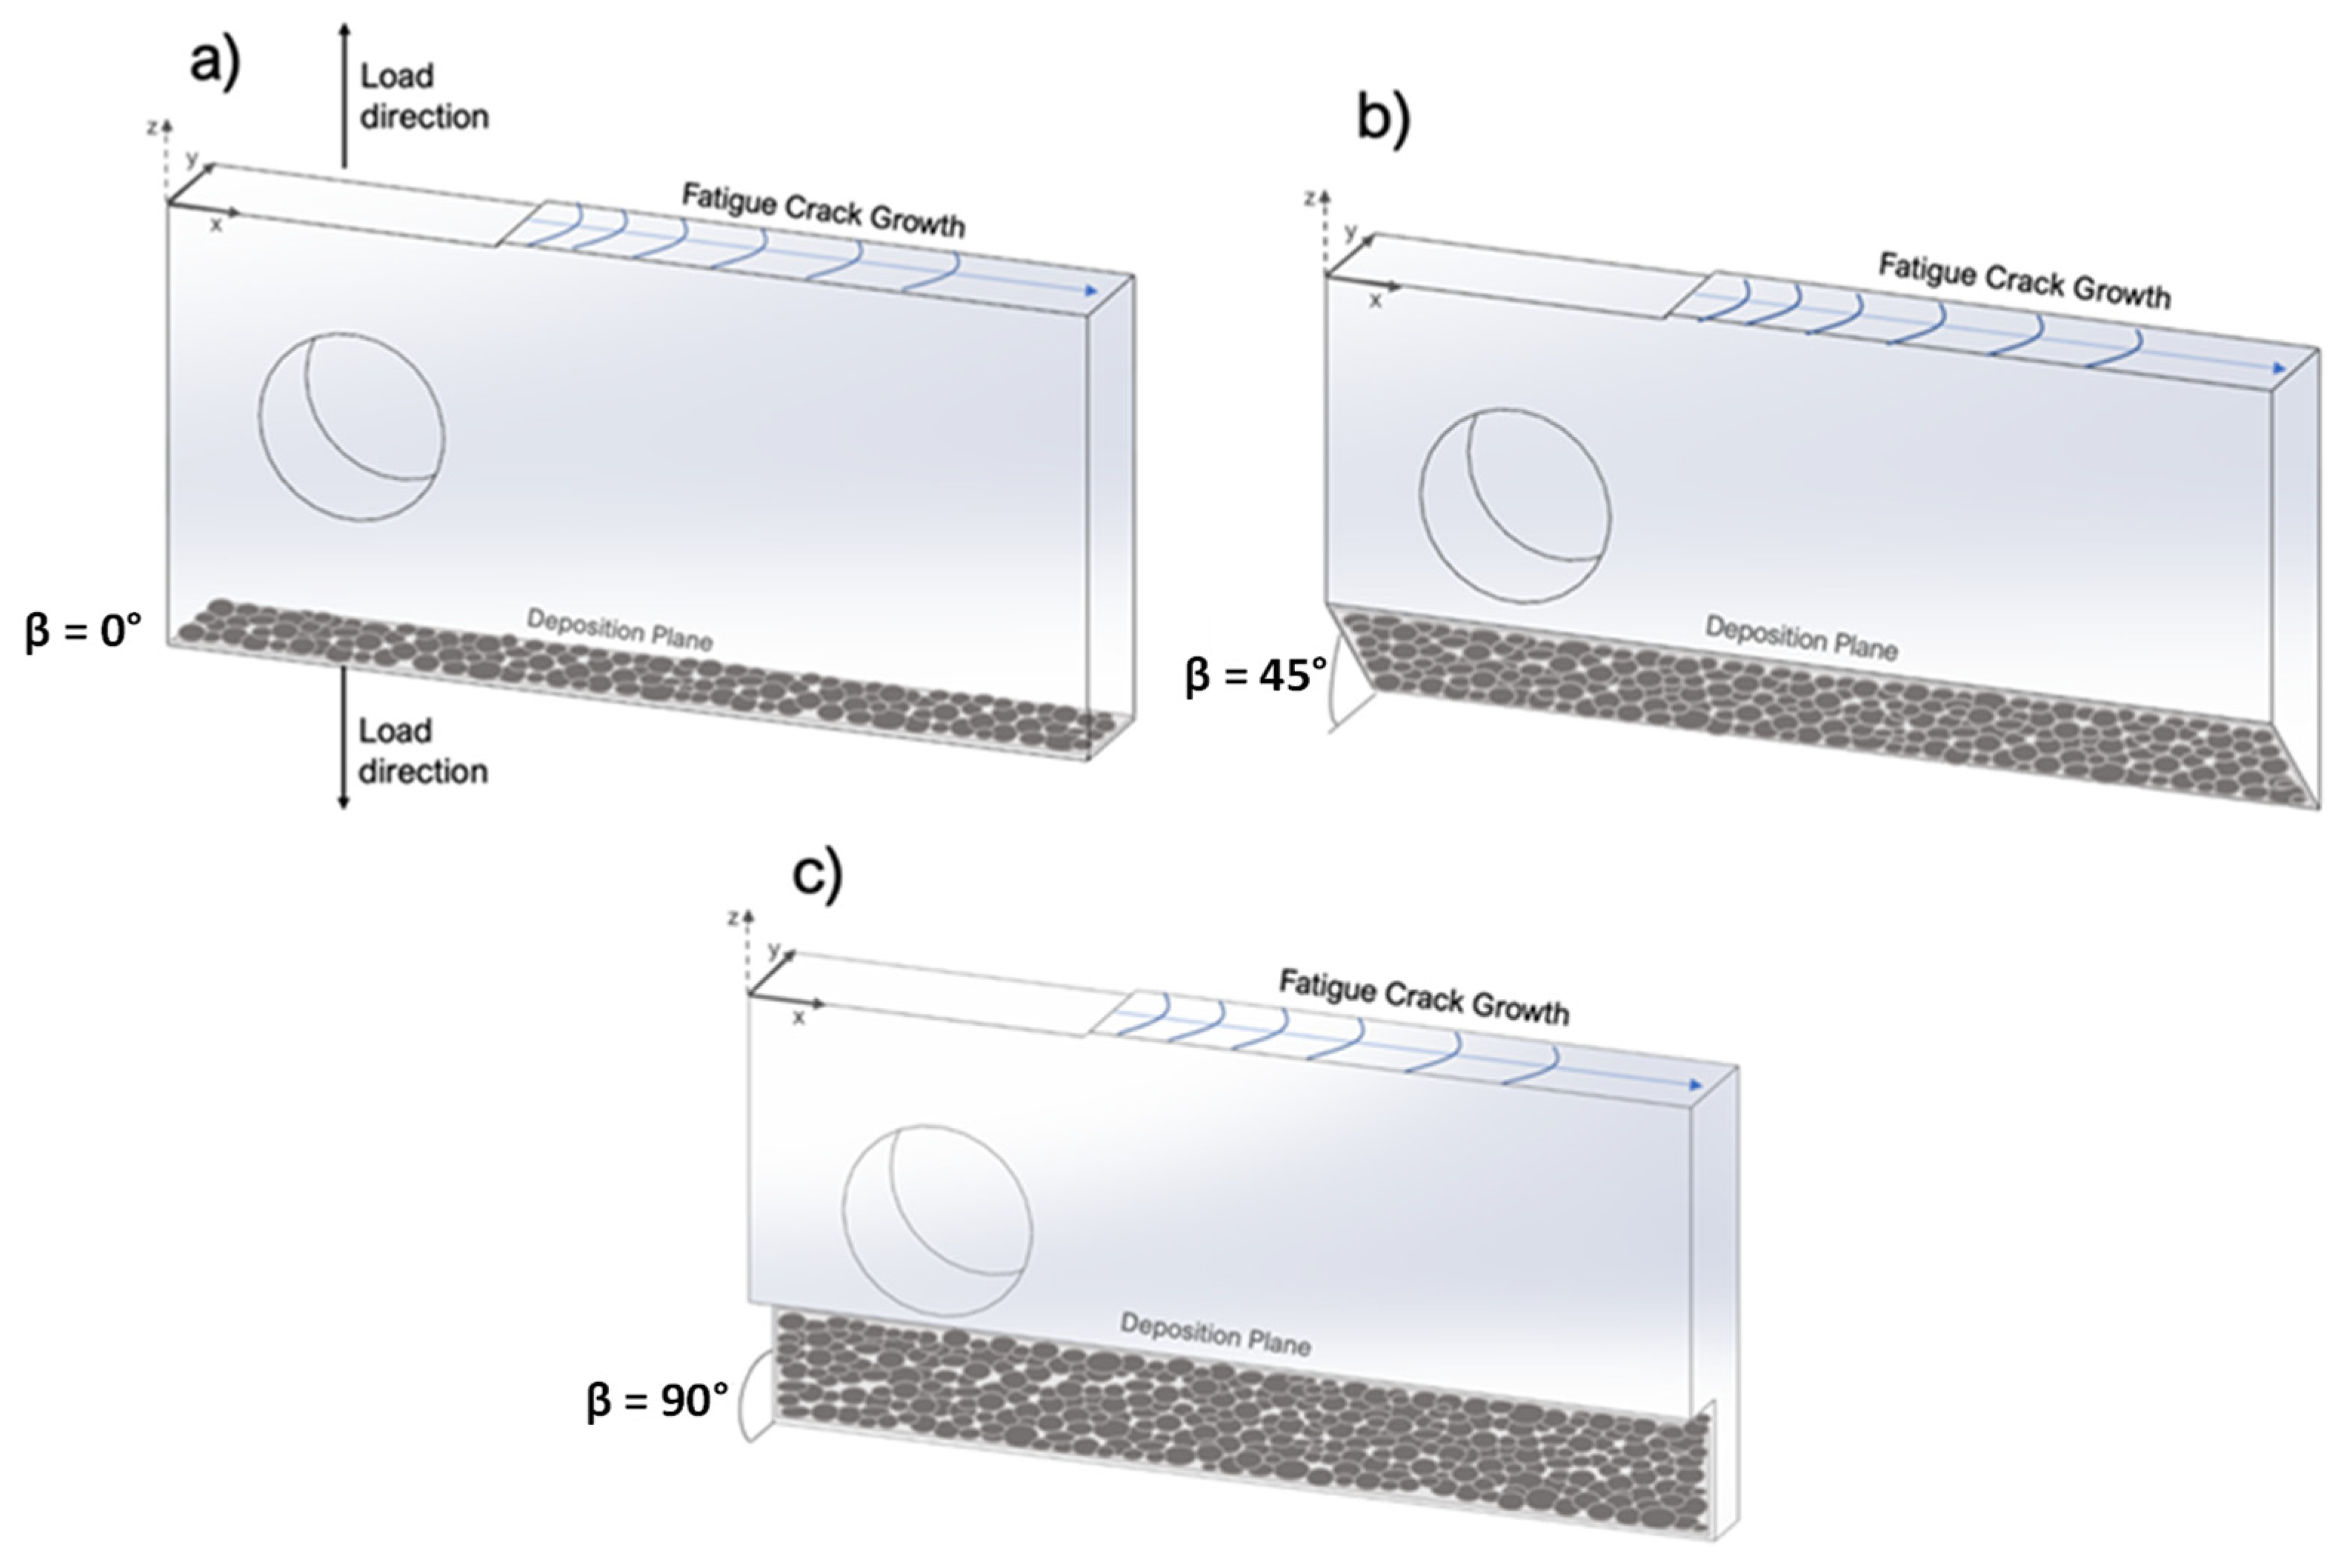
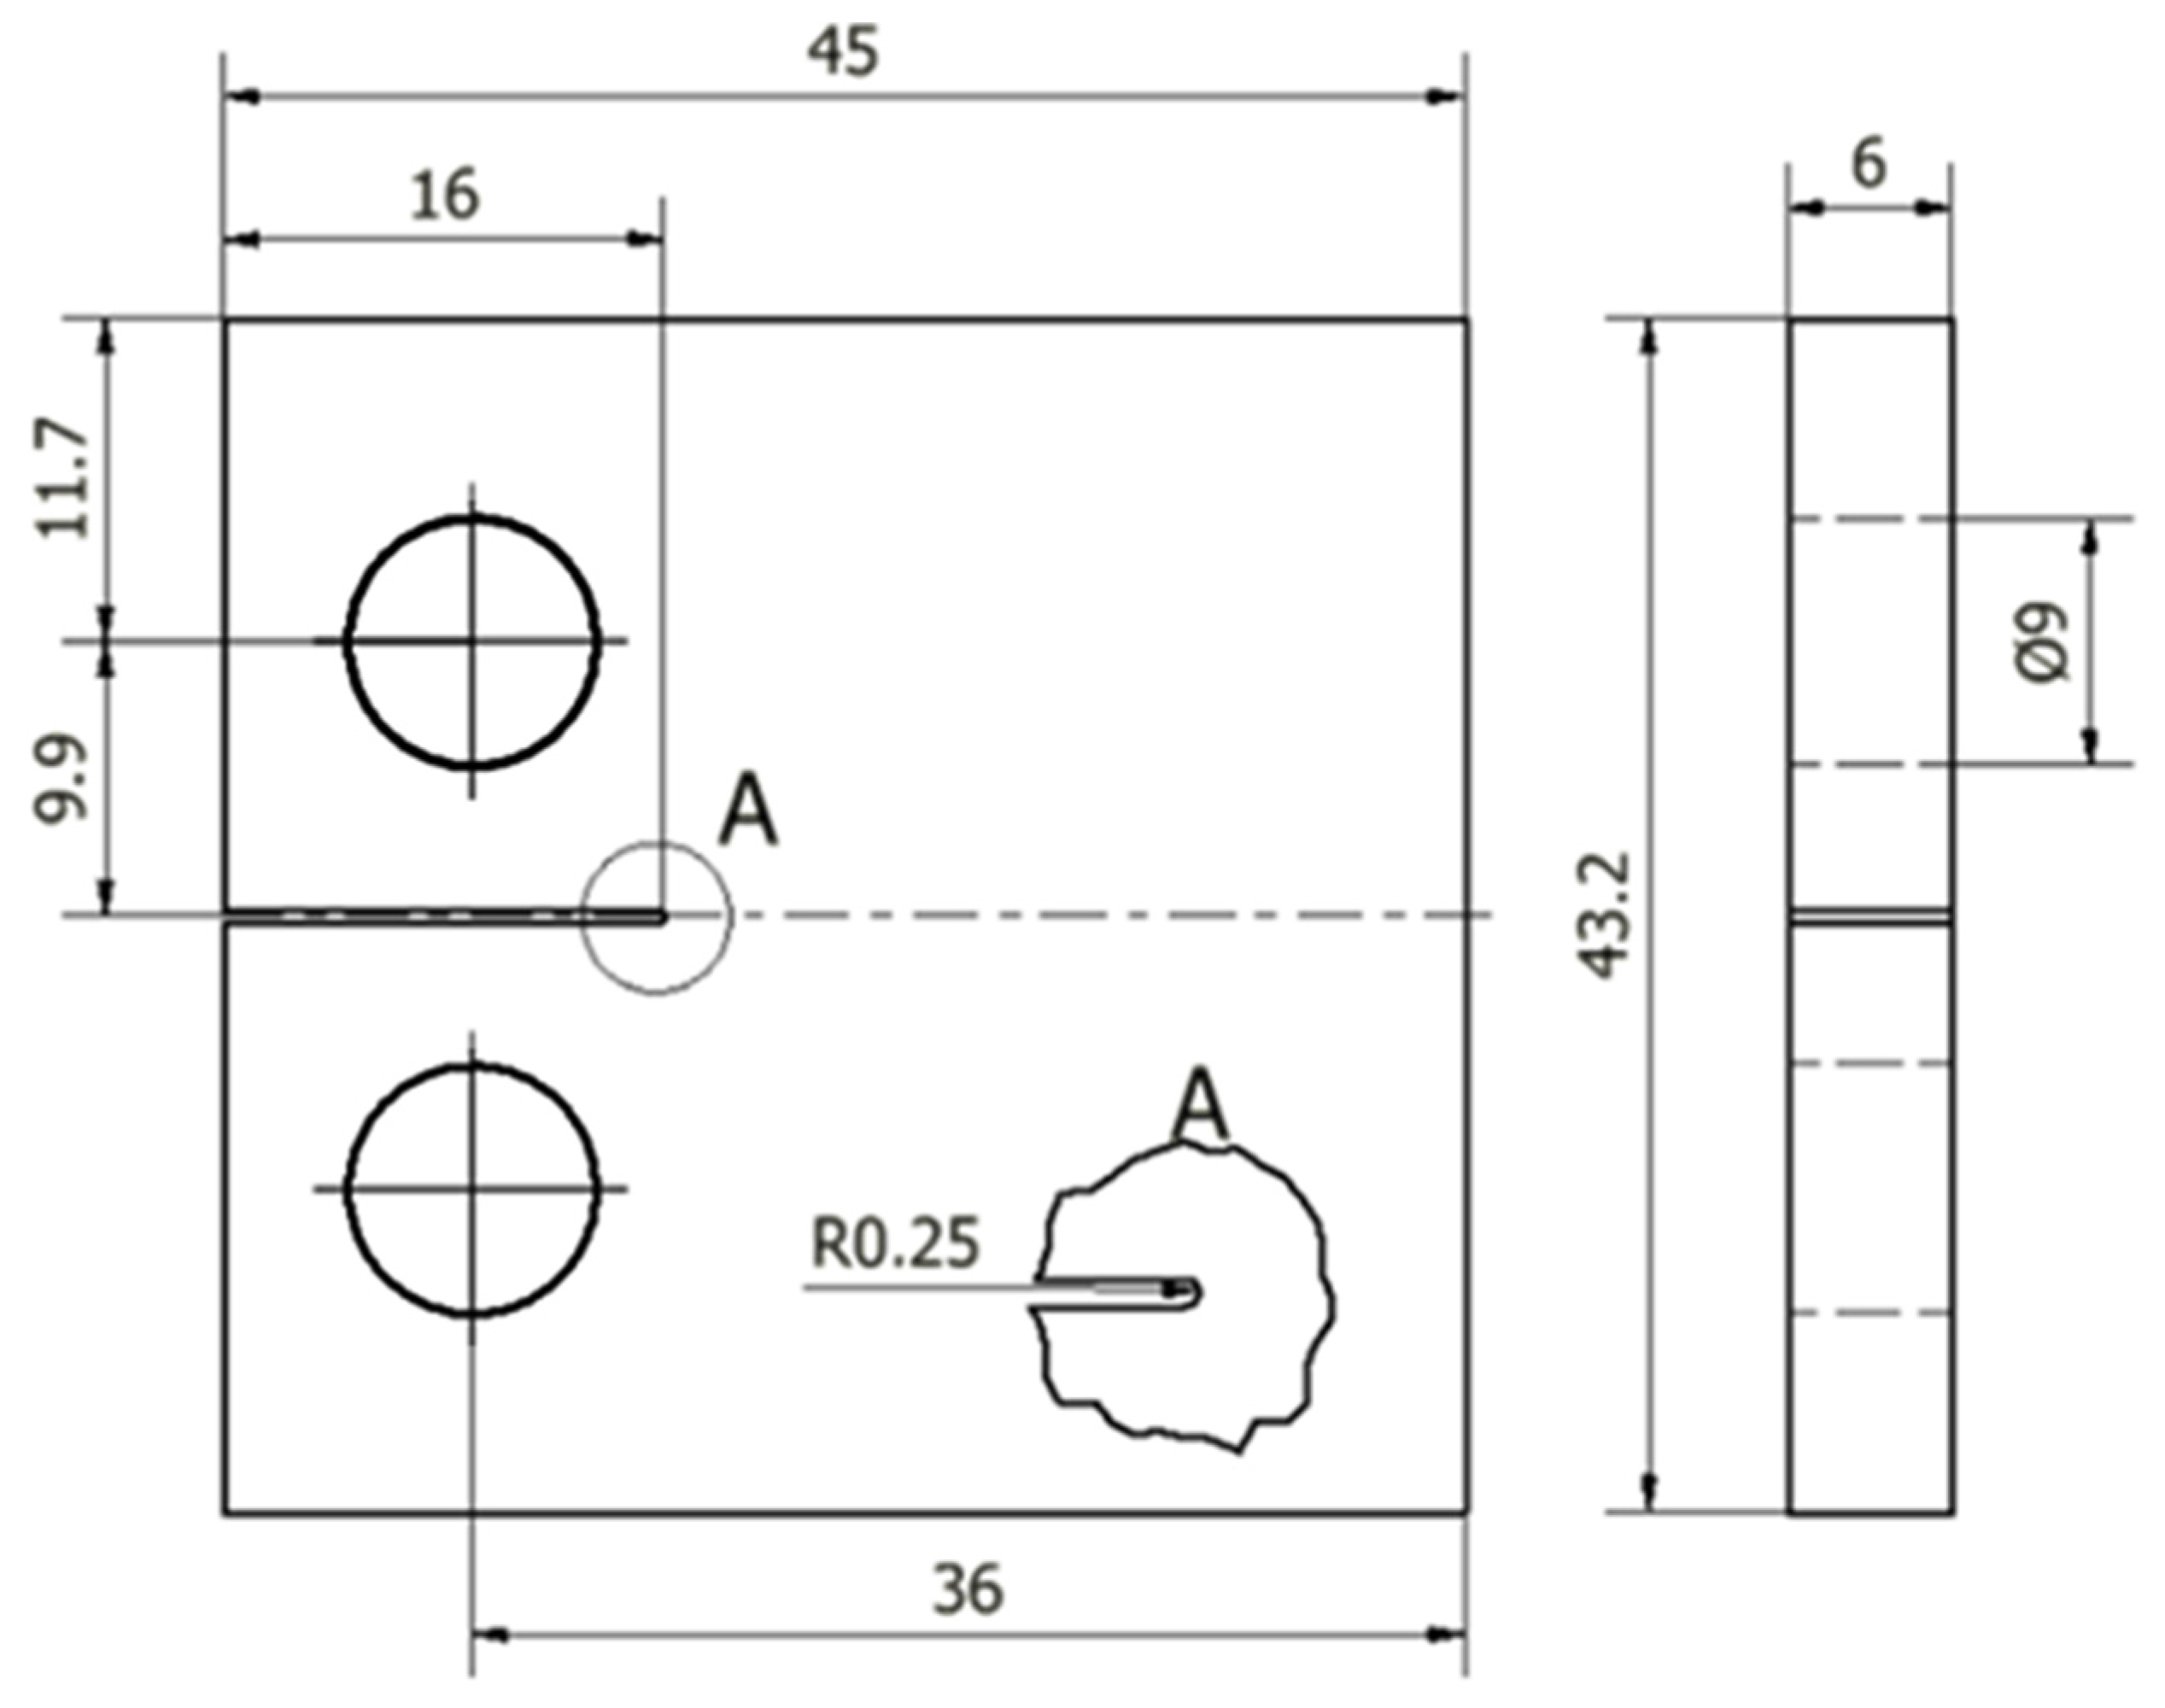
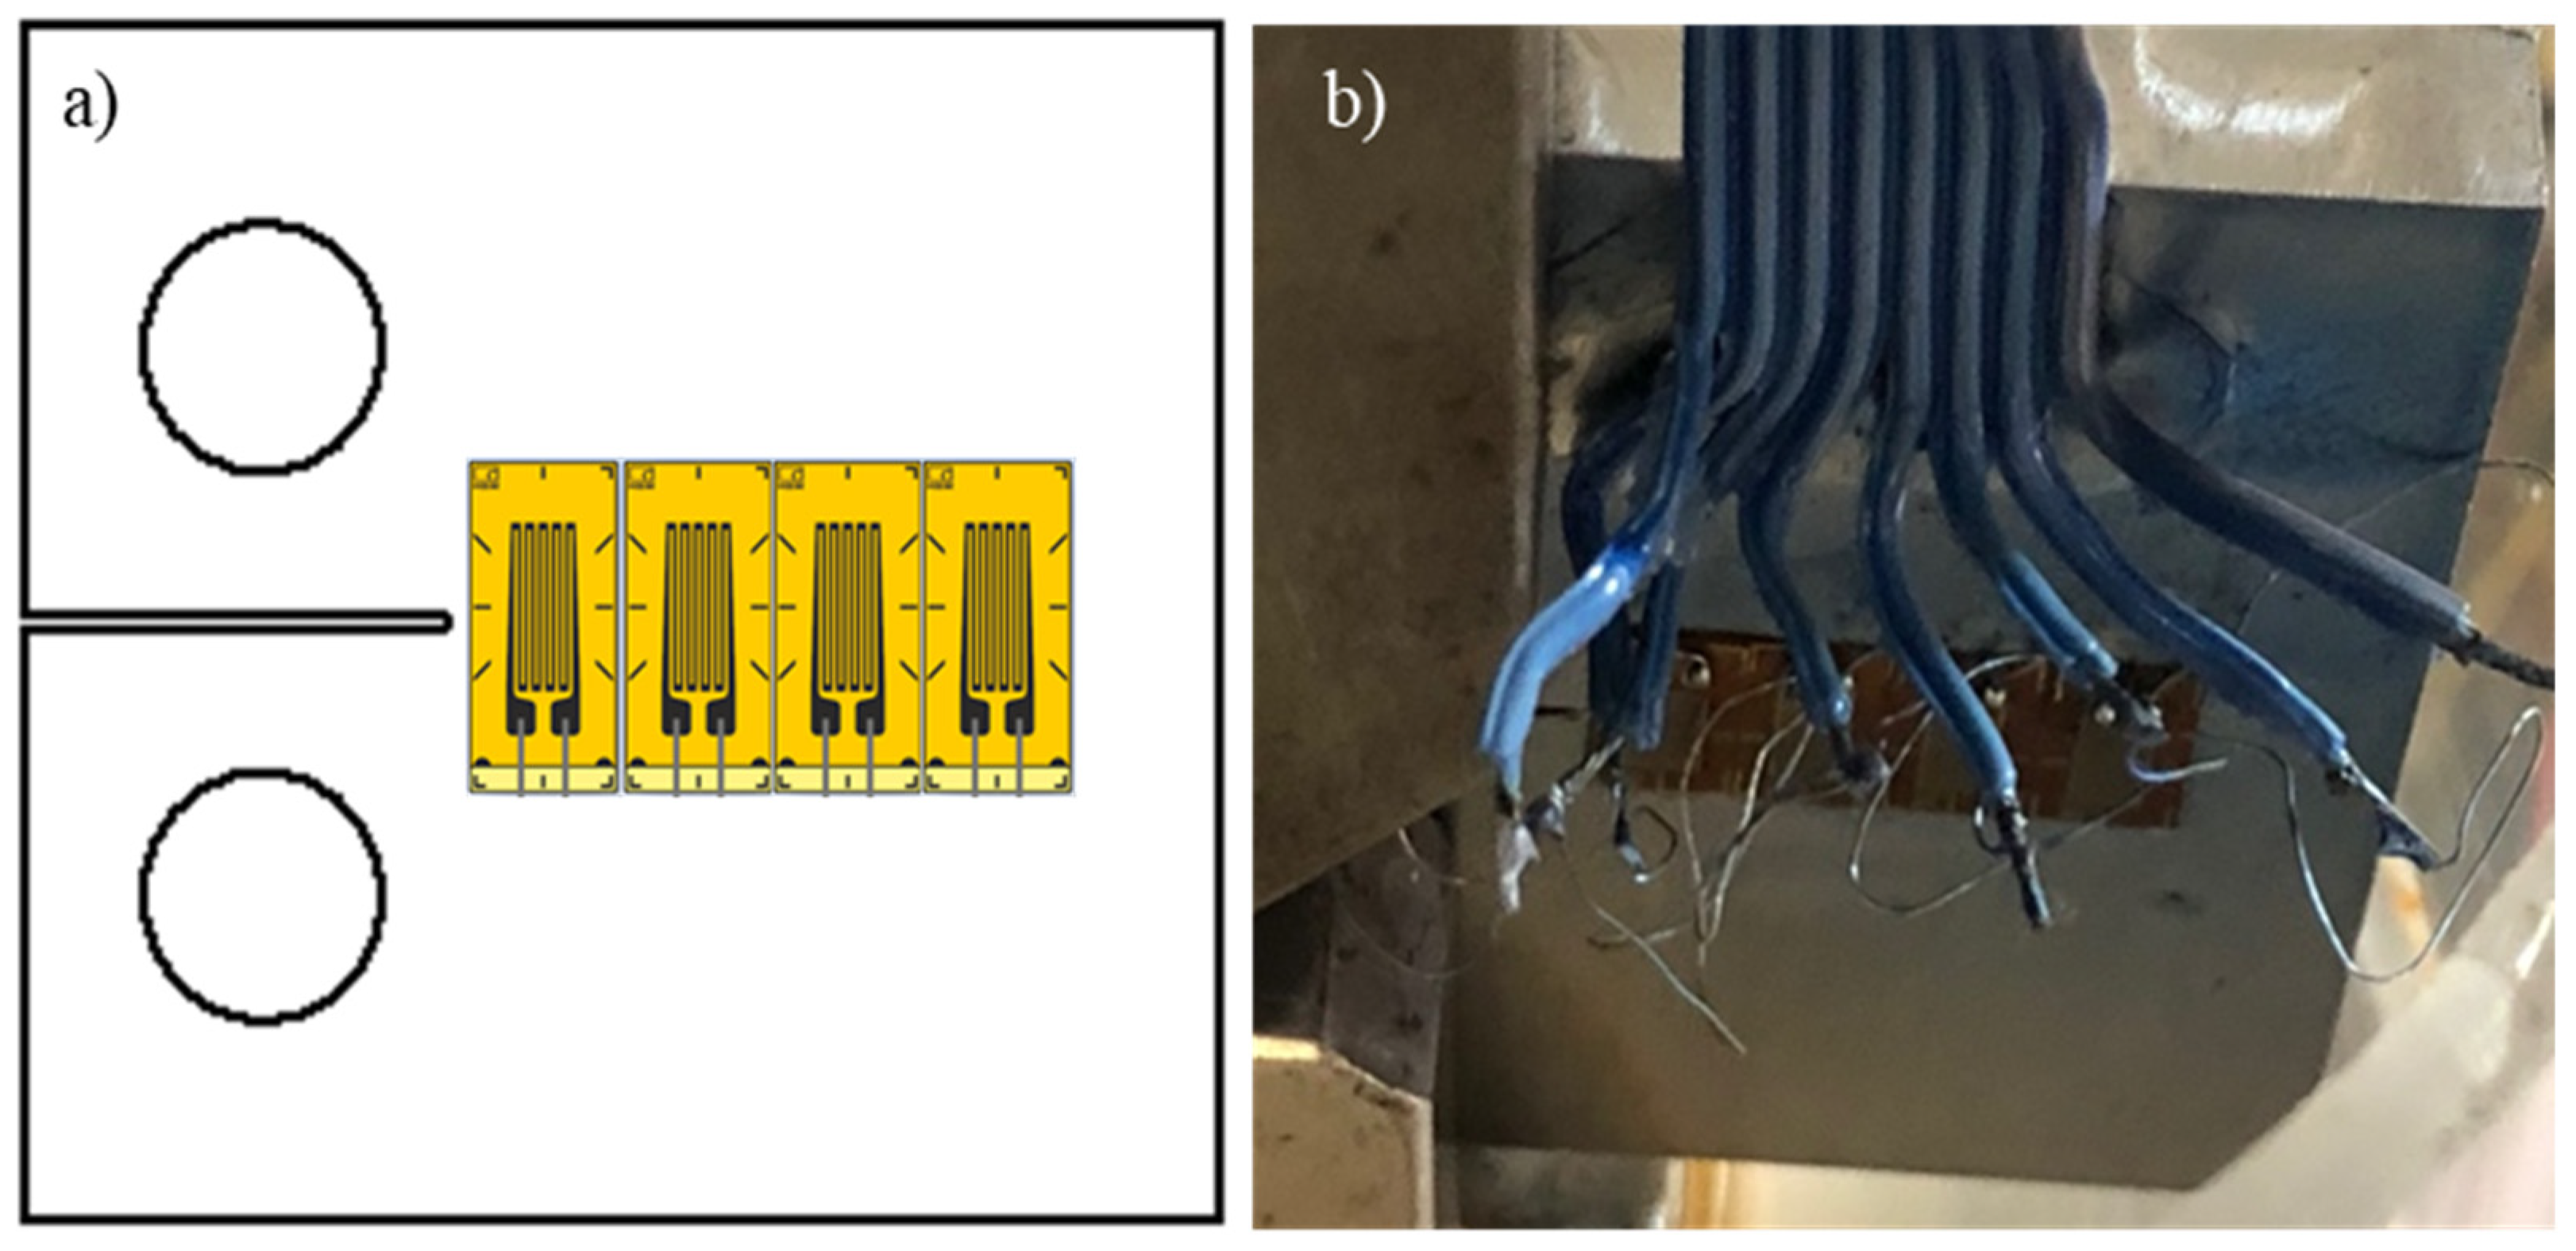
2. Materials and Methods

The laser powder bed fusion (LPBF) process was applied using a high-power laser to fuse steel powder particles layer by layer by Lasercusing® in order to produce CT (compact tension) specimens. A “Renishaw” equipment model “AM 400” was used to apply LPBF processes. The parameters used in the LPBF process were a laser power of 400 W, scan speed of 0.85 m/s, laser diameter of 0.04 mm, deposited layer of 30 µm, 100 μm of hatch spacing and 25% of overlapping. The steel powder particles (40 µm in diameter) were obtained from maraging steel 18Ni300, and the chemical composition is presented in Table 1.
CT samples were manufactured using three different deposition plane angles of layers: β = 0°, β = 45° and β = 90°, as illustrated in Figure 1a–c, respectively.
Figure 2 shows the geometry of specimens used in FCG tests, defined according to ASTM E647 [19]. All specimens were submitted to a polishing process (Rz = 0.6 ± 0.06 µm) in the lateral faces in order to obtain a perfect crack observation.
The FCGR tests were performed in mode I loading (R = 0.05) through the optical measurement of crack length using a traveling microscope (45×) in increments of 0.2 mm, following ASTM E647 recommendations [21]. All tests were carried out at room temperature using 10 kN capacity Instron EletroPuls E10000 equipment. Two different environmental conditions were used in the FCGR tests: a no saline environment (31.89% of relative humidity and 21 °C) and a saline environment (0.5 wt.% and 21 °C). All tests were performed under load control in constant amplitude (ΔP = 2350 N) in a sinusoidal wave with 15 Hz of frequency always in the Paris regime. Crack growth rates were determined by the incremental polynomial method using five consecutive points. The results were plotted as da/dN versus ΔK curves.
Crack closure is the contact of crack flanks during a portion of the load cycle, which decreases the driving force for crack growth, leading to a crack rate slowdown. For this reason, the crack closure level was estimated in all cases. Crack closure can be expressed using the U parameter, which can be calculated by the following equation:
U = P max P op P max P min
The crack-opening load (Pop) is possible to estimate through the correlation coefficient maximization technique [22]. It consists of taking the upper 10% of the load-displacement information and estimating the least-squared correlation coefficient. The subsequent data pair is then added, the correlation coefficient is again calculated, and this procedure is repeated for the entire data set. The point where the correlation coefficient achieves the maximum value defines Pop, and this point represents the slope modification on the load-displacement data (see Appendix A). The load-displacement data were registered through digital image correlation (DIC) for the FCGR tests without saline corrosion. More details about the DIC procedure applied to the load-displacement data record can be consulted in [23]. On the other hand, for the FCGR tests under saline corrosion, the load-displacement data record was performed using four resistive strain gauges placed in specific zones in the crack growth path. As can be observed in Figure 3, these strain gauges were connected to a P-3500 strain indicator, and the signal was acquired using an oscilloscope and Picoscope 6 software. All dispositives that were in contact with the solution were isolated using an anti-corrosion spray.
In addition to this dispositive, FCGR tests under saline corrosion were also coupled with another one, which allowed the saline solution circulation with a fluid mass flow of 23 g/min through two mini-pumps. Figure 4 presents a photograph of all devices. It is important to note that the FCGR tests without corrosion were performed just using the traveling microscope and the DIC devices.
As a complementary study, the measurement of the static corrosion potential for each deposition plane in the saline solution (0.5 wt.%) was realized. The SP-50 Potentiostat/Galvanostat from BioLogic Science Instruments was used for electrochemical measurements with a three-electrode assembly consisting of a working electrode (WE), a saturated calomel electrode (SCE) that works as a reference electrode (RE), and a platinum sheet that works as a counter electrode (CE). The corrosion resistance was evaluated by the potentiodynamic polarization method at a scan rate of 1.5 mV/s. In order to determine the corrosion potential (Ecorr) and corrosion current (Icorr), polarization curves, representing the current density (A/cm2) against the potential (V vs. SCE), were obtained.
The microstructure after LPBF for each series was analyzed according to the standard ASTM E407-99 [24] of metallographic practice, performing a chemical attack with Picral (picric acid solution 4% in ethyl alcohol) for 2 min. After this operation, the microstructures of the samples were observed using a Leica DM4000 M LED optical microscope. Vickers hardness was measured according to ASTM E384-11e1 [25] using a Struers Duramin microhardness tester with a 1 kg load at the surface of the specimens. The microstructural analysis and hardness measurement were done on the surface of the xy plane of the samples (see Figure 1). After fatigue tests, the surfaces of fractured specimens were observed using a Leica DM4000 M LED optical microscope and HITACHI SU3800 SEM.

3. Results

3.1. Metallographic and Hardness Analysis

Figure 5 shows the microstructures obtained for maraging steel 18Ni300 after the LPBF process for different deposition planes. Figure 5a presents a representative microstructure revealed for the deposition plane of 90°, and Figure 5b shows the microstructure obtained for the deposition plane β = 45°. Figure 5c shows the microstructure obtained for the deposition plane β = 0°. As is possible to observe, Figure 5a presents fine martensitic needles highlighted with red arrows; Figure 5b shows a lower amount of fine martensitic needles when compared with Figure 5a, and 5c does not show these microstructures. These facts lead to a different hardness for the different deposition planes: 315.3 HV1 for β = 0°, 350.3 HV1 for β = 45° and 373.3 HV1 for β = 90°.

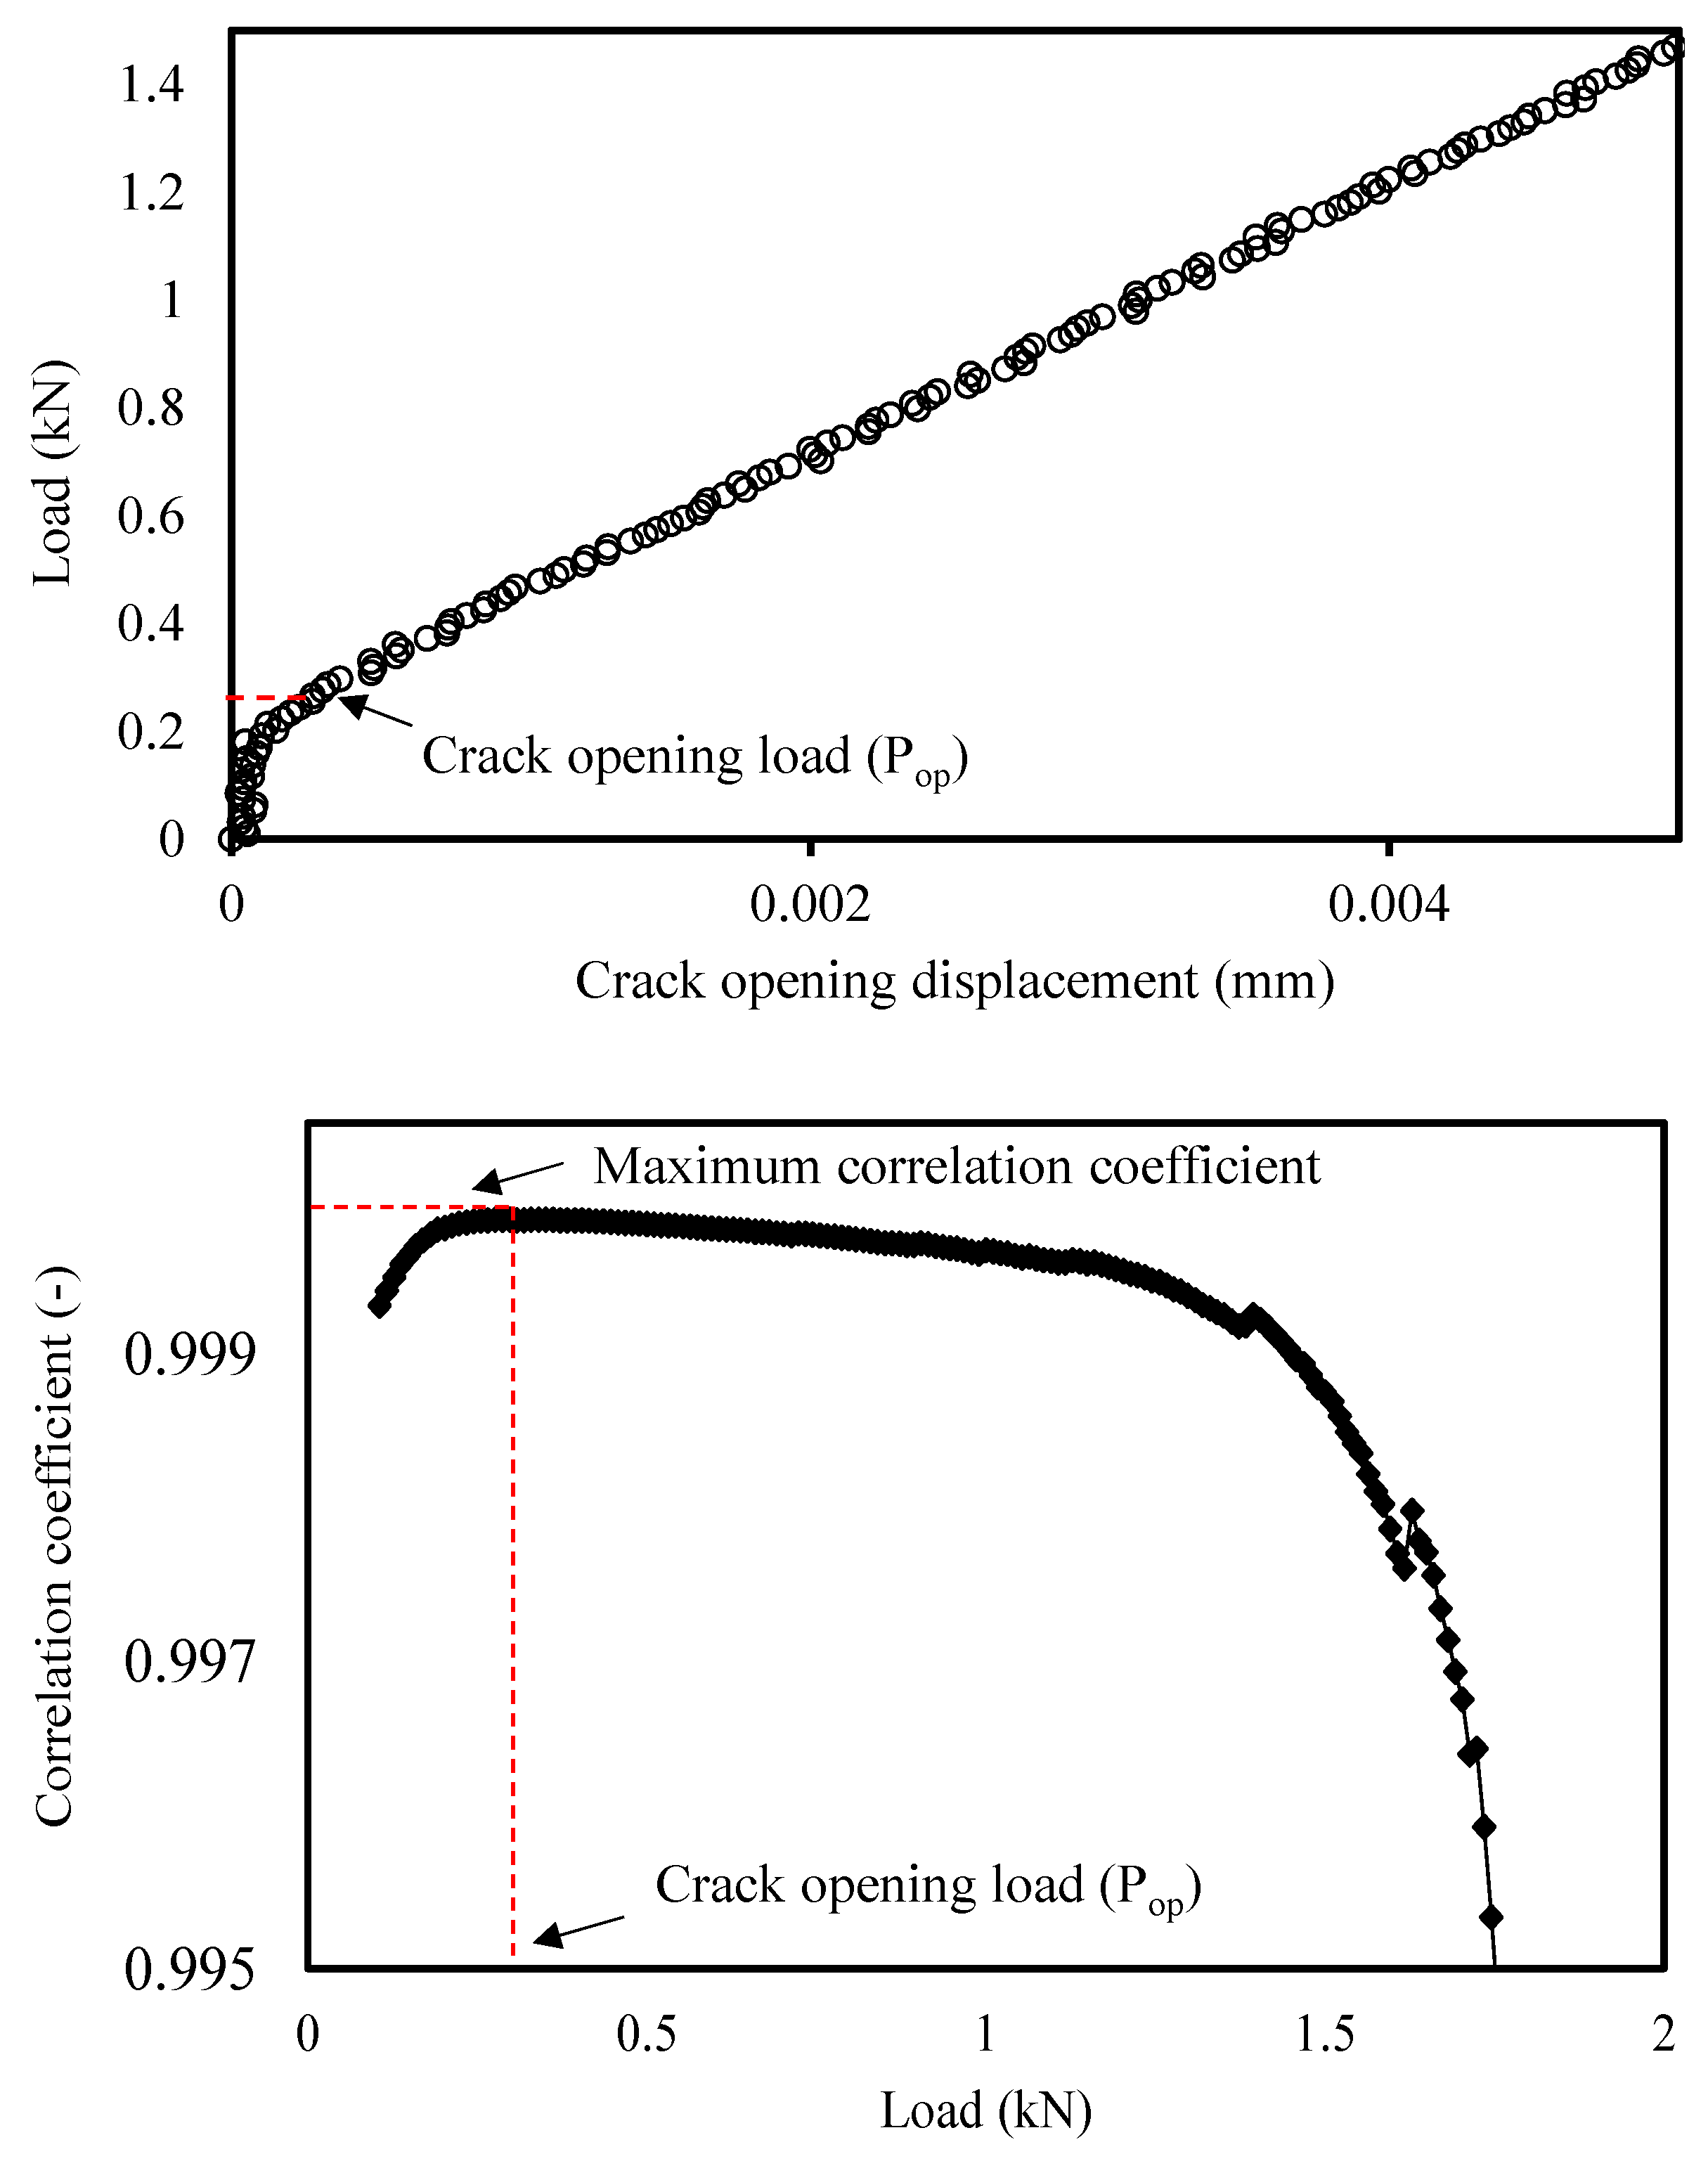
3.2. Fatigue Crack Growth without Saline Corrosion

The da/dN curves obtained without saline corrosion at the Paris regime and for each deposition plane can be observed in Figure 6.
Through this figure, it can be concluded that for the Paris regime, the deposition plane angle relative to the crack growth plane did not have an influence on the fatigue crack growth speed once all curves were in a narrow confidence band, with a low error TΔK = 1.15. This result can be explained by the same crack closure level (induced by plasticity) verified for each deposition plane angle: U = 0.815 for β = 0°, U = 0.8445 for β = 45° and U = 0.817 for β = 90° registered along the Paris regime. Furthermore, the Paris equation parameters for the confidence band at 90% were added to ensure safer use.

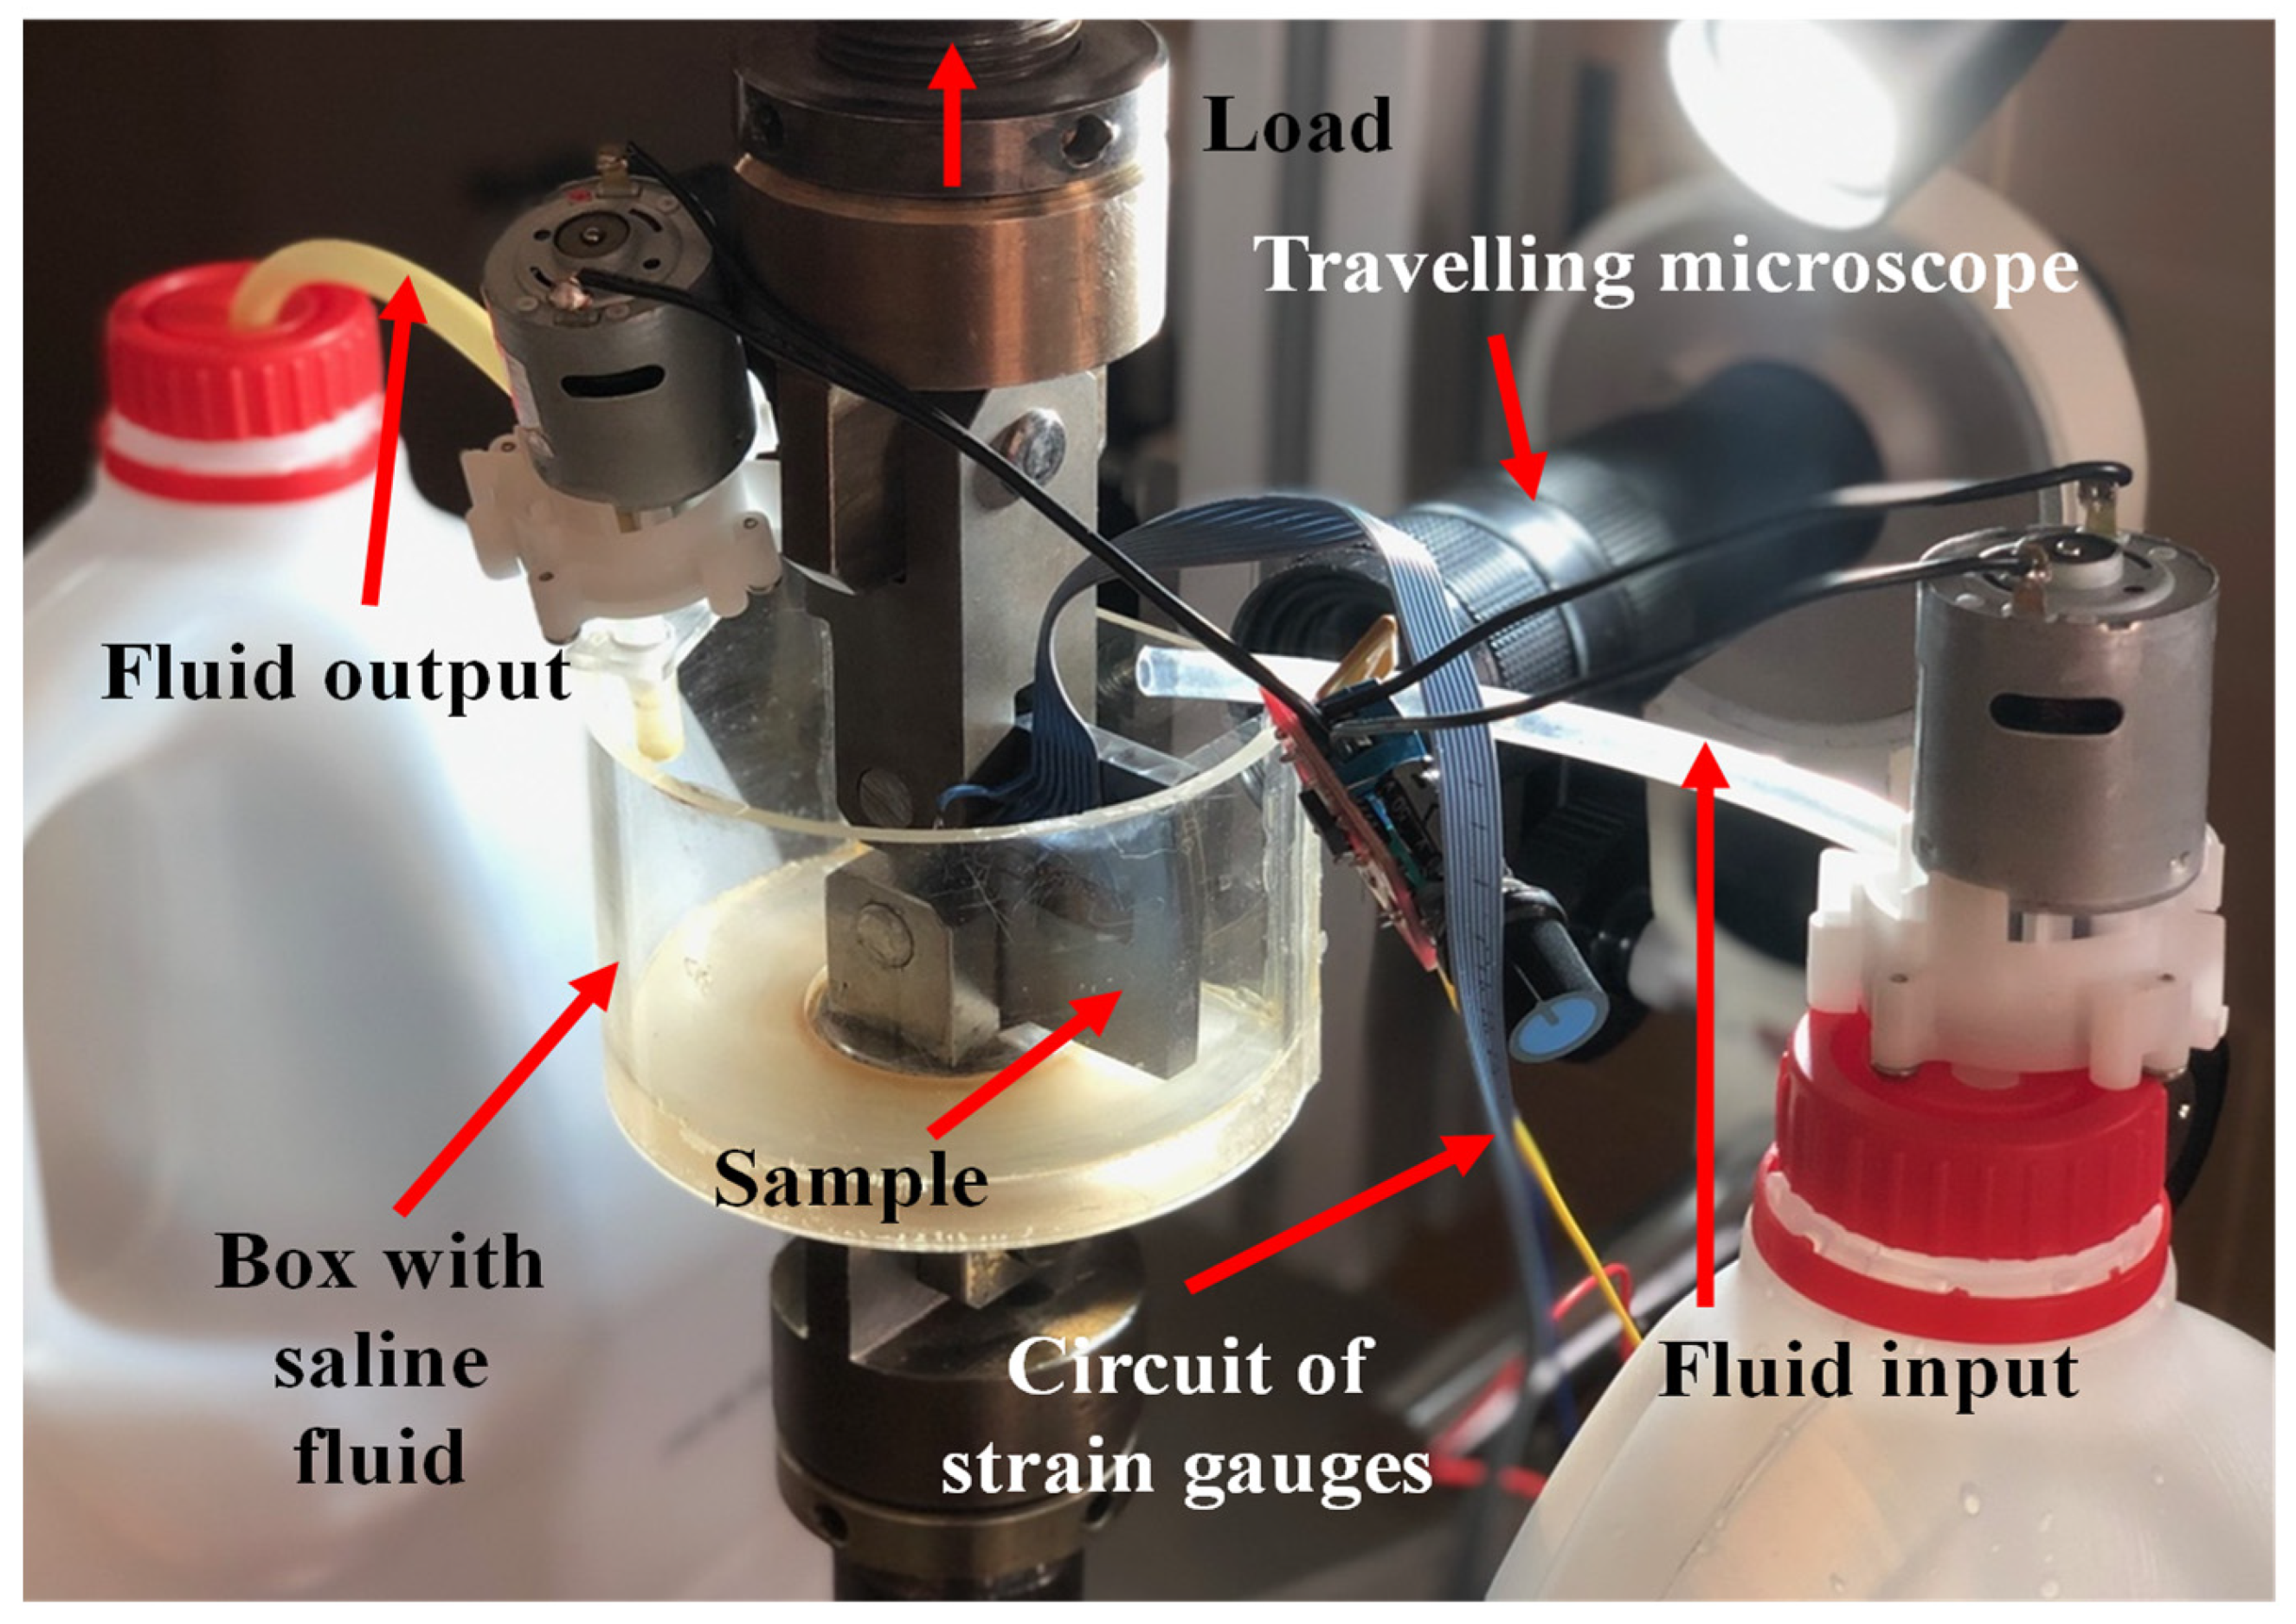
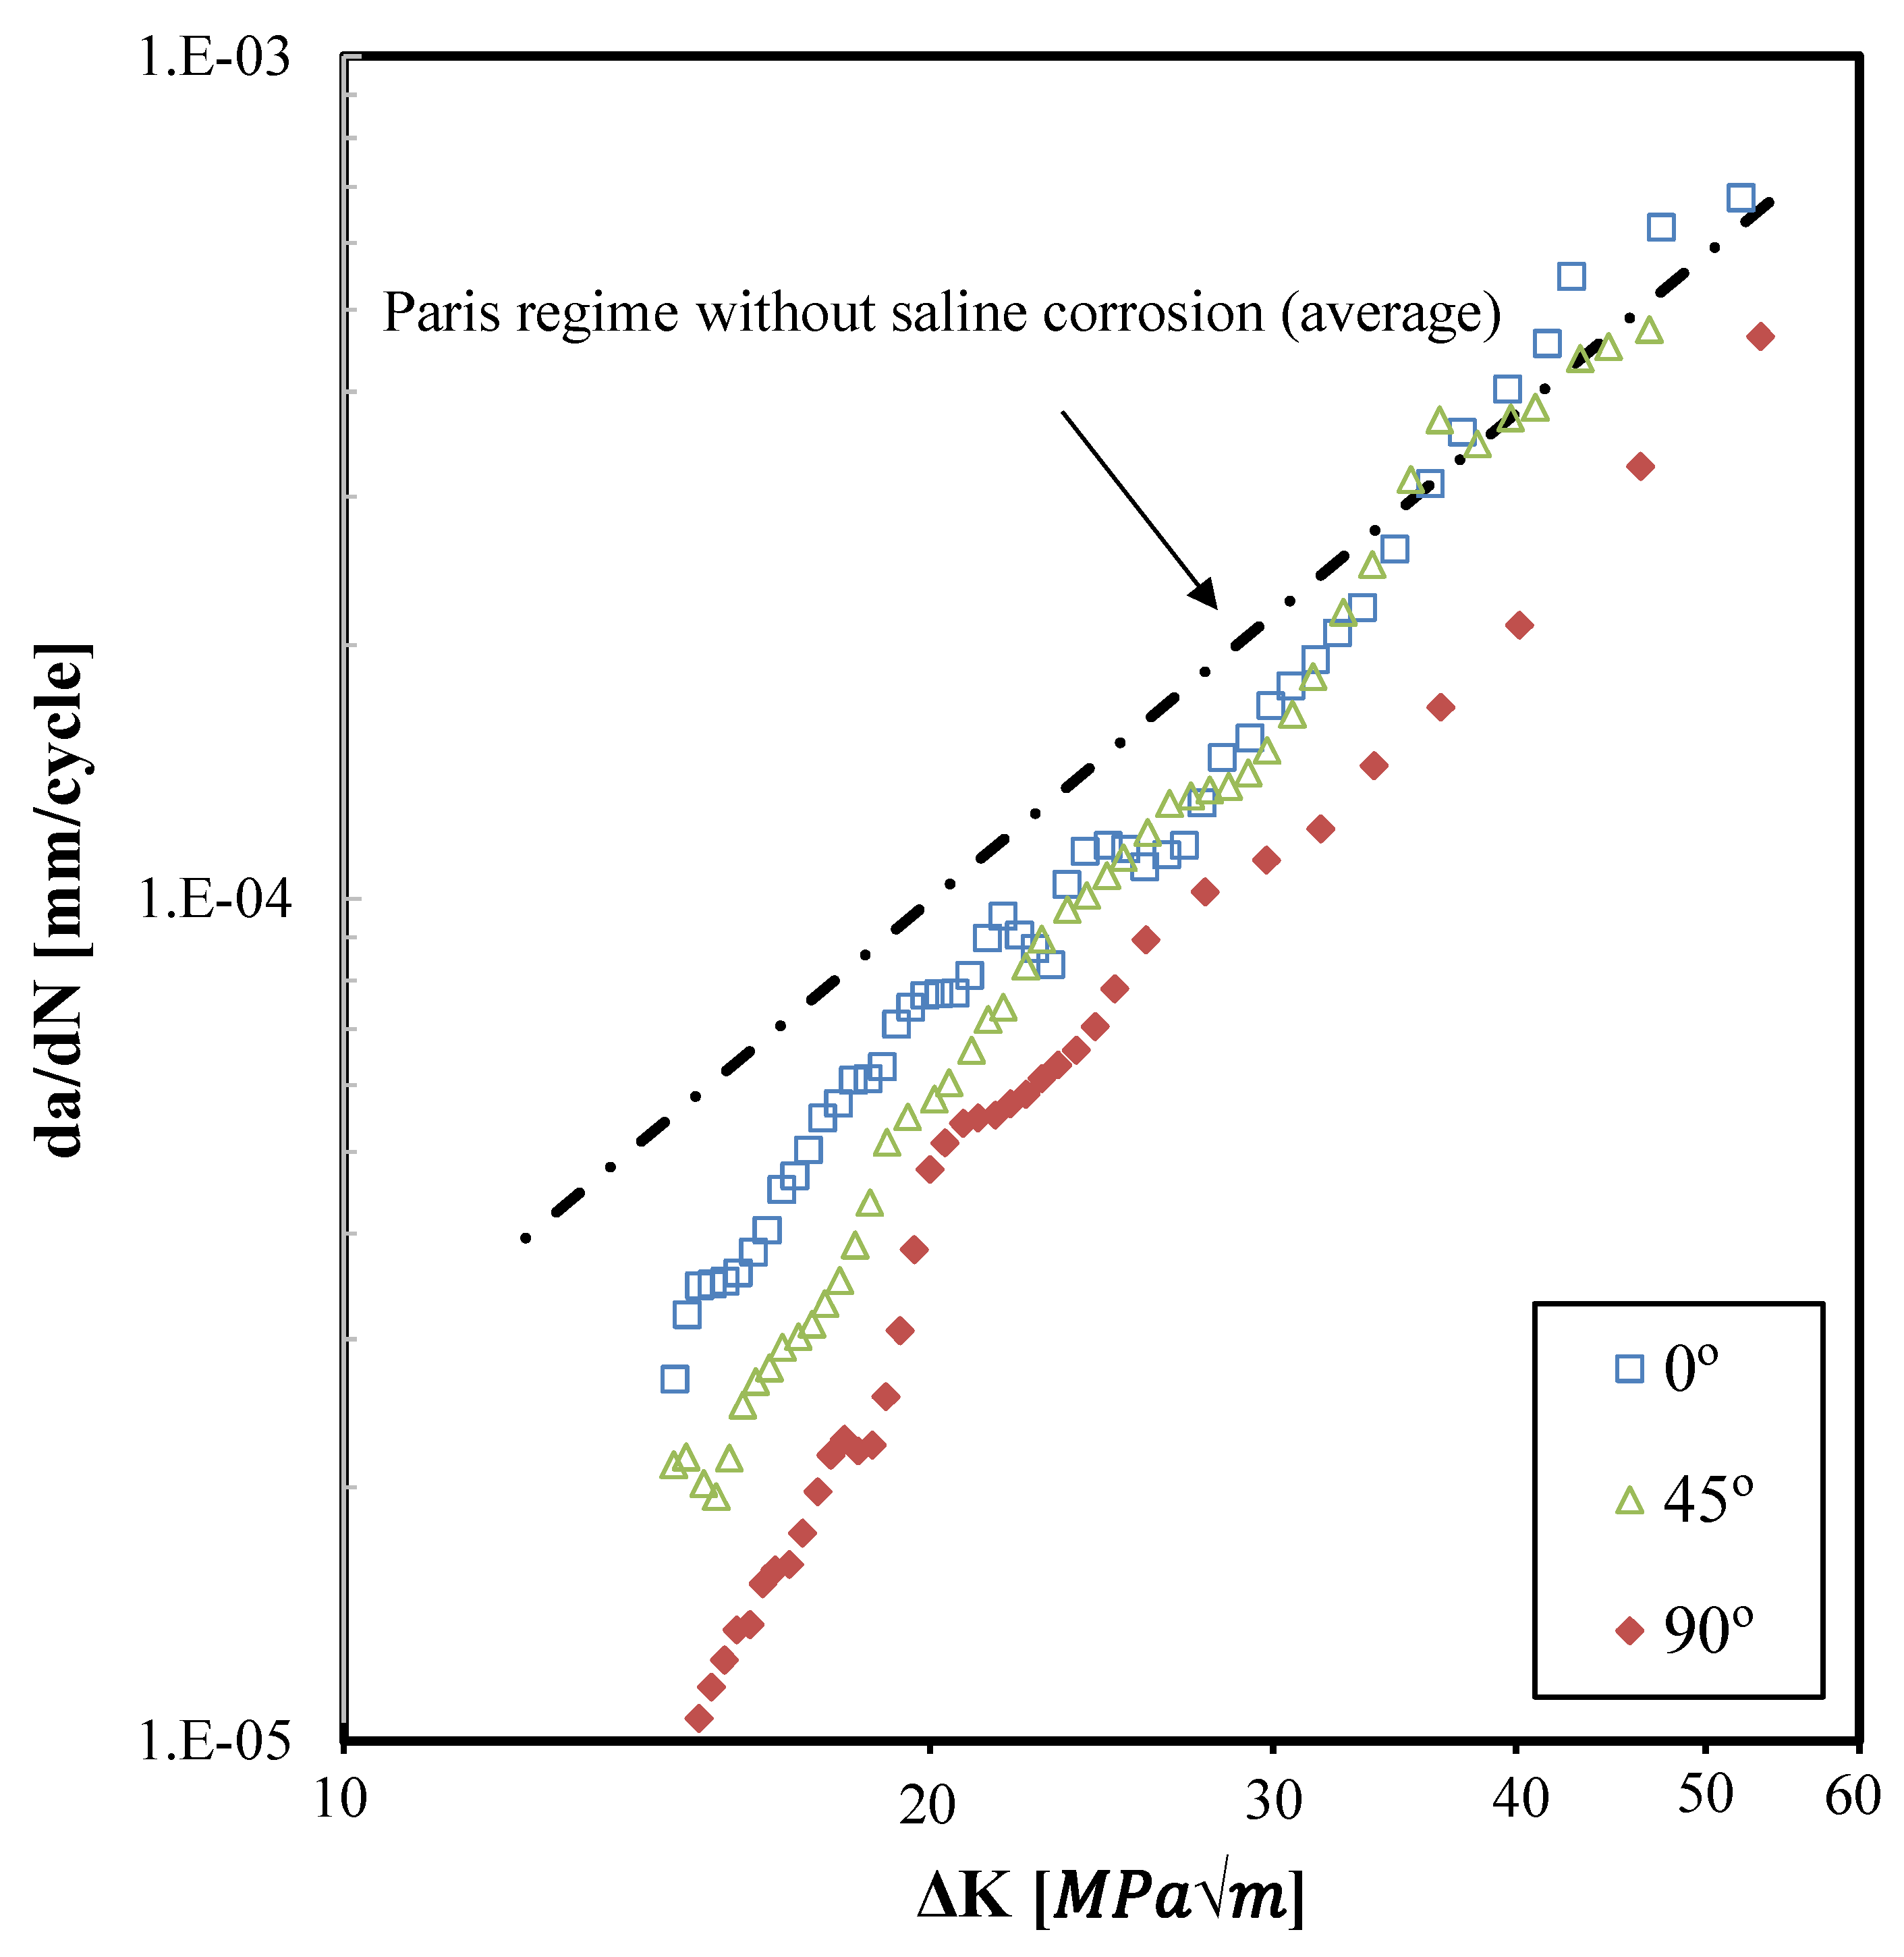
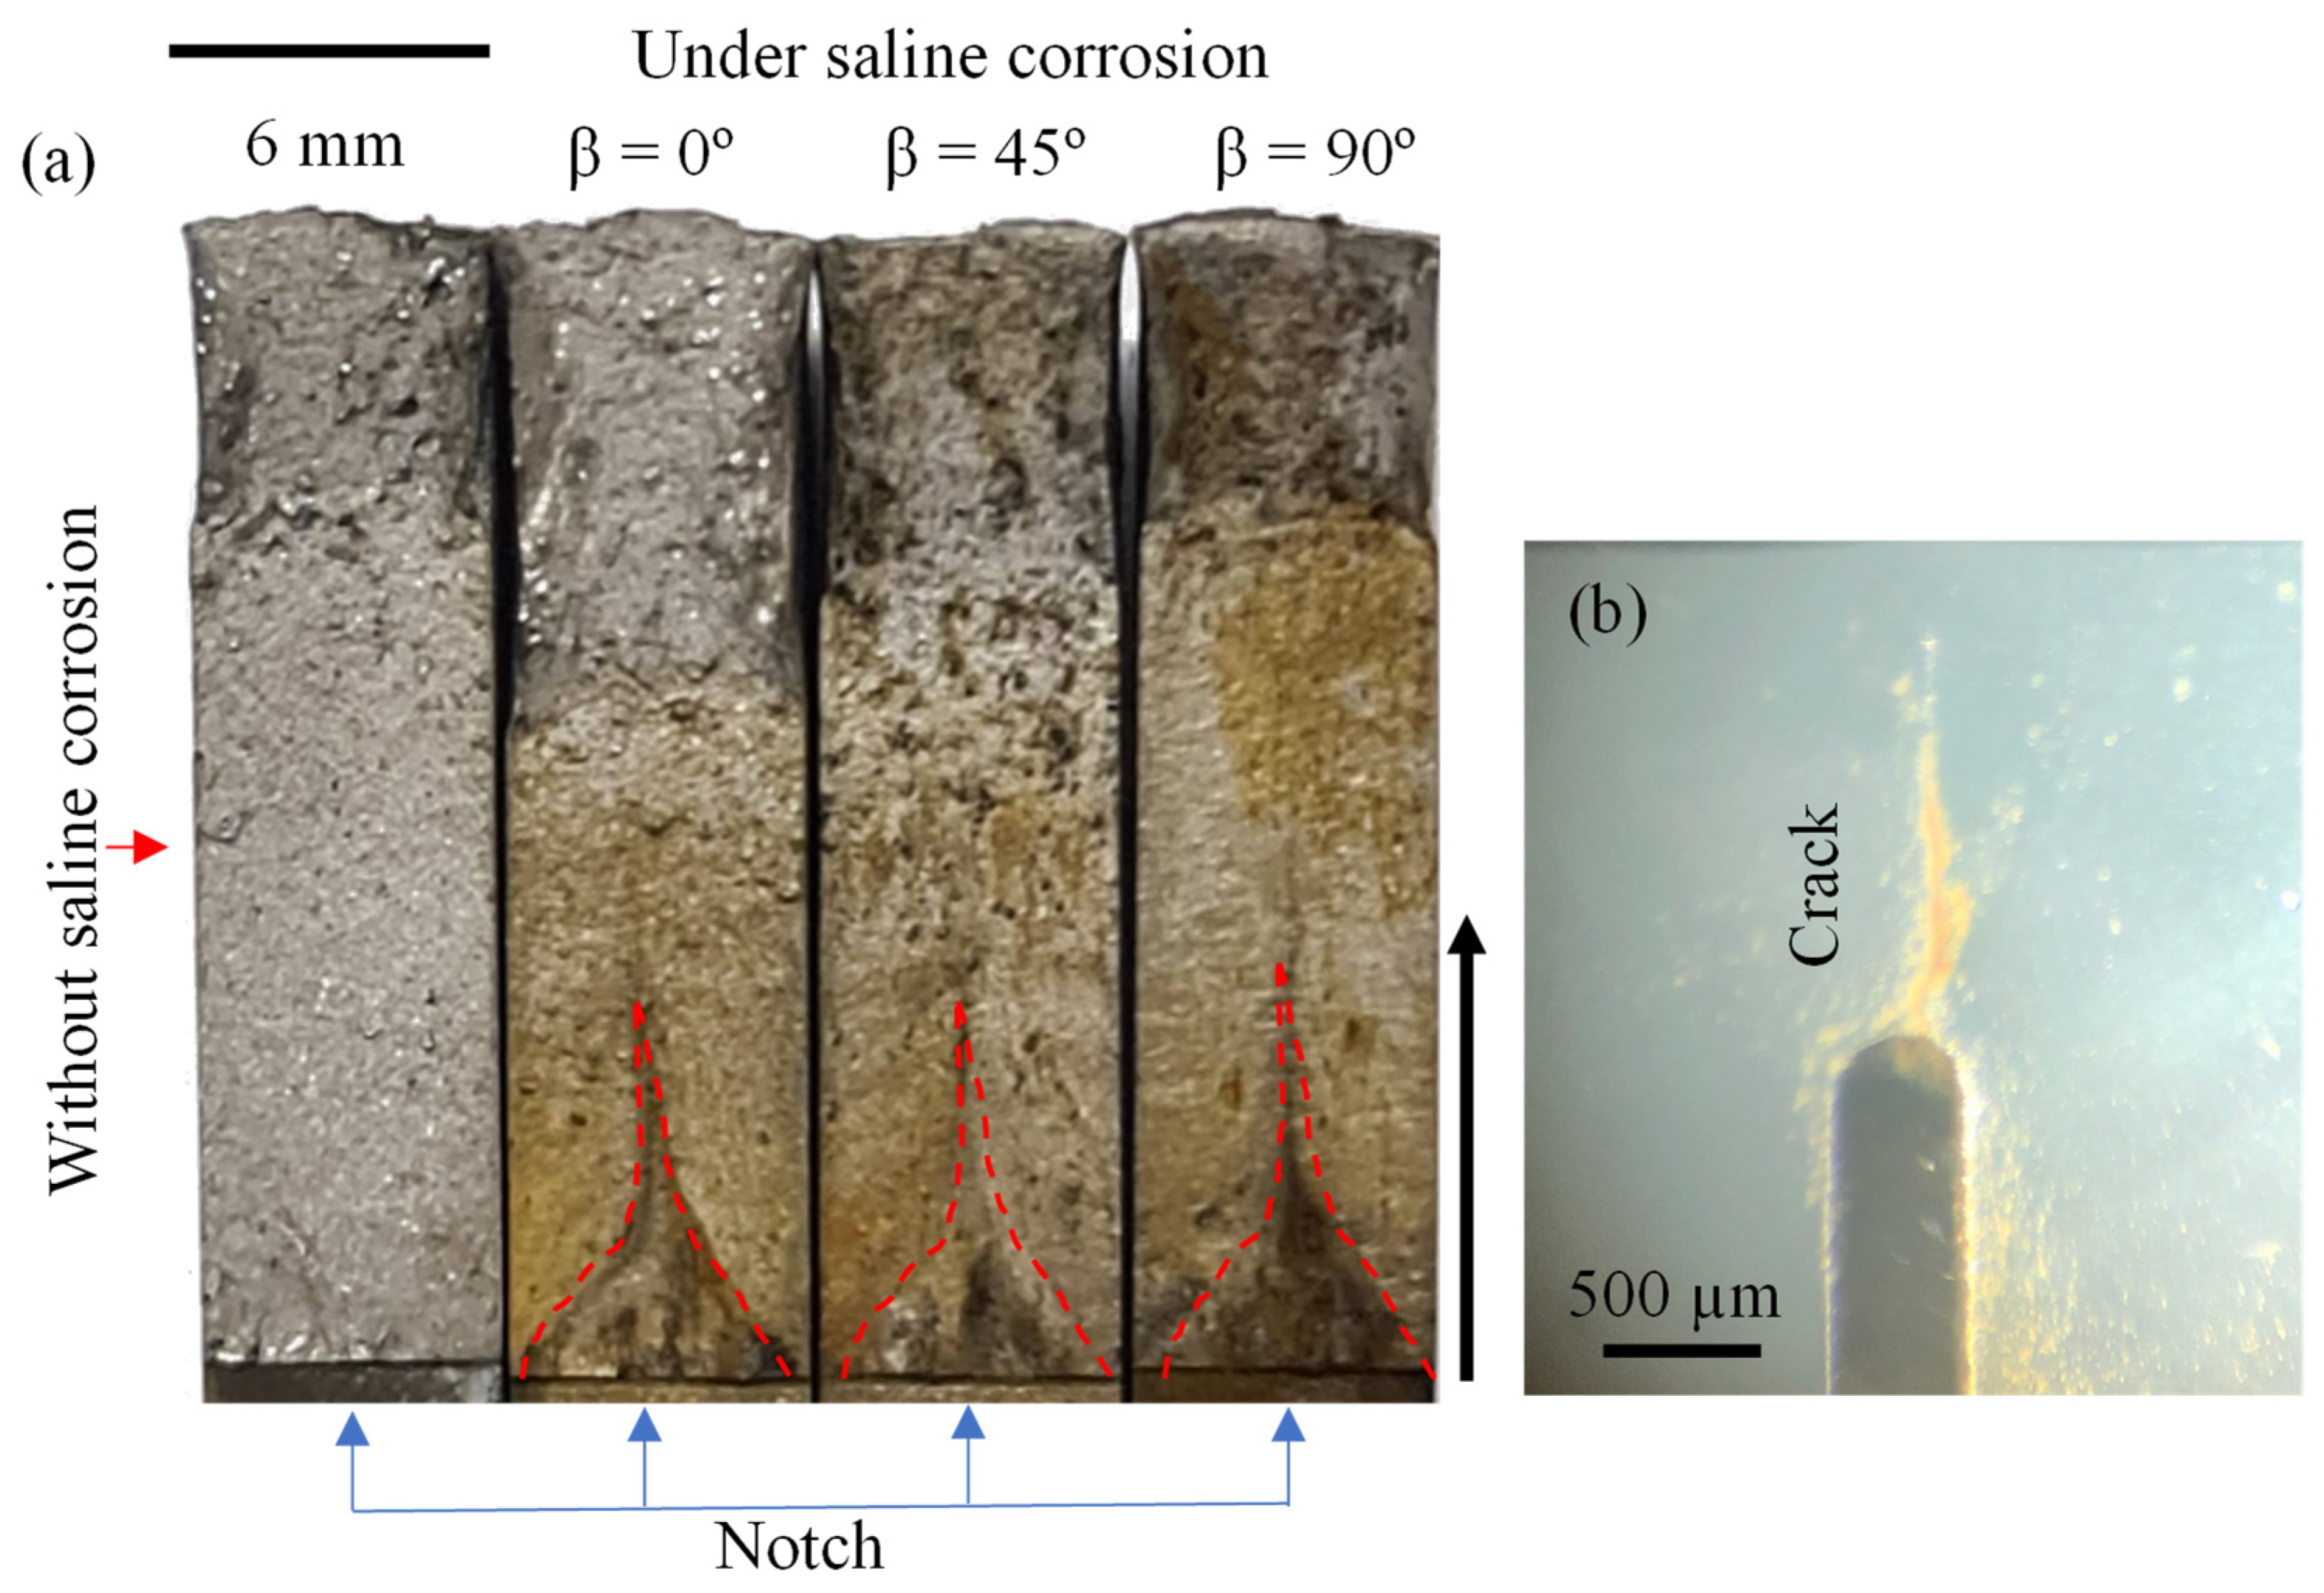
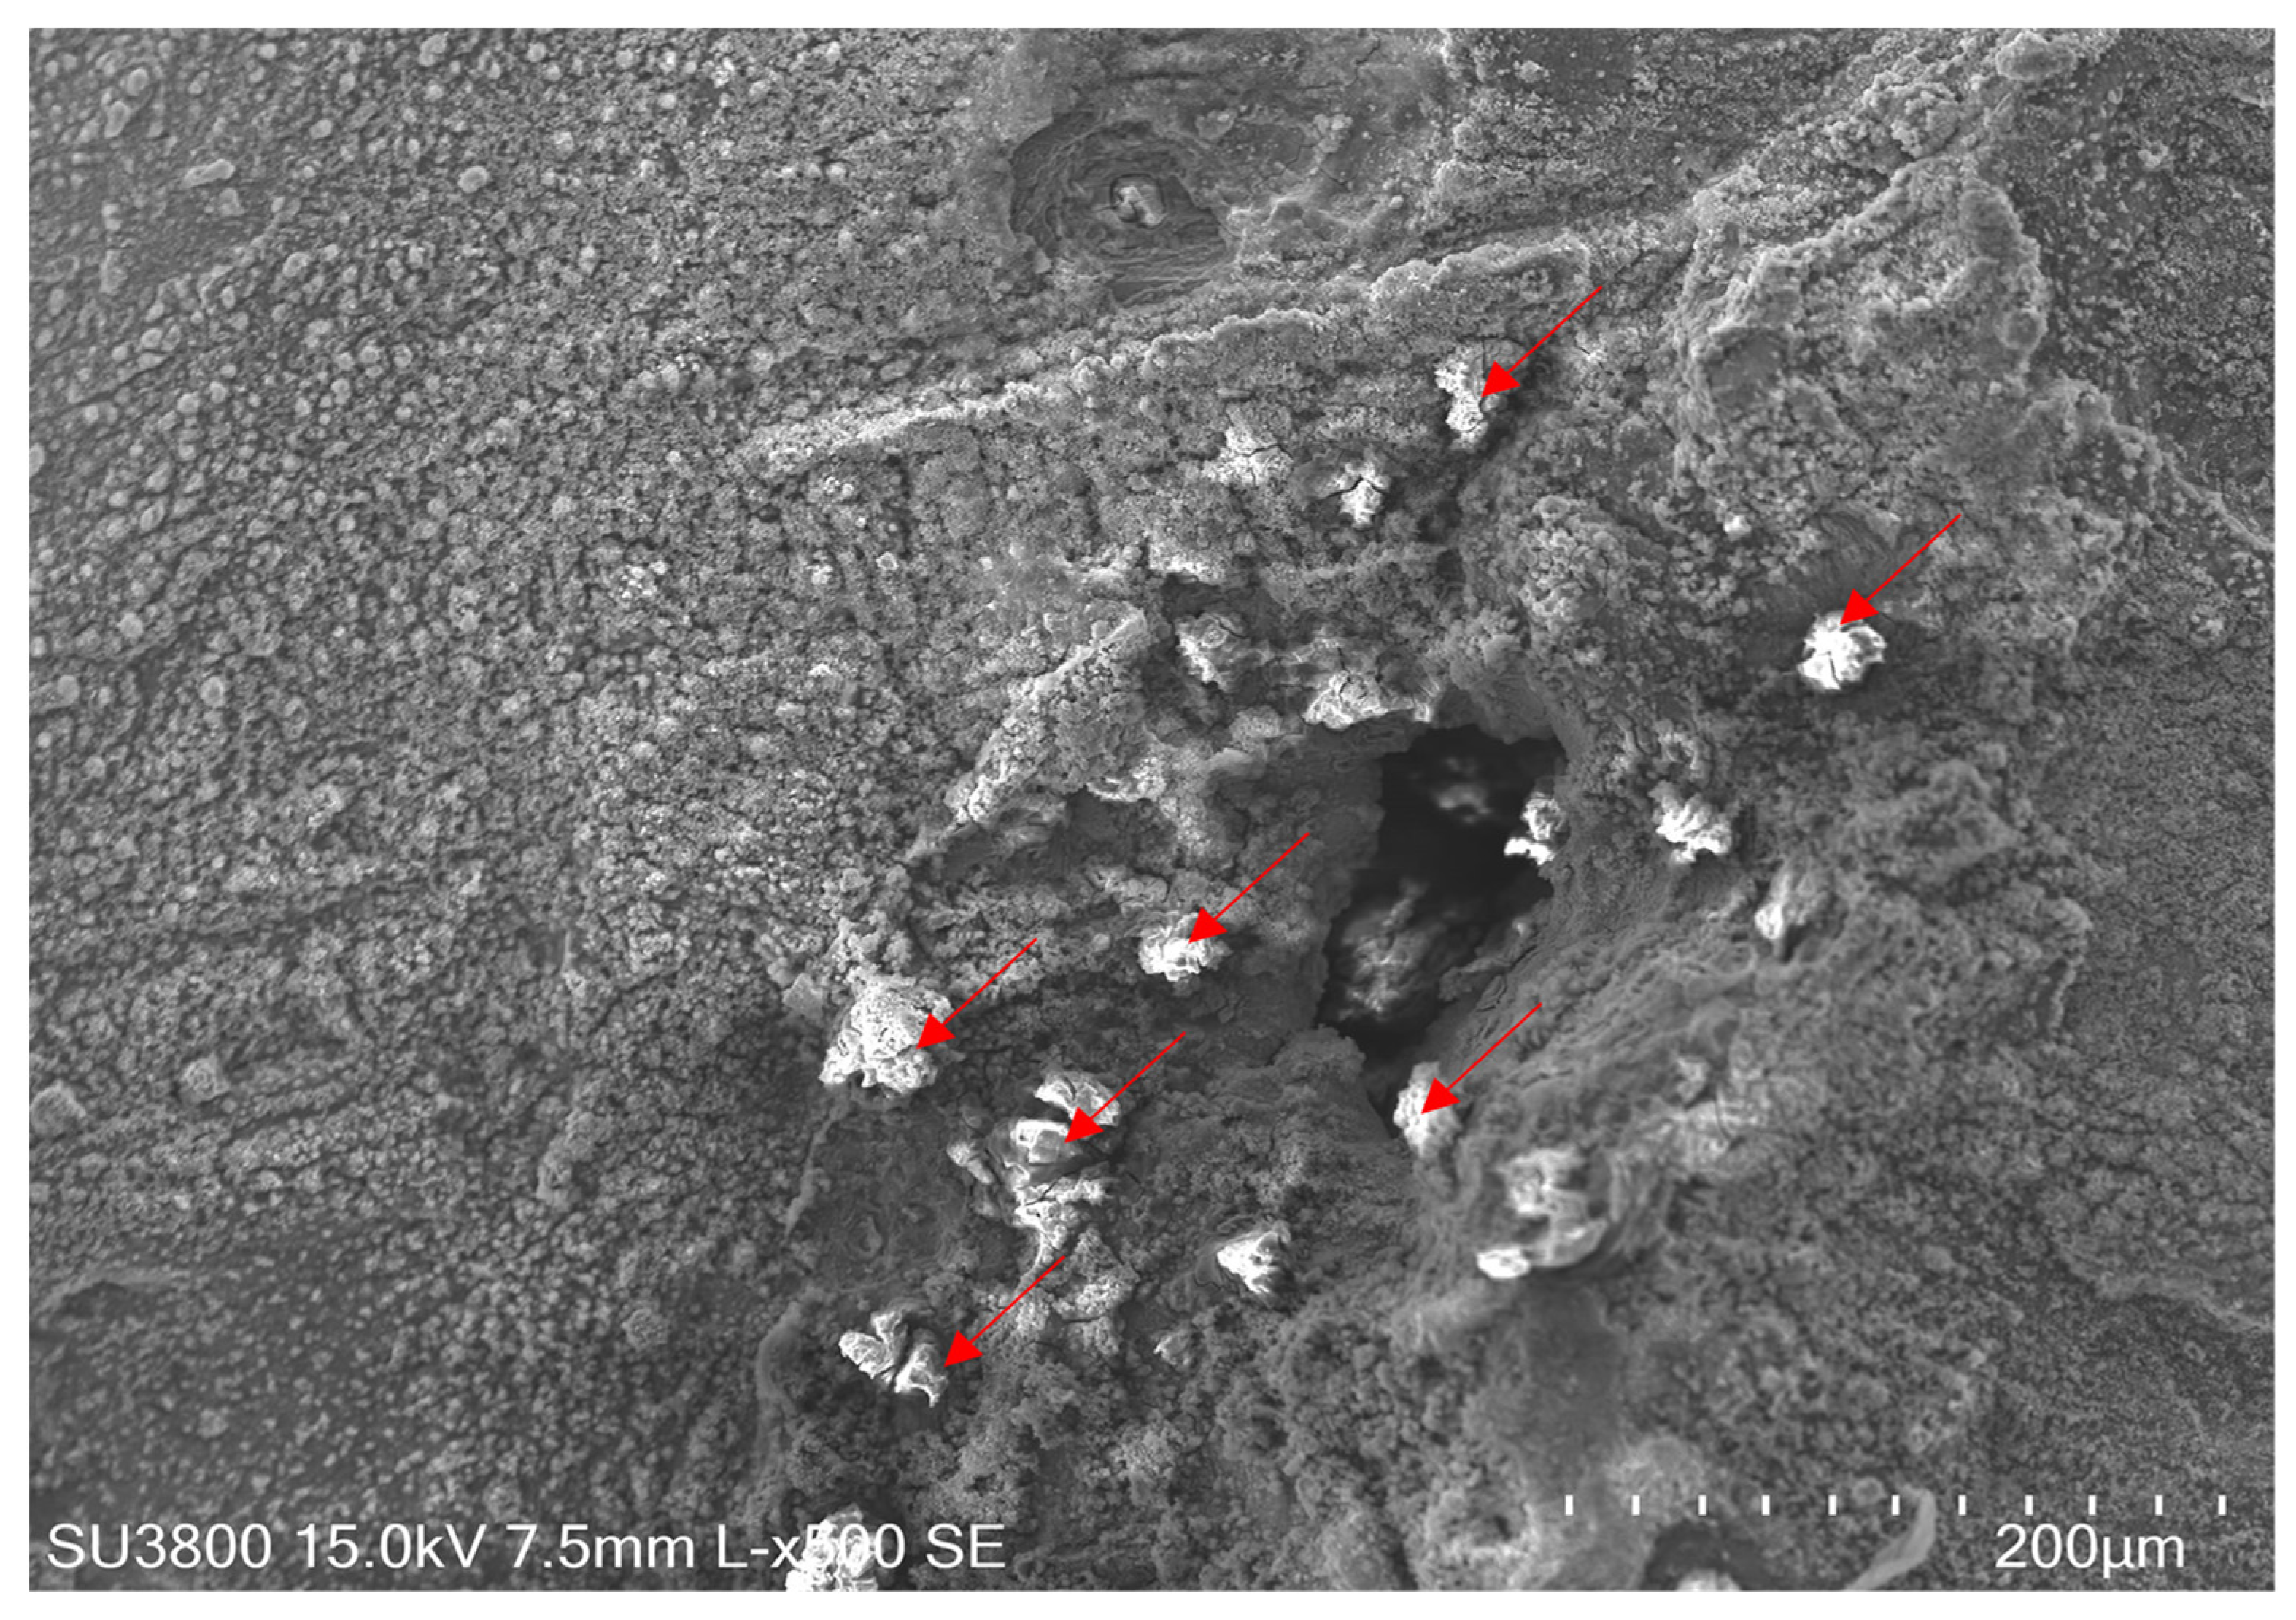
3.3. Fatigue Crack Growth under Saline Corrosion

The da/dN curves obtained under saline corrosion at the Paris regime and for each deposition plane can be analyzed through Figure 7. Furthermore, the average da/dN curve for the Paris regime without saline corrosion was also included in order to compare all series. In a general way, the series submitted to a saline environment showed a lower FCGR speed due to the da/dN curves for β = 0°, β = 45° and β = 90°, which were mostly below the da/dN curve obtained without saline corrosion. However, when comparing the series with different deposition angles under saline corrosion, it is possible to observe that the deposition plane at β = 90° presented a high crack speed decrease, followed by β = 45°, and the higher crack speed belonged to the deposition angle β = 0°. This behavior can be attributed to the different levels of oxidation/corrosion for each series, which is related to the martensite amount presented in each series.
Figure 8 shows the potentiodynamic polarization curves from the static test (without fluid flow) for each deposition angle. It can be seen that for β = 90°, the environment showed a more corrosive action than the other two deposition angles, with the corrosion potential (Ecorr) following the direction of the increasing potentials as follows: β = 90° (Ecorr = −780 mV) < β = 45° (Ecorr = −634 mV) < β = 0° (Ecorr = −584 mV). The corrosion potential for β = 90° is more negative, making the AM 18Ni300 maraging steel have lower corrosion resistance to saline corrosion than the other deposition angles. The corrosion current density showed the following values: β = 0° (icorr = 3.571 × 10⁻⁶ A/cm2) > β = 45° (icorr = 5.334 × 10⁻⁶ A/cm2) > β = 90° (icorr = 7.771 × 10⁻⁶ A/cm2). The corrosion current density was higher in the sample produced with the deposition angle β = 90°, in the same way, showing a lower saline corrosion resistance. From these results, it can be concluded that the samples that presented a higher amount of martensite showed a superior corrosion/oxidation level, which can induce a higher level of crack closure phenomenon due to the oxide debris and consequently provoke a lower FCGR speed. This behavior is in concordance with the results presented in Figure 7, once all series showed a lower FCGR speed than the series tested without saline corrosion (see Figure 7), with a deposition angle β = 90°, the most affected by this behavior for the reasons already described previously.
In order to justify the previous affirmation, Table 2 presents different crack closure levels for each series with respective stress intensity factor range (ΔK). When we compared the values of U = 0.815 for β = 0°, U = 0.8445 for β = 45° and U = 0.817 for β = 90° in air conditioning with the U values on ΔK = 18 and 25 MPam0.5 (Table 2) for the fatigue under saline corrosion, we verified a lower U value for fatigue under saline corrosion. However, for ΔK = 40 MPam0.5 the deposition planes β = 0° and β = 45° showed similar U values to the average U values registered in air conditioning.
Observing the U values and the respective ΔK values in Table 2, it is possible to realize that the crack closure induced by oxides is more pronounced for lower values of ΔK due to the longest action time of corrosion which allows a larger oxide formation, and given that, for lower ΔK, the crack tip opening is low, both phenomena lead a high interaction between the fracture surfaces and the oxides, thus obtaining a lower FCGR speed (see Figure 7). When the ΔK increases, these phenomena suffer from a reduction in the stabilization phase, with the FCGR rate becoming higher and at an almost constant slope. Moreover, the behavior described previously was more evident in the samples produced with β = 90°, with a decrease of these phenomena with the decreasing of martensite amount observed in each series. Finally, it can be said that saline corrosion produced, in these cases, a reduction of FCGR speed due to the emergence of a high level of crack closure induced by oxides allied to the crack closure induced by plasticity in the crack tip when compared with the FCGR tests performed without saline corrosion where the crack closure levels were attributed to testing under saline corrosion. As expected, the fracture surface for the specimen tested without saline corrosion showed an oxide-free surface (red arrow, Figure 9a), while the samples tested under saline corrosion showed an oxidized surface without showing an evident difference between them but presented an interesting phenomenon that can explain the appearance of crack closure induced by oxides. The oxides were expelled from the area delimited by a dashed red line to the outside border, and they accumulated in the lateral face (see Figure 9b), creating an interaction between the fracture surfaces and the oxide debris. This singularity decreased with fatigue crack length, reducing the area delimited by the dashed red line, and was more pronounced until ΔK values of 20 MPam0.5, whereby the da/dN curves in Figure 7 showed different phases in the FCGR speed. On the other hand, the results pointed to a higher amount of oxide debris accumulated in the face of samples with the increase of corrosion/oxide level determinate by the amount of martensite in each series.
Figure 10 shows an example of a fracture surface observed by SEM for fatigue under saline corrosion. This image presents mostly regions of oxide debris (Fe2O3 and FeO) that are “fungus-shaped”. On the other hand, the oxide debris tended to associate and create larger oxide particles (marked by red arrows), which promoted the crack closure induced by oxides. It is noted that these particles were crushed, provoking premature contact between the fracture surfaces.

4. Discussion and Conclusions

The metallographic observation indicated that the deposition plane angle influences the martensite amount created during the LPBF process in the crack growth plane, in which this this microstructure was observed in a higher quantity for β = 90°, followed by β = 45° and β = 0°, thus showing anisotropy with the build direction. This anisotropy also provoked different hardness values depending on the deposition angle, whereby the samples with a higher amount of martensite showed a superior value of hardness. However, this evidence did not have an impact on the FCGR speed in the tests performed without saline corrosion because all showed a relative behavior quite similar and a crack closure level induced by plasticity, which was also very similar. Therefore, instead of the results obtained by Becker et al. [13], where the author concludes that the horizontal samples showed a higher crack growth rate in the as-built condition, based on the results of Figure 6, it is not possible to conclude this, because the results do not show the influence of the deposition plane in the crack growth rate. These results follow the evidence by Croccolo et al. [15]. From this point of view, it is also not possible to evaluate the unfavorable service time of the horizontal sample mentioned in [14].
On the other hand, the amount of martensite showed a direct influence on the corrosion/oxidation level. The samples with a higher quantity of martensite evidenced a superior level of corrosion/oxidation. This behavior has been observed in the past; an increase in the martensite content decreases the resistance to general corrosion [26]. This behavior had a notorious impact on the FCGR speed since the samples that showed a higher content of martensite presented a lower FCGR rate. This behavior was caused by the appearance of crack closure induced by oxides (due to corrosion/oxidation) allied with crack closure induced by plasticity. During cyclic loading, oxide debris particles (Fe2O3 and FeO) are transported from the fracture surfaces to the lateral surface of the samples, as was also observed by Maierhofer et al. [19]. The deposition of this debris of oxide products over several millimeters of crack length produces an oxide wedge that promotes an additional crack closure mechanism (crack closure induced by oxides) and influences the crack propagation rates well within the Paris regime. This is particularly evident for martensitic and bainitic steels, where massive oxide debris is formed [27]. The energy used in order to propagate the crack is expended for crushed and deformed oxide debris. This behavior led to a decrease in the driving force in the crack tip and consequently a decrease in the FCGR rate.

Author Contributions

R.F.F. data curation, experimental tests, writing—original draft. J.d.J. data curation, formal analysis, methodology, experimental tests, validation, writing—original draft; L.B. funding acquisition, project administration, supervision, writing—review and editing, resources; L.V. writing—review and editing, potentiodynamic curves; A.R. electric circuits, signals acquisition; J.A.M.F. project administration, supervision. All authors have read and agreed to the published version of the manuscript.

Funding

This research was sponsored by the project POCI-01-0247-FEDER-042536 financed by European Funds through program COMPETE2020 under the Eureka smart label S0129-AddDies, FEDER funds through the program COMPETE—Programa Operacional Factores de Competitividade, and national funds through FCT—Fundação para a Ciência e a Tecnologia, under project UIDB/00285/2020.

Institutional Review Board Statement

Not applicable.

Informed Consent Statement

Not applicable.

Data Availability Statement

The data presented in this study are available on request from the corresponding author. The data are not publicly available due to privacy.

Acknowledgments

Aluport company by manufacturing the samples.

Conflicts of Interest

The authors declare to have no conflicts of interest.

Appendix A

Figure A1. Graphical procedure of the correlation coefficient maximization technique.
Metals 12 00433 g0a1

References

  1. Zitelli, C.; Folgarait, P.; Di Schino, A. Laser powder bed fusion of stainless steel grades: A review. Metals 2019, 9, 731. [Google Scholar] [CrossRef] [Green Version]
  2. Zhu, H.M. Effects of aging time on the microstructure and mechanical properties of laser-cladded 18Ni300 maraging steel. Mater. Sci. 2021, 56, 8835–8847. [Google Scholar] [CrossRef]
  3. Kempen, K.; Yasa, E.; Thijs, L.; Kruth, J.; Humbeeck, J. Van Microstructure and mechanical properties of Selective Laser Melted. Phys. Procedia 2011, 12, 255–263. [Google Scholar] [CrossRef] [Green Version]
  4. Tan, C.; Wang, D.; Ma, W.; Chen, Y.; Chen, S.; Yang, Y.; Zhou, K. Design and additive manufacturing of novel conformal cooling molds. Mater. Des. 2020, 196, 109147. [Google Scholar] [CrossRef]
  5. Simonelli, M.; Tse, Y.; Tuck, C.J. Microstructure and mechanical properties of Ti-6A1-4V fabricated by selective laser melting. In Proceedings of the TMS Annual Meeting, Orlando, FL, USA, 11–15 March 2012; Volume 1, pp. 863–870. [Google Scholar] [CrossRef]
  6. Shamsdini, S.A.R.; Pirgazi, H.; Ghoncheh, M.H.; Sanjari, M.; Amirkhiz, B.S.; Kestens, L.; Mohammadi, M. A relationship between the build and texture orientation in tensile loading of the additively manufactured maraging steels. Addit. Manuf. 2021, 41, 101954. [Google Scholar] [CrossRef]
  7. Dovgyy, B.; Pham, M.S. Epitaxial growth in 316L steel and CoCrFeMnNi high entropy alloy made by powder-bed laser melting. AIP Conf. Proc. 2018, 1960, 140008. [Google Scholar] [CrossRef]
  8. Lewandowski, J.J.; Seifi, M. Metal Additive Manufacturing: A Review of Mechanical Properties. Annu. Rev. Mater. Res. 2016, 46, 151–186. [Google Scholar] [CrossRef] [Green Version]
  9. Solberg, K.; Hovig, E.W.; Sørby, K.; Berto, F. Directional fatigue behaviour of maraging steel grade 300 produced by laser powder bed fusion. Int. J. Fatigue 2021, 149, 106229. [Google Scholar] [CrossRef]
  10. Solberg, K.; Berto, F. Notch-defect interaction in additively manufactured Inconel 718. Int. J. Fatigue 2019, 122, 35–45. [Google Scholar] [CrossRef]
  11. Santos, L.M.; Jesus, J.S.; Ferreira, J.M.; Costa, J.D.; Capela, C. Fracture Toughness of Conventional Steel Parts with 18Ni300 Steel Implants Built by Selective Laser Melting. Appl. Sci. 2018, 8, 1879. [Google Scholar] [CrossRef] [Green Version]
  12. Branco, R.; Costa, J.D.; Martins Ferreira, J.A.; Capela, C.; Antunes, F.V.; Macek, W. Multiaxial fatigue behaviour of maraging steel produced by selective laser melting. Mater. Des. 2021, 201, 109469. [Google Scholar] [CrossRef]
  13. Hermann Becker, T.; Dimitrov, D. The achievable mechanical properties of SLM produced Maraging Steel 300 components. Rapid Prototyp. J. 2016, 22, 487–494. [Google Scholar] [CrossRef]
  14. Damon, J.; Hanemann, T.; Dietrich, S.; Graf, G.; Lang, K. Orientation dependent fatigue performance and mechanisms of selective laser melted maraging steel X3NiCoMoTi18-9-5. Int. J. Fatigue 2019, 127, 395–402. [Google Scholar] [CrossRef]
  15. Croccolo, D.; Agostinis, M.; Fini, S.; Olmi, G.; Robusto, F.; Kostić, S.C.; Morača, S.; Bogojević, N. Sensitivity of direct metal laser sintering Maraging steel fatigue strength to build orientation and allowance for machining. Fatigue Fract. Eng. Mater. Struct. 2019, 42, 374–386. [Google Scholar] [CrossRef] [Green Version]
  16. Wang, B.; Zhang, P.; Duan, Q.Q.; Zhang, Z.J.; Yang, H.J.; Li, X.W.; Zhang, Z.F. Optimizing the fatigue strength of 18Ni maraging steel through ageing treatment. Mater. Sci. Eng. A 2017, 707, 674–688. [Google Scholar] [CrossRef]
  17. Shahriari, A.; Khaksar, L.; Nasiri, A.; Hadadzadeh, A.; Amirkhiz, B.S.; Mohammadi, M. Microstructure and corrosion behavior of a novel additively manufactured maraging stainless steel. Electrochim. Acta 2020, 339, 135925. [Google Scholar] [CrossRef]
  18. Bouzakis, E.; Arvanitidis, A.; Kazelis, F.; Maliaris, G.; Michailidis, N. Comparison of Additively Manufactured vs. Conventional Maraging Steel in Corrosion-Fatigue Performance after various surface treatments. Procedia CIRP 2020, 87, 469–473. [Google Scholar] [CrossRef]
  19. Maierhofer, J.; Simunek, D.; Gänser, H.P.; Pippan, R. Oxide induced crack closure in the near threshold regime: The effect of oxide debris release. Int. J. Fatigue 2018, 117, 21–26. [Google Scholar] [CrossRef]
  20. Antunes, F.; Santos, L.; Capela, C.; Ferreira, J.; Costa, J.; Jesus, J.; Prates, P. Fatigue crack growth in maraging steel obtained by Selective Laser Melting. Appl. Sci. 2019, 9, 4412. [Google Scholar] [CrossRef] [Green Version]
  21. ASTM E647. Standard Test Method for Measurement of Fatigue Crack Growth Rates; ASTM B. Stand; ASTM: West Conshohocken, PA, USA, 2016; pp. 1–49. [Google Scholar]
  22. Allison, J.E.; Ku, R.C.; Pompetzki, M.A. A comparison of measurement methods and numerical procedures for the experimental characterization of fatigue crack closure. In Mechanics of Fatigue Crack Closure, ASTM STP 982; Newman, J.C., Jr., Elber, W., Eds.; American Society for Testing and Materials: West Conshohocken, PA, USA, 1988; pp. 171–185. [Google Scholar]
  23. Jesus, J.S.; Borrego, L.P.; Ferreira, J.A.M.; Costa, J.D.M.; Capela, C.A. Fatigue crack growth behaviour in Ti6Al4V alloy specimens produced by selective laser melting. Int. J. Fract. 2020, 223, 123–133. [Google Scholar] [CrossRef]
  24. ASTM E407-99; Standard Practice for Microetching Metals and Alloys. ASTM International: West Conshohocken, PA, USA, 1999.
  25. ASTM E384-11e1; Standard Test Method for Knoop and Vickers Hardness of Materials. ASTM International: West Conshohocken, PA, USA, 2011.
  26. Van Bennekom, A.; Matihews, L.M.; Tarboton, J.N.; Robinson, F.P.A. The effect of martensite content on the corrosion and mechanical properties of dual·phasc 12 per cent Cr steels. INFACON 6. In Proceedings of the 1st International Chromium Steel and Alloys Congress, Cape Town, South Africa, 8–11 March 1992; Volume 2, pp. 157–163. [Google Scholar]
  27. Madia, M.; Vojtek, T.; Duarte, L.; Zerbst, U.; Pokorný, P.; Jambor, M.; Hutař, P. Determination of fatigue crack propagation thresholds for steel in presence of environmental effects. Int. J. Fatigue 2021, 153, 106449. [Google Scholar] [CrossRef]
Figure 1. Disposition planes used in the LPBF process. (a) β = 0°, (b) β = 45° and (c) β = 90°.
Metals 12 00433 g001
Figure 2. Specimen geometry (mm).
Metals 12 00433 g002
Figure 3. Load-displacement data register for FCGR tests under saline corrosion. (a) Schematic view of the apparatus, (b) Real view of the apparatus.
Metals 12 00433 g003
Figure 4. Testing apparatus for FCGR tests under saline corrosion.
Metals 12 00433 g004
Figure 5. Metallographic photographs. (a) deposition plane 90°, (b) deposition plane, β = 45°, and (c) deposition plane, β = 0°.
Metals 12 00433 g005
Figure 6. da/dN curves for β = 0°, β = 45° and β = 90°, R = 0.05.
Metals 12 00433 g006
Figure 7. da/dN curves for β = 0°, β = 45° and β = 90° under saline corrosion.
Metals 12 00433 g007
Figure 8. Potentiodynamic polarization curves: Static test.
Metals 12 00433 g008
Figure 9. Fracture surfaces. (a) Fracture surfaces of all series and (b) crack path in the lateral face of sample tested under saline corrosion.
Metals 12 00433 g009
Figure 10. Fracture surface observed by SEM, β = 90° under saline corrosion.
Metals 12 00433 g010
Table 1. Chemical composition of the material (wt.%).
SteelCNiCoMoTiAlCrPSiMnFe
18Ni3000.0118.29.05.00.60.050.30.010.10.04Balance
Table 2. Crack closure levels for each series as a function of ΔK (MPam0.5) under saline corrosion.
βUΔKΔKeffUΔKΔKeffUΔKΔKeff
0.7341813.20.7682519.20.8794035.2
45°0.6921812.40.7512518.80.8714034.8
90°0.515189.30.6782516.90.6814027.2
Publisher’s Note: MDPI stays neutral with regard to jurisdictional claims in published maps and institutional affiliations.

