Article

Evolution of Structure in AlCoCrFeNi High-Entropy Alloy Irradiated by a Pulsed Electron Beam

1
Institute of Laser and Optoelectronic Intelligent Manufacturing, Wenzhou University, Wenzhou 325024, China
2
Department of Natural Sciences, Siberian State Industrial University, 42, Kirov Street, 654007 Novokuznetsk, Russia
3
Department of Metals Technology and Aviation Materials, Samara National Research University, 443086 Samara, Russia
4
Institute of High Current Electronics of the Siberian Branch of the RAS, 634055 Tomsk, Russia
*
Author to whom correspondence should be addressed.
Metals 2021, 11(8), 1228; https://doi.org/10.3390/met11081228
Submission received: 20 June 2021 / Revised: 29 July 2021 / Accepted: 30 July 2021 / Published: 1 August 2021
(This article belongs to the Special Issue Microstructure and Mechanical Properties of High-Entropy Alloys)

Abstract

:
High-current pulsed electron-beam (HCPEB) surface modification of Al-Co-Cr-Fe-Ni high-entropy alloy (wt. %) Al—15.64; Co—7.78; Cr—8.87; Fe—22.31; Ni—44.57, fabricated via wire-arc additive manufacturing was studied. The initial condition of the sample is characterized by a highly inhomogeneous distribution of the chemical elements that form the alloy. The alloy samples were irradiated with the different electron beam energy densities of 10, 20 and 30 J/cm2. The surface structure was then analyzed in relation to an energy deposition mode. The study has established that HCPEB induces a high-speed crystallization structure with cells varying in size from 100 to 200 nm. There are nano-dimensional (15–30 nm) second-phase inclusions enriched with atoms of Cr and Fe along the grain boundaries. The most liquating elements are Cr and Al. Electron beam surface modification of the high-entropy alloy induces its homogenization. The study has highlighted that the mode of 20 J/cm2, 50 µs, 3 pulses, 0.3 s−1 results in the formation of a surface layer with the most homogenously distributed chemical elements.

1. Introduction

In the early 21st century, scientists began developing and thoroughly examining so-called high-entropy alloys (HEAs) consisting of at least five principal elements in equal or close to equal atomic ratios [1,2]. The previous studies have shown that HEAs mostly form simple face center cubic (FCC), body center cubic (BCC), or FCC + BCC solid solution structures instead of lots of intermetallics, which can be explained by the solid solution formation rules proposed by Zhang et al. [3,4]. There are four core effects of HEAs that are usually used to describe the concept of these alloys: the high entropy effect, the lattice distortion effect, sluggish diffusion, and the “cocktail” effect [5,6]. Due to these effects, the innovative concept of HEAs results in a significant number of alloys with extraordinary properties, such as high hardness [7], high wear resistance [8], excellent strength at cryogenic temperatures [9], superconductivity [10], etc.
Al-Co-Cr-Fe-Ni is one of the most widely studied HEA systems. The alloys’ phase composition depends on the content of each element and varies from a ductile FCC to a brittle BCC structure with increasing Al content [11]. Various preparation methods have been adopted to fabricate this HEA, including traditional routes such as vacuum arc melting [12], laser cladding [13] and powder metallurgy [14], as well as additive manufacturing technologies like selective laser melting [15], wire-arc additive manufacturing [16], electron-beam melting [17] and direct laser deposition [18]. One of the most promising methods for manufacturing large-sized parts with complex geometry is wire-arc additive manufacturing. The results obtained in previous studies showed that Al-Co-Cr-Fe-Ni fabricated by wire-arc additive manufacturing has a high hardness but a relatively brittle structure [16,19]. Some defects such as pores, roughness, and microstructure inhomogeneity are induced in HEA during the manufacturing process. To eliminate these defects, surface modification has been recognized as an effective way to radically optimize the microstructure and significantly improve the overall performance of the surface [20].
Many efforts have been devoted to improving the surface properties of HEAs using various external energy sources. For instance, ultrasonic surface modification [21], laser shock peening [22], plasma nitriding [23], carburization [24,25], and high-current pulsed electron beam (HCPEB) surface modification [20,26,27] have all been utilized for surface modification of HEAs.
A high-current pulsed electron beam has proven to be an effective tool for the microstructural modification of steels [28,29], Al-Mg [30], and Ni alloys [31]. However, only a few studies have been devoted to surface modification of HEAs by HCPEB. Lyu at al. studied the correlation between the number of pulses and the microstructure and properties of as-cast CrFeCoNiMo0.2. It has shown that the surface microhardness and wear resistance of the alloy were improved after HCPEB irradiation, mainly resulting from the dispersion strengthening of the hard reinforced σ phase and the fine grain strengthening of the FCC ultrafine crystals. The maximum microhardness (392.9 HV) and lowest wear rate (0.92 × 10⁻⁴ mm3·N−1 m−1) was obtained after 35-pulsed irradiation [26]. Nahmany et al. applied electron beam bead-on-plate melting for welding Al0.6CrFeCoNi and Al0.8CrFeCoNi high-entropy alloys [27]. Melted zones obtained by electron beam surface remelting of HEA displayed a significant increase in microhardness relative to the base metal.
Since HCPEB is proven to be a promising method of surface modification of HEAs and only a limited number of studies have focused on using this technology, this research aimed to study the evolution of the structure in Al-Co-Cr-Fe-Ni high-entropy alloy fabricated by wire-arc additive manufacturing and modified by a high-current pulsed electron beam with different electron beam densities.

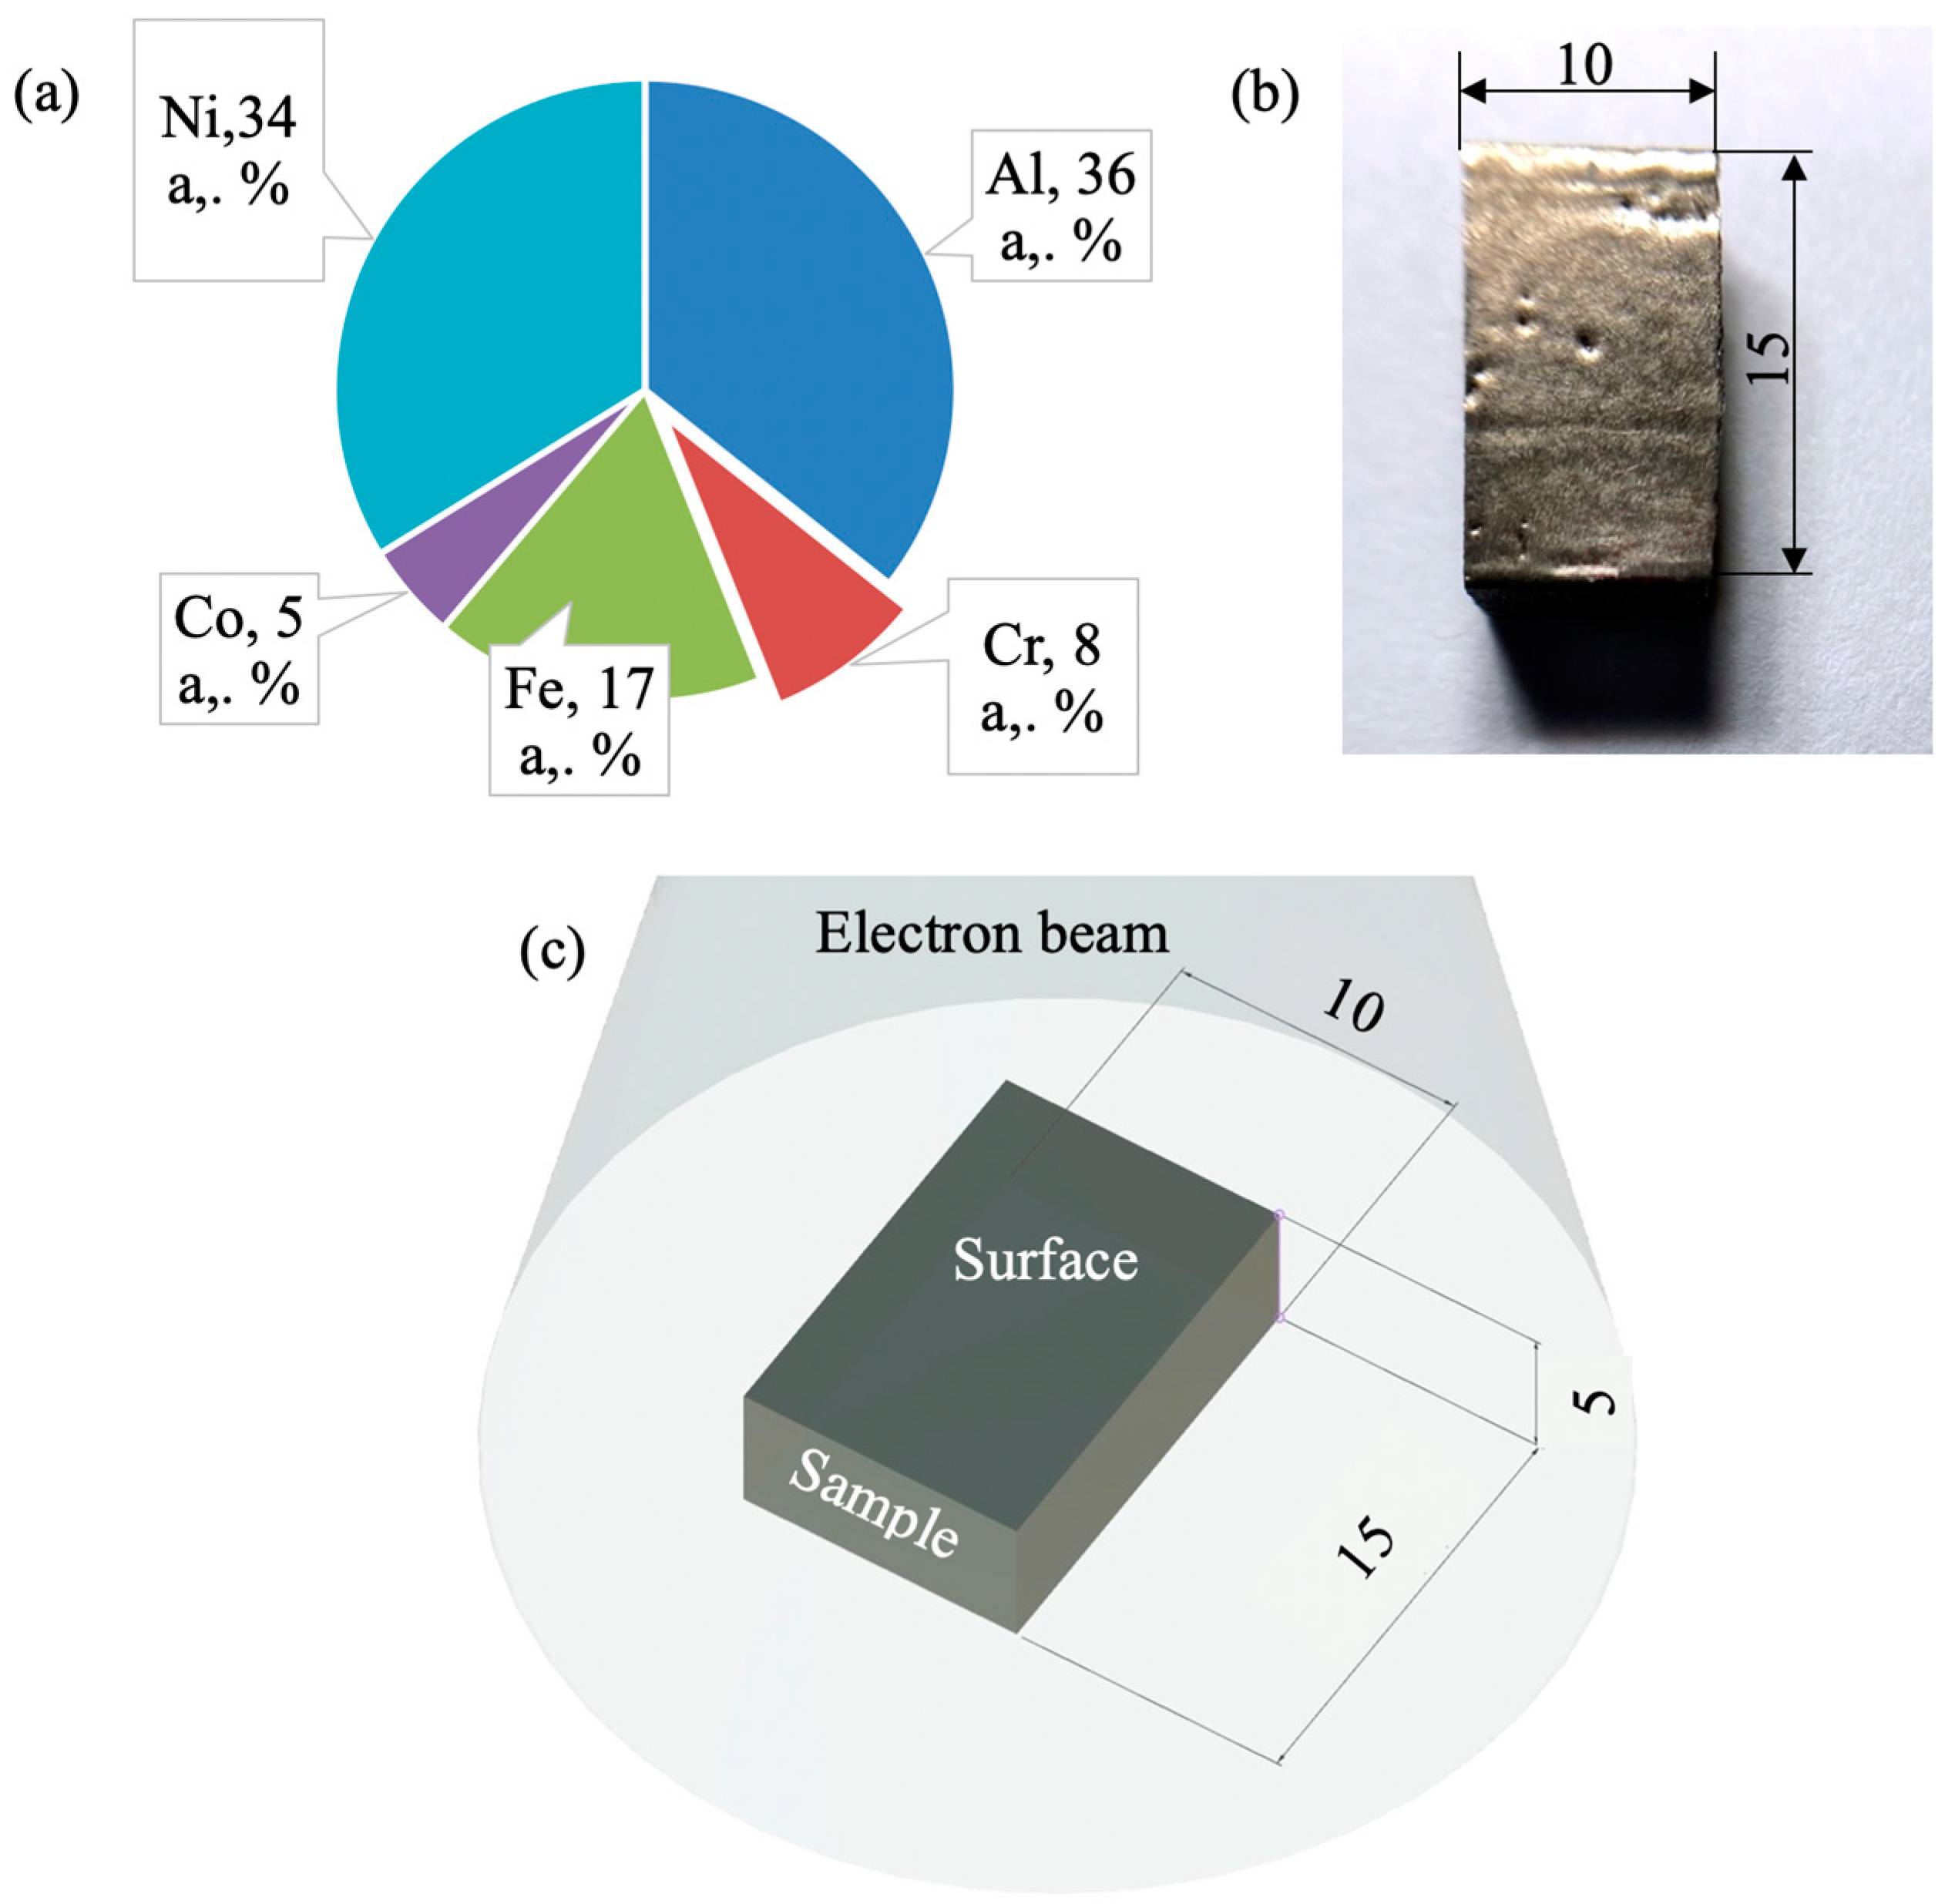
2. Materials and Methods

To form three-dimensional samples of a high-entropy Al-Co-Cr-Fe-Ni alloy system a multicomponent wire comprising three threads with different element composition was fabricated and used as an input material: aluminum wire (Al ≈ 99.95 wt. %), Cr-Ni wire (Cr ≈ 20 wt. %, Si ≈ 1 wt. %, Ti ≈ 0.2 wt. %, Ni—balanced), and Fe-Ni-Co wire (Co ≈ 17 wt. %, Ni ≈ 29 wt. %, Si ≈ 0.2 wt. %, Fe—balanced). A multicomponent wire was fabricated via automated stranding of all the wires. These particular grades of wires and their diameters were selected because of the preliminary calculated composition. The selection of an optimal stranding mode, which supported a smooth passage (without blocking and braking) of a thread in a feed liner and torch, the rotation frequency of an intake spool, and supplying spools were varied. A diameter of a combined wire obtained using this method was ≈ 1 mm.
Samples of a high-entropy alloy were fabricated via layer-by-layer deposition on an AISI 1020 steel substrate using the wire-arc additive manufacturing technology in an inert gas atmosphere (Ar ≈ 99.99%). The operation parameters were held constant: a wire feed speed—8 m/min, voltage—17 V, a torch travel speed—0.3 m/min, a gas supply speed (Ar)—14 L/min.
The sizes of fabricated high-entropy alloy samples were approximately 60 mm × 140 mm × 20 mm. Samples were as thick as four layers and as high as twenty layers. An X-ray fluorescence analysis (using an XRF-1800 wavelength dispersive X-ray fluorescence spectrometer, Shimadzu, Kyoto, Japan) revealed the element composition of the obtained alloy as (wt. %): 15.64 Al, 7.78 Co, 8.87 Cr, 22.31 Fe, 44.57 Ni (Figure 1a).
Samples with sizes 15 mm × 10 mm × 5 mm were cut from the manufactured workpiece. Before surface modification the samples were polished with SiC paper down to 2500 grit paper. Then samples were irradiated by a high-current pulsed electron beam using a “SOLO” unit (Institute of High Current Electronics, Tomsk, Russia) (Figure 1c) [32]. The irradiation mode was as follows: the energy of accelerated electrons 18 keV, the density of an electron beam (10, 20, 30) J/cm2, the duration of a beam pulse 50 µs, the pulse repetition frequency 0.3 s−1, a number of irradiation pulses 3, residual pressure of an inert gas (Ar) in the processing chamber 2·10−2 Pa (Figure 1c).
The structure and element composition of samples were investigated using scanning electron microscopy instruments (“LEO EVO 50”, ZEISS, Oberkochen, Germany and “TESCAN VEGA”, TESCAN, Brno, Czech Republic) equipped with a dispersive energy analyzer from INCA Energy, Oxford, United Kingdom. After electron beam surface modification samples were cut from the transverse direction and they were etched for 12 s using dilute aqua regia (H2O: HNO3: HCl = 6: 1: 3). For SEM of the modified surfaces, samples were neither etched nor polished. The defect sub-structure and distribution of chemical elements were studied using transmission electron microscopy (JEM-2100 instrument, JEOL, Tokyo, Japan with an EM-24511SIOD STEM attachment). The TEM investigations were carried out using the equipment at the Share Use Centre “Nanotech” of the Institute of Strength Physics and Materials Science SB RAS, Tomsk, Russia. Foils with a thickness in the range of 150–200 nm were made from plates cut perpendicular to the modified surface, and the size of the analyzed structure was mainly 10–15 µm. The foils were prepared via ion etching (an EM-09100IS ion slicer unit from JEOL, Tokyo, Japan) in an Ar atmosphere.

3. Results and Discussion

The structure of the high-entropy AlCoCrFeNi alloy obtained via wire-arc additive manufacturing (WAAM) in the inert gas atmosphere (Ar) was thoroughly investigated in our previous works [19,33]. The alloy has a dendritic structure, and it is suggested that the distribution of alloying elements in the volume of an ingot is inhomogeneous. Using the method of mapping, the inhomogeneous distribution of mentioned above elements in the alloy volume was revealed: boundaries of grains and zones near them are enriched with atoms of chromium and iron, the volume of grains contains atoms of nickel and aluminum, and cobalt exhibits the quasi-inhomogeneous distribution in the alloy (Figure 2). The images in Figure 2 were obtained during the SEM study on the LEO EVO 50 device.
The images in Figure 3 were obtained during the TEM study on the JEOL JEM-2100 device. TEM analysis of the interdendritic areas of the initial samples showed that Cr mostly located in the elongated particles (dark areas in Figure 3). Its content in these areas varies from approx. 41 to 82 at. % (Table 1). The element analysis demonstrated that O and Si are also present at some level inside the material’s structure. The impurities of Si could have got into the fabricated sample from Cr-Ni and/or Fe-Co-Ni wires which may contain about 1% of it. The routes of the penetration O are not yet well established because the shielding gas used during the fabrication had to decrease the interaction between the melted material and the environment.
The electron beam surface modification induces dramatic changes in the microstructure of the sample (Figure 4). The irradiation of a HEA by a pulsed electron beam with the electron beam density ES = 10 J/cm2 causes no disintegration of a dendritic crystallization structure (Figure 4b), which is typical for the original alloy (Figure 2a). This fact evidences the surface of modified samples did not melt. The liquid-phase transformation of the surface layer structure in a high-entropy alloy is detected only in zones near the boundaries of a dendrite structure. It can be assumed that microcracks (Figure 4) occur in a thin surface layer due to the high (105–106 K/s) cooling rates of the surface layer of the sample initiated by irradiation with a pulsed electron beam. HCPEB irradiation induces dynamic temperature fields in the surface layers giving rise to superfast heating, melting, and evaporation, followed by superfast solidification of the material [32]. The dynamic stress fields formed cause intense deformation processes in the material. As a result, along with metastable structure-phase states providing improved physical, chemical, and strength properties of the material unattainable with conventional surface treatment techniques in the surface layers, microcracks may appear [32].
Studies based on the STEM analysis of foils verified the conclusions drawn above and demonstrated that the effect of a pulsed electron beam with the beam energy density ES = 10 J/cm2 on a HEA causes no disintegration in the dendrite crystallization structure (Figure 5). Ultrahigh (up to 109 K/s) speeds of heating a relatively thin surface layer to the melting temperature and further high-speed crystallization of the melt make it possible to form a submicro-nanocrystalline structure and crystallites ranging from 100 to 200 nm (Figure 5) [32,34].
Figure 5 was obtained during the study by STEM. The EDS analysis of foils was used to investigate the elemental composition of dendrites and zones between dendrites in the surface layer of a HEA modified by a pulsed electron beam with the energy density of an electron beam set at ES = 10 J/cm2. Figure 5 provides STEM images with indicated zones, where the elemental composition was analyzed. The results of this analysis are listed in Table 2. It is suggested, based on the initial sample’s microstructure (Figure 2 and Figure 3), that the zones between dendrites (the zones numbered 1, 2, 8, 9) are also enriched mainly with Cr atoms. Its content in these areas varies from approx. 38 to 61 at. % Dendrites (the zones under study numbered 4, 5, 6, 7, 10) are enriched with chemical elements such as Al, Ni, and Fe. Atoms of Co are distributed homogenously in the volume of an ingot. The most liquating element of the alloy is revealed to be Al (which has a liquation coefficient δ = 10.4), while the least liquating element is Co (δ = 2.2). O and Si are also present in these areas of the microstructure and their content varies between 0.9 and 4.1 at. % and between 1.3 and 3.9 at. %, respectively.
The irradiation of a HEA by a pulsed electron beam with the energy density of an electron beam ES = 20 J/cm2 causes partial decomposition of the dendrite crystallization structure (Figure 4b). This fact evidences that the surface layer melts. The liquid-phase transformation in the HEA surface is related to the formation of a nano-crystalline structure in the volume of grains.
The studies based on the STEM method of foils demonstrated that the irradiation of a HEA by a pulsed electron beam with the energy density of an electron beam 20 J/cm2 leads to the formation of a high-speed crystallization structure in the surface layer (Figure 6). The volume of crystallization cells is enriched with atoms of Al, Ni and Fe. In addition, there are second-phase inclusions in joints and along cell boundaries, which are enriched mainly by Cr atoms. The size of crystallization cells is from 100 to 200 nm; inclusions found in the joints of cells vary in size from 20 to 25 nm, and inclusions along the cell boundaries are from 10 to 15 nm.
Results of the element composition analysis are presented in Table 3. The results presented in Figure 6 and in Table 3 make it possible to conclude that high-speed crystallization cells (zones under analysis numbered 1–5) are enriched with chemical elements such as Al (1.6–10.9 at. %) and Ni (15.5–35.5 at. %). Second-phase particles found on the boundaries and in joints of crystallization cells (analysis zones numbered 8–11) are enriched mainly by Cr and Fe atoms. Cobalt atoms are distributed homogenously in the volume of the surface layer. The most liquating elements in the surface layer of the alloy processed by a pulsed electron beam (20 J/cm2, 50 µs, 3 pulses, 0.3 s−1) are Si (a liquation coefficient δ = 7.5) and Cr (a liquation coefficient δ = 5.4); the least liquating element is Co (δ = 1.9).
To measure the thickness of a melted layer and study its structure, an analysis of surface fracture was carried out (Figure 7). From the micro-photographs presented in Figure 7, it is apparent that the irradiation by a pulsed electron beam (20 J/cm2, 50 µs, 3 pulses, 0.3 s−1) results in the formation of a surface layer with the submicro-nanocrystalline structure. This layer can be up to 15 µm thick.
The point-wise EDS analysis of foils was used to investigate the elemental composition of high-crystallization cells and second-phase particles.
The comparison of the EDS analysis results, given in Table 1, Table 2 and Table 3 demonstrate that the high-speed melting and further high-speed crystallization initiated by the pulsed electron beam irradiation redistributed the chemical elements forming a more homogenous HEA.
The irradiation of HEA samples by a pulsed electron beam with the energy density of an electron beam ES = 30 J/cm2 initiates the high-speed melting and subsequent crystallization of the surface layer. Consequently, a cell-type structure of high-speed crystallization is formed in the surface layer; a typical view is given in Figure 8. Crystallization cells have a roundish form and range in size from 100 nm to 150 nm. Second-phase thin layers surround the cells (Figure 8). The thickness of thin layers varies in the range (15–30) nm.
The elemental composition of the surface layer in the HEA processed by a pulsed electron beam was investigated using EDS analysis. The research established that electron-beam processing is not related to any significant changes in the material element composition. On completion of irradiation, like in the original material, the main elements are aluminum and nickel, whereas iron, chromium and cobalt are found in a smaller amount (Figure 9). Besides chemical elements typical for the as-cast state, the EDS analysis detected impurity elements, such as silicon and titanium.
The point-wise EDS analysis of foils was used to investigate the elemental composition of the volume of the cell and second-phase inclusions found on the boundaries of cells. The results given in Figure 10 suggest that the volume of cells is enriched with some chemical elements: Al, Ni and Fe. Second-phase particles are enriched with Cr and Fe. Co, Ti and Si are distributed homogeneously throughout the ingot. It is noteworthy that the concentration of Ti atoms in the material to be analyzed ranges to parts of a percent, while the concentration of Si atoms exceeds the percentage of cobalt atoms.
Table 4 shows the research outcomes into the distribution of chemical elements in the HEA surface layer irradiated by a pulsed electron beam obtained by the mapping method.
It is apparent that results presented in Figure 10 and Figure 11 are in line with each other and verify the above conclusion that the volume of cells is enriched with the chemical elements Al and Ni. Atoms of chromium mainly constitute second-phase particles. Atoms of Fe are found both in the volume of cells and in particles on the cell boundaries. Co, Ti and Si are homogeneously distributed throughout the ingot. An increase in the energy density of an electron beam to 30 J/cm2 has no significant effect on the surface layer structure. In this case, a surface layer with a cell-type structure of high-speed crystallization is also formed. Crystallization cells have a roundish form. The size of cells varies from 100 to 150 nm. Cells are fringed with second-phase thin layers. The thickness of thin layers varies in the range of 15–30 nm. The volume of cells is enriched with chemical elements Al and Ni. Atoms of chromium and iron form mainly second-phase particles. Atoms of cobalt are homogenously distributed in the volume of a modified layer.
X-ray diffraction was used to investigate the phase composition of HEA samples processed by HCPEB. The initial sample has simple cubic lattice and a lattice parameter of 0.28914. Previously, a similar XRD pattern was obtained in the study of the alloy Fe0.54Ni0.836Al0.624 [35]. A diffraction patterns obtained on a HEA sample before and after irradiating by HCPEB is shown in Figure 12.
Irradiation of the HEA with HCPEB does not lead to a change in the phase composition of the material, as evidenced by the similarity of the x-ray patterns shown in Figure 13. There is a shift of the HEAs diffraction lines after irradiation towards large angles, which indicates a possible decrease in the crystal lattice parameter of the alloy. Indeed, surface modification with HCPEB induces non-monotonic decreasing in lattice parameter: 0.28774 (10 J/cm2), 0.28816 (20 J/cm2) 0.28806 nm (30 J/cm2). Simultaneously with the change in the crystal lattice parameter, irradiation leads to a decrease in the micro-distortions of the alloy crystal lattice and an increase in the size of the coherent scattering regions.
Summarizing the results obtained in the EDS analysis of the initial HEA sample and the material modified by HCPEB characterize an inhomogeneity degree in the distribution of alloying elements in the surface layer presented in Figure 13.
A HEA obtained via wire-arc additive manufacturing (WAAM) exhibits the highly inhomogeneous distribution of chemical elements in the alloy. The irradiation of a HEA by a pulsed electron beam furthers the homogenization of the material. The most liquating elements in the surface of the alloy processed by HCPEB are Al (a liquation coefficient δ = 10.4 and Cr (a liquation coefficient δ = 10.5), the least liquating one is Co (δ = 1.6) (Figure 13). The highest homogenization degree of chemical elements is possible, provided that the energy density of an electron beam was set 20 J/cm2.

4. Conclusions

In summary, surface of Al-Co-Cr-Fe-Ni high-entropy alloy fabricated via wire-arc additive manufacturing was modified by HCPEB. The following conclusions can be drawn from this study:
(1)
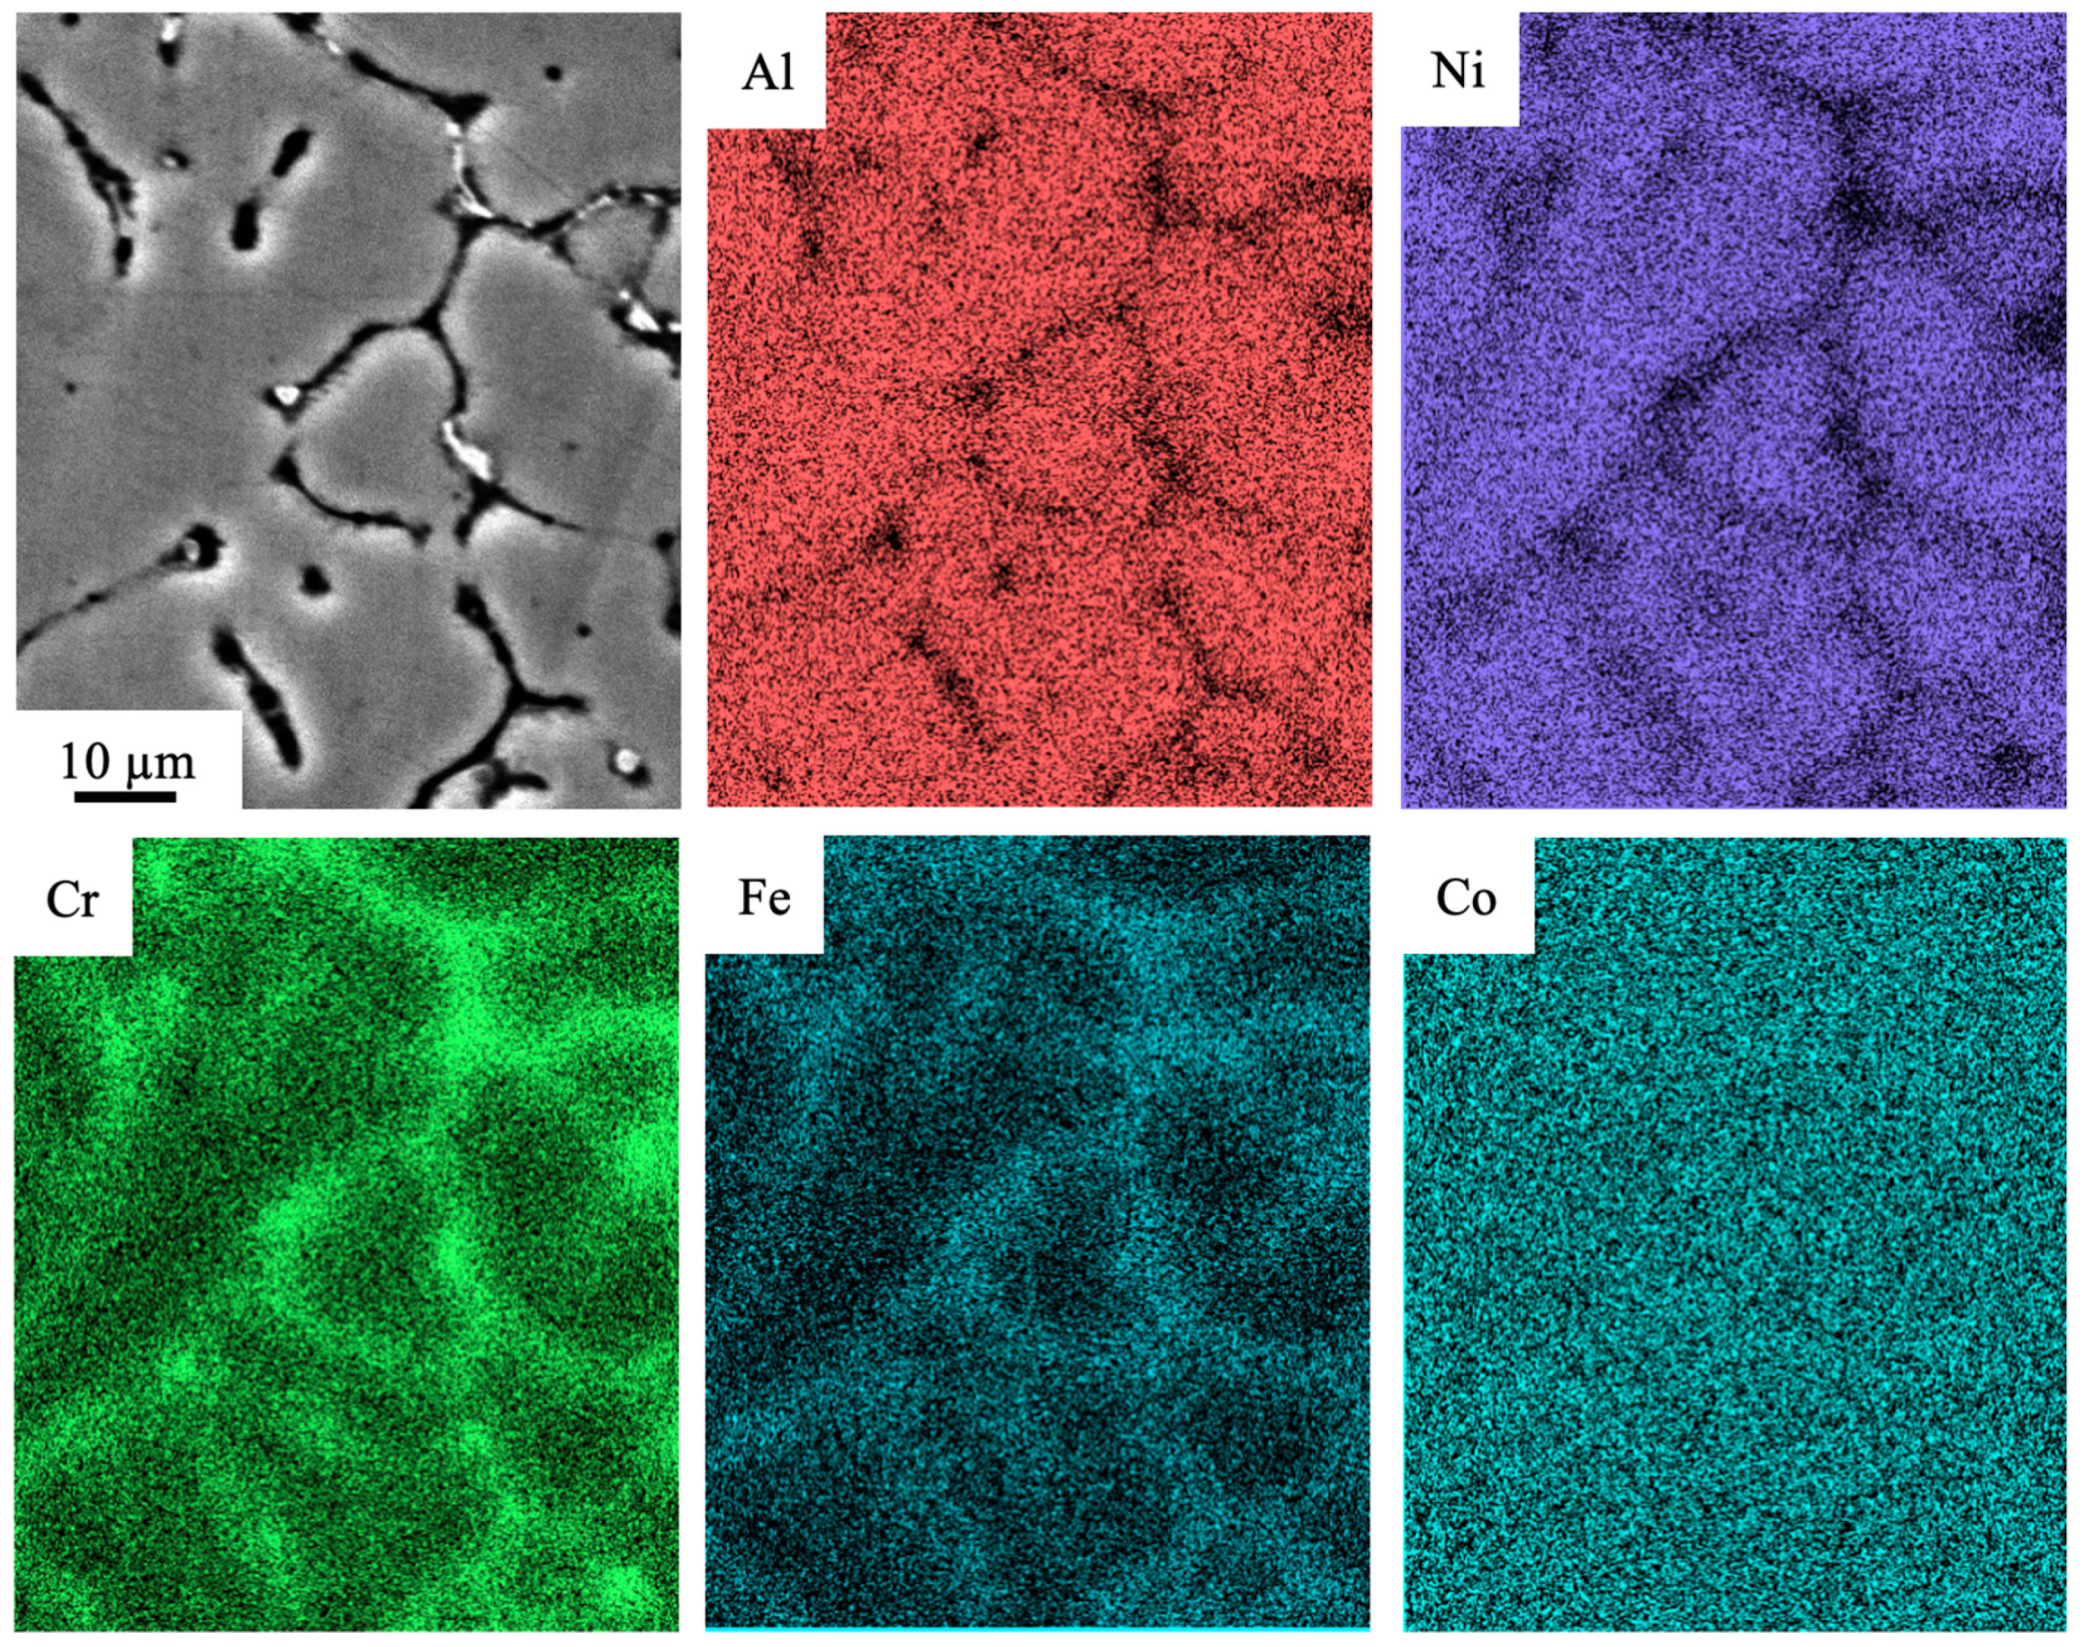
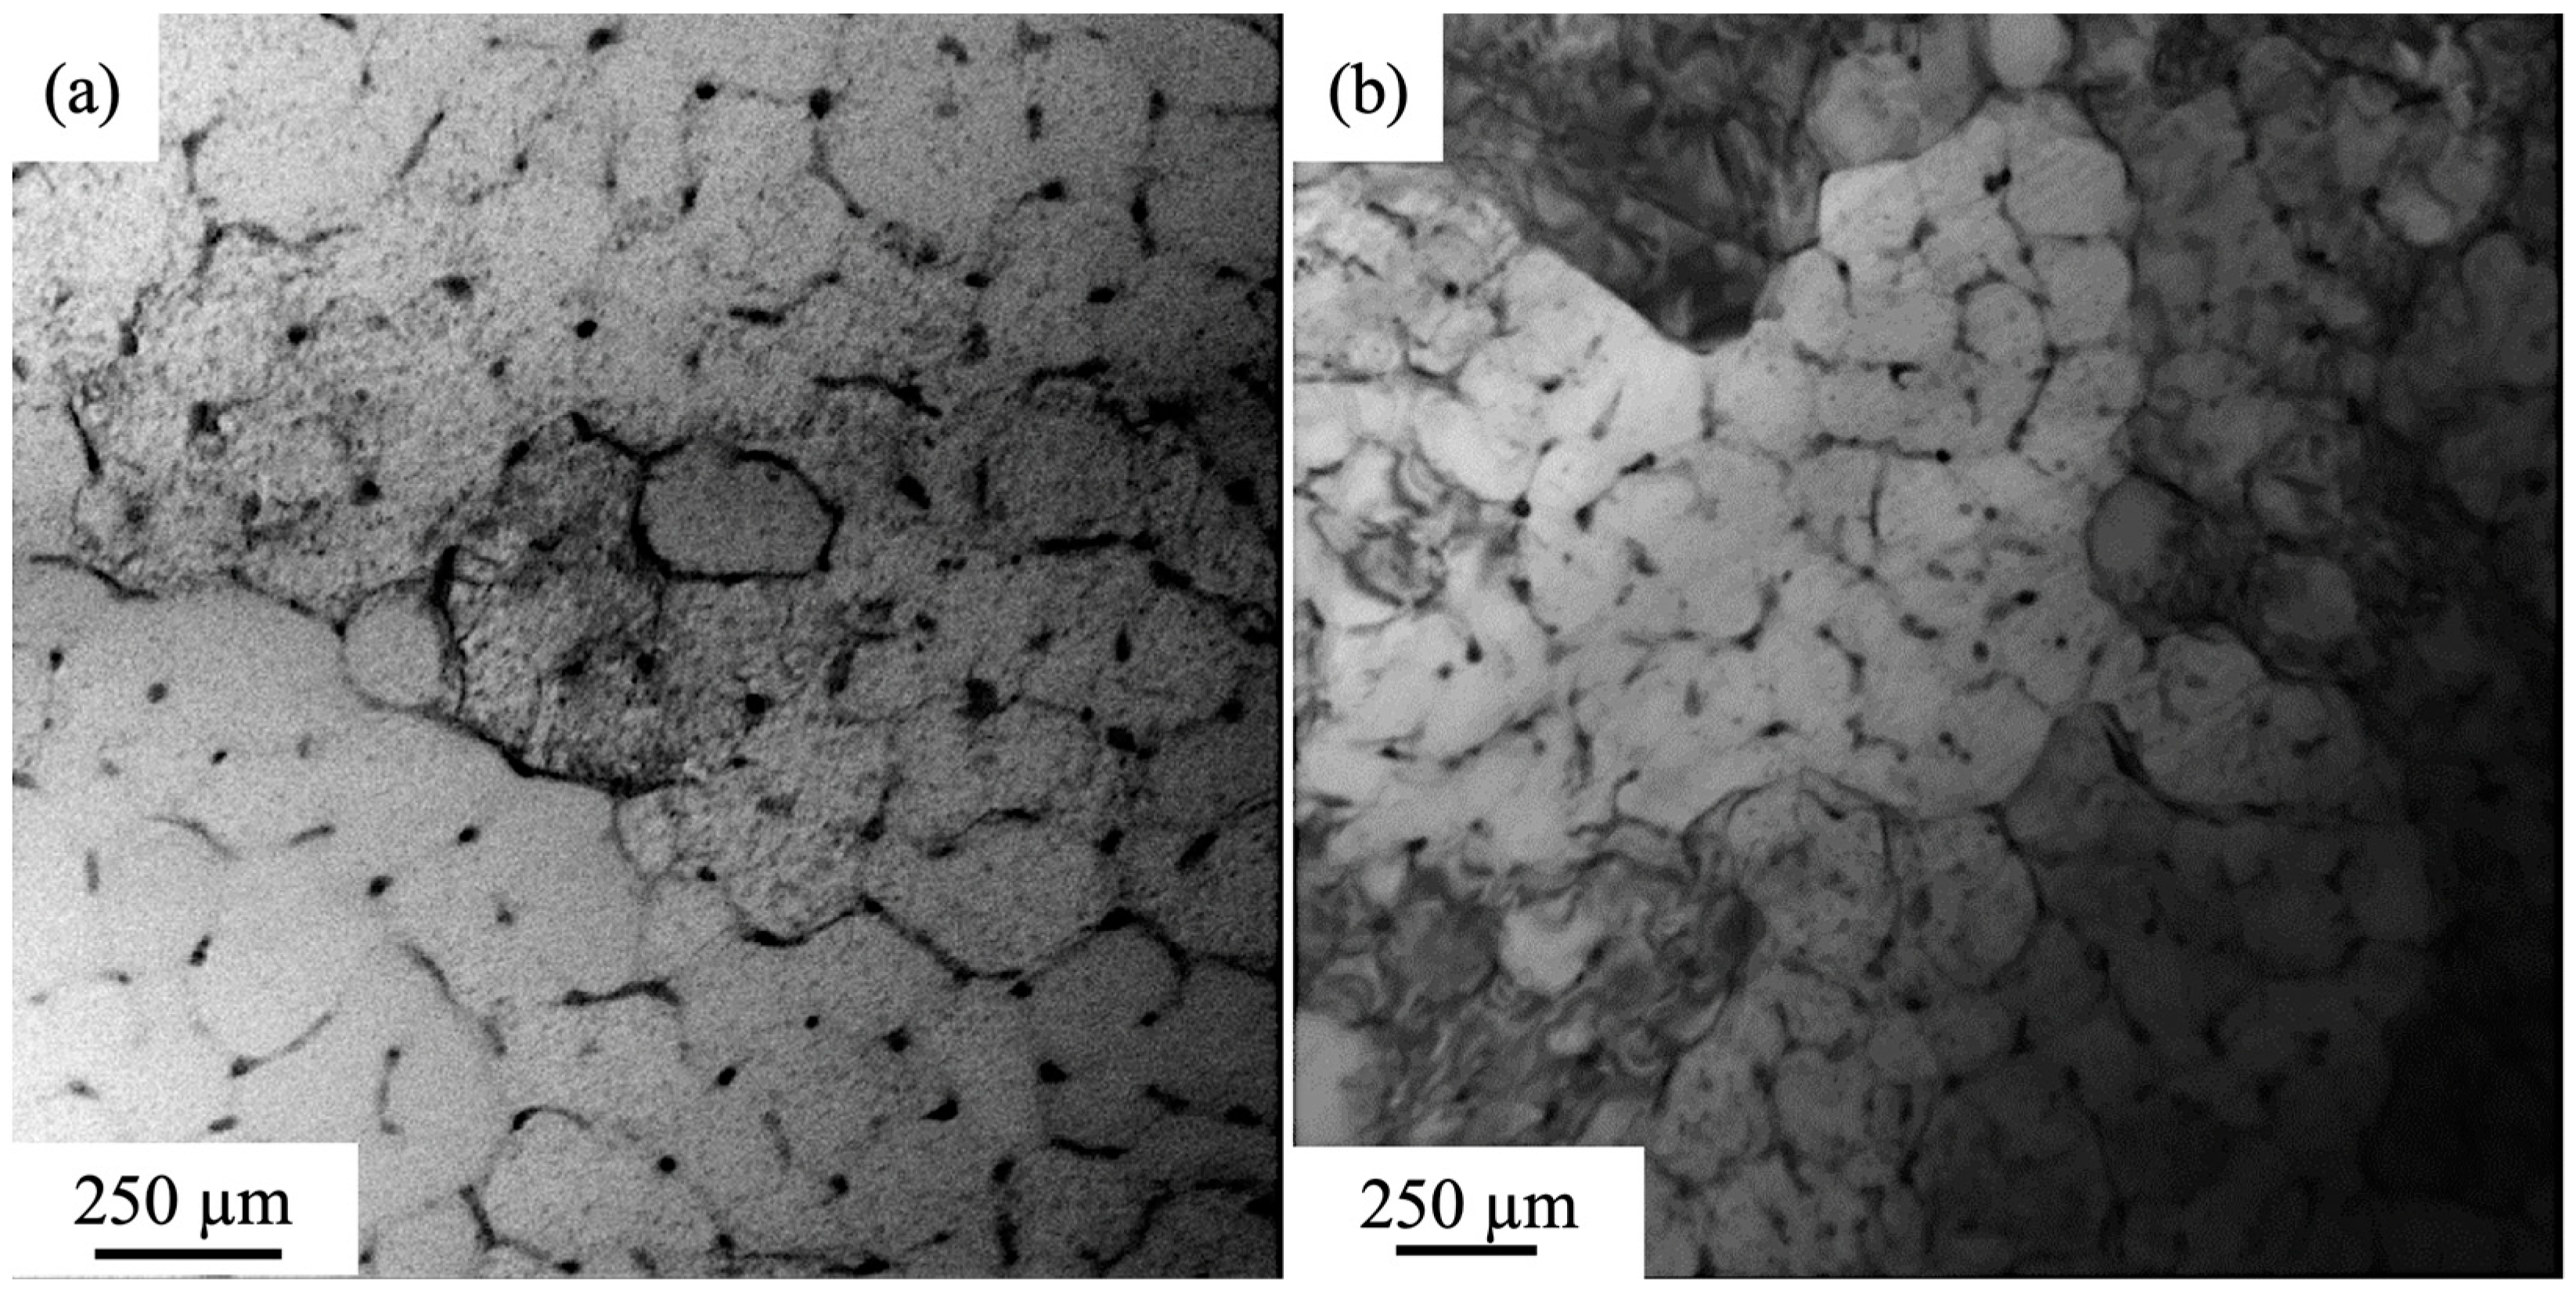
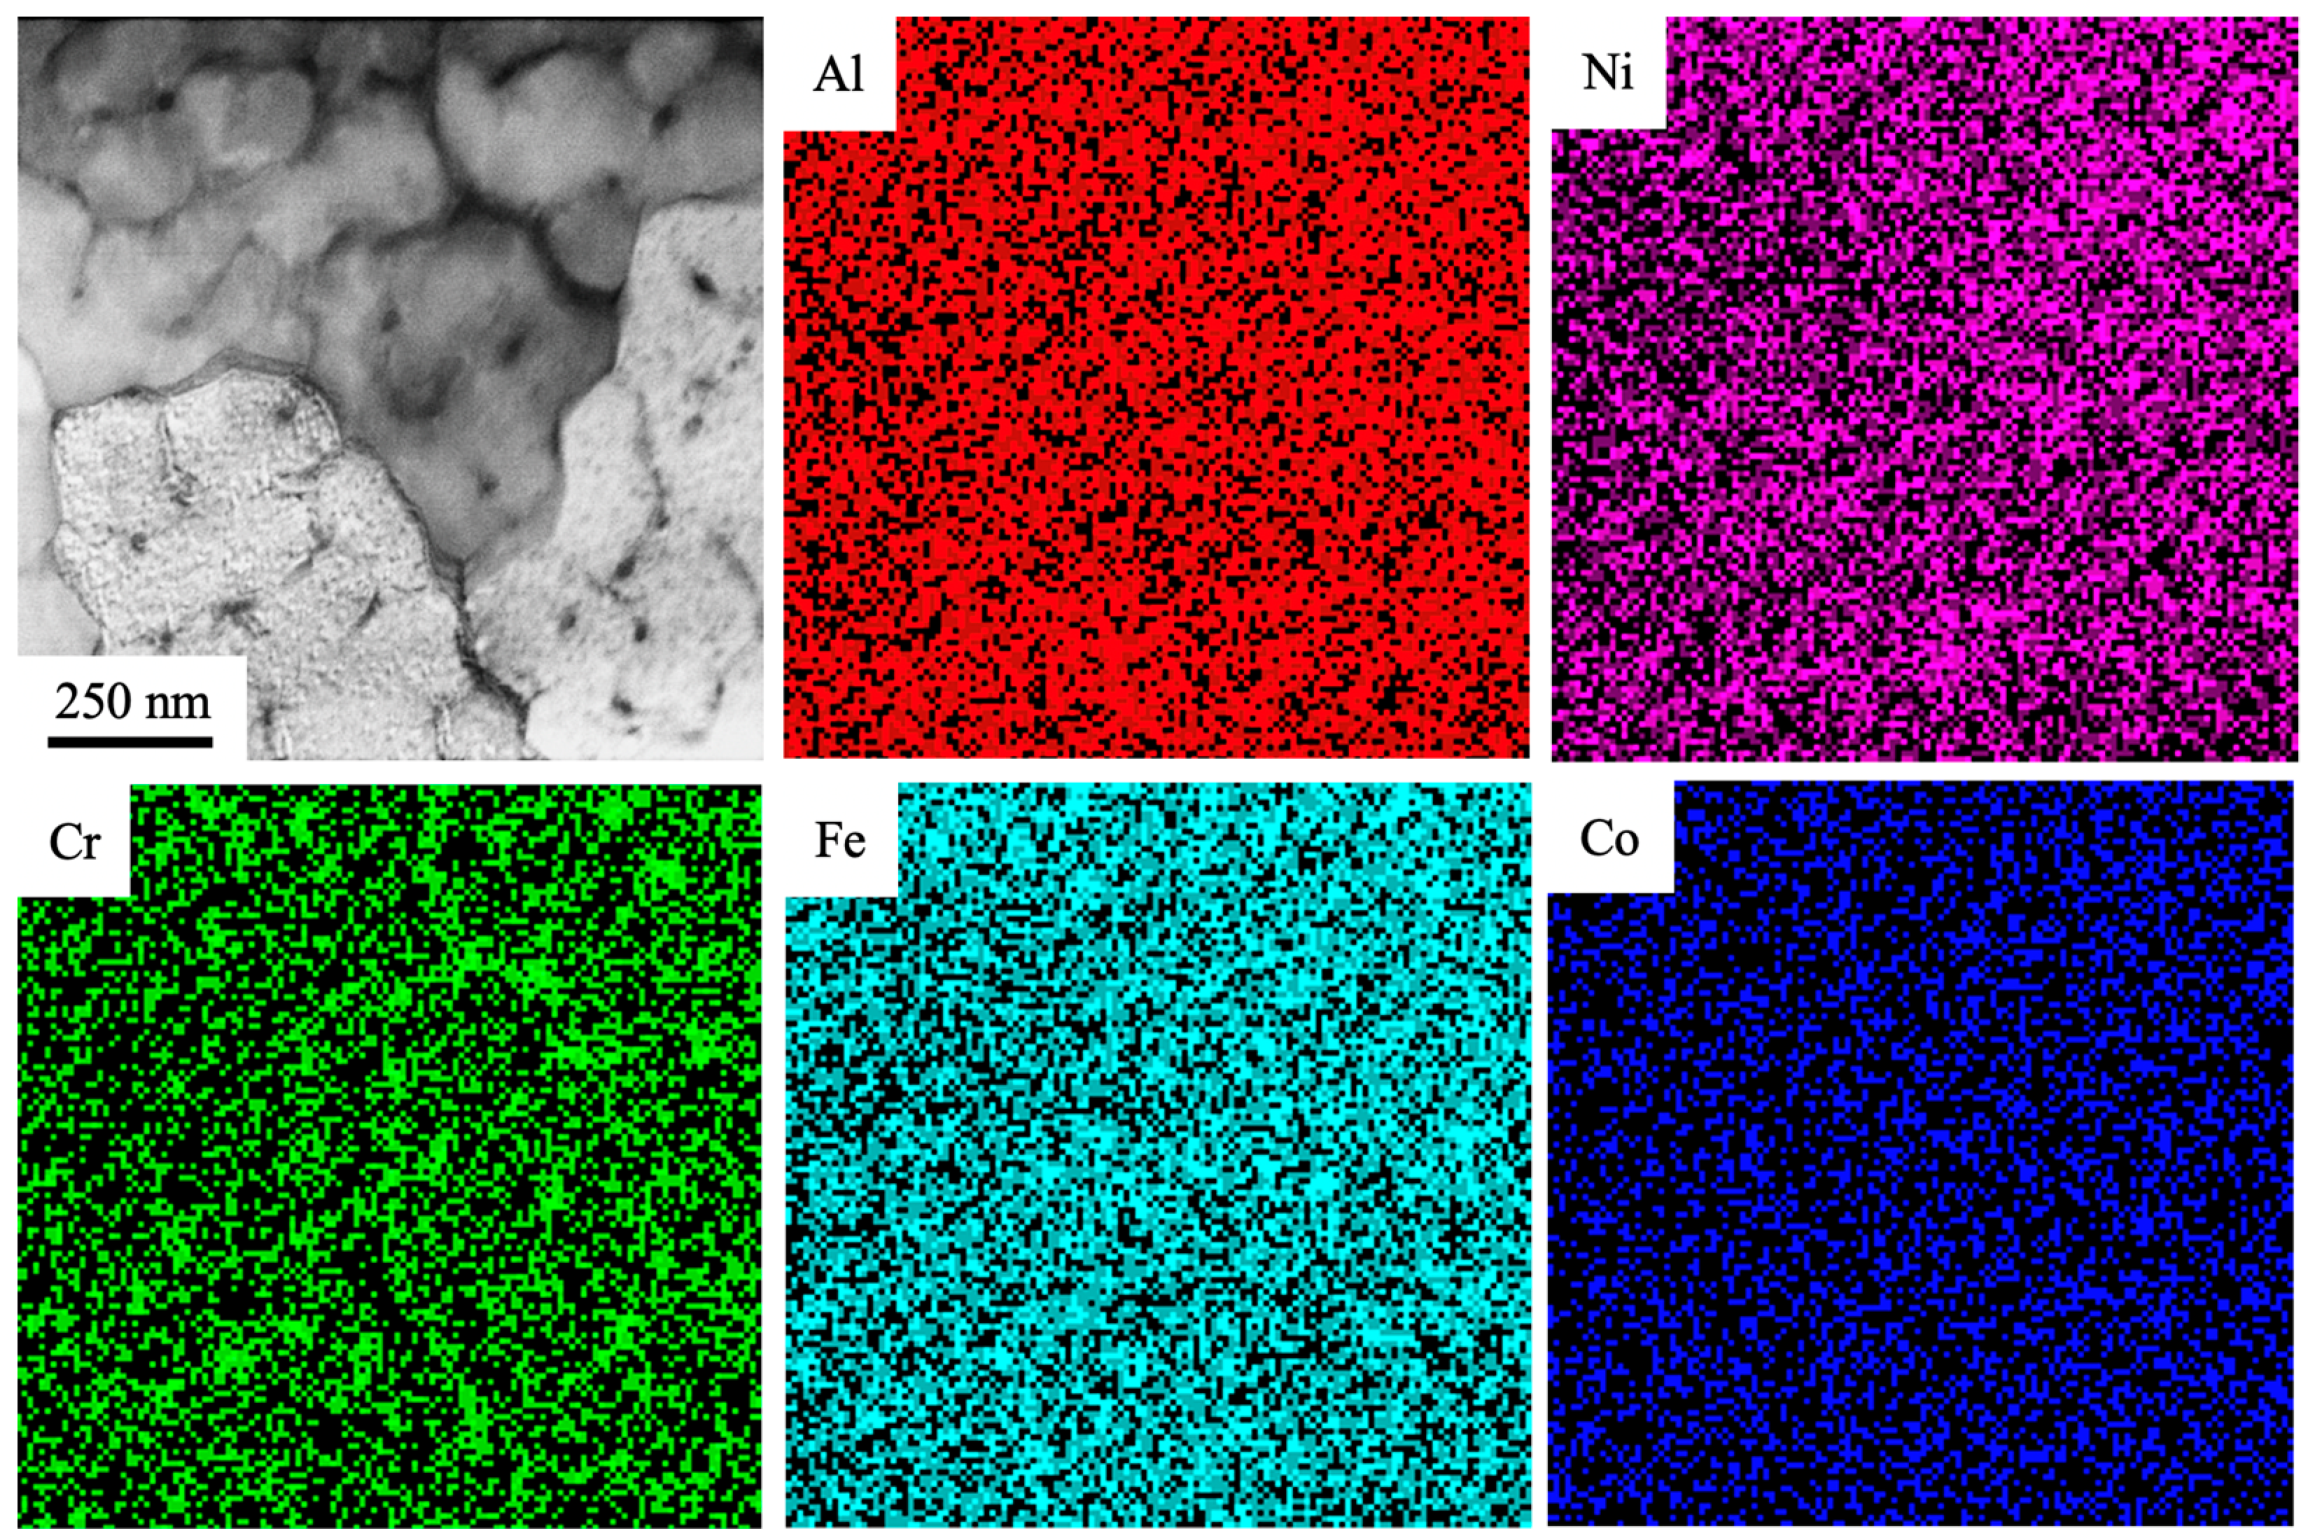
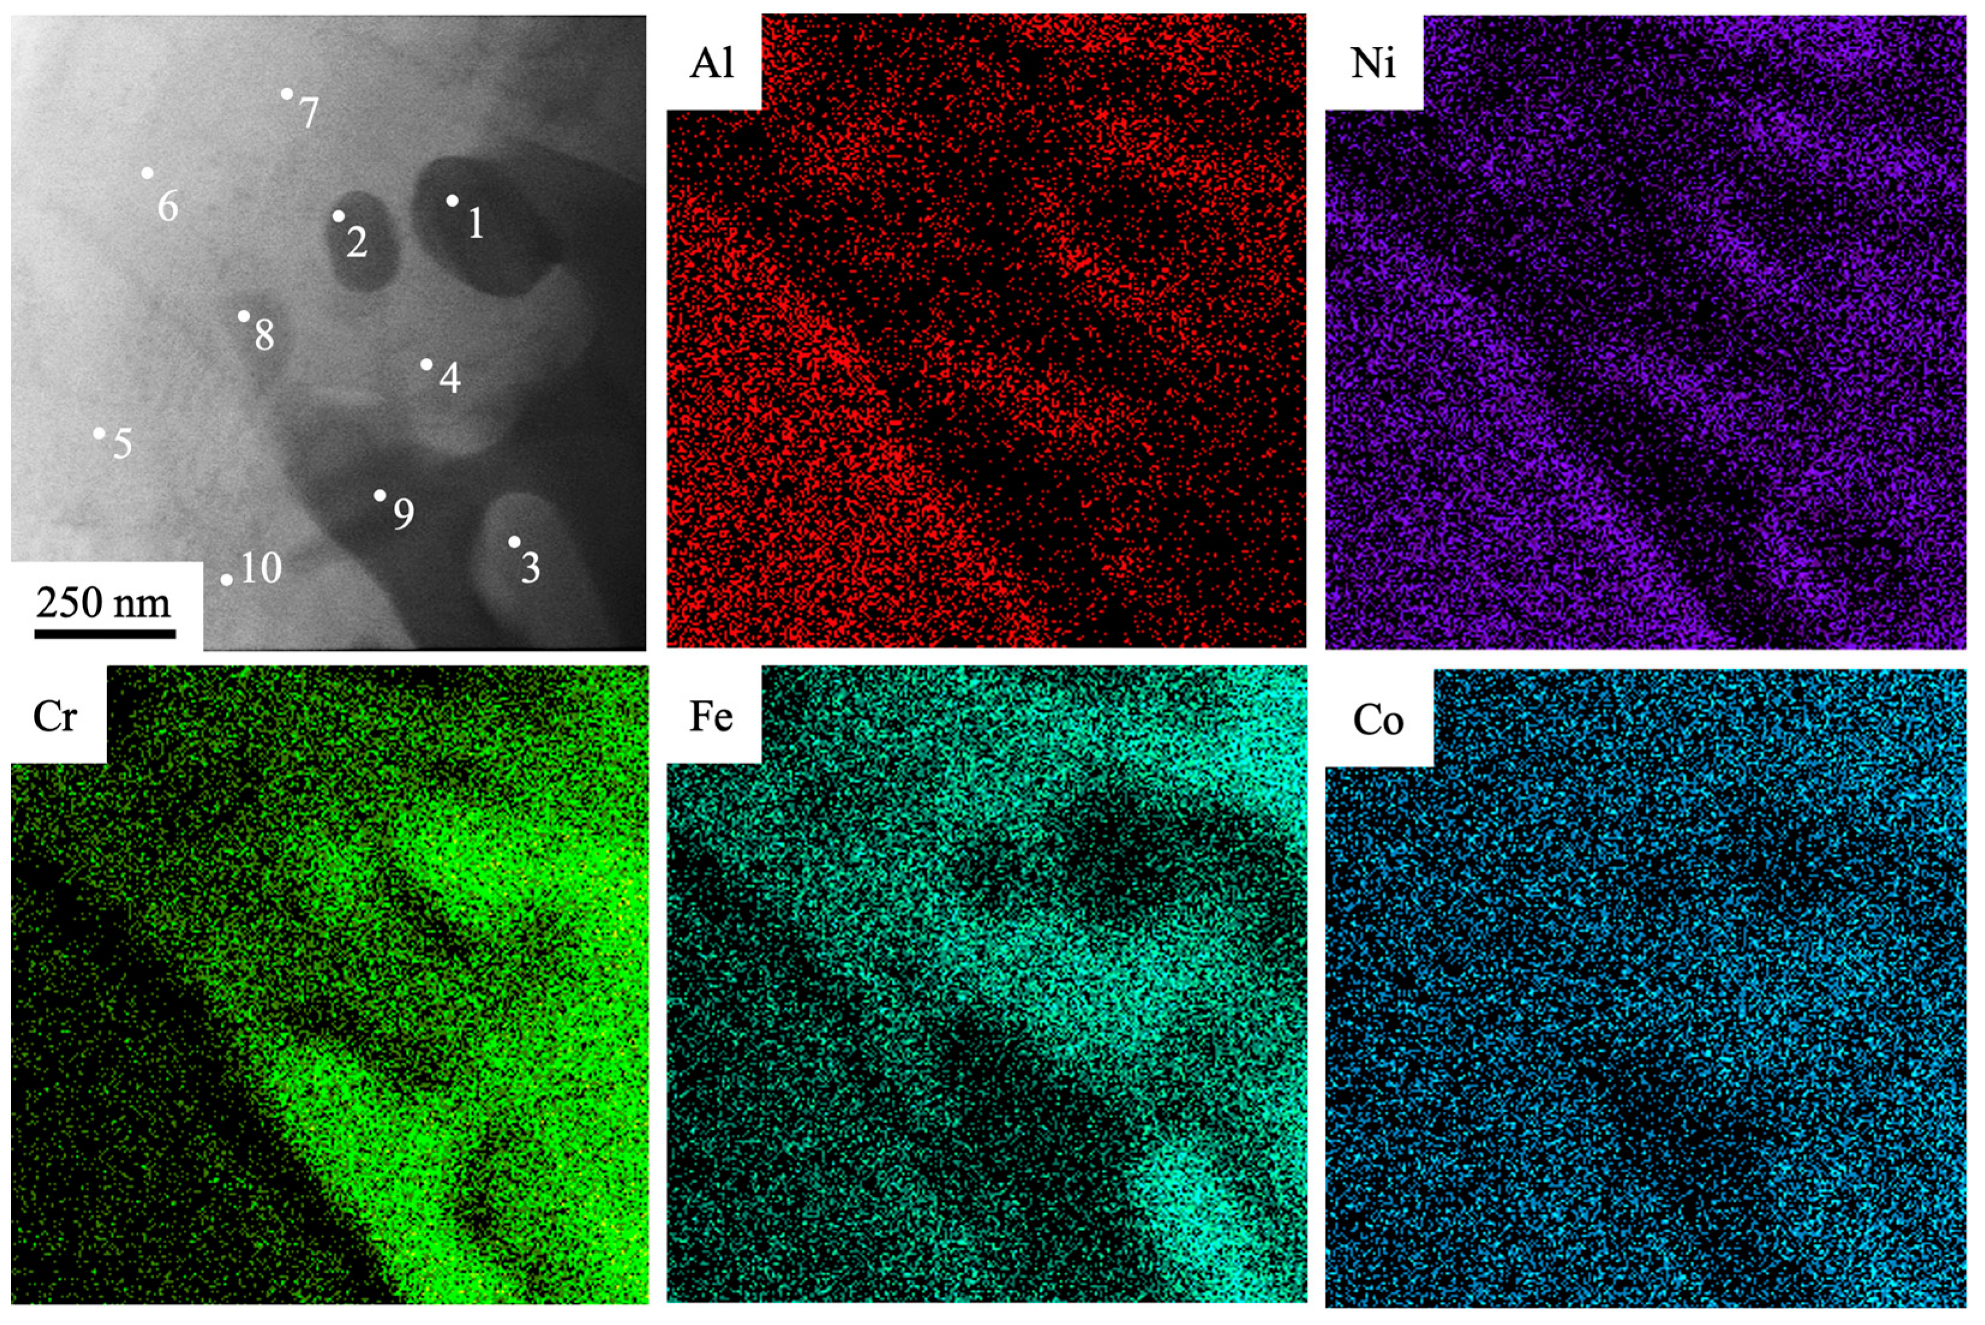
Initial HEA has highly inhomogeneous distribution of chemical elements.
(2)
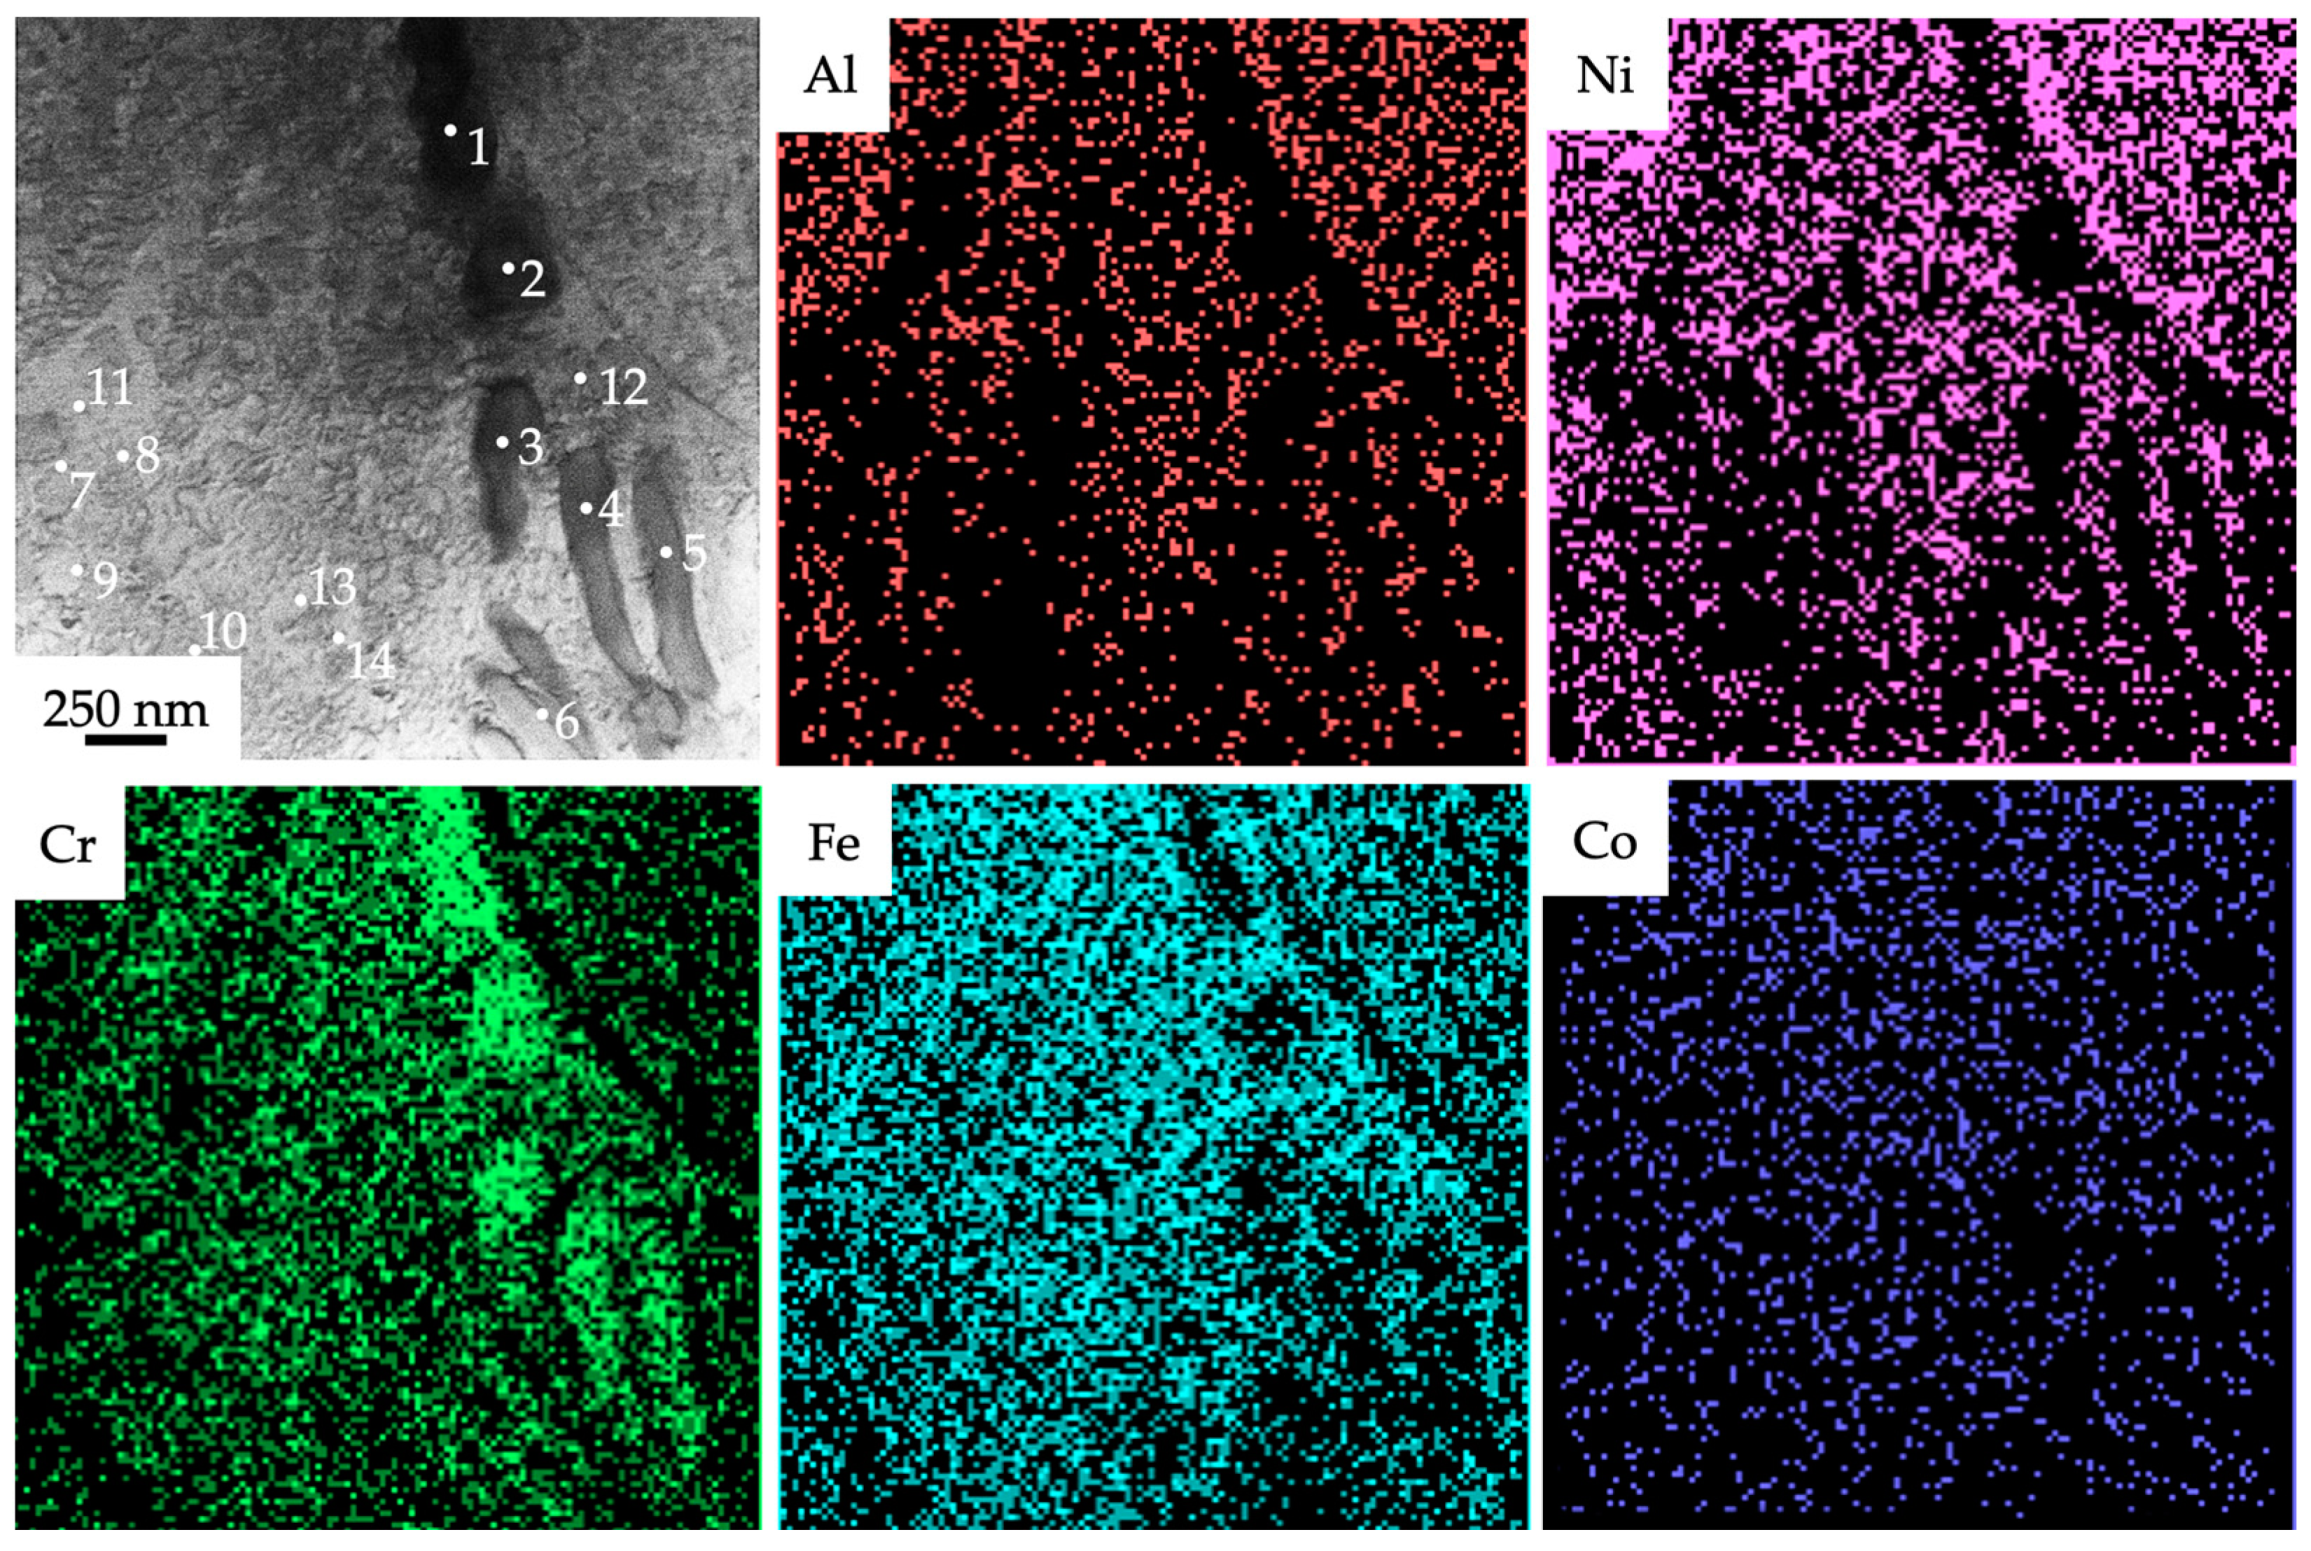
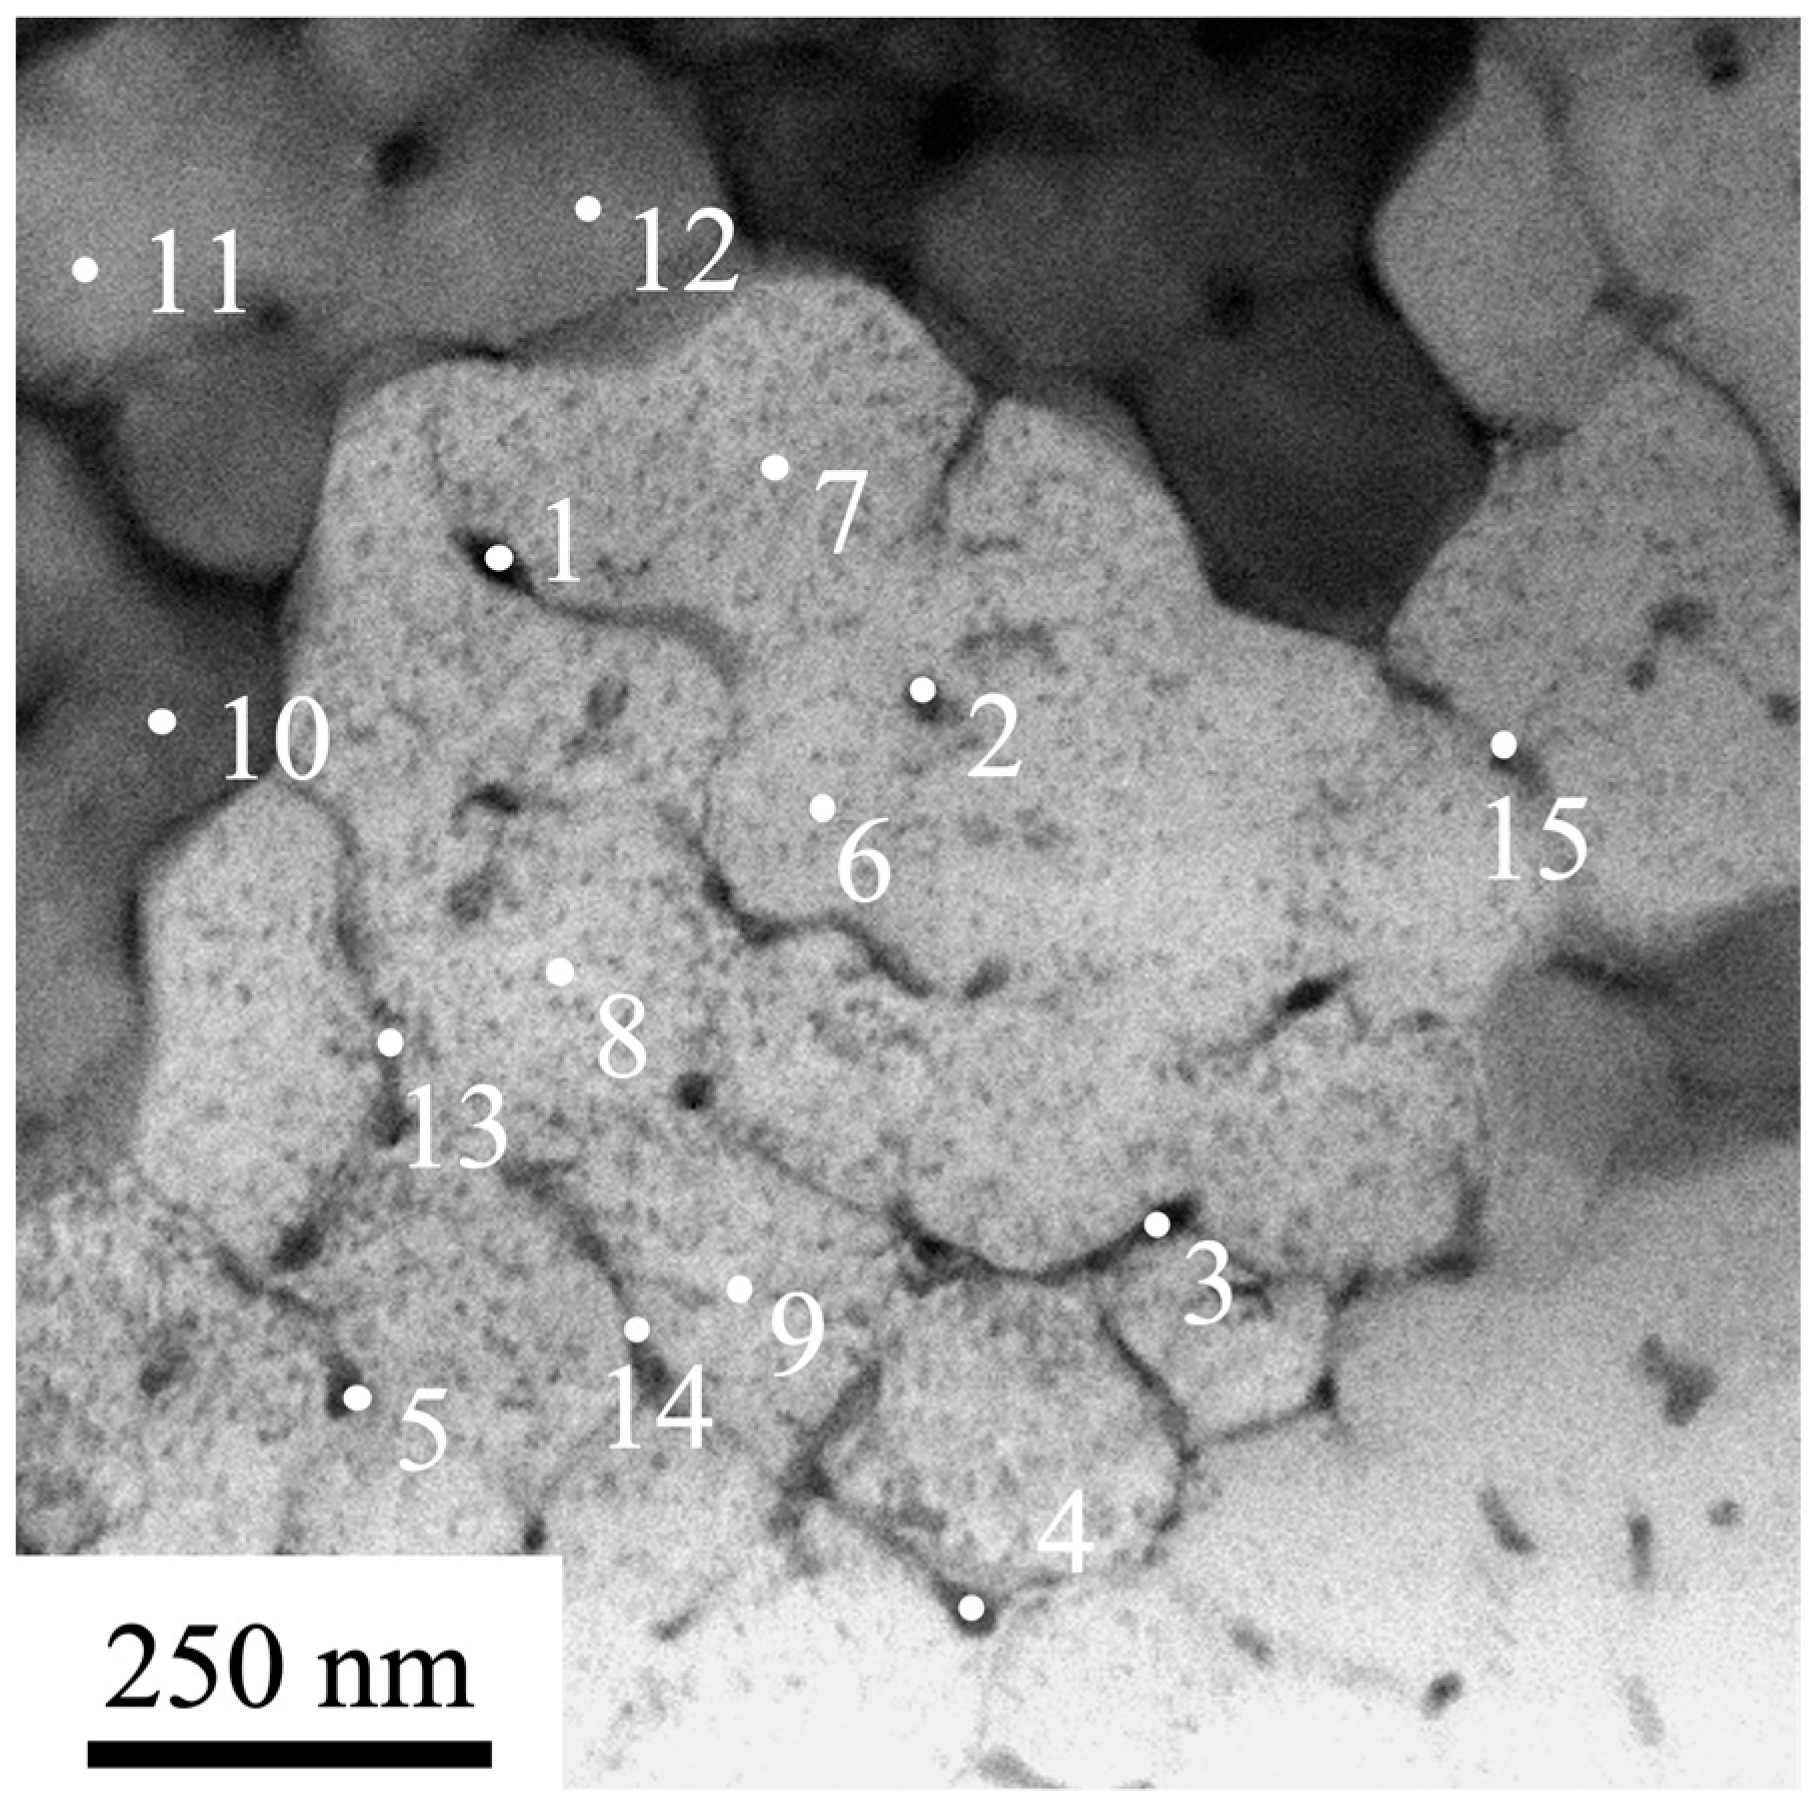
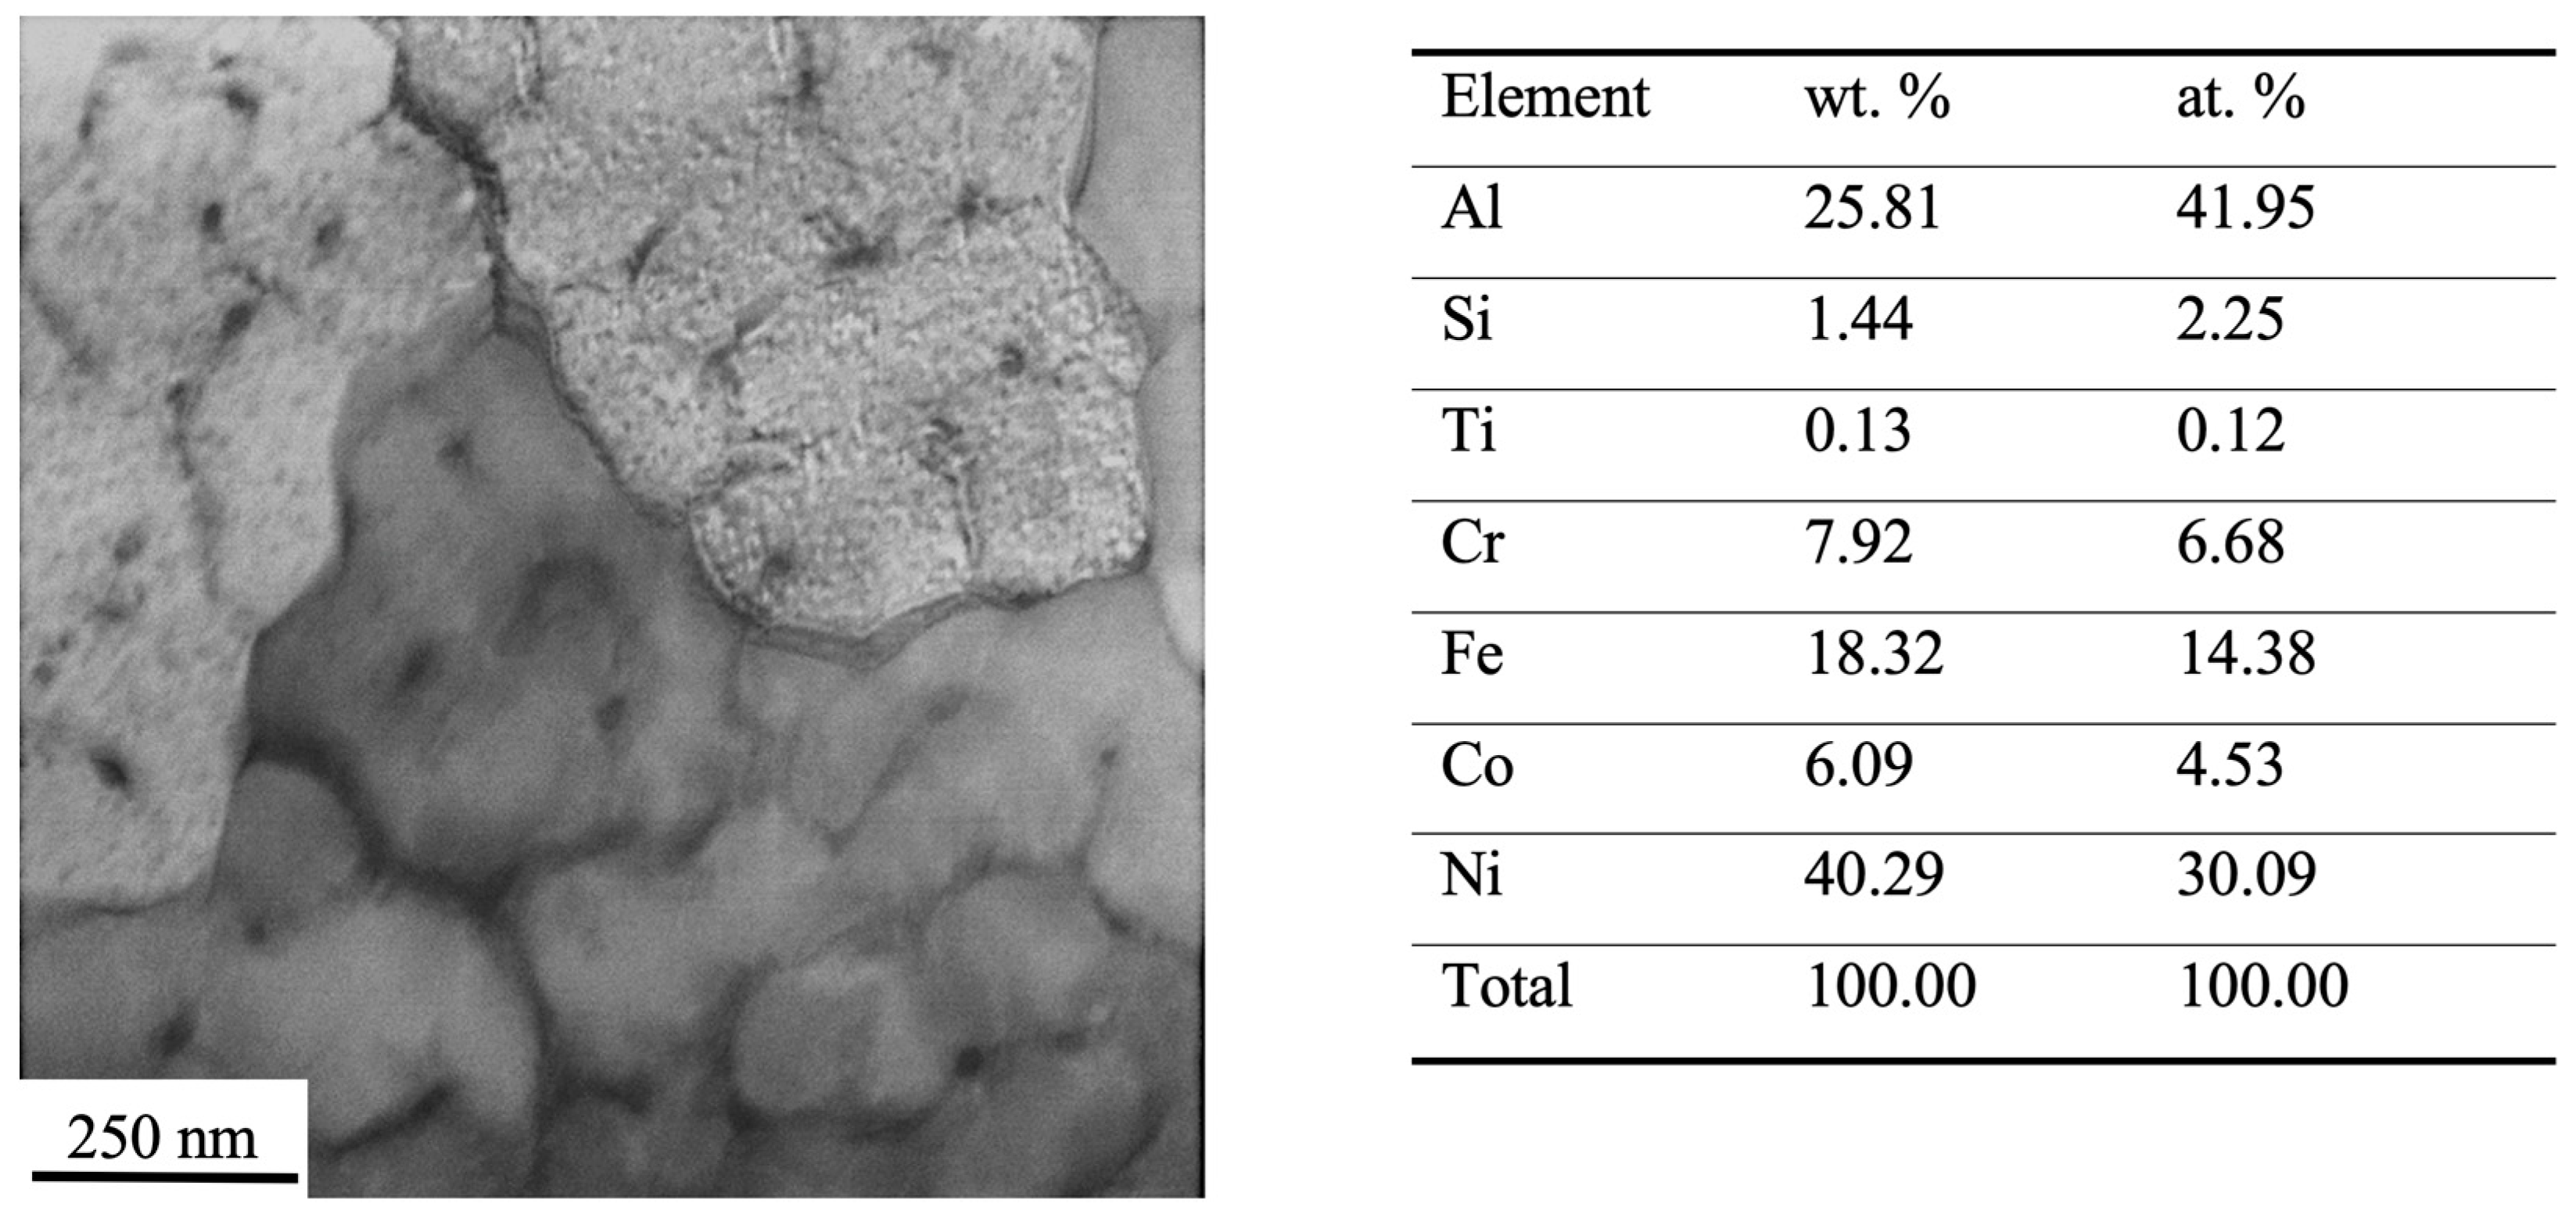
There are nano-dimensional (15–30 nm) second-phase inclusions enriched with atoms of chromium and iron along the grain boundaries.
(3)
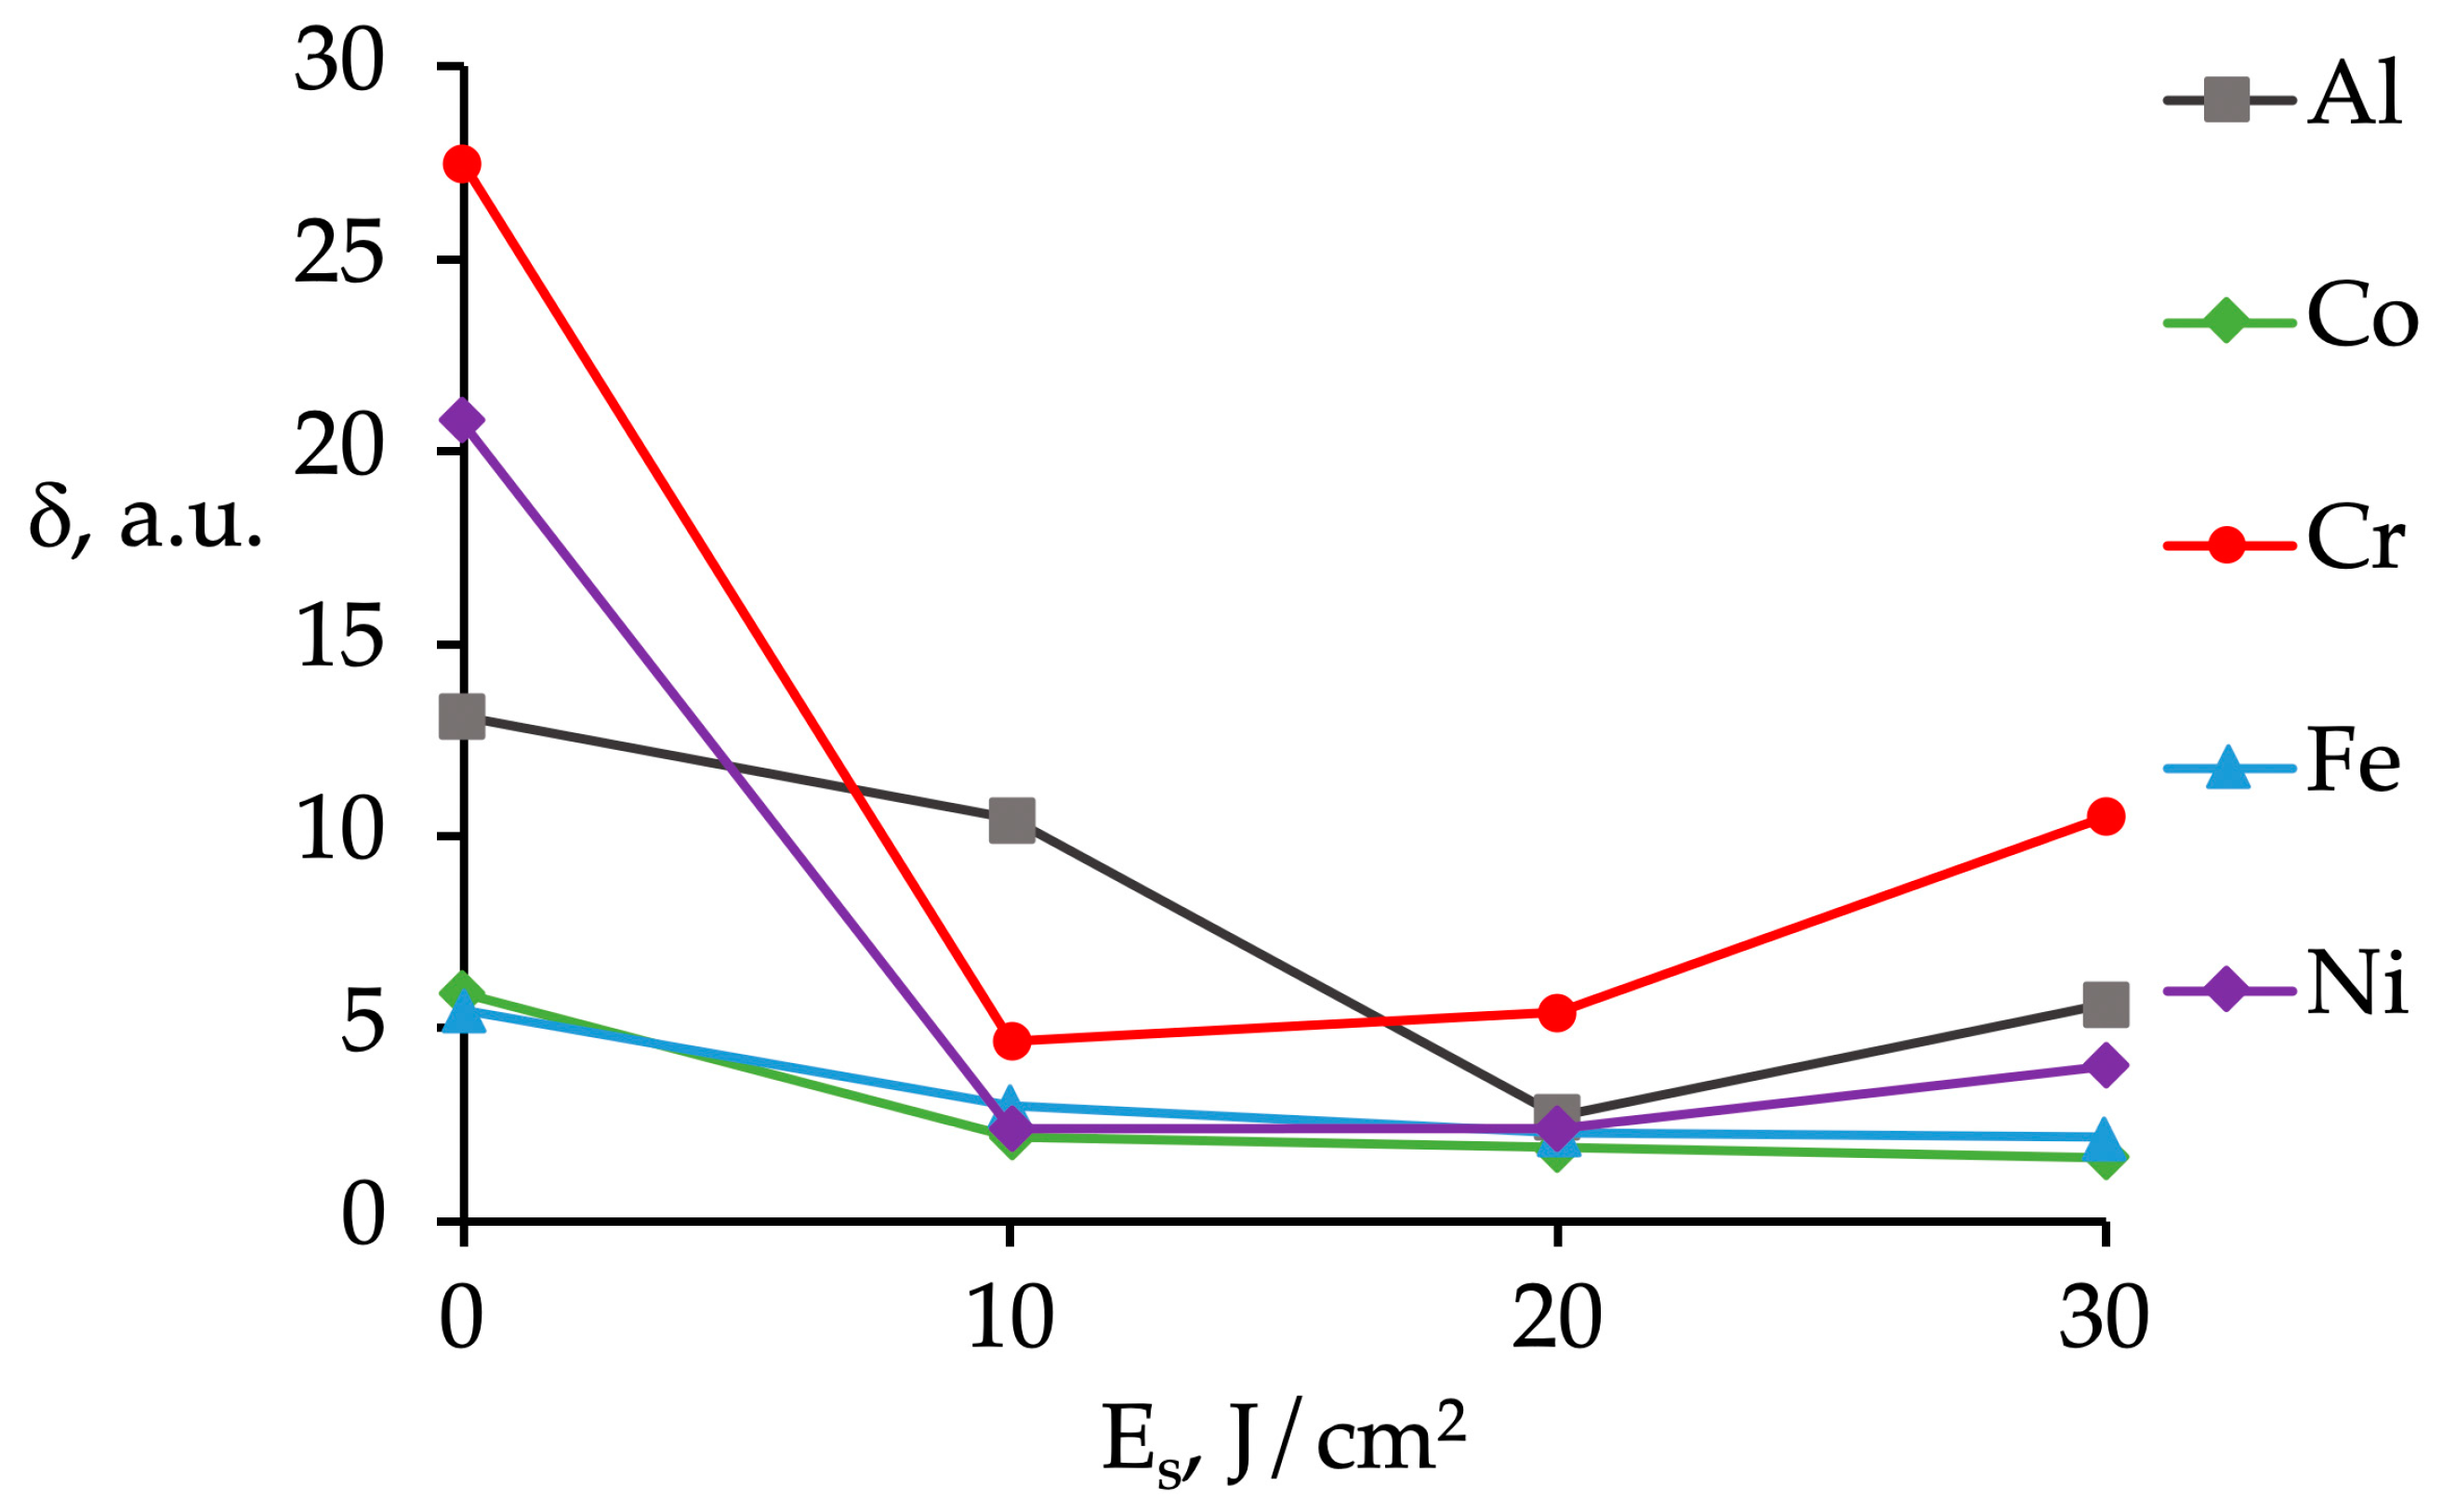
The most liquating elements in the alloy are Cr (δ = 10.5) and Al (δ = 10.4).
(4)
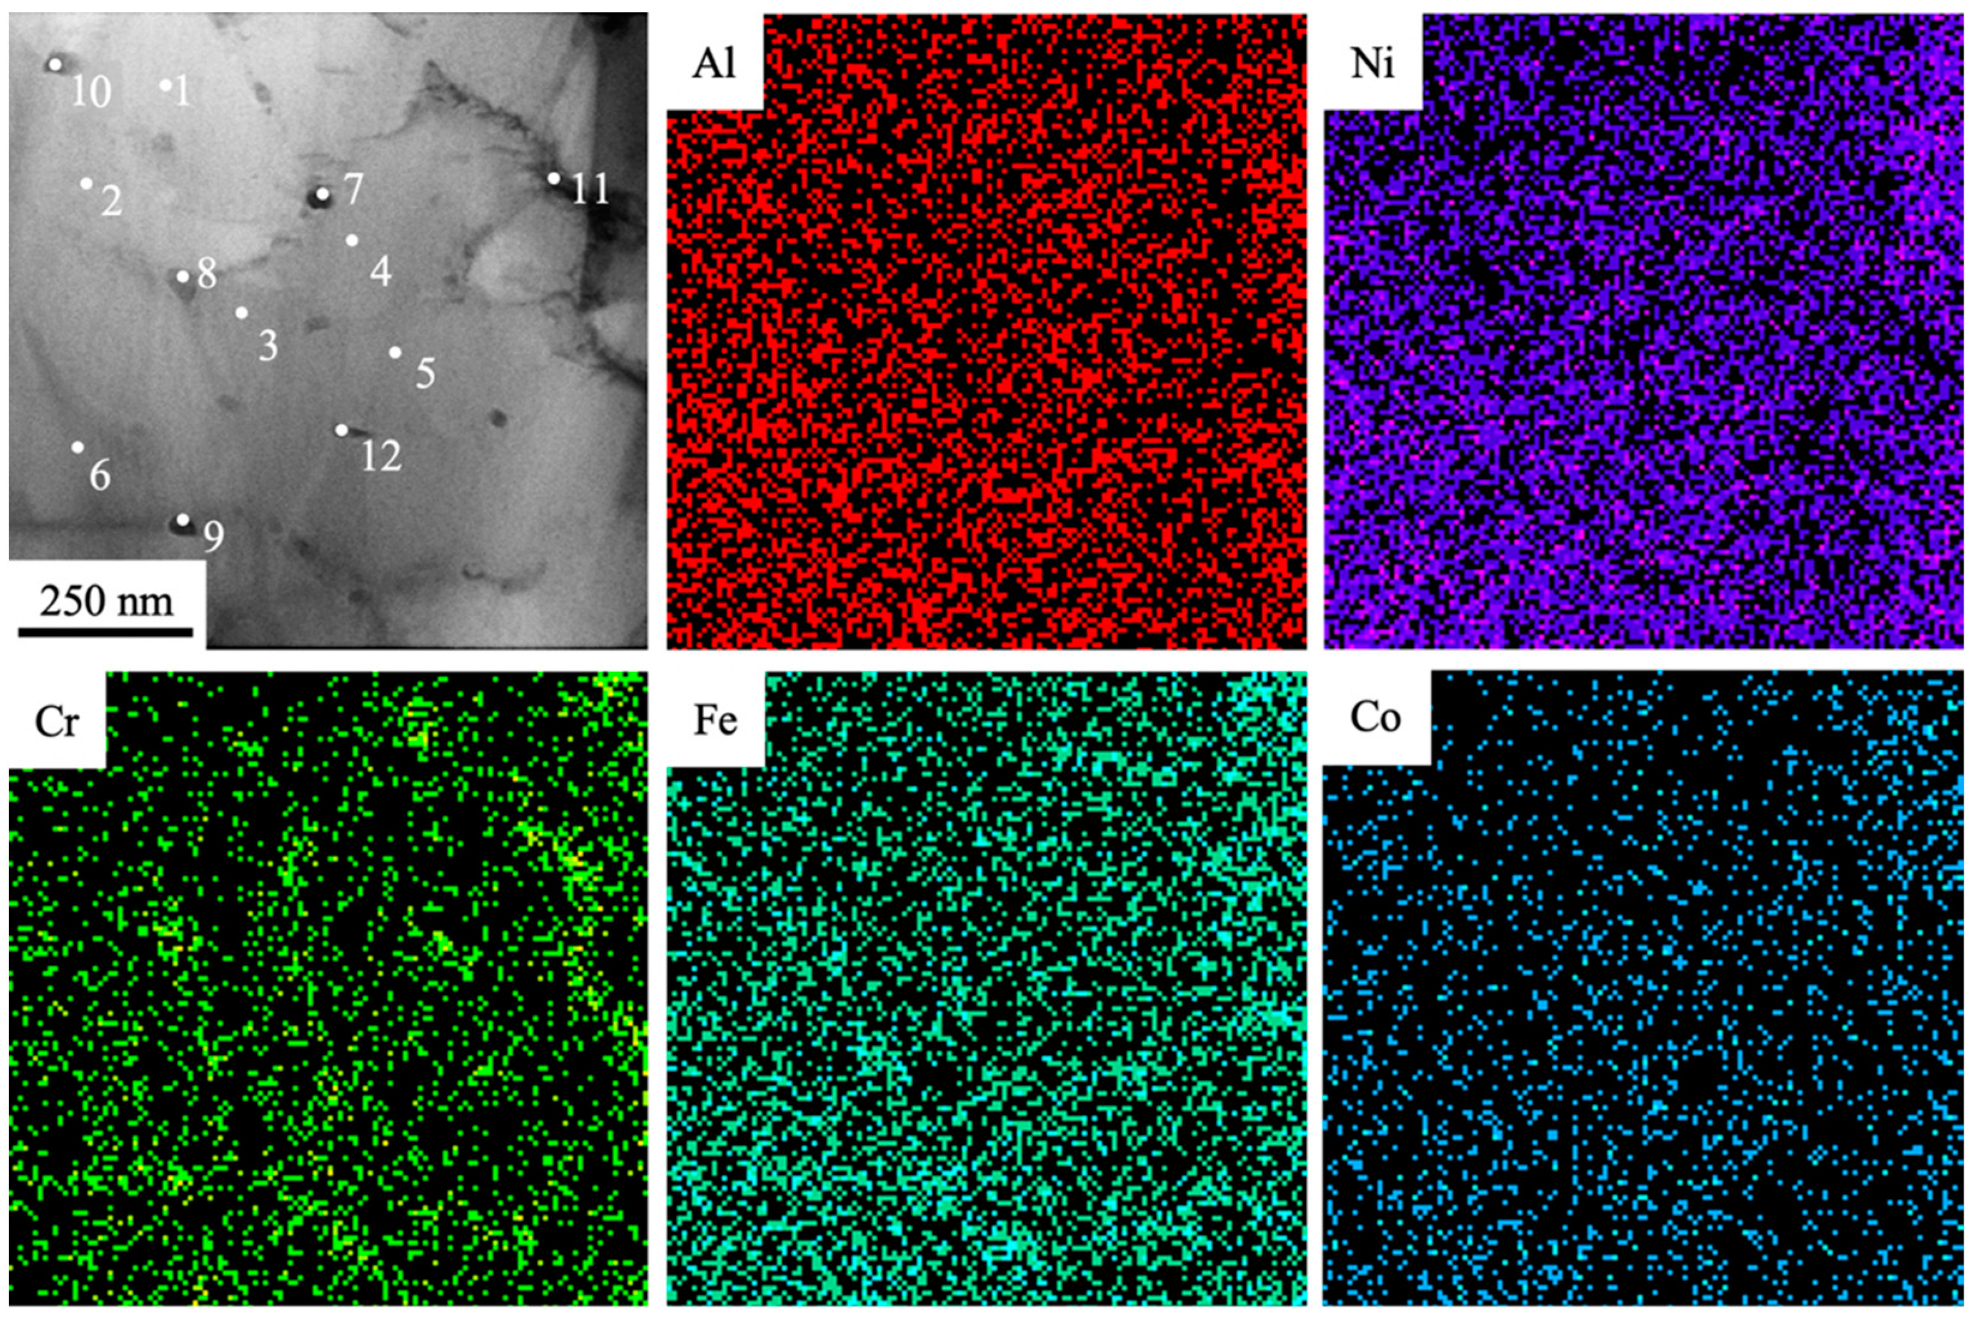
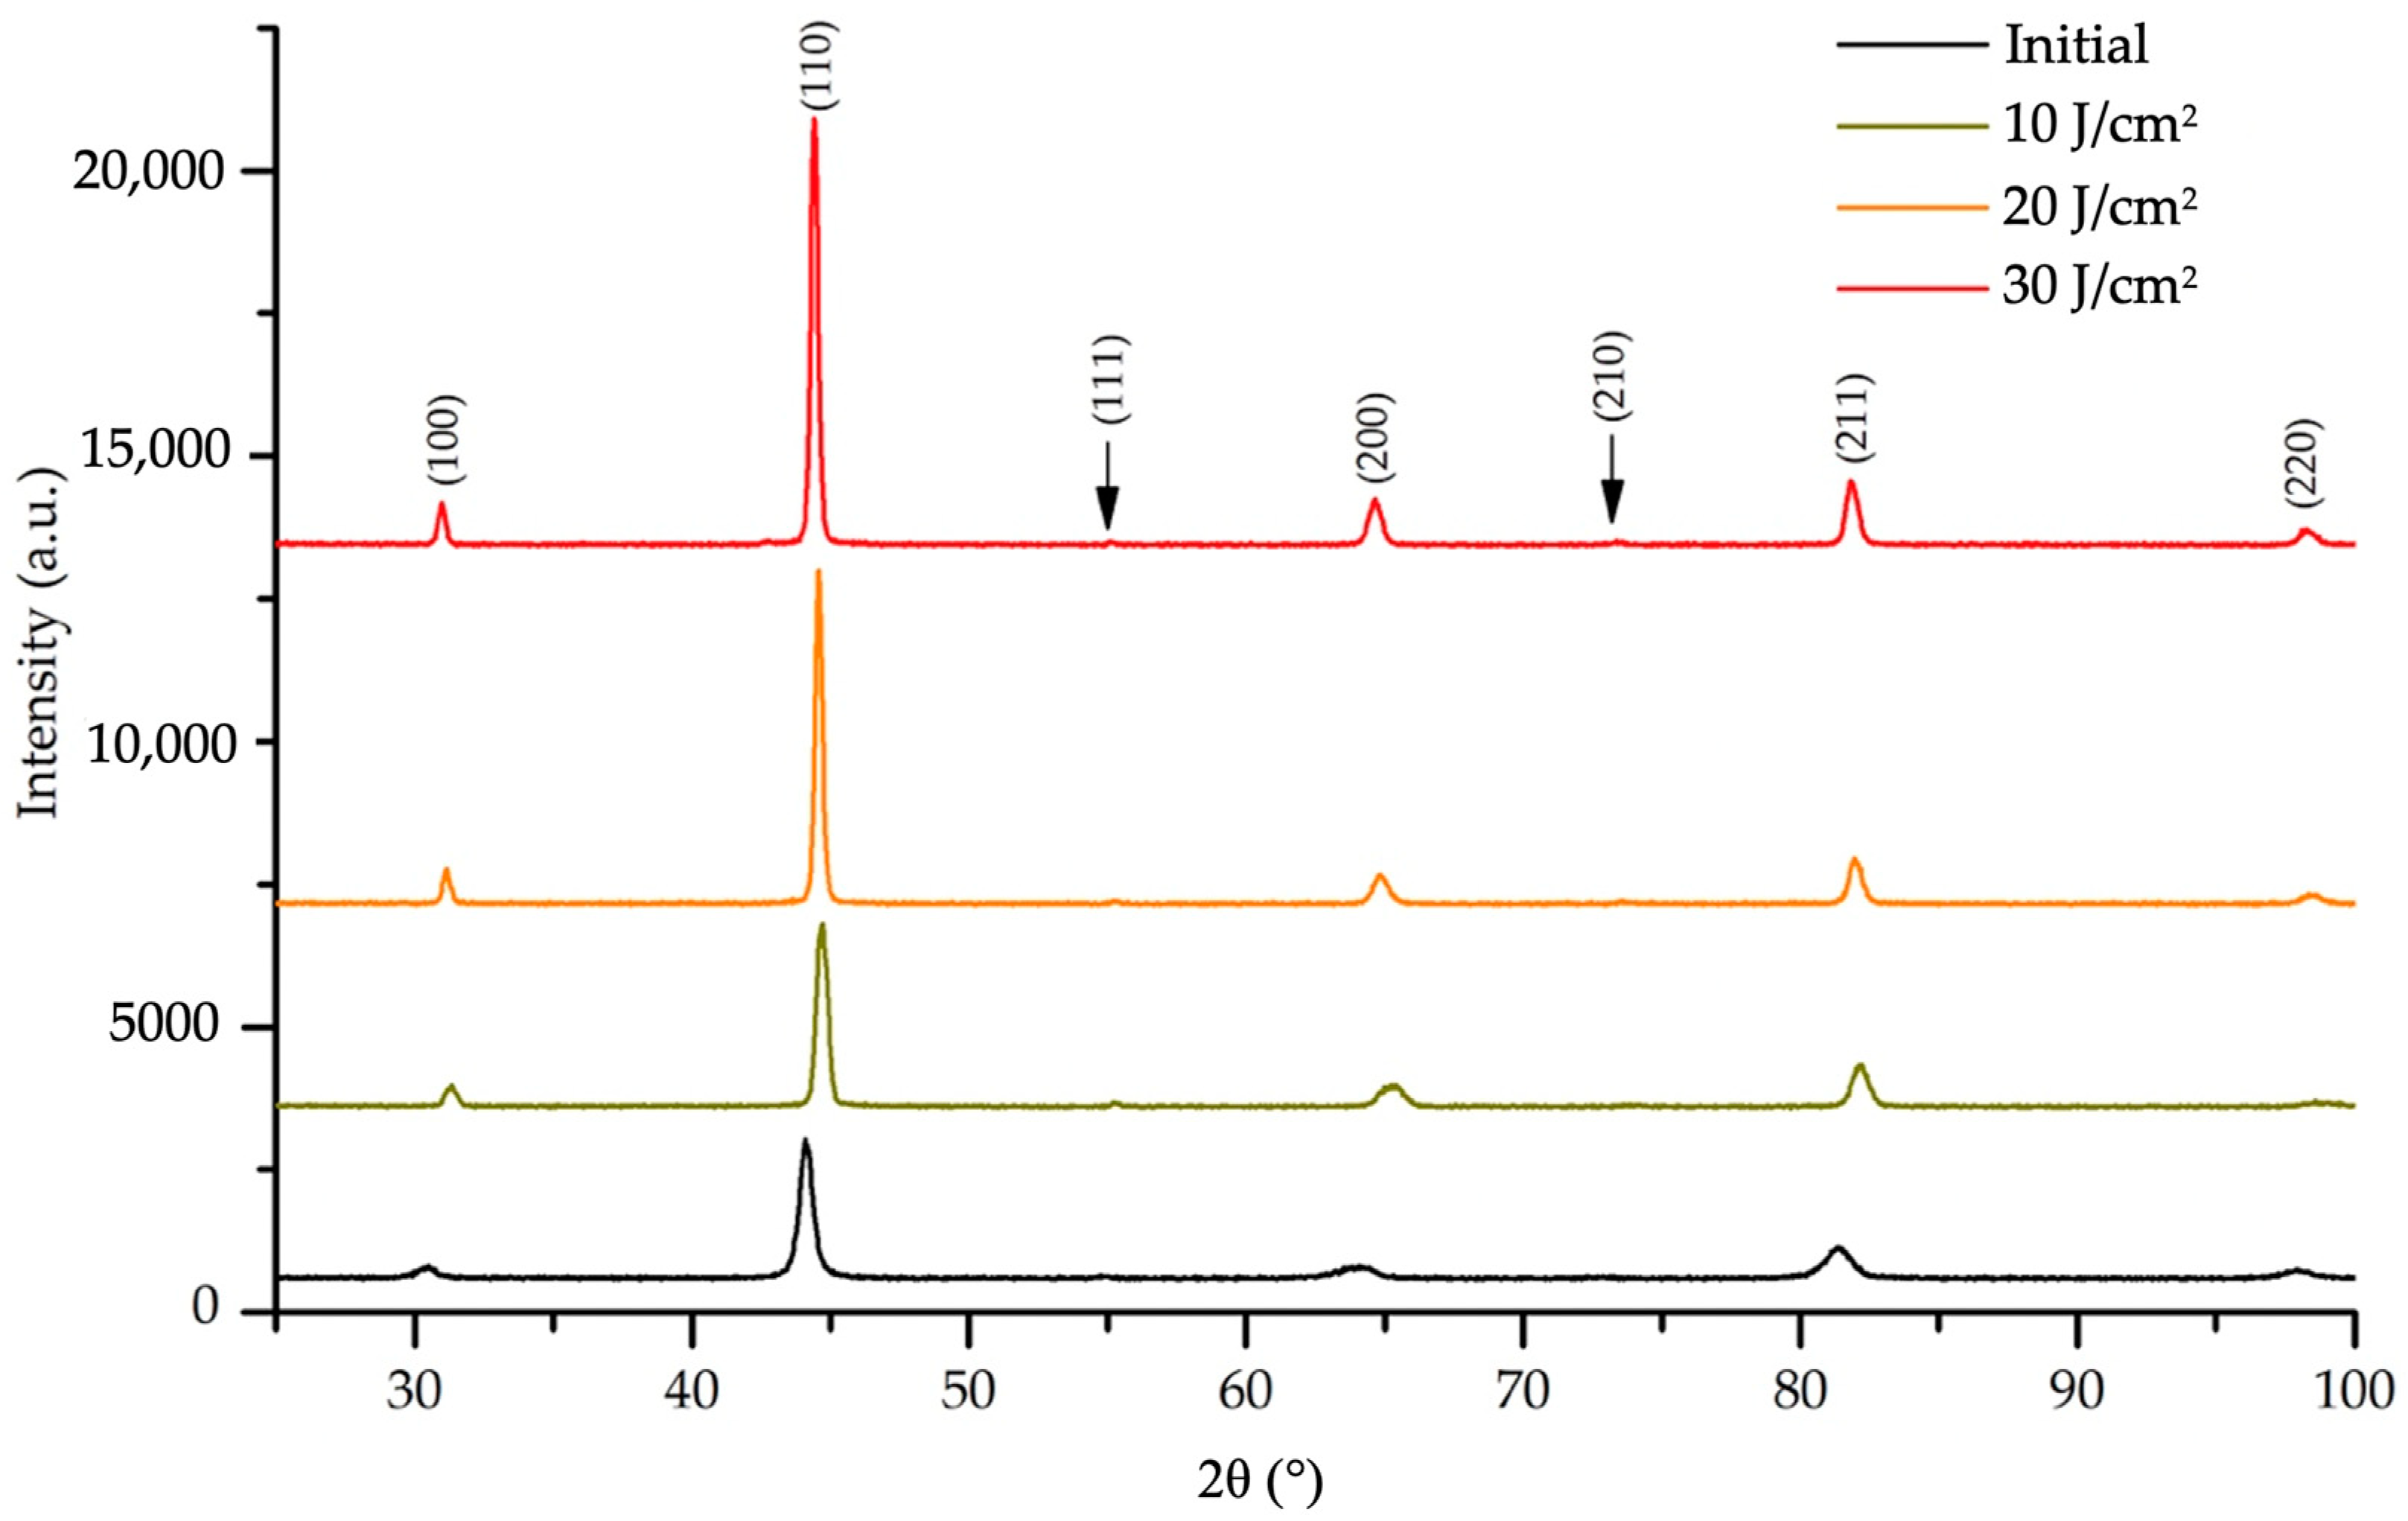
HCPEB with the following parameters 20 J/cm2, 50 µs, 3 pulses, 0.3 s−1 makes it possible to form a surface layer with the most homogeneously distributed chemical elements.

Author Contributions

Conceptualization, S.K. and Y.I.; methodology, S.K. and V.G.; software, I.P.; formal analysis, Y.I., S.V. and I.P.; investigation, S.K., Y.I. and K.O.; resources, S.K. and V.G.; writing—original draft preparation, S.K. and Y.I.; writing—review and editing, S.K., Y.I., V.G., K.O. and I.P.; supervision, V.G.; project administration, S.K. and Y.I.; funding acquisition, Y.I. All authors have read and agreed to the published version of the manuscript.

Funding

This research was funded by RUSSIAN SCIENCE FOUNDATION (project 20-19-00452).

Institutional Review Board Statement

Not applicable.

Informed Consent Statement

Not applicable.

Conflicts of Interest

The authors declare no conflict of interest.

References

  1. Cantor, B.; Chang, I.T.H.; Knight, P.; Vincent, A.J.B. Microstructural development in equiatomic multicomponent alloys. Mater. Sci. Eng. A 2004, 375–377, 213–218. [Google Scholar] [CrossRef]
  2. Yeh, J.-W.J.W.; Chen, S.K.S.-K.; Lin, S.-J.S.J.; Gan, J.Y.J.-Y.; Chin, T.S.T.-S.; Shun, T.-T.T.T.; Tsau, C.-H.C.H.; Chang, S.-Y.S.Y. Nanostructured high-entropy alloys with multiple principal elements: Novel alloy design concepts and outcomes. Adv. Eng. Mater. 2004, 6, 299–303. [Google Scholar] [CrossRef]
  3. Zhang, Y.; Zhou, Y.J.Y.J.; Lin, J.P.J.P.; Chen, G.L.G.L.; Liaw, P.K.P.K. Solid-solution phase formation rules for multi-component alloys. Adv. Eng. Mater. 2008, 10, 534–538. [Google Scholar] [CrossRef]
  4. Yang, X.; Zhang, Y. Prediction of high-entropy stabilized solid-solution in multi-component alloys. Mater. Chem. Phys. 2012, 132, 233–238. [Google Scholar] [CrossRef]
  5. Yeh, J.-W. Recent progress in high-entropy alloys. Ann. Chim. Sci. Mater. 2006, 31, 633–648. [Google Scholar] [CrossRef]
  6. Miracle, D.B.; Senkov, O.N. A critical review of high entropy alloys and related concepts. Acta Mater. 2017, 122, 448–511. [Google Scholar] [CrossRef] [Green Version]
  7. Dong, Y.; Lu, Y.; Kong, J.; Zhang, J.; Li, T. Microstructure and mechanical properties of multi-component AlCrFeNiMox high-entropy alloys. J. Alloys Compd. 2013, 573, 96–101. [Google Scholar] [CrossRef]
  8. Xu, J.; Kong, X.; Chen, M.; Wang, Q.; Wang, F. High-entropy FeNiCoCr alloys with improved mechanical and tribological properties by tailoring composition and controlling oxidation. J. Mater. Sci. Technol. 2021, 82, 207–213. [Google Scholar] [CrossRef]
  9. He, Z.; Jia, N.; Wang, H.; Yan, H.; Shen, Y. Synergy effect of multi-strengthening mechanisms in FeMnCoCrN HEA at cryogenic temperature. J. Mater. Sci. Technol. 2021, 86, 158–170. [Google Scholar] [CrossRef]
  10. Liu, B.; Wu, J.; Cui, Y.; Zhu, Q.; Xiao, G.; Wu, S.; Cao, G.H.; Ren, Z. Structural evolution and superconductivity tuned by valence electron concentration in the Nb-Mo-Re-Ru-Rh high-entropy alloys. J. Mater. Sci. Technol. 2021, 85, 11–17. [Google Scholar] [CrossRef]
  11. Li, C.; Li, J.C.; Zhao, M.; Jiang, Q. Effect of alloying elements on microstructure and properties of multiprincipal elements high-entropy alloys. J. Alloys Compd. 2009, 475, 752–757. [Google Scholar] [CrossRef]
  12. Shivam, V.; Basu, J.; Pandey, V.K.; Shadangi, Y.; Mukhopadhyay, N.K. Alloying behaviour, thermal stability and phase evolution in quinary AlCoCrFeNi high entropy alloy. Adv. Powder Technol. 2018, 29, 2221–2230. [Google Scholar] [CrossRef]
  13. Jiang, Y.Q.; Li, J.; Juan, Y.F.; Lu, Z.J.; Jia, W.L. Evolution in microstructure and corrosion behavior of AlCoCrxFeNi high-entropy alloy coatings fabricated by laser cladding. J. Alloys Compd. 2019, 775, 1–14. [Google Scholar] [CrossRef]
  14. Rohila, S.; Mane, R.B.; Ummethala, G.; Panigrahi, B.B. Nearly full-density pressureless sintering of AlCoCrFeNi-based high-entropy alloy powders. J. Mater. Res. 2019, 34, 777–786. [Google Scholar] [CrossRef]
  15. Karlsson, D.; Marshal, A.; Johansson, F.; Schuisky, M.; Sahlberg, M.; Schneider, J.M.; Jansson, U. Elemental segregation in an AlCoCrFeNi high-entropy alloy – A comparison between selective laser melting and induction melting. J. Alloys Compd. 2019, 784, 195–203. [Google Scholar] [CrossRef]
  16. Shen, Q.; Kong, X.; Chen, X. Fabrication of bulk Al-Co-Cr-Fe-Ni high-entropy alloy using combined cable wire arc additive manufacturing (CCW-AAM): Microstructure and mechanical properties. J. Mater. Sci. Technol. 2021, 74, 136–142. [Google Scholar] [CrossRef]
  17. Shiratori, H.; Fujieda, T.; Yamanaka, K.; Koizumi, Y.; Kuwabara, K.; Kato, T.; Chiba, A. Relationship between the microstructure and mechanical properties of an equiatomic AlCoCrFeNi high-entropy alloy fabricated by selective electron beam melting. Mater. Sci. Eng. A 2016, 656, 39–46. [Google Scholar] [CrossRef]
  18. Wang, R.; Zhang, K.; Davies, C.; Wu, X. Evolution of microstructure, mechanical and corrosion properties of AlCoCrFeNi high-entropy alloy prepared by direct laser fabrication. J. Alloys Compd. 2017, 694, 971–981. [Google Scholar] [CrossRef]
  19. Osintsev, K.; Konovalov, S.; Gromov, V.; Panchenko, I.; Ivanov, Y. Microstructural and mechanical characterisation of non-equiatomic Al2.1Co0.3Cr0.5FeNi2.1 high-entropy alloy fabricated via wire-arc additive manufacturing. Philos. Mag. Lett. 2021, 1–7. [Google Scholar] [CrossRef]
  20. Lyu, P.; Chen, Y.; Liu, Z.; Cai, J.; Zhang, C.; Jin, Y.; Guan, Q.; Zhao, N. Surface modification of CrFeCoNiMo high entropy alloy induced by high-current pulsed electron beam. Appl. Surf. Sci. 2020, 504, 144453. [Google Scholar] [CrossRef]
  21. Listyawan, T.A.; Lee, H.; Park, N.; Lee, U. Microstructure and mechanical properties of CoCrFeMnNi high entropy alloy with ultrasonic nanocrystal surface modification process. J. Mater. Sci. Technol. 2020, 57, 123–130. [Google Scholar] [CrossRef]
  22. Tong, Z.; Liu, H.; Jiao, J.; Zhou, W.; Yang, Y.; Ren, X. Microstructure, microhardness and residual stress of laser additive manufactured CoCrFeMnNi high-entropy alloy subjected to laser shock peening. J. Mater. Process. Technol. 2020, 285, 116806. [Google Scholar] [CrossRef]
  23. Hou, J.; Song, W.; Lan, L.; Qiao, J. Surface modification of plasma nitriding on Al CoCrFeNi high-entropy alloys. J. Mater. Sci. Technol. 2020, 48, 140–145. [Google Scholar] [CrossRef]
  24. Peng, Y.; Gong, J.; Christiansen, T.L.; Somers, M.A.J. Surface modification of CoCrFeNi high entropy alloy by low-temperature gaseous carburization. Mater. Lett. 2021, 283, 128896. [Google Scholar] [CrossRef]
  25. Zhang, L.J.; Jiang, Z.K.; Zhang, M.D.; Fan, J.T.; Liu, D.J.; Yu, P.F.; Li, G.; Liu, R.P. Effect of solid carburization on the surface microstructure and mechanical properties of the equiatomic CoCrFeNi high-entropy alloy. J. Alloys Compd. 2018, 769, 27–36. [Google Scholar] [CrossRef]
  26. Lyu, P.; Peng, T.; Miao, Y.; Liu, Z.; Gao, Q.; Zhang, C.; Jin, Y.; Guan, Q.; Cai, J. Microstructure and properties of CoCrFeNiMo0.2 high-entropy alloy enhanced by high-current pulsed electron beam. Surf. Coat. Technol. 2021, 410, 126911. [Google Scholar] [CrossRef]
  27. Nahmany, M.; Hooper, Z.; Stern, A.; Geanta, V.; Voiculescu, I. AlxCrFeCoNi High-Entropy Alloys: Surface Modification by Electron Beam Bead-on-Plate Melting. Metallogr. Microstruct. Anal. 2016, 5, 229–240. [Google Scholar] [CrossRef]
  28. Li, X.; Wang, R.; Dong, Y.; Wei, D.; Guo, J. Surface morphology and grain size of 45 steel after scanning by electron beam. Mater. Lett. 2021, 297, 129884. [Google Scholar] [CrossRef]
  29. Wang, H.; Li, L.; Qiu, S.; Zhai, W.; Li, Q.; Hao, S. Evolution of Microstructure at the Surface of 40CrNiMo7 Steel Treated by High-Current Pulsed Electron Beam. Coatings 2020, 10, 311. [Google Scholar] [CrossRef] [Green Version]
  30. Geng, Y.; Panchenko, I.; Konovalov, S.; Chen, X.; Ivanov, Y. Effect of electron beam energy densities on the surface morphology and tensile property of additively manufactured Al-Mg alloy. Nucl. Instrum. Methods Phys. Res. Sect. B Beam Interact. Mater. Atoms 2021, 498, 15–22. [Google Scholar] [CrossRef]
  31. Zhang, L.; Peng, C.-T.; Shi, J.; Jin, Y.; Lu, R. Influence of high current pulsed electron beam on microstructure and properties of Ni–W alloy coatings. J. Alloys Compd. 2020, 828, 154460. [Google Scholar] [CrossRef]
  32. Proskurovsky, D.I.; Rotshtein, V.P.; Ozur, G.E.; Ivanov, Y.F.; Markov, A.B. Physical foundations for surface treatment of materials with low energy, high current electron beams. Surf. Coat. Technol. 2000, 125, 49–56. [Google Scholar] [CrossRef]
  33. Osintsev, K.A.; Konovalov, S.V.; Glezer, A.M.; Gromov, V.E.; Ivanov, Y.F.; Panchenko, I.A.; Sundeev, R.V. Research on the structure of Al2.1Co0.3Cr0.5FeNi2.1 high-entropy alloy at submicro- and nano-scale levels. Mater. Lett. 2021, 294, 129717. [Google Scholar] [CrossRef]
  34. Dong, C.; Wu, A.; Hao, S.; Zou, J.; Liu, Z.; Zhong, P.; Zhang, A.; Xu, T.; Chen, J.; Xu, J.; et al. Surface treatment by high current pulsed electron beam. Surf. Coat. Technol. 2003, 163–164, 620–624. [Google Scholar] [CrossRef]
  35. Chumak, I.; Richter, K.W.; Ipser, H. Isothermal Sections in the (Fe, Ni)-Rich Part of the Fe-Ni-Al Phase Diagram. J. Phase Equilibria Diffus. 2008, 29, 300–304. [Google Scholar] [CrossRef]
Figure 1. (a) XRF analysis data of the HEA under study, (b) the geometry of samples irradiated by HCPEB, (c) a sample oriented to an electron beam.
Metals 11 01228 g001
Figure 2. The SEM-EDS elemental mapping of the fabricated Al-Co-Cr-Fe-Ni HEA via wire-arc additive manufacturing.
Metals 11 01228 g002
Figure 3. The TEM-EDS elemental mapping of the fabricated Al-Co-Cr-Fe-Ni HEA via wire-arc additive manufacturing. The numbers indicate areas where EDS analysis was carried out.
Metals 11 01228 g003
Figure 4. SEM analysis of the surface of the Al-Co-Cr-Fe-Ni sample after HCPEB with the different electron beam energy density (a) 10 J/cm2; (b) 20 J/cm2; (c) 30 J/cm2.
Metals 11 01228 g004
Figure 5. The TEM-EDS elemental mapping of the fabricated Al-Co-Cr-Fe-Ni HEA via wire-arc additive manufacturing and irradiated by HCPEB (10 J/cm2, 50 µs, 3 pulses, 0.3 s−1). The numbers indicate areas where EDS analysis was carried out.
Metals 11 01228 g005
Figure 6. The TEM-EDS elemental mapping of the fabricated Al-Co-Cr-Fe-Ni HEA via wire-arc additive manufacturing and irradiated by HCPEB (20 J/cm2, 50 µs, 3 pulses, 0.3 s−1).
Metals 11 01228 g006
Figure 7. SEM images of a surface fracture of HEA irradiated by HCPEB (20 J/cm2, 50 µs, 3 pulses, 0.3 s−1). (a) Magnification × 2500. (b) Magnification × 10000. The arrow (a) indicates the irradiated surface.
Metals 11 01228 g007
Figure 8. Images of HEA structure forming after irradiating the alloy by a pulsed electron beam; (a) an image obtained by a STEM-based analysis of foils; (b) a TEM-based analysis of foils.
Metals 11 01228 g008
Figure 9. Electron-microscopic view of a HEA processed by a pulsed electron beam. The table presents the results of EDS analysis of the given foil zone.
Metals 11 01228 g009
Figure 10. SEM image of a HEA irradiated by HCPEB 20 J/cm2, 50 µs, 3 pulses, 0.3 s−1. The numbers indicate areas where EDS analysis was carried out.
Metals 11 01228 g010
Figure 11. The TEM-EDS elemental mapping of the fabricated Al-Co-Cr-Fe-Ni HEA via wire-arc additive manufacturing and irradiated by HCPEB (30 J/cm2, 50 µs, 3 pulses, 0.3 s−1).
Metals 11 01228 g011
Figure 12. XRD patterns of HEA sample modified with HCPEB with the different energy densities.
Metals 11 01228 g012
Figure 13. The inhomogeneity distribution coefficient (δ) of chemical elements in the HEA vs. energy density of an electron beam (Es).
Metals 11 01228 g013
Table 1. The TEM-EDS elemental mapping outcomes (at. %) of the foil section presented in Figure 3.
No.OAlSiCrFeCoNi
13.22.41.475.013.21.53.3
2−2.6−0.32.982.813.52.41.4
36.70.14.371.214.61.11.9
43.13.44.171.112.71.64.0
511.08.25.755.28.43.67.9
614.513.75.841.28.52.913.4
79.727.86.37.916.26.525.6
85.812.46.323.033.15.014.5
913.431.57.43.011.74.928.2
1016.77.87.923.731.45.07.5
11−2.62.910.831.645.85.95.7
126.617.35.619.129.16.016.3
1313.510.56.522.731.64.310.8
1410.418.47.817.726.64.314.8
Average7.811.25.938.921.23.911.1
Max16.731.510.882.845.86.528.2
Min3.10.11.43.08.41.11.4
δ (max/min)5.413.17.827.55.55.920.8
Average is the mean value of the content of the element. Max is the maximum value of the content of the element. Min is the minimum value of the content of the element. δ (max/min) is the maximum value divided by the minimum value of the content of the element.
Table 2. The TEM-EDS elemental mapping outcomes (at. %) of the foil section presented in Figure 5.
No.OAlSiCrFeCoNi
12.01.61.361.514.63.315.7
23.71.22.652.220.23.616.5
31.01.31.531.643.16.215.5
42.01.52.829.342.46.015.9
54.110.93.213.326.66.535.5
62.45.43.520.734.66.526.8
72.72.33.425.438.96.520.8
83.51.73.938.529.55.217.7
90.91.02.260.516.53.515.5
102.59.22.415.027.27.236.5
Average2.53.62.734.829.35.521.7
Max4.110.93.961.543.17.236.5
Min0.91.01.313.314.63.315.5
δ (max/min)4.610.43.14.63.02.22.4
Average is the mean value of the content of the element. Max is the maximum value of the content of the element. Min is the minimum value of the content of the element. δ (max/min) is the maximum value divided by the minimum value of the content of the element.
Table 3. The TEM-EDS elemental mapping outcomes (at. %) of the foil section presented in Figure 6.
No.OAlSiCrFeCoNi
111.138.93.65.910.42.927.2
29.639.04.45.212.53.725.7
39.136.83.34.311.84.929.7
47.641.31.85.311.74.727.7
54.840.64.25.012.04.429.1
612.338.03.95.011.93.525.4
711.425.28.017.414.44.019.8
811.717.58.523.323.53.212.3
95.424.55.217.520.35.621.5
1015.215.813.616.121.03.814.6
119.815.26.121.922.44.320.3
126.928.77.115.718.54.318.8
Average9.630.15.811.915.94.122.7
Max15.241.313.623.323.55.629.7
Min4.815.21.84.310.42.912.3
δ (max/min)3.12.77.55.42.31.92.4
Average is the mean value of the content of the element. Max is the maximum value of the content of the element. Min is the minimum value of the content of the element. δ (max/min) is the maximum value divided by the minimum value of the content of the element.
Table 4. The TEM-EDS elemental mapping outcomes (at. %) of the foil section presented in Figure 11.
No.AlSiTiCrFeCoNi
120.411.00.727.720.43.516.3
27.59.91.147.323.53.17.6
324.49.40.522.719.64.019.3
421.313.60.621.122.64.016.8
529.112.50.317.518.44.018.2
640.18.80.04.912.54.229.4
740.37.40.25.511.74.330.6
840.49.10.05.112.04.828.5
942.08.00.25.511.74.428.3
1040.48.6−0.14.812.54.329.5
1141.38.90.15.011.74.428.5
1239.49.10.25.012.24.529.6
1337.610.00.15.614.05.127.6
1441.310.20.14.711.54.327.9
1541.38.30.04.510.94.730.4
Average33.89.70.312.515.04.224.6
Max.42.013.61.147.323.55.130.6
Min.7.57.4−0.14.510.93.17.6
δ (max/min)5.61.811.010.52.21.64.0
Average is the mean value of the content of the element. Max is the maximum value of the content of the element. Min is the minimum value of the content of the element. δ (max/min) is the maximum value divided by the minimum value of the content of the element.
Publisher’s Note: MDPI stays neutral with regard to jurisdictional claims in published maps and institutional affiliations.

