Article

Experimental Phase Equilibria and Isopleth Section of 8Nb-TiAl Alloys

1
School of Materials Science and Engineering, Shandong Jianzhu University, Jinan 250101, China
2
State Key Laboratory for Advanced Metals and Materials, University of Science and Technology Beijing, Beijing 100083, China
3
State Key Laboratory of Solidification Processing, Northwestern Polytechnical University, Xi’an 710072, China
4
Beijing Research Institute of Mechanical & Electrical Technology, Beijing 100083, China
*
Authors to whom correspondence should be addressed.
Metals 2021, 11(8), 1229; https://doi.org/10.3390/met11081229
Submission received: 24 June 2021 / Revised: 25 July 2021 / Accepted: 27 July 2021 / Published: 1 August 2021
(This article belongs to the Special Issue Microstructure and Properties of High Temperature Intermetallic)

Abstract

:
The 8Nb isopleth section of a Ti-Al-Nb system is experimentally determined based on thermal analysis and thermodynamic calculation methods to obtain the phase transformation and equilibrium relations required for material design and fabrication. The phase transus and relations for the 8Nb-TiAl system show some deviations from the calculated thermodynamic results. The ordered βo phase transforms from the disordered β/α phases at 1200–1400 °C over a large Al concentration range, and this transformation is considered to be an intermediate type between the first- and second-order phase transitions. Moreover, the βo phases are retained at the ambient temperature in the 8Nb-TiAl microstructures. The ωo phase transforms from the highly ordered βo phase, rather than from α2 or βo with a low degree of atom ordering B2 (LOB2) structure, with Al concentration of 32–43 at% at approximately 850 °C. From the experimental detection, the transition of the ωo phase from the βo phase is considered to be a further ordering process.

Graphical Abstract

1. Introduction

In the past decade, TiAl-based alloys have been considered promising candidates for high-temperature materials in aerospace and automotive applications because of their excellent properties of low density, high specific yield strength and stiffness, and favorable oxidation resistance and creep properties up to high temperatures [1,2,3]. TiAl alloys containing high amounts of Nb, based on the γ-TiAl and α2-Ti3Al intermetallic, exhibit excellent high-temperature strength and oxidation resistance [4] and have attracted significant attention [3,5]. Advanced materials based on the Ti-Al-Nb alloys can be used at temperatures above 800 °C [6]. As reported by Appel et al. [3] and Erdely et al. [7], both the hot-workability and the ductility can be effectively promoted by the β phase [5,8], which provides a sufficient number of independent slip systems to act as a ductile constituent in the final microstructure [9,10]. Moreover, the solid-state transformation pathway and the microstructure of TiAl-based alloys can be manipulated through β/βo phases [3,7,11]. According to reports by Cheng et al. [12], Kobayashi et al. [13], and Takeyama et al. [14], a multitude of solid-state transformations and resulting microstructural morphologies can be achieved by stabilizing the β phase [3].
The phase diagram and phase equilibria of the Ti-Al-Nb system play important roles in material design and fabrication, especially in the manipulation of the solid-state transformation pathway and microstructure [5,15,16]. Phase transition behaviors can be precisely detected by some thermal detection methods, such as differential scanning calorimetry (DSC), differential thermal analysis (DTA), and in-situ X-ray/neutron diffraction technologies. These determination methods generally show good agreement with each other [17,18,19,20,21,22,23]. Phase diagrams of the three constituent binary systems in the Ti-Al-Nb system—Ti-Al [24], Al-Nb [25], and Ti-Nb [26]—have been sufficiently delineated. The isothermal sections at 1000 °C [27,28,29,30], 1100 °C [30,31], 1150 °C [28,29,30], 1200 °C [27,32], 1300 °C [33], and 1400 °C [28,29,34,35] from experimental data are available in the literature. In addition, isopleth sections show the development of phase equilibria, such as the Ti72.5Al27.5-Nb [36], Ti78Al22-Nb [37], TiAl-TiNb [37,38], 45Al [25], 47Al [25], 8Nb [25,39], and 10Nb sections [39]. Thermodynamic methods have also been adopted to assess the diagrams of Ti-Al-Nb systems [25,40,41]. Recent reviews of literature on the Ti-Al-Nb system up to 2011 have been provided by Witusiewicz et al. [25], Cupid et al. [41], and Raghvan et al. [42]. However, insufficient experimental data contributed to some differences between these assessments, including the equilibria of the α2, βo, O, and ωo phases.
The 8Nb-TiAl alloys, as a new family of TiAl-based alloys, have been widely investigated owing to their higher strength and good oxidation resistance [43,44]. For addition of 8 at% Nb in the TiAl alloys, the transus temperatures of α and β, as well as the α phase field, are generally decreased, inducing the significant refinement of the structure and the improvement of the yield strength [45]. Table 1 presents the phases most frequently used for the Ti-Al-Nb system in this work, as well as their crystallographic data [20,41,46,47]. However, a lack of knowledge regarding the constitution of such multicomponent systems is one of the major obstacles to alloy development and significant work has to be expended to obtain reliable information on phase relationships [46].
In this work, the 8Nb isopleth section, as well as the phase equilibria, of the Ti-Al-Nb system is experimentally determined by DSC, scanning electron microscopy (SEM), and X-ray diffraction (XRD). The samples were annealed sufficiently in high vacuum and then slowly cooled to achieve the equilibrium state as far as possible. However, considering the difficulty of achieving thermodynamic equilibrium in practice, the experimental phase equilibria may have some deviations from thermodynamic equilibria. This work aims to establish the experimental isopleth and phase equilibria of the 8Nb-Ti-Al system, which have the treating conditions closer to the actual production, to obtain the phase transformation and equilibrium relationships required for material design and fabrication.

2. Materials and Methods

Eighteen ternary 8Nb-TiAl alloy buttons were prepared by non-consumable arc melting (with a tungsten electrode) from high-purity initial components (Ti, Al, Nb: 99.99 wt%) using a water-cooled copper hearth in an ultra-high-purity argon atmosphere. Only those samples with less than 1.0 wt% weight losses were adopted for further analysis. Each button (with a mass of approximately 30 g) was melted, turned over, and re-melted five times to ensure homogeneity. The diffusion annealing was performed in high vacuum at 1400 °C for 20 h to equilibrate and coarsen the phase. The samples were then slowly cooled to 50 °C in the furnace (cooling rate: ~1.0 °C/min). Thermodynamic equilibrium calculations were performed by the Calculation Phase Diagrams (CALPHAD) method using the commercial software Pandat® (v2017.1, Compu Them, Middleton, WI USA) [48], following the thermodynamic description from Witusiewicz’s investigation [25]. The phase structures were detected by XRD (D8 Advance, Bruker, Bremen, Germany) using powder samples, prepared in a metallic miller, and operated at 40 kV and 40 mA with Cu Kα. For the morphology analysis, sample sizes of 8 mm × 8 mm × 8 mm were cut from the centers of the buttons with an electron discharge cutting machine (New Sparkie, Shaoxing, China), and the samples were then polished following standard mechanical polishing procedures. The microstructures of the annealed samples were obtained by SEM in back-scattered electron (BSE) mode (JSM-6380, JEOL, Musashino, Japan), operated at 20 kV and at a working distance of 10 mm. The compositions in the samples were analyzed by the optical emission spectrometer (OES, Q4 TASMAN 130, Bruker, Bremen, Germany).
The solid-state transformation temperatures were determined by DSC (404C, NETZSCH, Selb, Germany) with an Al2O3 crucible. Discs of 4 mm diameter and 3 mm thickness (150–180 mg), which produced sufficient signals in the argon atmosphere, were machined from the centers of the buttons. Temperature calibrations for the equipment were conducted by melting high-purity Cu, Al, Ag, and Ni at scan rates of 5 and 10 °C/min to determine the correction equation. In this work, the heating rate for all test samples (excluding the calibration samples) was 10 °C/min, using a covered Al2O3 crucible with a maximum temperature of 1450 °C, and within a dynamic Ar atmosphere with a flow rate of 30 mL/min. To account for the influence of the containers, the DSC signals of the empty crucibles were subtracted from the detected traces. As a standard comparison sample, thermal data were acquired from sapphire, using the same parameters as those applied to the 8Nb-TiAl samples, to determine the specific heat capacity (Cp) by Equation (1).
C p S a m p l e = D S C s a m p l e D S C s a p p h i r e · C p S a p p h i r e
In this work, to improve the accuracy and uniformity of the data acquisition process, a new method was developed for determining and calibrating the onset transformation temperatures for the different cooling/heating rates in DSC detection. The first derivatives of the DSC traces (DDSC) were employed to determine the transformation temperatures. The temperature difference, ΔT = 38 °C, was adopted to calibrate the dynamic transformation temperatures. Full details are given in Supplementary Materials.

3. Results

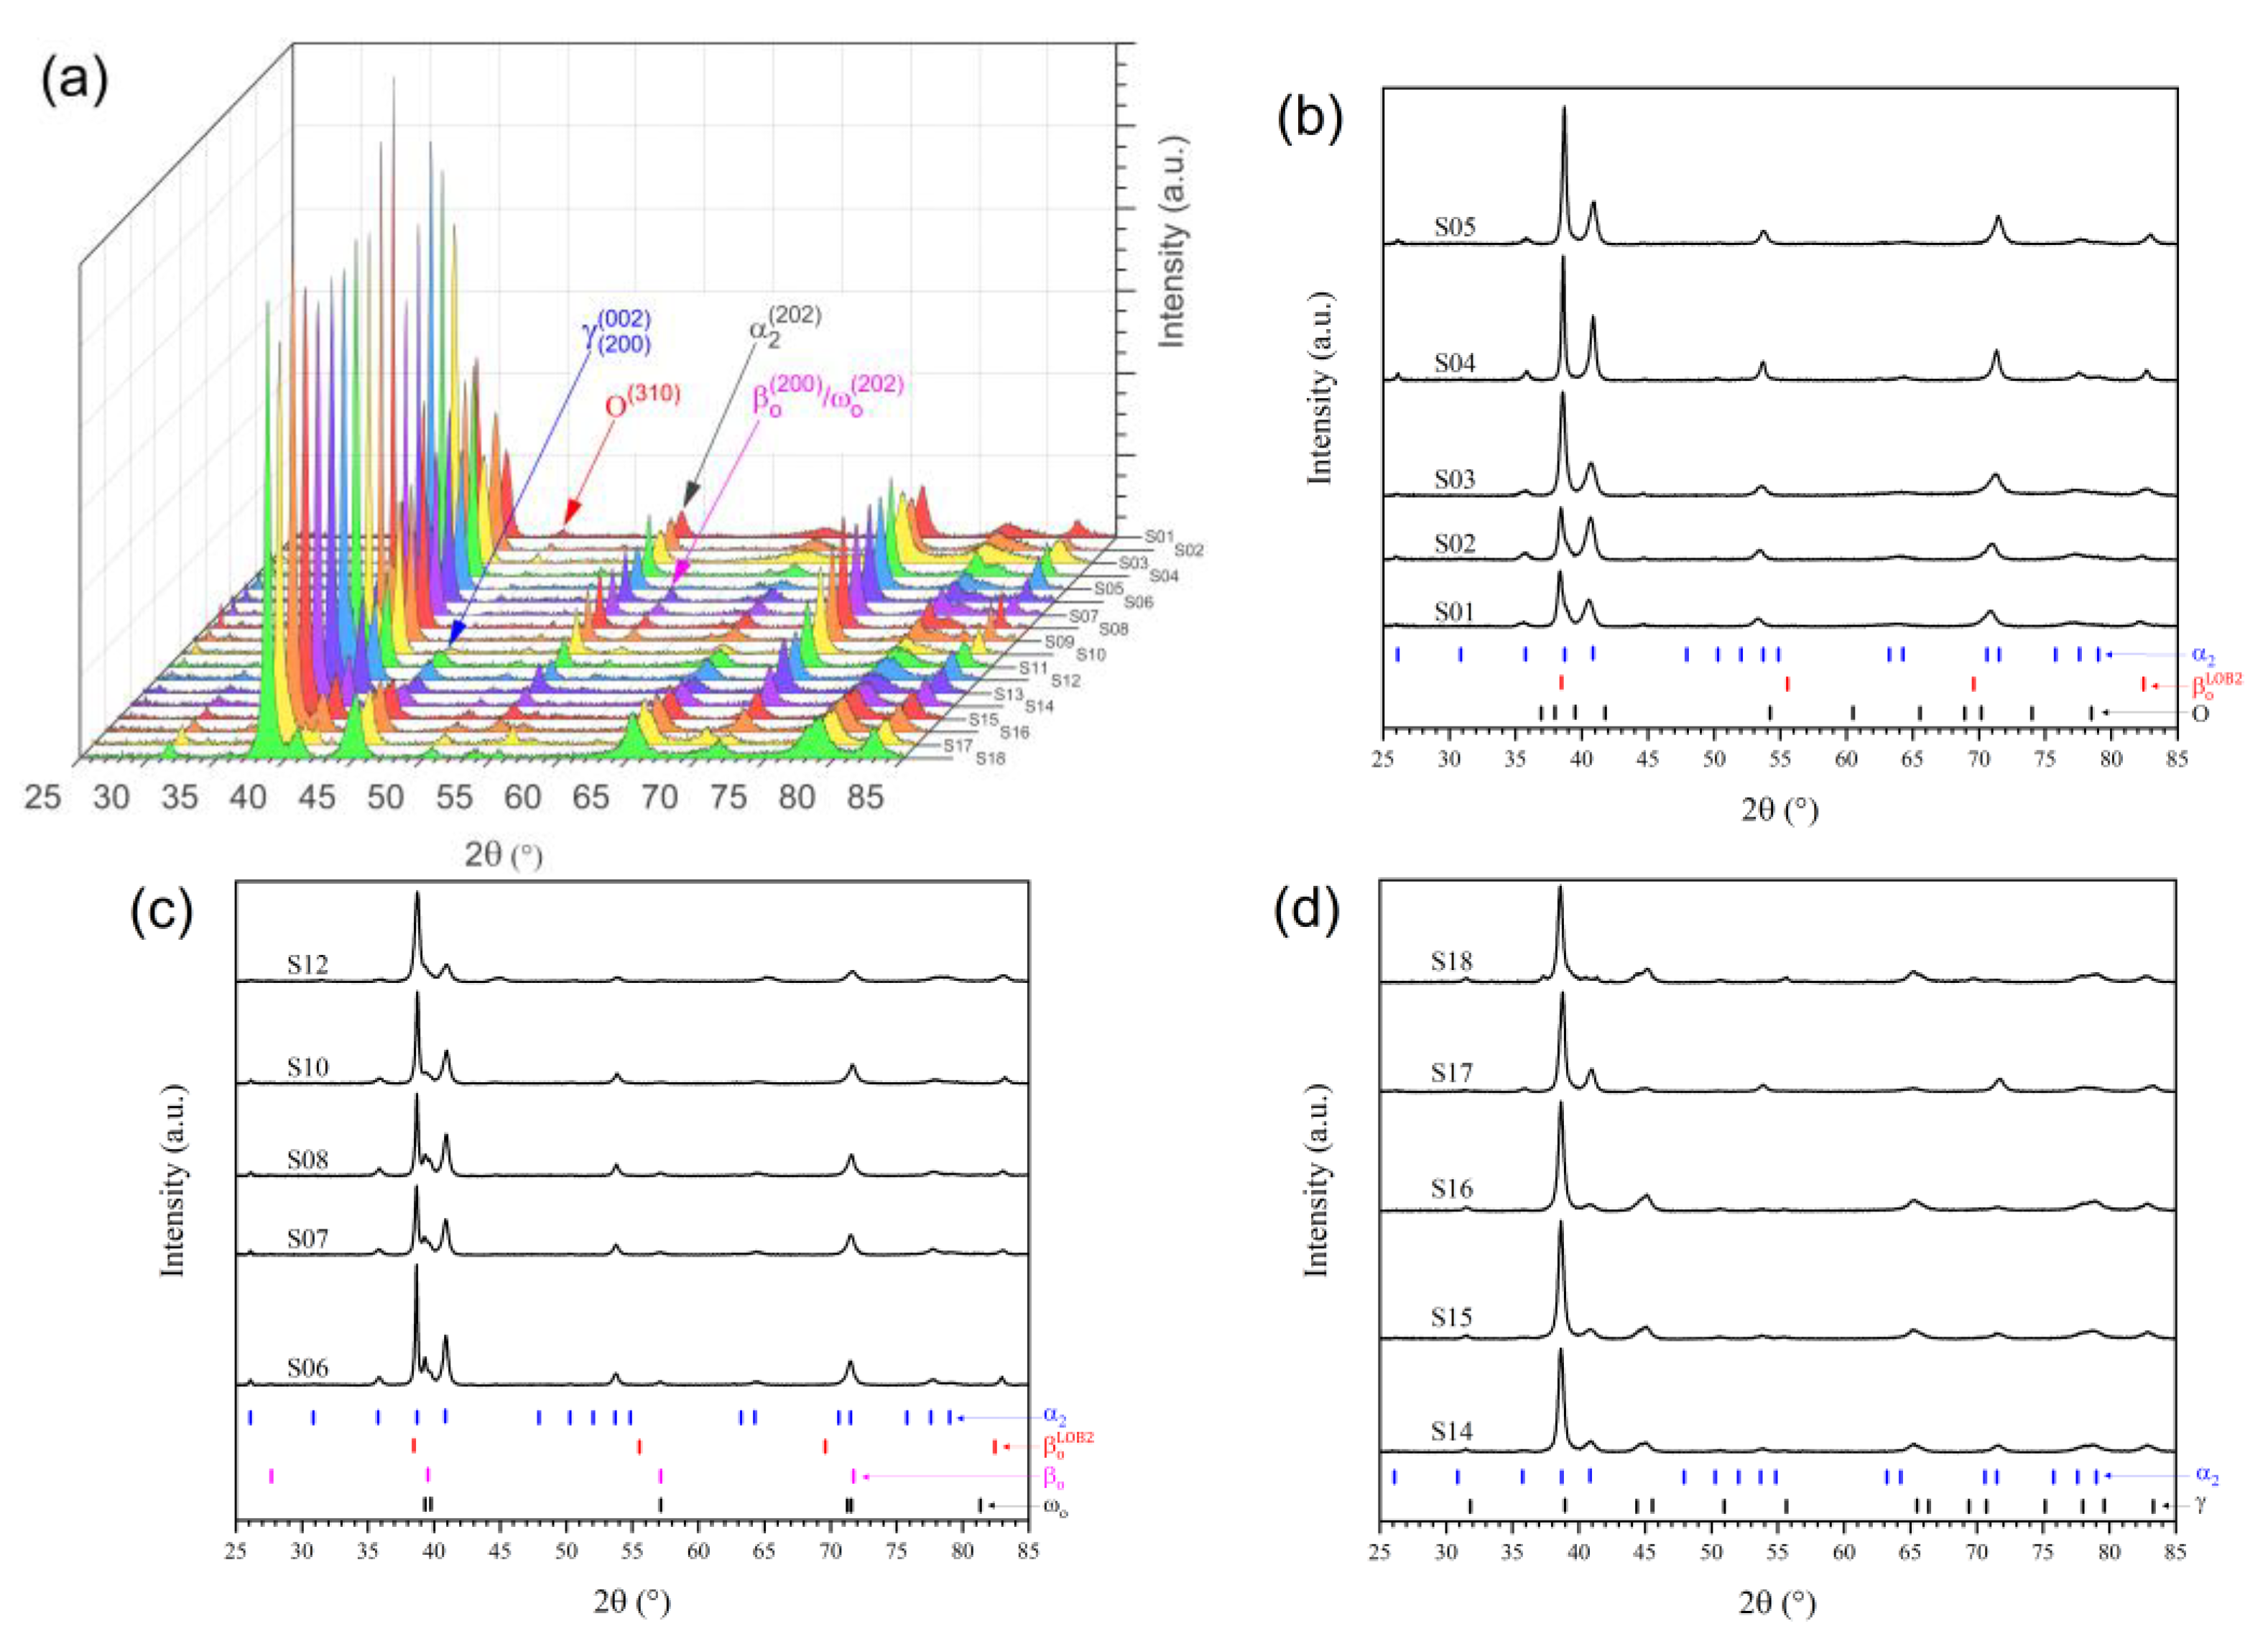
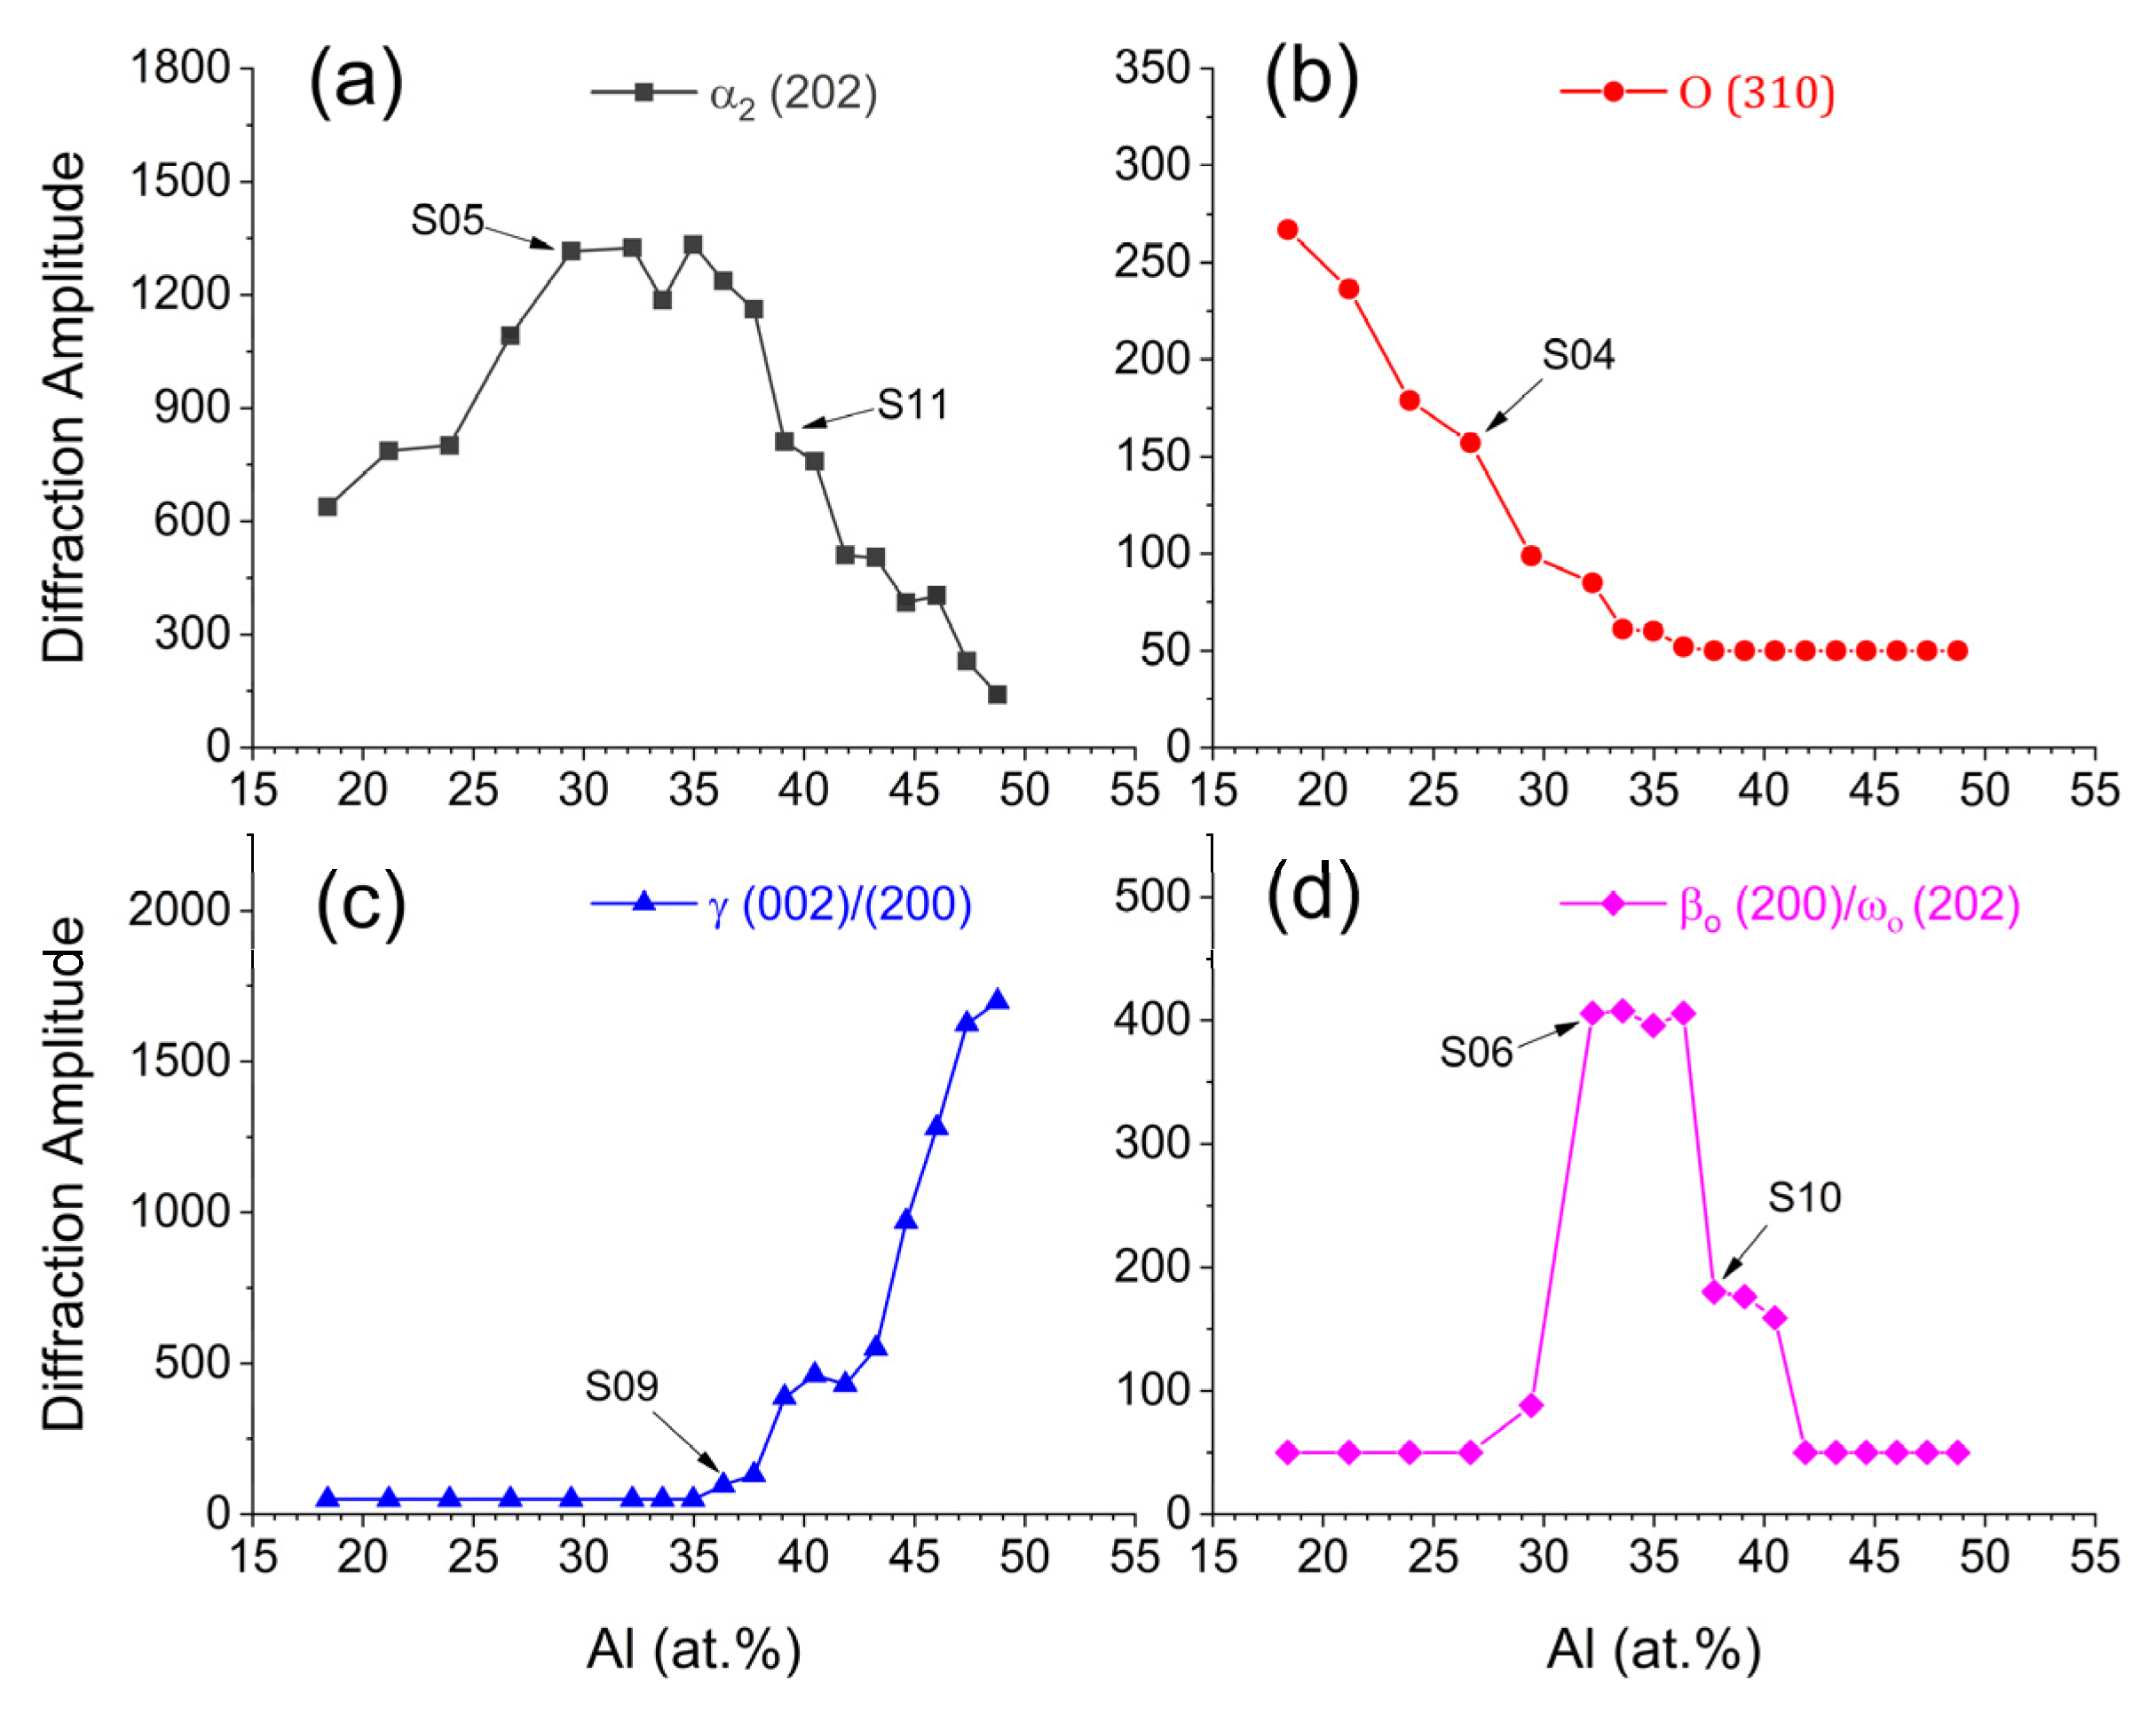
3.1. Phase Evolution
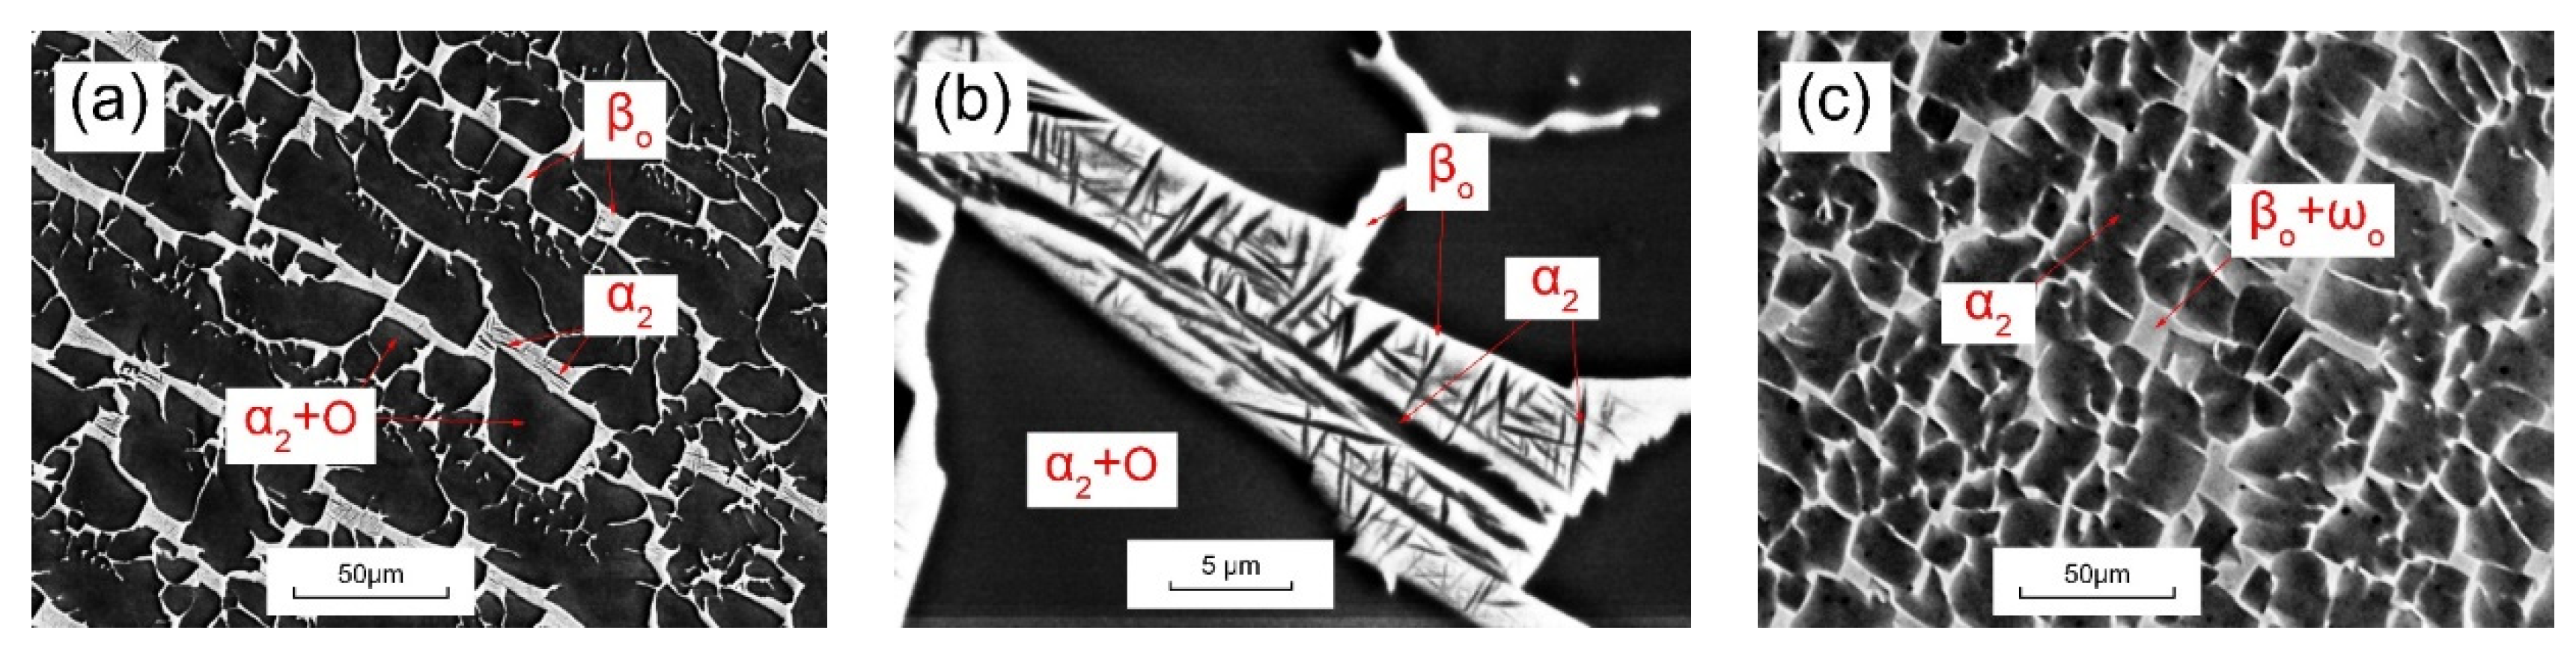
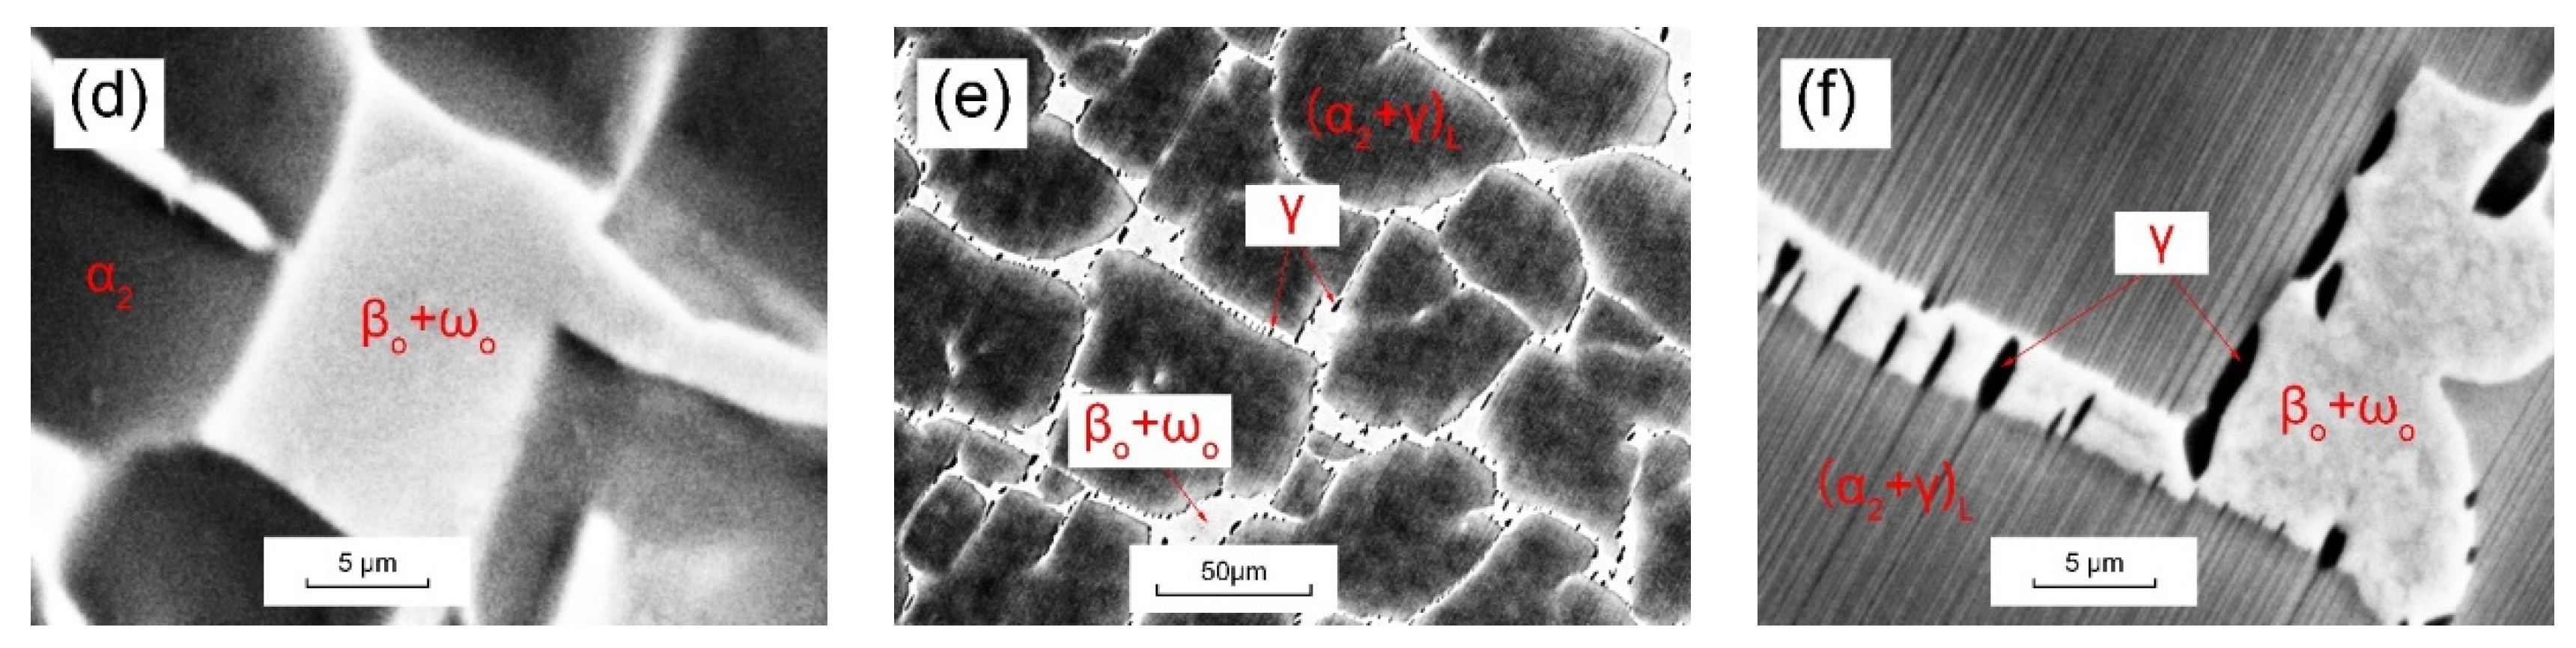
The chemical compositions of the 8Nb-TiAl alloys (S01–S18) determined by OES, with the nominal compositions, are presented in Table 2. The specific reflections of certain phases—α2(202), γ(002)/(200), O(310), and βo(200)/ωo(202)—were selected to describe the phase evolution, as shown in Figure 1. The reflection in S01–S12 at approximately 38.5° was much stronger than the reflection at 40.8°, showing the overlap of the diffraction peaks with the βo phase. For this βo phase, the (110)/(220) reflections of the disordered β structure were preserved, whereas the (200)/(211) reflections were suppressed, indicating a LOB2 structure, as shown in Figure 1b,c. However, as shown by the XRD pattern of Sample S06–S12, the reflection at approximately 39.3° was considered to indicate overlapping of the βo and ωo phases, as shown in Figure 1c. The βo phase was fully depressed in S14–S18, as shown in Figure 1d. Check out the Supplementary Materials for more details.
The evolution of the fraction of each phase in the samples can be roughly evaluated by the reflection peak height, where unstacked reflections should be selected first. Figure 2 shows the peaks of the α2(202), γ(002)/(200), O(310), and βo(200)/ωo(202) reflections in the 8Nb-TiAl samples. The α2 phase was detected as the main phase in all the samples, as shown in Figure 1. The fraction of the α2 phase increased with increased Al content in Samples S01–S10, then decreased with continuing Al increases in Samples S11–S18, as shown in Figure 2a. The fraction of γ phase was small in Samples S01–S10, and then the γ phase fraction increased continuously as the Al content increased in Samples S11–S18, as shown in Figure 2c. The presence of the O phase could be identified by the (310) reflection in the Al-lean S01–S05 samples, as shown in Figure 2b, and the ωo and βo phases were identified in Samples S06–S12, as shown in Figure 1b and Figure 2d. The fraction of βoo phases increased dramatically in Samples S06–S09, then decreased in S10–S13. In the Al-rich S13–S18 samples, only two phases formed: α2 and γ.

3.2. Morphology

As shown in Figure 3a,b, the morphologies of Samples S01–S05 (18.4–29.4 at% Al) comprised coarse α2 laths and O phase (dark regions); flaky α2 particles in the low order βo matrix; interwoven βo structures (bright regions). The βo phase mainly appeared along the α2 grain boundaries and only a small volume fraction of the βo phase was present within the α2 laths. As Al increased in Samples S01–S05, the fraction of α2 increased while the O and βo phases decreased, as observed by the morphology analysis. The presence of ωo in Samples S06–S12 was identified by XRD, as shown in Figure 1, whereas this phase was not observed in the microstructure, as shown in Figure 3 and Figure 4. For Samples S06–S09, the morphology mainly consisted of the coarse α2 laths and interwoven βoo structures, as shown in Figure 3c,d. The βo phase was mainly located along colony boundaries and only a small volume fraction was present within the colonies [5]. The morphologies of Samples S10–S12 consisted of lamellar colonies, (α2+γ)L, and interwoven βoo structures, as shown in Figure 3e,f. Isolated γ equiaxed grains were found on the boundaries of α2 and βo, as shown in Figure 3 and Figure 4. The morphologies of Samples S13–S17 were fully lamellar, as shown in Figure 4a–d. The size of the lamellar colonies and the interlamellar spacing in these samples increased greatly. Figure 4c,d show that both the proeutectoid α2 and the γ were largely situated along boundaries, at the triple lines of (α2+γ)L, and around the βo grains. However, the presence of βo and γ was extremely restrained as the Al content increased to 44.6 at.%, as shown in Figure 4c,d. The morphology of Sample S18 consisted of coarse γ laths and interwoven eutectoid α2+γ microstructures, as shown in Figure 4e,f.

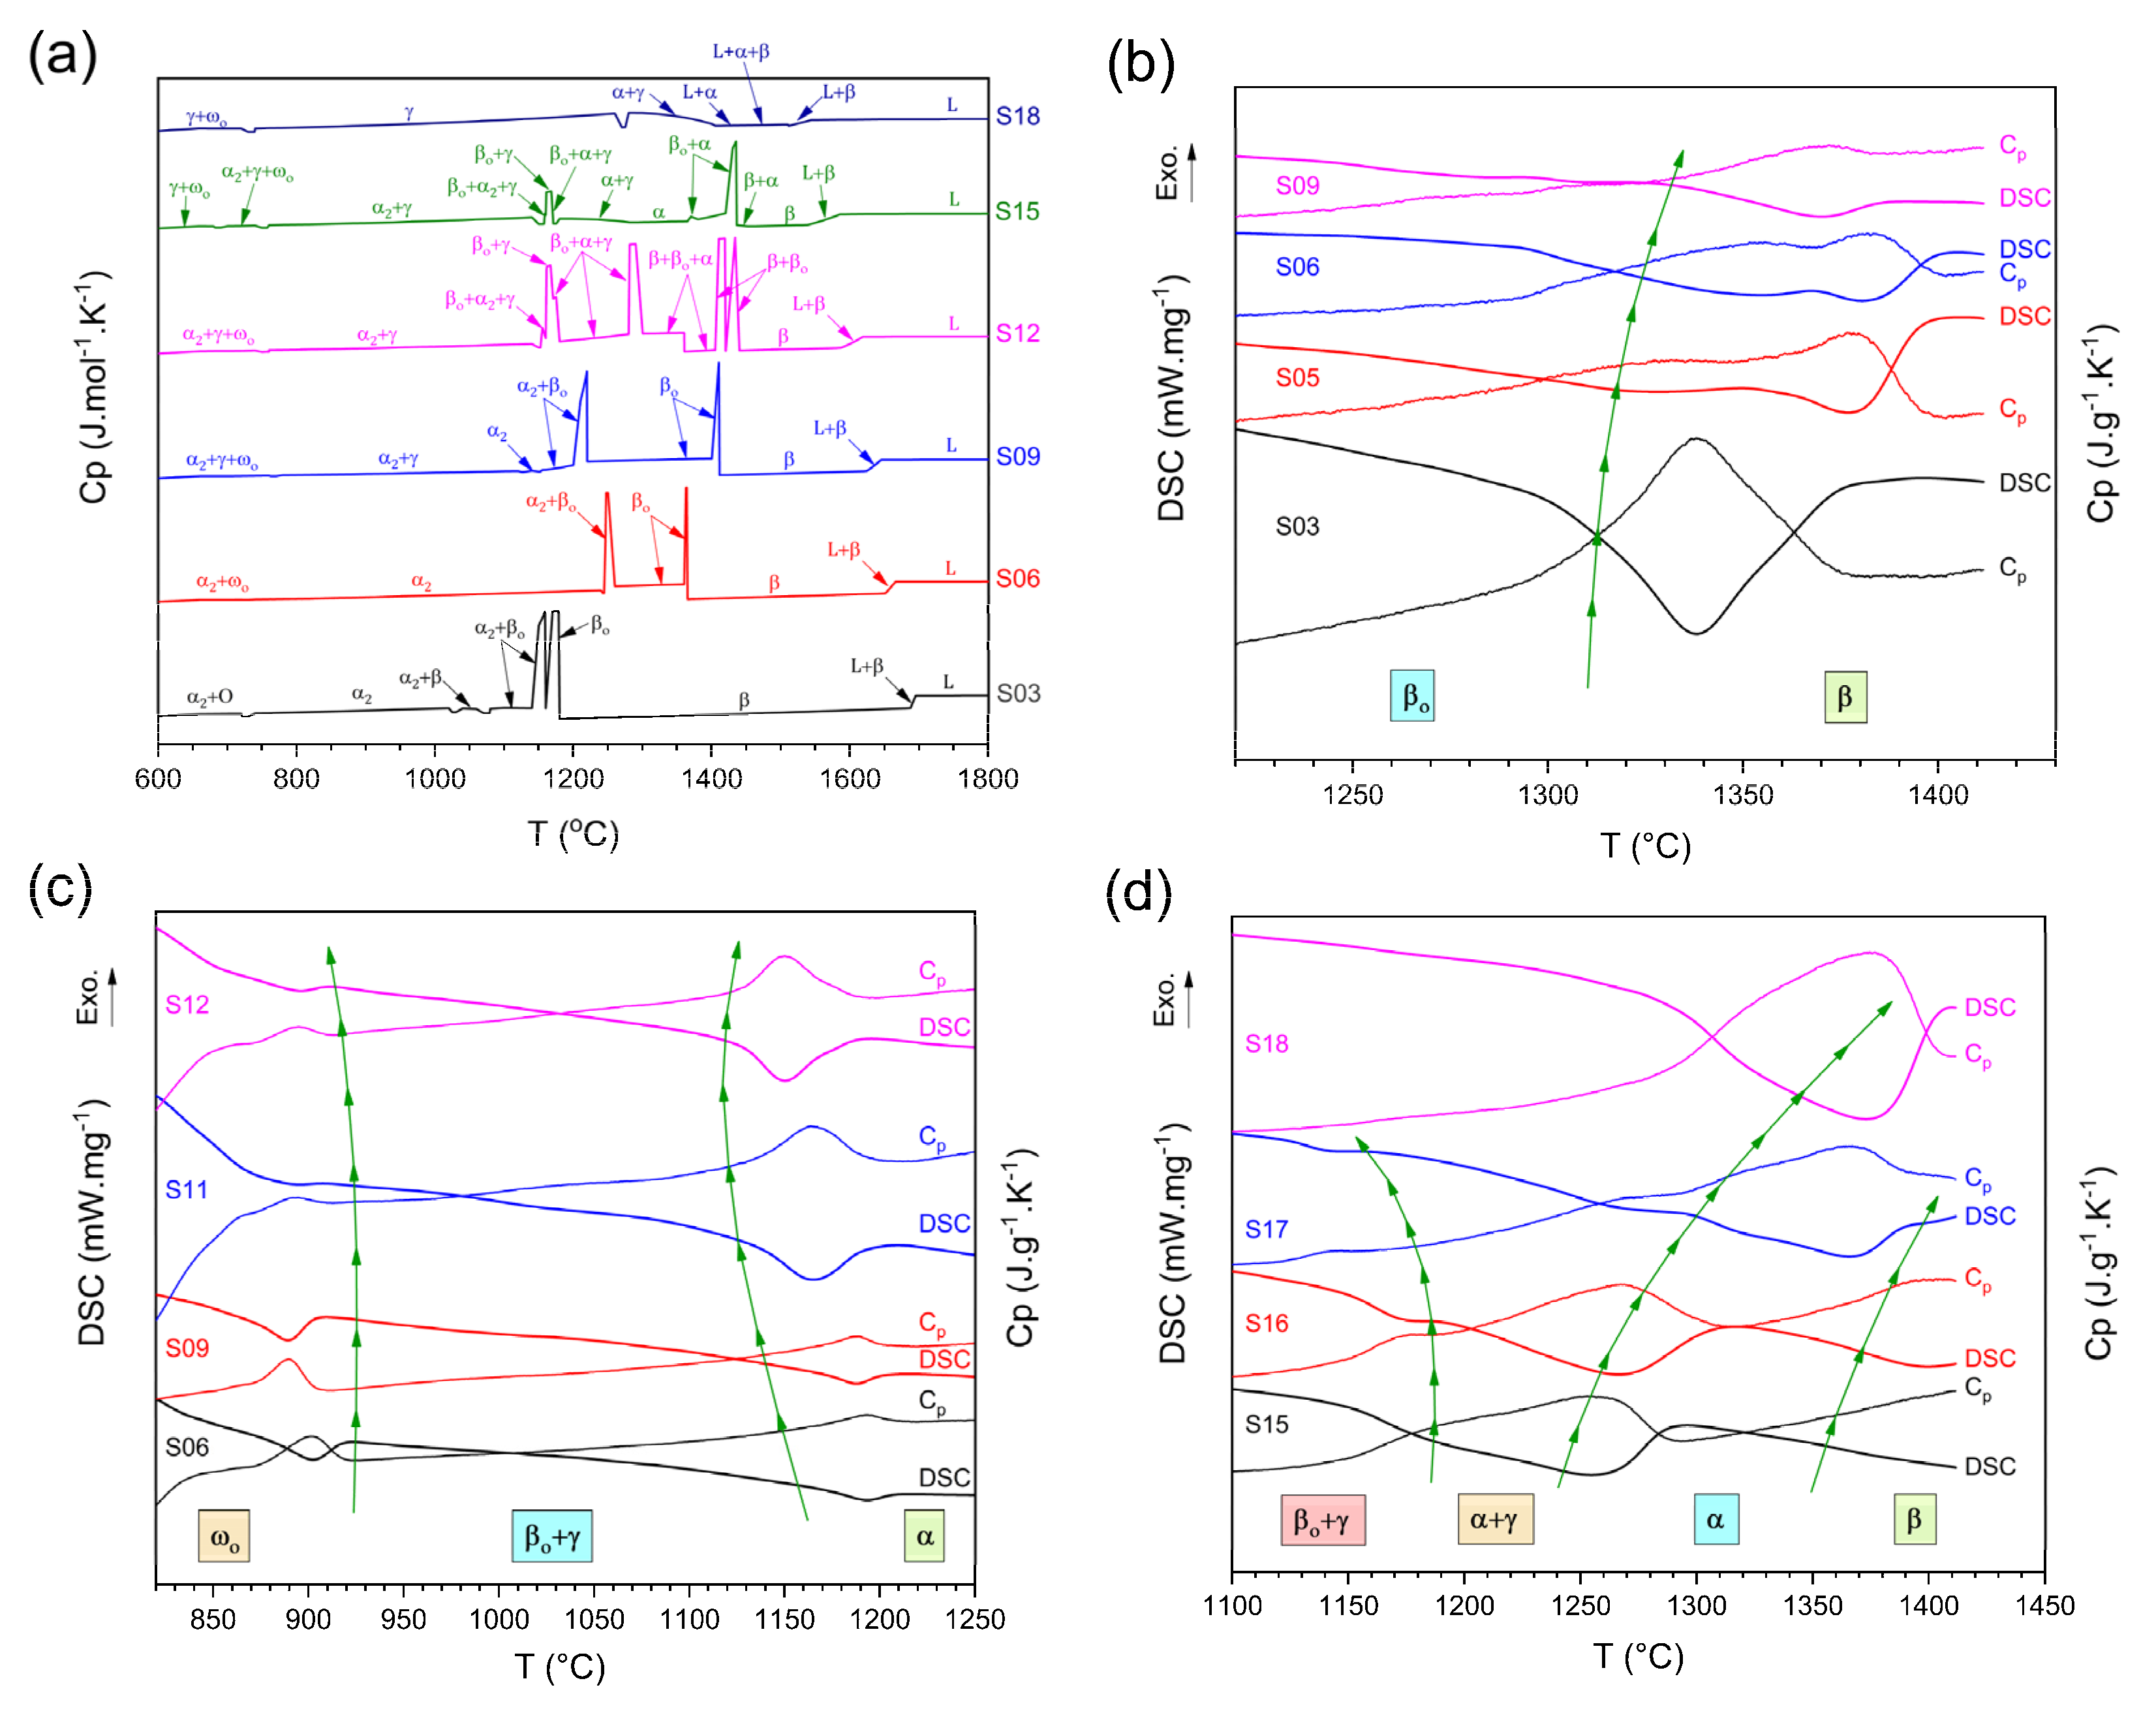
3.3. Thermal Analysis
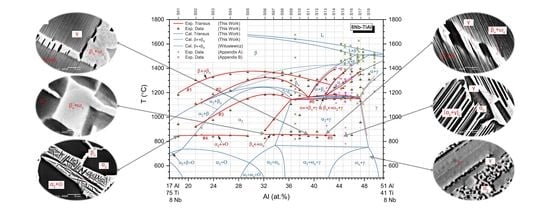
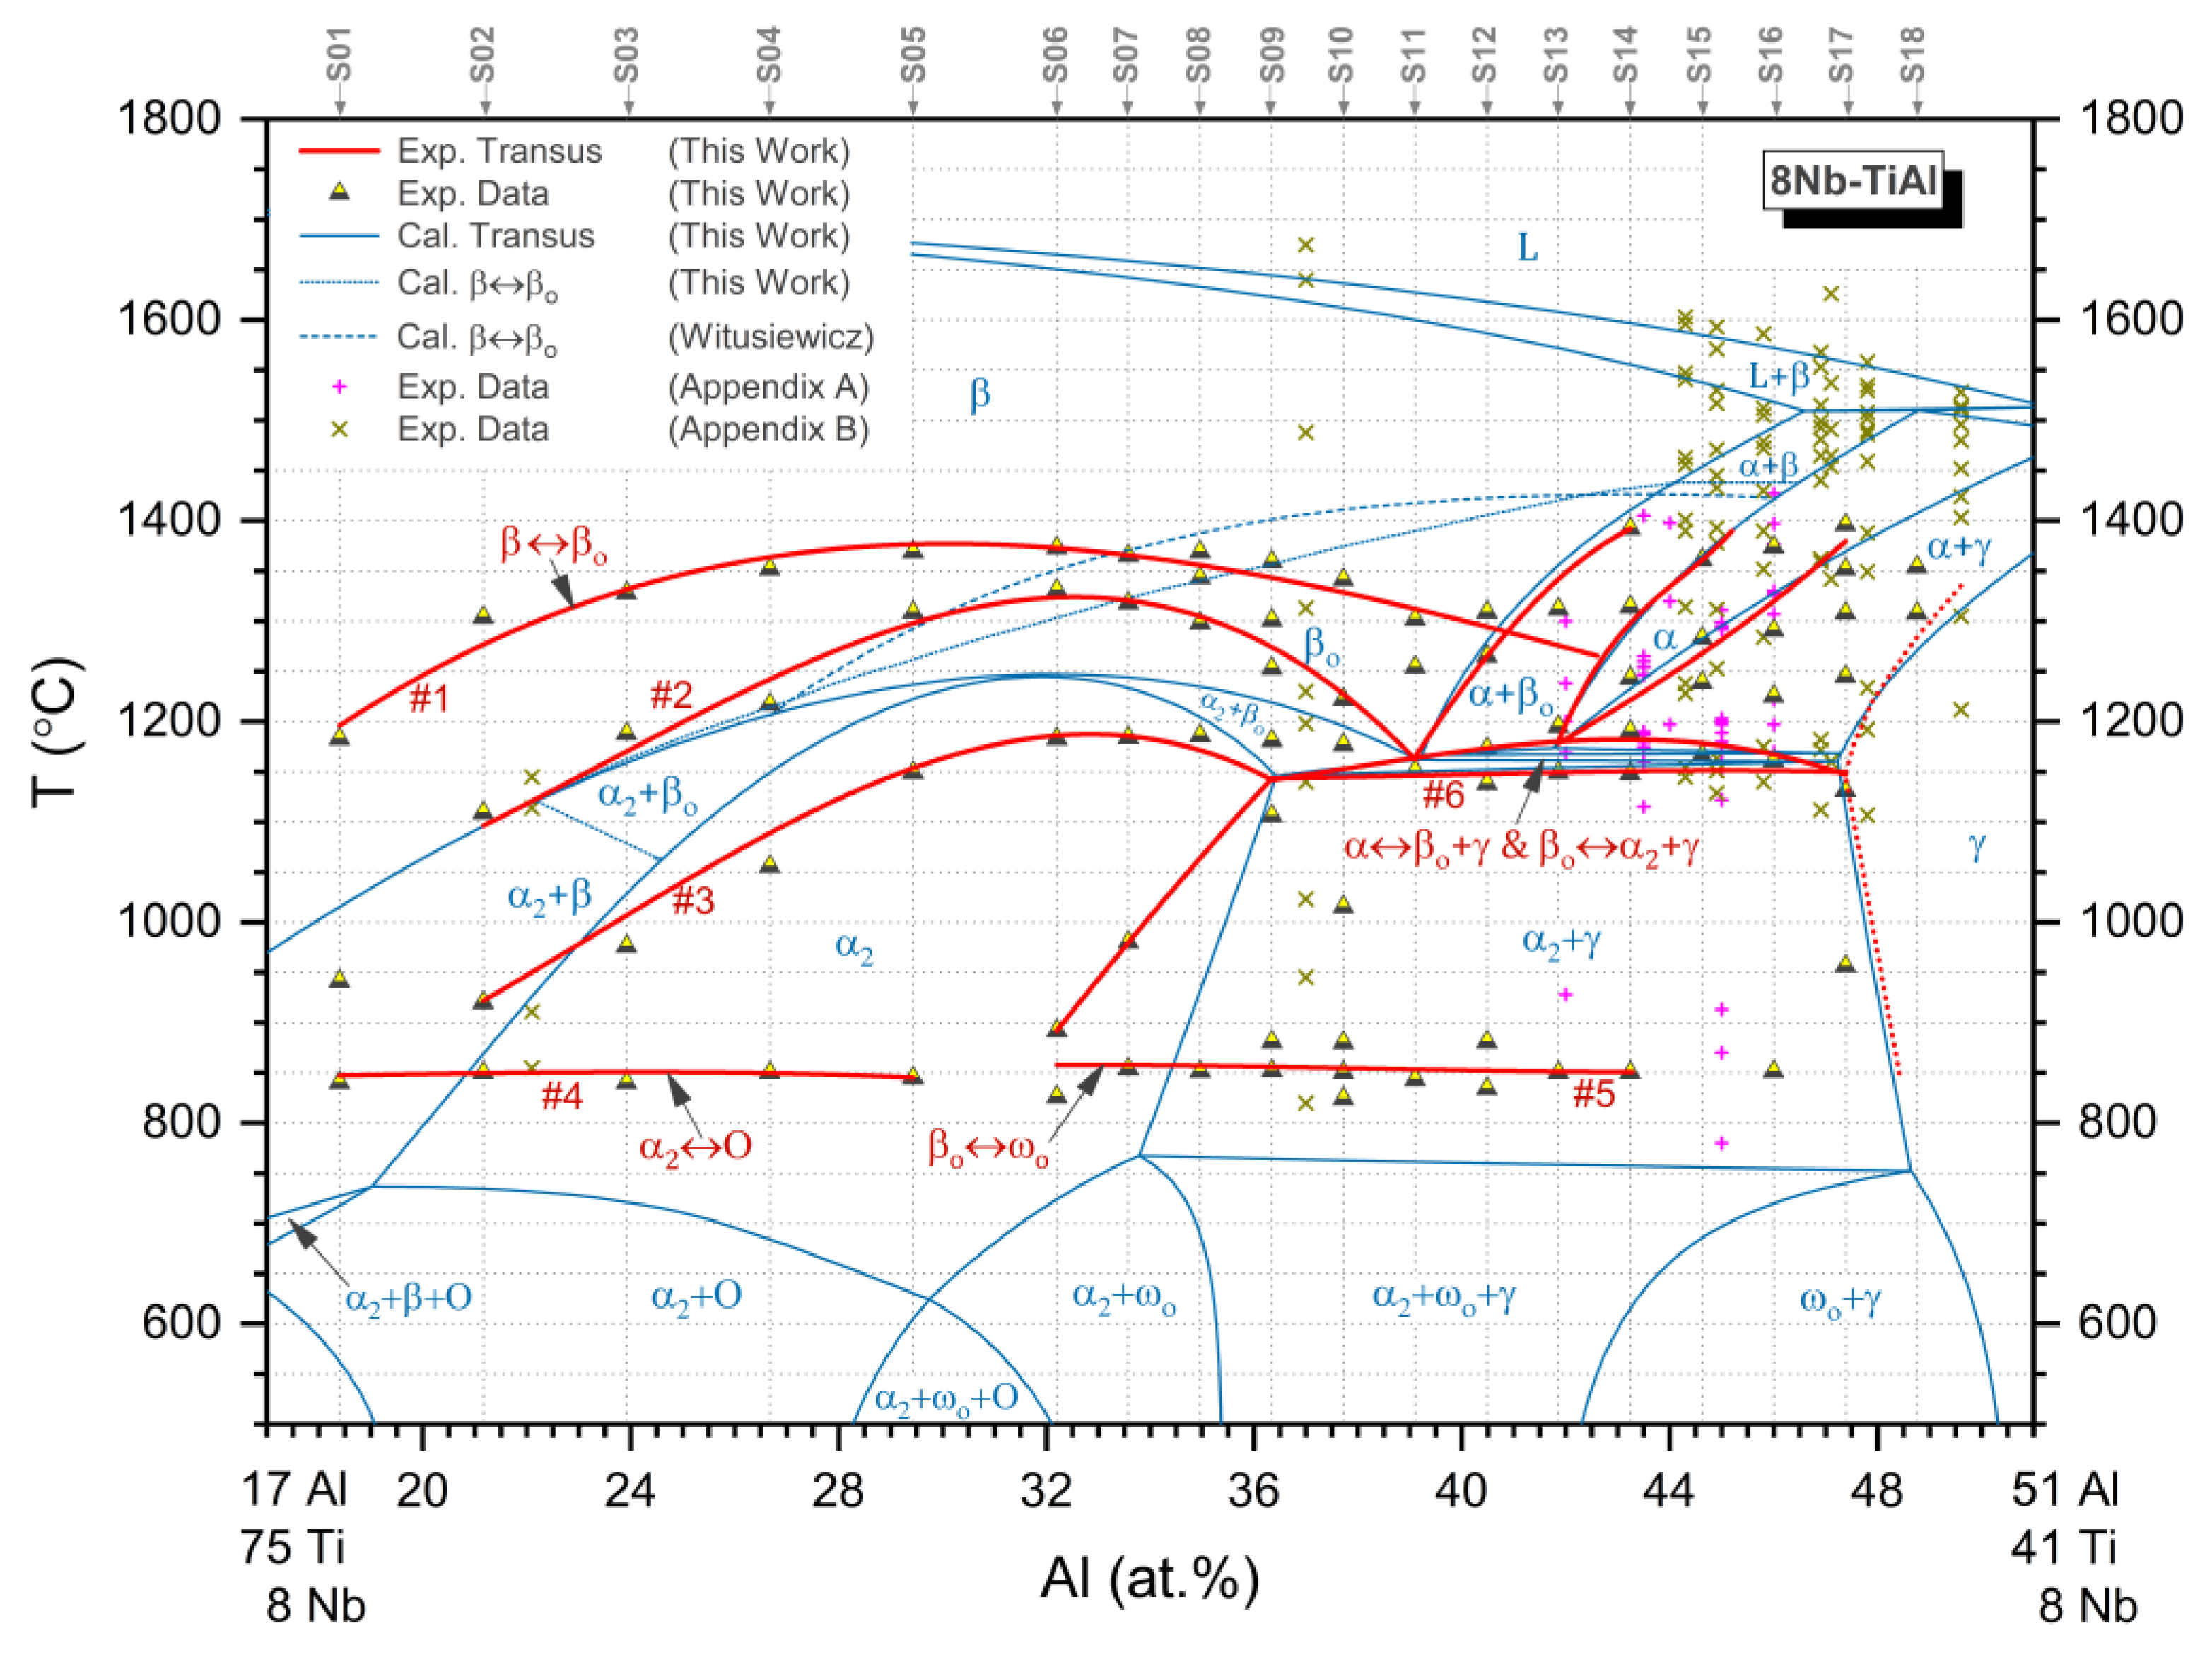
The phase transformation temperatures of 8Nb-TiAl alloys during experimental continuous heating were determined by thermal analysis. The phase transitions were simultaneously determined by DSC and Cp data, with the calculated Cp for comparison. Figure 5 shows the thermodynamically calculated Cp data and experimentally determined DSC and Cp data for the selected samples. The abrupt changes in the calculated Cp, shown by the narrow peaks in Figure 5a, correspond to the formation of an ordered βo phase from α/β; the order-disorder transitions of β ↔ βo and the eutectoid reaction of α ↔ βo + γ can also be determined from the experimental Cp data, as shown in Figure 5b,c. However, as shown in Figure 5c, there is a particularly broad peak at approximately 900 °C in the experimental Cp curve, indicating an additional ordering transition in Samples S06–S12, which was considered to be the βo ↔ ωo transition. For Samples S15–S18, no β ↔ βo transition was found at elevated temperatures, as shown in Figure 5d. Based on the DSC, SEM, and XRD analyses, the phase transitions in 8Nb-TiAl alloys were determined, as shown in Figure 5b–d, where the phase regions and isopleth sections are schematically identified in the DSC/Cp curves.

3.4. Isopleth

Based on this work’s thermal analyses, the experimental 8Nb-TiAl isopleth section was deduced and compared with a thermodynamic isopleth, as shown in Figure 6. More details about the transformation temperatures determined by DSC detection in this work and by the literatures are provided in Supplementary Materials. The experimental transus between phase transitions was approximated by a three-order polynomial with a least-squares solution, as shown in Figure 6. The experimental isopleth showed some differences from the thermodynamic calculations.
The phase transition behaviors found in this work were in good agreement with those previously reported in the literature, as shown in Figure 6. Schmoelzer et al. [11] and Erdely et al. [7] determined the phase transition temperatures in Ti-43.5Al-(4–5)Nb-(Mo, B) alloys using DSC and in-situ high-energy X-ray diffraction (HEXRD) methods. The eutectoid transition (α ↔ βo + γ and βo ↔ α2 + γ) temperature has been considered to be Teut = 1160–1180 °C, whereas the α ↔ γ temperature has been Tα = 1246-1255 °C; these results agreed well with the transition temperatures taken from the experimental transus, Teut = 1151–1178 °C and Tα = 1230 °C, respectively. The order-disorder β ↔ βo transition temperatures have been detected at 1225 °C for Ti-43.5Al-4Nb-(Mo, B) [7,11], and 1200 °C for Ti-(42–43.5)Al-Nb [7,17], in agreement with the transus temperature, 1250–1270 °C in the experimental isopleth, as shown in Figure 6. The α ↔ α2 + γ transformation temperatures in Ti-(42–43.5)Al-Nb have been detected at 1169 °C by in-situ HEXRD and DSC [7,17], located exactly in the phase regions of the experimental isopleth. Meanwhile, the α ↔ β transition temperature has been considered to be approximately 1300 °C [17], corresponding to the experimental value, approximately 1310 °C, in the isopleth. For the Ti-45Al-8.5Nb-(W,B,Y) alloy [49], the α ↔ γ and eutectoid transition temperatures have been considered to be in the range of 1150–1310 °C and 1100–1220 °C, and these were determined to be 1280 °C and 1150–1176 °C in the experimental isopleth, respectively.
The βo ↔ ωo transition temperatures in Ti-45Al-10Nb have been determined to be approximately 780 °C with a slow cooling process (10 °C/min), and approximately 850–870 °C with a heating process (10 °C/min) [20,50]. In addition, during a slow furnace cooling process, the βo ↔ ωo transition temperature in Ti-42Al-8.5Nb has been detected at 928 °C by in-situ HEXRD and DSC with a heating rate of 20 °C/min [17]. These experimental results are in good agreement with the transus determined in this work. In contrast, at the temperatures near 800 °C, the α2 ↔ ωo transition has been seen to occur in only a few minutes with applied stress, although the transition took several hundred hours without applied stress [51]. Moreover, the βo ↔ ωo transition is promoted by the addition of a β/βo-stabilizing element, such as Nb or Mo [20,25,52,53]. The α2 ↔ ωo transition has been observed to be restrained by the addition of an α2-stabilizing element, such as C [51].

4. Discussion

4.1. Phase Equilibria

As shown in Figure 6, the experimental 8Nb-TiAl alloys exhibited the transformation pathway β → β + βo → βo + α2 → βo + α2 + O for Al concentrations lower than 30 at%, and β → β + βo → βo + α2 → βo + α2 + γ → βo + ωo + α2 + γ for Al concentrations of 30–39 at%. The eutectoid transitions, α ↔ βo + γ and βo ↔ α2 + γ, as well as the βo ↔ γ transition, had to be considered a single region in this work because of the lack of sufficient experimental data. For alloys with 39–42 at% Al, a pathway with the α phase emerged, β → β + βo/α → β + βo + α → β + βo + α + γ → βo + ωo + α2 + γ. For alloys with 42–47 at% Al, the pathway was β → β + α → α → α + γ→ α + βo + α2 + γ → α2 + γ. For alloys with Al concentrations greater than 47 at%, the pathway was β + α → α → α + γ → α2 + γ.
In the 8Nb-TiAl system, the β ↔ βo transition occurred over a large range of Al concentrations, as shown in Figure 6. The transitions of samples with Al ranges of 18.4–43.2 at% at 1200–1400 °C, indicated by the #1 transus line in Figure 6, exhibited higher transformation temperatures than those calculated, which increased as the Al concentration became lower than 33.5 at%, with a maximum transformation temperature of 1380 °C at 32 at% Al, while the transition temperature decreased over the range of 33.5–42.5 at% Al and disappeared entirely as the Al concentration increased above 44.0 at% Al.
For alloys with 18–36 at% Al, following the β ↔ βo transus, there was a high-temperature phase transition, determined as the ordered α2 phase transformation from βo phases (the #2 and #3 transus lines in the isopleth), as shown in Figure 6. The preliminary α2 phase formed the coarsening laths among the βo phase, and the subsequent α2 phase forms the flaky particles in the βo matrix, as shown in Figure 1.
For alloys with 18–30 at% Al, the formation of the O phase was determined by XRD, although not observed in the microstructures because of the small amount of the phase fraction in the alloy matrix, as shown in Figure 1. The fraction of O phase in the samples decreased and the α2 phase increased as the Al concentration increased, as shown in Figure 2c,d. The O phase can be formed in a large temperature range between 800–1000 °C in Ti-Al-Nb ternary alloys [54,55], with two different pathways in the Ti-Al-Nb ternary system—α2 ↔ O and βo ↔ O—depending on the composition and treatment process [17,56]. One pathway occurs in the α2 phase in low-Nb-containing TiAl alloys (≤12.5 at% Nb), and the other pathway occurs in the βo phase in high-Nb-containing alloys (~25 at% Nb) [17,56,57]. The transformation of the O phase from the βo phase is considered to occur through a martensitic transition [57]. Therefore, in this work, the transus line in the range of 18–30 at% Al at approximately 850 °C in the 8Nb-TiAl system was confirmed to be the α2 ↔ O transition, in agreement with the thermodynamic calculation.
For alloys with 32–36 at% Al, there was an extra γ precipitation from α2, forming the ultrafine lamellar structure. As the Al concentration increased above 36 at%, the lamellar structure mainly formed through eutectoid reactions at 1150–1200 °C, with α ↔ βo + γ and βo ↔ α2+γ, forming the lamellar colonies as shown in Figure 3, Figure 4 and Figure 6. Therefore, as mentioned in the thermal analysis, the experimental phase transformation behaviors within α-containing regions were in good agreement with the thermodynamic calculations, as shown in Figure 5a,b,d, indicating that the influence of experimental conditions on these regions is small. The dominant activity under these conditions is suggested to be the main attribution.
For alloys with Al concentrations lower than 30 at% (Samples S01–S05) or greater than 43 at% (Samples S14–S18), there were no βo (LOB2 structure) and ωo phases found at the ambient temperature, as indicated by XRD and SEM detections, while for Al concentrations in the range of 32–42 at% (Samples S06–S12), the ωo phase and highly ordered βo phase were detected simultaneously. As a result, the ωo phase was preferentially formed in the highly ordered βo phase.
The experimental phase equilibrium relations and transformation pathways of the 8Nb-TiAl alloys deviated significantly from the thermodynamic calculations, as shown in Figure 6. These deviations may have been associated with the treatment conditions, such as the heating/cooling rates, and/or insufficiencies in the thermodynamic database for high-Nb-containing TiAl systems [5,11,58]. Because of the actual preparation process, the experimental isopleth showed metastable phase behavior, such as the formation of ωo from the retained βo, rather than from α2 as expected by the thermodynamic equilibrium behavior.

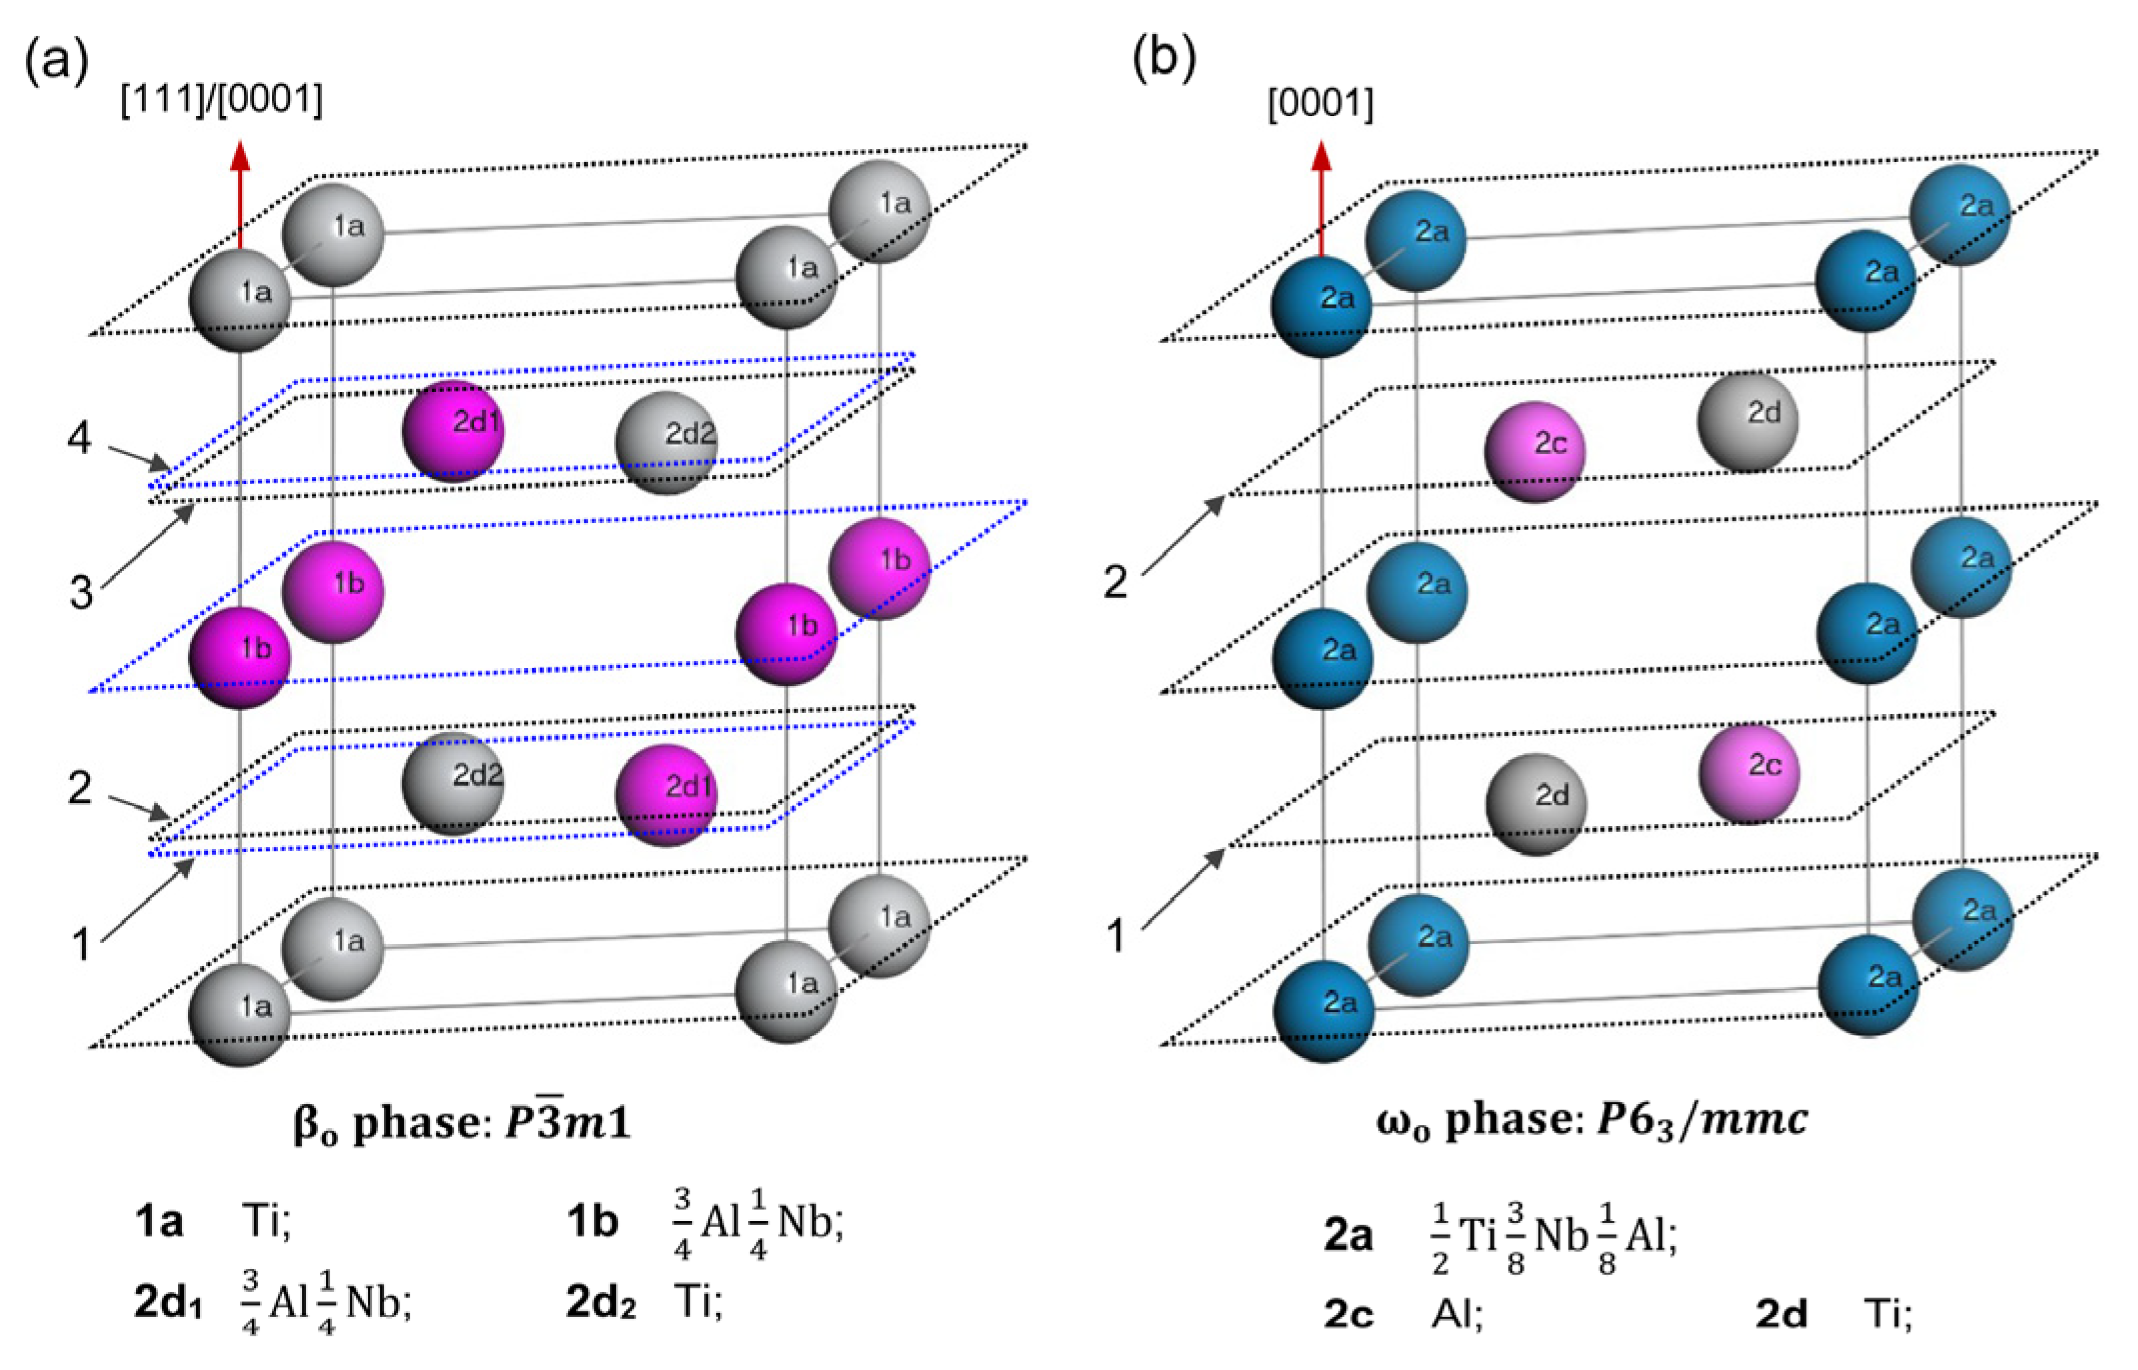
4.2. βo Transformation

The β ↔ βo transition temperatures and ordering procedure were in agreement with the studies of Clemens et al. [5] and Schmoelzer et al. [11], and were strongly affected by the compositions, as in [11,25]. The transition temperature differences between the experimental and calculation results may also have been related to the ordering of the β phase [59]. Crystallographic analysis has shown that the structure of the ordered βo phase contains two sublattices: one occupied by Al (B site) and the other occupied by Ti atoms (A site). The two sublattices are randomly occupied with all species in the disordered β phase. As previously reported [60], Nb atoms should replace the Ti atoms in the structure. However, Leonard et al. [61] suggested that the site occupancy of Nb depends on the composition. The atomic occupancy and lattice parameter are slightly changed during the β ↔ βo order-disorder transition.
The phase transition type is evidently reliant on the order of the isobaric-isothermal potential derivative (free Gibbs energy) [62], which exhibits an abrupt change at the transition position. In the first-order phase transitions (first derivatives), determined by the heat release or endothermic peaks in the DSC curve, there are abrupt changes in the specific volume and entropy. In the second-order phase transitions, such as order-disorder transitions, there are continuous changes in the specific volume and entropy, with no transition heat shown in the DSC curve, although there are abrupt changes in the second derivatives of the isobaric-isothermal potential, such as in the specific heat capacity, thermal expansion coefficient, and isothermal compressibility [62].
In this work, the ordered βo phase formed from disordered β/α phases as the temperature decreased from the elevated temperatures. As mentioned in reference to the calculated Cp patterns, shown in Figure 5a, there was one narrow peak in Sample S03, indicating the order-disorder β ↔ βo transition, and there were two narrow peaks in Samples S06–S15, corresponding to two types of order-disorder transitions, β ↔ βo and α ↔ βo + γ. The thermal analysis unambiguously detected the transformations of βo from β/α, as shown in Figure 5b,d; these transformations are commonly considered second-order phase transitions. However, in addition to the peaks found in the Cp patterns, endothermic peaks were also detected in the DSC patterns for β ↔ βo and α ↔ βo + γ transitions, as shown in Figure 5b,d, indicating that the order-disorder transitions, β ↔ βo and α ↔ βo + γ, in the 8Nb-TiAl system should be defined as an intermediate transition type, between the first- and second-order phase transitions.

4.3. ωo Transformation

The transformation of βo phase to ωo phase in Nb-containing TiAl alloys at 700–900 °C has been frequently observed [20,63,64,65]. The ωo phase has been found to be transformed within the βo matrix by homogeneous nucleation, or on the boundaries of βo/γ phases by heterogeneous nucleation, of particles with nano- or micro-scale sizes during continuous heating/cooling processes [17,20,51,65]. The formation of ωo phase is associated closely with the treatment process [51,66] and the chemical composition [20], and Nb has been suggested to act as the ωo stabilization element [67].
As shown in Figure 5c, there was an endothermic peak and an abrupt change in the DSC and Cp patterns, respectively, indicating that, to some extent, the βo ↔ ωo transition was an ordering process. As mentioned by Stark et al. [20], the βo phase exhibits a crystallographic orientation with the ωo phase: { 111 } β o { 0001 } ω o or 1 1 ¯ 0 β o 11 2 ¯ 0 ω o . According to this relationship, Figure 7 shows the atomic configuration of the ωo phase with the Wyckoff positions and site occupancies, as well as the atom distribution in βo phase as seen along its three-fold axis. During the βo→ωo transformation, the four stacking atomic layers in the βo phase, Layers 1–4 in Figure 7a, merge into double layers in the ωo phase, Layers 1–2 in Figure 7b. Furthermore, the site occupancy preference also changed, such that the Nb atoms moved into the 2a site, whereas the Ti and Al atoms move almost into the 2c and 2d sites, as shown in Figure 7. The lattice of the ωo phase is slightly compressed along the 111 β o / 0001 ω o direction, whereas it stretches significantly along the 1120 ω o direction [20].

5. Conclusions

(1) The isopleth section of the 8Nb-TiAl system (with 18–48 at% Al) was determined experimentally by DSC, SEM, and XRD methods, and compared with thermodynamic calculations (from CALPHAD). The experimental isopleth showed some deviations from the calculations, especially for βo containing regions.
(2) The ordered βo phase transformed from the disordered β phase in the range of 18.4–43.2 at% Al at 1200–1400 °C. The βo phase also transformed through a eutectoid transition, α ↔ βo + γ, from the α phase. The transition type of β ↔ βo was considered to be an intermediate type between the first- and second-order phase transitions. In particular, the βo phases were retained at the ambient temperature in the 8Nb-TiAl alloys under experimental conditions.
(3) The ordered ωo phase transformed experimentally from the highly ordered βo phase rather than from the α2 phase or the βo phase with a LOB2 structure. The experimentally detected ωo formation occurred within 32–43 at% Al concentrations at approximately 850 °C, having a smaller composition range and higher transforming temperature than the calculated thermodynamic transition. The formation of the ωo phase from the βo phase was considered to be a further ordering process.

Supplementary Materials

The following are available online at https://www.mdpi.com/article/10.3390/met11081229/s1, Figure S1: DSC and DDSC traces for samples that are closed to invariant points. Table S1: Onset phase transformation temperatures detected by thermal analysis. Table S2: DSC/DTA data for detecting the phase transition temperatures in the Ti-Al-Nb samples from the literatures. Table S3: Experimental transition temperatures in the Ti-Al-Nb samples summarized by Witusiewicz et al. Figure S2: individual XRD pattern of S01–S18 with phase structural information.

Author Contributions

Conceptualization, Y.X. and Y.L.; methodology, L.S.; software, Y.X. and B.T.; validation, Y.X. and J.L.; formal analysis, Y.X.; investigation, Y.L. and R.X.; resources, G.H.; data curation, Y.X.; writing—original draft preparation, Y.X.; writing—review and editing, J.L.; visualization, B.T.; supervision, J.L.; project administration, Y.X. and J.L.; funding acquisition, Y.L., L.S. and J.L. All authors have read and agreed to the published version of the manuscript.

Funding

This research was funded by the National Natural Science Foundation of China (Nos. 51831001 and 51971175), Funds for Creative Research Groups of China (51921001), Fundamental Research Funds for the Central Universities (FRF-MP-20-44), Natural Science Foundation of Shandong Province (ZR2020ME108), the State Key Lab of Advanced Metals and Materials (2018-ZD05) and the Fundamental Research Funds of Shandong University (2018JCG05).

Data Availability Statement

Data presented in this article is available on request from the corresponding author.

Conflicts of Interest

The authors declare no conflict of interest.

References

  1. Clemens, H.; Kestler, H. Processing and Applications of Intermetallic γ-TiAl-Based Alloys. Adv. Eng. Mater. 2000, 2, 551–570. [Google Scholar] [CrossRef]
  2. Kim, Y.-W.; Dimiduk, D. Progress in the understanding of gamma titanium aluminides. JOM 1991, 43, 40–47. [Google Scholar] [CrossRef]
  3. Appel, F.; Oehring, M.; Paul, J.D.H. Nano-Scale Design of TiAl Alloys Based on β-Phase Decomposition. Adv. Eng. Mater. 2006, 8, 371–376. [Google Scholar] [CrossRef]
  4. Appel, F.; Wagner, R. Microstructure and deformation of two-phase γ-titanium aluminides. Mater. Sci. Eng. R 1998, 22, 187–268. [Google Scholar] [CrossRef]
  5. Clemens, H.; Wallgram, W.; Kremmer, S.; Güther, V.; Otto, A.; Bartels, A. Design of Novel β-Solidifying TiAl Alloys with Adjustable β/B2-Phase Fraction and Excellent Hot-Workability. Adv. Eng. Mater. 2008, 10, 707–713. [Google Scholar] [CrossRef]
  6. Hoelzer, D.T.; Ebrahimi, F. Phase Stability of Sigma + Beta Microstructures in the Ternary Nb-Ti-Al System. MRS Proc. 1990, 194, 393. [Google Scholar] [CrossRef]
  7. Erdely, P.; Werner, R.; Schwaighofer, E.; Clemens, H.; Mayer, S. In-situ study of the time–temperature-transformation behaviour of a multi-phase intermetallic β-stabilised TiAl alloy. Intermetallics 2015, 57, 17–24. [Google Scholar] [CrossRef]
  8. Wallgram, W.; Schmölzer, T.; Cha, L.; Das, G.; Güther, V.; Clemens, H. Technology and mechanical properties of advanced γ-TiAl based alloys. Int. J. Mater. Res. 2009, 100, 1021–1030. [Google Scholar] [CrossRef]
  9. Liss, K.-D.; Schmoelzer, T.; Yan, K.; Reid, M.; Peel, M.; Dippenaar, R.; Clemens, H. In situ study of dynamic recrystallization and hot deformation behavior of a multiphase titanium aluminide alloy. J. Appl. Phys. 2009, 106, 113526. [Google Scholar] [CrossRef] [Green Version]
  10. Tetsui, T.; Shindo, K.; Kaji, S.; Kobayashi, S.; Takeyama, M. Fabrication of TiAl components by means of hot forging and machining. Intermetallics 2005, 13, 971–978. [Google Scholar] [CrossRef]
  11. Schmoelzer, T.; Liss, K.-D.; Zickler, G.A.; Watson, I.J.; Droessler, L.M.; Wallgram, W.; Buslaps, T.; Studer, A.; Clemens, H. Phase fractions, transition and ordering temperatures in TiAl–Nb–Mo alloys: An in- and ex-situ study. Intermetallics 2010, 18, 1544–1552. [Google Scholar] [CrossRef]
  12. Cheng, T.T.; Loretto, M.H. The decomposition of the beta phase in Ti–44Al–8Nb and Ti–44Al–4Nb–4Zr–0.2Si alloys. Acta Mater. 1998, 46, 4801–4819. [Google Scholar] [CrossRef]
  13. Kobayashi, S.; Takeyama, M.; Motegi, T.; Hirota, N.; Matsuo, T. Formation of β-Ti Phase in Multi-component Gamma Alloys. MRS Proc. 2002, 753, BB3.4. [Google Scholar] [CrossRef]
  14. Takeyama, M.; Kobayashi, S. Physical metallurgy for wrought gamma titanium aluminides: Microstructure control through phase transformations. Intermetallics 2005, 13, 993–999. [Google Scholar] [CrossRef]
  15. Tetsui, T.; Shindo, K.; Kobayashi, S.; Takeyama, M. A newly developed hot worked TiAl alloy for blades and structural components. Scr. Mater. 2002, 47, 399–403. [Google Scholar] [CrossRef]
  16. Huber, D.; Clemens, H.; Stockinger, M. Near Conventional Forging of an Advanced TiAl Alloy. MRS Proc. 2012, 1516, 23–28. [Google Scholar] [CrossRef]
  17. Rackel, M.W.; Stark, A.; Gabrisch, H.; Schell, N.; Schreyer, A.; Pyczak, F. Orthorhombic phase formation in a Nb-rich γ-TiAl based alloy–An in situ synchrotron radiation investigation. Acta Mater. 2016, 121, 343–351. [Google Scholar] [CrossRef]
  18. Sun, P.; Fang, Z.Z.; Koopman, M.; Paramore, J.; Chandran, K.S.R.; Ren, Y.; Lu, J. An experimental study of the (Ti–6Al–4V)–xH phase diagram using in situ synchrotron XRD and TGA/DSC techniques. Acta Mater. 2015, 84, 29–41. [Google Scholar] [CrossRef] [Green Version]
  19. Šmilauerová, J.; Harcuba, P.; Kriegner, D.; Janeček, M.; Holý, V. Growth kinetics of ω particles in β-Ti matrix studied by in situ small-angle X-ray scattering. Acta Mater. 2015, 100, 126–134. [Google Scholar] [CrossRef] [Green Version]
  20. Stark, A.; Oehring, M.; Pyczak, F.; Schreyer, A. In Situ Observation of Various Phase Transformation Paths in Nb-Rich TiAl Alloys during Quenching with Different Rates. Adv. Eng. Mater. 2011, 13, 700–704. [Google Scholar] [CrossRef]
  21. Clemens, H.; Chladil, H.F.; Wallgram, W.; Zickler, G.A.; Gerling, R.; Liss, K.D.; Kremmer, S.; Güther, V.; Smarsly, W. In and ex situ investigations of the β-phase in a Nb and Mo containing γ-TiAl based alloy. Intermetallics 2008, 16, 827–833. [Google Scholar] [CrossRef] [Green Version]
  22. Appel, F.; Oehring, M.; Paul, J.D.H. A novel in situ composite structure in TiAl alloys. Mater. Sci. Eng. A 2008, 493, 232–236. [Google Scholar] [CrossRef]
  23. Liss, K.-D.; Bartels, A.; Clemens, H.; Bystrzanowski, S.; Stark, A.; Buslaps, T.; Schimansky, F.-P.; Gerling, R.; Scheu, C.; Schreyer, A. Recrystallization and phase transitions in a γ-TiAl-based alloy as observed by ex situ and in situ high-energy X-ray diffraction. Acta Mater. 2006, 54, 3721–3735. [Google Scholar] [CrossRef]
  24. Ohnuma, I.; Fujita, Y.; Mitsui, H.; Ishikawa, K.; Kainuma, R.; Ishida, K. Phase equilibria in the Ti–Al binary system. Acta Mater. 2000, 48, 3113–3123. [Google Scholar] [CrossRef]
  25. Witusiewicz, V.T.; Bondar, A.A.; Hecht, U.; Velikanova, T.Y. The Al-B-Nb-Ti system: IV. Experimental study and thermodynamic re-evaluation of the binary Al-Nb and ternary Al-Nb-Ti systems. J. Alloy. Compd. 2009, 472, 133–161. [Google Scholar] [CrossRef]
  26. Witusiewicz, V.T.; Bondar, A.A.; Hecht, U.; Rex, S.; Velikanova, T.Y. The Al-B-Nb-Ti system: II. Thermodynamic description of the constituent ternary system B-Nb-Ti. J. Alloy. Compd. 2008, 456, 143–150. [Google Scholar] [CrossRef]
  27. Hellwig, A.; Palm, M.; Inden, G. Phase equilibria in the Al-Nb-Ti system at high temperatures. Intermetallics 1998, 6, 79–94. [Google Scholar] [CrossRef]
  28. Chen, G.L.; Wang, X.T.; Ni, K.Q.; Hao, S.M.; Cao, J.X.; Ding, J.J.; Zhang, X. Investigation on the 1000, 1150 and 1400 °C isothermal section of the Ti-Al-Nb system. Intermetallics 1996, 4, 13–22. [Google Scholar] [CrossRef]
  29. Ding, J.-J.; Hao, S.-M. Reply to the “comment on ‘investigation on the 1000, 1150 and 1400 °C isothermal section of the Ti-Al-Nb system’ ”—Part II. Modification of 1000 and 1150 °C isothermal sections of the Ti-Al-Nb system. Intermetallics 1998, 6, 329–334. [Google Scholar] [CrossRef]
  30. Li, L.; Liu, L.; Zhang, L.; Zeng, L.; Zhao, Y.; Bai, W.; Jiang, Y. Phase Equilibria of the Ti-Al-Nb System at 1000, 1100 and 1150 °C. J. Phase Equilibria Diffus. 2018, 39, 549–561. [Google Scholar] [CrossRef] [Green Version]
  31. Leonard, K.J.; Mishurda, J.C.; Vasudevan, V.K. Phase equilibria at 1100 °C in the Nb-Ti-Al system. Mater. Sci. Eng. A 2002, 329–331, 282–288. [Google Scholar] [CrossRef]
  32. Jewett, T.J.; Lin, J.C.; Bonda, N.R.; Seitzman, L.E.; Hsieh, K.C.; Chang, Y.A.; Perepezko, J.H. Experimental Determination of the Ti-Nb-Al Phase Diagram At 1200°C. MRS Proc. 1988, 133, 69. [Google Scholar] [CrossRef]
  33. Xu, S.; Xu, Y.; Liang, Y.F.; Xu, X.J.; Gao, S.B.; Wang, Y.L.; He, J.P.; Lin, J.P. Phase equilibria of the Ti-Al-Nb system at 1300 °C. J. Alloy. Compd. 2017, 724, 339–347. [Google Scholar] [CrossRef]
  34. Wang, X.T.; Chen, G.L.; Ni, K.Q.; Hao, S.M. The 1400 °C isothermal section of the Ti-Al-Nb ternary system. J. Phase Equilibria 1998, 19, 200–205. [Google Scholar] [CrossRef]
  35. Xu, S.; Ding, X.F.; Xu, Y.; Liang, Y.F.; Xu, X.J.; Ye, T.; He, J.P.; Lin, J.P. Phase equilibria of the Ti-Al-Nb system at 1400 °C. J. Alloy. Compd. 2018, 730, 270–278. [Google Scholar] [CrossRef]
  36. Muraleedharan, K.; Nandy, T.K.; Banerjee, D.; Lele, S. Phase stability and ordering behaviour of the O phase in Ti–Al–Nb alloys. Intermetallics 1995, 3, 187–199. [Google Scholar] [CrossRef]
  37. Boehlert, C.J.; Majumdar, B.S.; Seetharaman, V.; Miracle, D.B. Part I. The microstructural evolution in Ti-Al-Nb O+Bcc orthorhombic alloys. Metall. Mater. Trans. A 1999, 30, 2305–2323. [Google Scholar] [CrossRef]
  38. Bendersky, L.A.; Boettinger, W.J.; Roytburd, A. Coherent precipitates in the b.c.c./orthorhombic two-phase field of the Ti-Al-Nb system. Acta Metall. Et Mater. 1991, 39, 1959–1969. [Google Scholar] [CrossRef]
  39. Chen, G.L.; Zhang, W.J.; Liu, Z.C.; Li, S.J.; Kim, Y.-W. Gamma Titanium Aluminides. In Proceedings of the TMS, Warrendale, PA, USA, 28 February–4 March 1999; pp. 371–380. [Google Scholar]
  40. Kattner, U.R.; Lin, J.-C.; Chang, Y.A. Thermodynamic Assessment and Calculation of the Ti-Al System. Metall. Trans. A 1992, 23, 2081–2090. [Google Scholar] [CrossRef]
  41. Cupid, D.M. Thermodynamic Assessment of the Ti-Al-Nb, Ti-Al-Cr, and Ti-Al-Mo systems. Ph.D. Thesis, University of Florida, Gainesville, FL, USA, 2009. [Google Scholar]
  42. Raghavan, V. Al-Nb-Ti (Aluminum-Niobium-Titanium). J. Phase Equilibria Diffus. 2010, 31, 47–52. [Google Scholar] [CrossRef]
  43. Paul, J.D.H.; Appel, F.; Wagner, R. The compression behaviour of niobium alloyed γ-titanium alumindies. Acta Mater. 1998, 46, 1075–1085. [Google Scholar] [CrossRef]
  44. Appel, F.; Oehring, M.; Wagner, R. Novel design concepts for gamma-base titanium aluminide alloys. Intermetallics 2000, 8, 1283–1312. [Google Scholar] [CrossRef]
  45. Appel, F.; Oehring, M.; Paul, J.D.H.; Klinkenberg, C.; Carneiro, T. Physical aspects of hot-working gamma-based titanium aluminides. Intermetallics 2004, 12, 791–802. [Google Scholar] [CrossRef]
  46. Appel, F.; Paul, J.D.H.; Oehring, M. Gamma Titanium Aluminide Alloys: Science and Technology; Wiley-VCH: Weinheim, Germany, 2011; p. 745. [Google Scholar]
  47. Sadi, F.A.; Servant, C.; Cizeron, G. Phase transformations in Ti-29.7Al-21.8Nb and Ti-23.4Al-31.7Nb (at.%) alloys. Mater. Sci. Eng. A 2001, 311, 185–199. [Google Scholar] [CrossRef]
  48. Cao, W.; Chen, S.L.; Zhang, F.; Wu, K.; Yang, Y.; Chang, Y.A.; Schmid-Fetzer, R.; Oates, W.A. PANDAT software with PanEngine, PanOptimizer and PanPrecipitation for multi-component phase diagram calculation and materials property simulation. Calphad 2009, 33, 328–342. [Google Scholar] [CrossRef]
  49. Li, Y.; Zhou, L.; Lin, J.P.; Chang, H.; Li, F. Phase transformation behavior and kinetics of high Nb–TiAl alloy during continuous cooling. J. Alloy. Compd. 2016, 668, 22–26. [Google Scholar] [CrossRef]
  50. Wang, X.; Yang, J.; Zhang, K.; Hu, R.; Song, L.; Fu, H. Atomic-scale observations of B2→ω-related phases transition in high-Nb containing TiAl alloy. Mater. Charact. 2017, 130, 135–138. [Google Scholar] [CrossRef]
  51. Stark, A.; Bartels, A.; Clemens, H.; Schimansky, F.P. On the Formation of Ordered ω-phase in High Nb Containing γ-TiAl Based Alloys. Adv. Eng. Mater. 2008, 10, 929–934. [Google Scholar] [CrossRef] [Green Version]
  52. Ye, T.; Song, L.; Gao, S.B.; Liang, Y.F.; Wang, Y.L.; Lin, J.P. Precipitation behavior of the ωo phase in an annealed high Nb-TiAl alloy. J. Alloy. Compd. 2017, 701, 882–891. [Google Scholar] [CrossRef]
  53. Leonard, K.J.; Tewari, R.; Arya, A.; Mishurda, J.C.; Dey, G.K.; Vasudevan, V.K. Decomposition of the βo phase to the P63/mcm, hP18 structure in Nb–(24–36)Ti–40Al alloys. Acta Mater. 2009, 57, 4440–4453. [Google Scholar] [CrossRef]
  54. Sadi, F.A.; Servant, C. On the B2→O phase transformation in Ti–Al–Nb alloys. Mater. Sci. Eng. A 2003, 346, 19–28. [Google Scholar] [CrossRef]
  55. Banerjee, D.; Gogia, A.K.; Nandi, T.K.; Joshi, V.A. A new ordered orthorhombic phase in a Ti3Al-Nb alloy. Acta Metall. 1988, 36, 871–882. [Google Scholar] [CrossRef]
  56. Gabrisch, H.; Lorenz, U.; Pyczak, F.; Rackel, M.; Stark, A. Morphology and stability of orthorhombic and hexagonal phases in a lamellar γ-Ti-42Al-8.5Nb alloy-A transmission electron microscopy study. Acta Mater. 2017, 135, 304–313. [Google Scholar] [CrossRef]
  57. Bendersky, L.A.; Boettinger, W.J. Phase transformations in the (Ti, Nb)3Al section of the Ti-Al-Nb system—II. Experimental tem study of microstructures. Acta Metall. Et Mater. 1994, 42, 2337–2352. [Google Scholar] [CrossRef]
  58. Saunders, N. Phase equilibria in multi-component γ-TiAl based alloys. In Proceedings of the TMS, Warrendale, PA, USA, 28 February–4 March 1999; pp. 183–188. [Google Scholar]
  59. Holec, D.; Legut, D.; Isaeva, L.; Souvatzis, P.; Clemens, H.; Mayer, S. Interplay between effect of Mo and chemical disorder on the stability of β/βo-TiAl phase. Intermetallics 2015, 61, 85–90. [Google Scholar] [CrossRef]
  60. Beran, P.; Petrenec, M.; Heczko, M.; Smetana, B.; Žaludová, M.; Šmíd, M.; Kruml, T.; Keller, L. In-situ neutron diffraction study of thermal phase stability in a γ-TiAl based alloy doped with Mo and/or C. Intermetallics 2014, 54, 28–38. [Google Scholar] [CrossRef]
  61. Leonard, K.J. Phase Equilibria and Solid State Transformations in Niobium-Rich Niobium-Titanium-Aluminum Intermetallic Alloys; University of Cincinnati: Cincinnati, OH, USA, 1999. [Google Scholar]
  62. Gusev, A.I.; Rempel, A.A.; Magerl, A.J. Disorder and Order in Strongly Nonstoichiometric Compounds: Transition Metal Carbides, Nitrides and Oxides; Springer: Berlin, Germany, 2001; p. 607. [Google Scholar]
  63. Huang, Z.W. Ordered ω phases in a 4Zr-4Nb-containing TiAl-based alloy. Acta Mater. 2008, 56, 1689–1700. [Google Scholar] [CrossRef]
  64. Schloffer, M.; Rashkova, B.; Schöberl, T.; Schwaighofer, E.; Zhang, Z.; Clemens, H.; Mayer, S. Evolution of the ωo phase in a β-stabilized multi-phase TiAl alloy and its effect on hardness. Acta Mater. 2014, 64, 241–252. [Google Scholar] [CrossRef]
  65. Song, L.; Zhang, L.Q.; Xu, X.J.; Sun, J.; Lin, J.P. Omega phase in as-cast high-Nb-containing TiAl alloy. Scr. Mater. 2013, 68, 929–932. [Google Scholar] [CrossRef]
  66. Song, L.; Xu, X.J.; You, L.; Liang, Y.F.; Wang, Y.L.; Lin, J.P. Ordered α2 to ωo phase transformations in high Nb-containing TiAl alloys. Acta Mater. 2015, 91, 330–339. [Google Scholar] [CrossRef]
  67. Song, L.; Lin, J.P.; Li, J.S. Phase transformation mechanisms in a quenched Ti-45Al-8.5Nb-0.2W-0.2B-0.02Y alloy after subsequent annealing at 800 °C. J. Alloy. Compd. 2017, 691, 60–66. [Google Scholar] [CrossRef]
Figure 1. XRD detection of (a) tracking patterns for Samples S01–S18 and (bd) phase identification of the selected samples.
Metals 11 01229 g001
Figure 2. Phase evolution in 8Nb-TiAl alloys, determined by the reflection peak height of the (a) α2 (202), (b) O (310), (c) γ (002)/(200), and (d) βo (200)/ωo (202) crystal planes.
Metals 11 01229 g002
Figure 3. Microstructures (from SEM-BSE) of Samples (a,b) S01, (c,d) S06, and (e,f) S11.
Metals 11 01229 g003aMetals 11 01229 g003b
Figure 4. Microstructures (from SEM-BSE) of Samples (a,b) S13, (c,d) S15, and (e,f) S18.
Metals 11 01229 g004
Figure 5. Thermal analysis of 8Nb-TiAl: (a) calculated Cp and (bd) experimentally determined DSC and Cp data. The phase regions are demarcated by the arrows based on the experimental isopleth.
Metals 11 01229 g005
Figure 6. Isopleth of 8Nb-TiAl ternary system. The diagram calculated by CALPHAD is shown by the thin solid lines. The β ↔ βo transitions are labeled as the short dot lines for calculated data in this work, and the double dot dash lines from Witusiewicz’s investigation [25]. The onset transformation temperatures detected by DSC are marked as the half-filled triangles, while as the crosses for the experimental data from literatures. The experimental transus are marked as the solid lines (#1–6). The boundaries of γ single phase are estimated by calculation data, plotted as the dot lines.
Metals 11 01229 g006
Figure 7. Atomic configurations of (a) βo and (b) ωo structures. Wyckoff positions and site occupancies [20] are given at bottom.
Metals 11 01229 g007
Table 1. Crystallographic data of phase designations occurring in this work.
DesignationPearsonS. G. (#)Strukt.PrototypeLattice Parameters (nm)
β-Ti(Al,Nb)cI2 I m 3 ¯ m (229)A2Wa = 0.331--
α-Ti(Al,Nb)hP2 P 6 3 / m m c (194)A3Mga = 0.295-c = 0.468
γ-TiAltP4 P 4 / m m m (123)L10AuCua = 0.283-c = 0.408
α2-Ti3AlhP8 P 6 3 / m m c (194)D019Ni3Sna = 0.577-c = 0.463
βo-TiAl(Nb)cP2 P m 3 ¯ m (221)B2CsCla = 0.322--
ωo-Ti4NbAl3hP6 P 6 3 / m m c (194)B82InNi2a = 0.458-c = 0.552
O-Ti2NbAloC16 C m c m (63)---NaHga = 0.616b = 0.973c = 0.470
Table 2. Nominal and determined compositions (at. %) of the 8Nb-TiAl alloys.
SampleNominal CompositionChemical Composition (OES)
AlTiNb
S01Ti73.6Al18.4Nb818.3473.697.97
S02Ti70.8Al21.2Nb821.1370.897.98
S03Ti68.1Al23.9Nb823.8068.237.97
S04Ti65.3Al26.7Nb826.6565.377.98
S05Ti62.6Al29.4Nb829.3762.667.97
S06Ti59.8Al32.2Nb832.1659.877.97
S07Ti58.4Al33.6Nb833.5258.517.97
S08Ti57.0Al35.0Nb834.8957.118.00
S09Ti55.7Al36.3Nb836.2455.758.01
S10Ti54.3Al37.7Nb837.6354.358.02
S11Ti52.9Al39.1Nb839.0152.968.03
S12Ti51.5Al40.5Nb840.4251.568.02
S13Ti50.1Al41.9Nb841.8350.148.03
S14Ti48.8Al43.2Nb843.1348.848.03
S15Ti47.4Al44.6Nb844.5347.448.03
S16Ti46.0Al46.0Nb845.9346.048.03
S17Ti44.6Al47.4Nb847.3544.638.02
S18Ti43.2Al48.8Nb848.7243.278.01
Publisher’s Note: MDPI stays neutral with regard to jurisdictional claims in published maps and institutional affiliations.

