Abstract
Leaded brass alloys with high zinc content are classified as dual-phase (α-β′) brass alloys. For these alloys, α-β′ phase transformation induced by thermomechanical processing (TMP) is expected to play a significant role not only in the formation of α and β′ phases and uniformity of lead particles but also in the development of Σ3 boundaries and their variants in the α phase. To assess such impact, the current study has employed two TMP schemes, with each scheme consisting of four cycles of compression and annealing. Samples of the first scheme (TMP-1) were annealed at 670 °C to promote phase transformation from α to β′, as compared to the second scheme (TMP-2) samples annealed at 525 °C. Microstructure examination indicated that TMP-1 scheme fostered a remarkable growth in the area fraction of β′ phase, accompanied by grain coarsening of α and β′ phases. This resulted in the isolation of α grains and less interaction of Σ3 boundaries at trip junctions, and therefore, a reduction in the fraction of Σ3 boundaries occurred in the α phase. On the other hand, the TMP-2 scheme successfully enhanced cluster formation of α grains, enabling further generation of Σ3 boundaries via strain-induced boundary migration mechanism and ultimately leading to breakup of the random boundary network. In addition, the two schemes resulted in limited coarsening of lead particles. Most lead particles were located at the α-βʹ interfaces, which suppressed grain boundary migration via the particle-dragging effect. For both TMP schemes, the initial texture of tension fibers was largely preserved after four cycles for both α and βʹ phases. Nevertheless, the TMP-2 scheme produced texture randomization of the α phase due to increasing the fraction of Σ3 boundaries.
1. Introduction
Thermomechanical processing (TMP) has been effectively applied for the production of grain boundary engineering (GBE) structure in fcc metals of low stacking fault energy (SFE). The development of GBE structure has enhanced several engineering properties, including strength, ductility, creep resistance, and resistance to intergranular corrosion [1,2,3]. The GBE concept, initially proposed by Watanabe [4], is based on manipulating the grain boundary characteristics via a repetitive scheme of TMP. GBE generally requires subjecting the fcc metal to multiple cycles of TMP, commonly 2–5 cycles, to promote the formation of annealing twin boundaries. In each cycle, the workpiece is subjected to a small-to-medium strain by cold working, typically in the strain range of 0.1–0.3, followed by short-time annealing above the recrystallization temperature [5]. This ultimately enhances the formation of annealing twins that promotes the conversion of random angle grain boundaries into coincident site lattice (CSL) boundaries with low values of Σ, such as Σ3 boundaries and its variants, i.e., Σ9 and Σ27 boundaries. As a result, it is possible to alter the random grain boundary network, distribution of triple junctions, and grain boundary plane crystallography [6,7,8].
Several GBE studies have been conducted on α-brass alloys, having zinc content of 30 wt.% or less [9,10,11,12]. The α phase is rich in copper and has an fcc crystal structure. Therefore, α-phase brass alloys possess moderate strength and excellent formability at room temperature. The low SFE of α-brass alloys is also a key factor for the development of GBE characteristics, allowing a massive formation of Σ3 boundaries by twinning and breakup of grain boundary network after repeated cycles of TMP. An early study using GBE on an α-brass alloy showed that the fraction of Σ3n boundaries (sum of Σ3, Σ9, and Σ27 boundaries) increased to a maximum of 55% [13]. Another study on an α-brass alloy also reported that the maximum proportion of Σ3n boundaries obtained was 63% [5].
Another important class of brass alloys is duplex-phase brass alloys. The microstructure consists of α and β phases. The formation of β phase is possible at high temperatures for high zinc content, i.e., in the range of 38–40 wt.% of zinc. Unlike the α phase, the β phase is rich in Zn and has a disordered bcc structure, making it harder than the α phase. At high temperatures, the β phase is ductile, but it becomes brittle at room temperature due to the transformation to β′ phase. The latter phase has an ordered bcc structure at temperatures close to 425 °C [14,15]. A study by Lee et al. [16] examined the grain boundary characteristics in a two-phase (α + β′) brass alloy using repetitive TMP of cold rolling (20%) and annealing (680 °C), indicating an increase in the fraction of Σ3n boundaries in the α phase to a maximum of 78%. Furthermore, the increase in TMP cycles promoted the formation of new grains of α phase, annealing twinning in the newly formed α phase, and coarsening of microstructure. This was found to increase the fraction of Σ3n boundaries in the α phase. On the other hand, TMP only led to further formation of random high-angle boundaries in the β′ phase, which do not possess any importance to GBE.
The current study aims to examine the microstructure development in leaded brass alloys, α-βʹ brass alloys, using repetitive TMP. Leaded brass alloys are generally used in machining and are conventionally produced in rods by sequential processes of casting, extrusion, and drawing. For this type of free-machining brass alloy, lead is added in small quantity, typically in the range of 2–3 wt.%, to improve machinability. Lead is generally insoluble in the α and β′ phases, and it forms as discrete particles. The lead particles are often distributed at the α/β′ interphase boundaries due to their high interfacial energy. The dispersion of fine lead particles, typically less than 5 μm, acts as a lubricant and thus decreases the friction between the tool and the material. The lead particles also create discontinuities that promote fast chip breaking; therefore, the cutting force and tool wear rate are significantly reduced [17].
Several works have examined the microstructure development in leaded brass to evaluate its mechanical properties and machining performance [15,17,18,19,20]. For example, Pantazopoulos and Vazdirvanidis [15] reported that decreasing lead particle size and increasing lead particle density improves machinability. Moreover, increasing the area fraction of β′ phase and refining α grains can create more prolonged interphase boundaries, significantly expanding the formation of lead particles at these high-energy interfacial sites. More recent studies have investigated the effect of alloying elements, such as aluminum and titanium, on promoting grain refinement and β-phase formation in leaded brass, indicating improved compressive strength and hardness [21,22]. In addition, Mousavi et al. [23] studied the role of lead particles on severe plastic deformation of leaded brass processed by equal channel angular pressing (ECAP). It was indicated that achieving large plastic deformation is very challenging in leaded brass due to the pinning effect of the particles at grain boundaries. Consequently, crack formation occurred in the β phase, resulting in premature failure of the leaded brass samples after only two ECAP passes.
For a dual-phase brass alloy, such as leaded brass, phase transformation plays a significant role in microstructure development during thermomechanical processing. Therefore, we intend to examine the effect of repetitive cycles of TMP on the formation of Σ3n boundaries in the α phase, taking into consideration the evolution of β′ phase and the distribution of lead particles. Two TMP schemes have been adopted in the current study, each consisting of four cycles of small-strain compression (ε = 0.1) followed by 15 min annealing. The only difference between the two schemes is the value of the annealing temperature, where samples of the first scheme (TMP-1) and second scheme (TMP-2) were annealed at 670 °C and 525 °C, respectively. The selection of 670 °C annealing was necessary to promote enormous phase transformation from α to β′ during annealing. This is expected to affect the evolution of α and βʹ phases and thus ultimately alter the formation of Σ3n boundaries in the α phase. Small strain (ε = 0.1) was intentionally used in the current TMP schemes to promote the development of GBE structure via strain-induced boundary migration rather than strain-induced recrystallization [5]. The microstructure development was examined by optical microscopy (OM) and scanning electron microscopy (SEM). Moreover, the formation of CSL boundaries in α and β′ phases was evaluated using electron backscattered diffraction (EBSD).
2. Materials and Methods
Table 1 summarizes the chemical composition of leaded brass rods used in this study and shows a comparison with CuZn39Pb3 Brass grade of the British Standard Specification EN 12164 [24]. Compression test specimens were cut from the leaded brass rods and shaped into small cylinders with 10 mm in diameter and 12.5 mm in height. Before TMP, the brass cylinders were initially annealed in a temperature-controlled furnace at 500 °C for 1 h. Two TMP schemes were used in the current study, for which four cycles were applied. Details of the TMP schemes are summarized in Table 2. Using an electromechanical testing machine (Instron-5581, Instron, High Wycombe, UK), the first TMP scheme (TMP-1) consists of a compression test of the cylinders at a crosshead speed of 7.5 mm/min to strain of 0.1, followed by annealing at 670 °C for 15 min. The annealing temperature was found to promote remarkable growth of the βʹ phase. The TMP second scheme (TMP-2) also used compression at the same crosshead speed and strain value, but annealing was performed at 525 °C for 15 min. The use of lower temperature was intended to maintain a low area fraction of β′ phase.

Table 1.
Chemical composition of leaded brass used in this study.
Table 2.
Details of thermomechanical processing of leaded brass.
The microstructure of the leaded brass has been examined using optical microscopy (AxioImager A1M, ZEISS, Oberkochen, Germany) and scanning electron microscopy (7001F-JSM, JEOL, Tokyo, Japan). Samples were prepared using a standard metallographic preparation procedure, including grinding, mechanical polishing, and final polishing by colloidal silica. For OM observations, the samples were chemically etched in a solution that consisted of 8.3 g of FeCl3, 10 mL of HCl, and 90 mL of H2O [18]. Analysis of lead particle size and area fraction and the β′ phase area fraction and grain size was conducted using ImageJ, an automated image analysis system [25]. The analysis of lead particles was performed on polished samples. The analysis of the β′ phase required etching of the polished samples using the etchant mentioned above.
A further microstructural evaluation was made using EBSD. This required electropolishing of the samples in a solution of 25% phosphoric acid (Sigma-Aldrich Inc., Burlington, WV, USA), 20% ethanol (Merck, Darmstadt, Germany), and 10% propanol (Merck, Darmstadt, Germany) in water, using an electrolytic polishing machine (LectroPol-5, Struers, Ballerup, Denmark). Electron backscattered diffraction (EBSD) measurements were carried out on samples with EBSD data acquisition and analysis software (Aztec, Oxford, High Wycombe, UK), interfaced to a field-emission scanning electron microscope (7001F-JSM, JEOL, Tokyo, Japan), and operated at 20 kV. EBSD maps were made using a step size of 0.25 μm. The misorientation angle distribution statistics were analyzed, employing a critical misorientation angle of 15° to differentiate low-angle boundaries (LAGBs) from high-angle boundaries (HAGBs). Grain boundaries are presented in EBSD maps such that LAGBs are depicted as thin grey lines, HAGBs as solid black lines. Σ3n boundaries are represented as solid red lines, where n = 1, 2, 3 defines Σ3, Σ9, and Σ27 boundaries, respectively. The average grain size and HAGBs distributions were obtained using the post-processing EBSD software. Furthermore, EBSD measurements were utilized to evaluate the evolution of texture, as presented in inverse pole figures (IPFs). It should be noted that all OM/SEM micrographs and EBSD maps were taken in a plane perpendicular to the axial (compression) direction.
3. Results and Discussion
3.1. Microstructure
Figure 1 shows micrographs of leaded brass in the initial condition, at which samples were annealed at 500 °C for 1 h. The microstructure consists of three different phases: α phase (convex grains containing annealing twins), β′ phase (concave grains), and lead particles (dark particles). The α phase represents a large amount of the structure, having approximately an area fraction of 71%. Many of the α grains are connected, forming a cluster of grains. Annealing twins extensively formed within the α grains due to the low SFE of this fcc structure. On the other hand, the β′ phase represents a smaller area fraction (~27%), mainly consisting of isolated grains (islands). The lead particles are uniformly distributed in the brass microstructure and are predominantly located at the α-β interfaces. Compared to α-α and β′-β′ boundaries, the α-β′ interphase boundaries have higher surface energy, and thus they act as preferential sites for the nucleation of lead particles. Approximately, the area fraction of lead particles is about 2–3%.
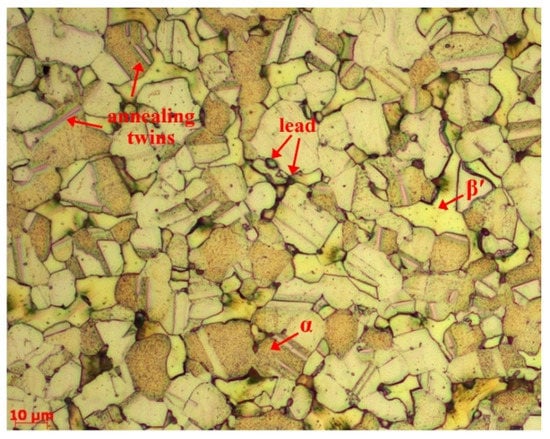
Figure 1.
OM micrograph of leaded brass in initial condition. Magnification: 500×.
Figure 2 shows OM micrographs for samples subjected to TMP-1 and TMP-2 schemes, illustrating the microstructure development with successive cycles. In the TMP-1 scheme, grain coarsening occurred for both the α phase (light phase) and β′ phase (dark phase) with increasing cycles. Moreover, the area fraction of the β′ phase increased with increasing cycles, and many of the β′ islands became connected. On the other hand, the use of the TMP-2 scheme resulted in a minimal change in the grain (island) size and area fraction of the β′ phase. Moreover, the size and distribution of the lead particles were influenced by TMP. In general, the increase in the number of cycles resulted in limited coarsening of the lead particles. For both TMP schemes, relatively coarser lead particles formed in the microstructure due to TMP, and they became less uniform with increasing cycles. The results also show that many lead particles formed at the α-β′ interfaces, while very few particles are present in the grain interior. In addition, Figure 3 shows high-magnification micrographs, further illustrating the effect of TMP on the distribution and size of lead particles. Many of the particles are preferentially located at the α-βʹ interphase boundaries (Figure 3a). As indicated by the cursor in Figure 3b, a lead particle is located close to an annealing twin, suggesting that lead particles might be nucleation sites for annealing twins. Figure 3c illustrates the coalescence of several lead droplets resulting in a coarse lead particle of about 3.5 μm.
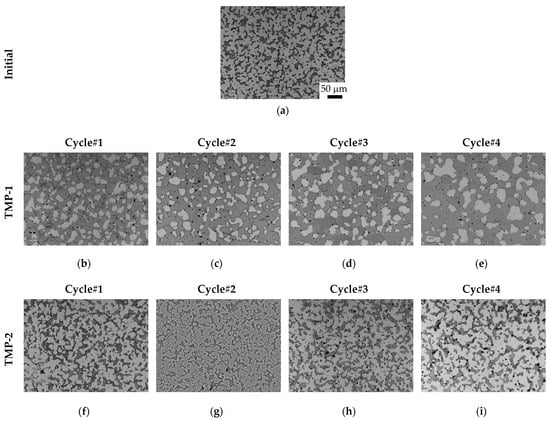
Figure 2.
Optical micrographs of leaded brass samples: (a) initial condition, (b–e) samples processed by TMP-1 scheme, and (f–i) samples processed by TMP-2 scheme. The microstructure is composed of α phase (light grey regions), βʹ phase (dark grey regions), and lead particles (small black particles). Magnification: 200×.
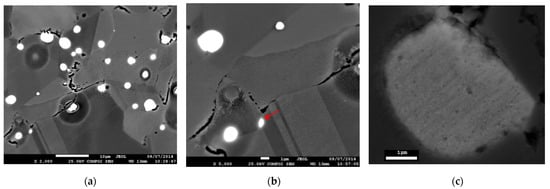
Figure 3.
SEM micrographs of leaded brass sample subjected to one cycle of TMP-1 scheme: (a,b) distribution of lead particles and (c) formation of a coarse lead particle. Magnification: 2000×–15,000×.
Moreover, Table 3 summarizes the average size and area fraction of the lead particles. In general, there is a relatively small increase in the particle size with increasing cycles for the two schemes, increasing initially from about 2.5 μm to 3.1 μm and 2.9 μm after four cycles for TMP-1 and TMP-2 schemes, respectively. Coarsening lead particles by TMP accompanies a decrease of the area fraction of particles from 3.1% to 1.7% and 2.3% for TMP-1 and TMP-2, respectively. It is thus concluded that the use of higher annealing temperature in the TMP-1 scheme (670 °C) promoted more substantial coalescence and melting of the small lead particles during the annealing process than the TMP-2 scheme.
Table 3.
Average particle size and area fraction of the lead for leaded brass samples subjected to TMP.
Table 4 presents the average grain size and area fraction of the β′ phase. The initial structure has an average β′ grain size of 19.3 μm and an area fraction of approximately 27%. For the TMP-1 scheme, there is a noticeable coarsening of the β′ grains to 32.5 μm after four cycles. Such grain coarsening is also accompanied by a remarkable increase in the area fraction of β′ phase to about 70%. On the other hand, the use of TMP-2 scheme relatively hindered grain coarsening of the β′ phase, where the average grain size of β′ phase increased to 29.2 μm after four cycles; the area fraction of β′ phase increased only to about 36% after four cycles. Such a trend in grain coarsening was expected since a higher annealing temperature was applied for the TMP-1 scheme. Furthermore, the grain coarsening might be boosted by the reduction in the area fraction of lead particles with increasing TMP cycles. The results mentioned above clearly demonstrate that annealing at 670 °C produced a remarkable increase in the area fraction of the β′ phase for the TMP-1 scheme, while the use of 525 °C in the TMP-2 scheme led to limited growth of the β′ phase. This difference in the growth of β′ phase is consistent with the binary phase diagram of Cu-Zn alloy (not shown) that indicates increasing the temperature, in the range of 450–750 °C, promotes further β′ growth at the expense of the α phase [14].
Table 4.
Average grain size and area fraction of the β phase for leaded brass samples subjected to TMP.
Figure 4 presents EBSD maps for leaded brass in the initial condition. The phase map in Figure 4a demonstrates that most of the grains belong to the α phase (shown in red). Due to the initial annealing of 1 h, the fraction of HAGBs in the α phase is quite large, 89.9%. The average grain size of the α phase is 3.6 μm. Moreover, many of the α grains contain annealing twins of Σ3n boundaries, with their fraction reaching 63.4%. On the other hand, the βʹ islands (shown in blue) are randomly distributed in the duplex structure. It is also shown that LAGBs exist within most of the β′ islands. In addition, the lead particles (shown in yellow) are randomly dispersed in the structure and are relatively small compared to the average grain size of α and β′ phases. Some of the small lead particles are located at the α-β′ interfaces, as indicated by the arrows in Figure 4a.
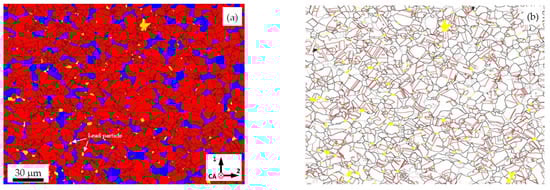
Figure 4.
EBSD maps of leaded brass in initial condition: (a) phase map and (b) grain boundary construction map. In phase map, red, blue, and yellow phases denote α and β′ grains and lead particles, respectively, while black lines represent HAGBs. In grain boundary construction map, LAGBs are depicted as thin grey lines, HAGBs as solid black lines, and Σ3n twin boundaries as solid red lines. CA denotes compression axis and directions 1 and 2 present arbitrary transverse directions.
Figure 5 shows the phase maps for the two TMP schemes. The use of high annealing temperature of 670 °C in the TMP-1 scheme increased the area fraction of β′ grains, while a limited growth in β′ grains occurred for TMP-2 samples processed at 525 °C. For the TMP-1 scheme, the microstructure has coarser α and β′ grains and a relatively higher population of large lead particles. Many α grains are isolated, presumably implying lesser frequency for the generation of annealing twins. It can also be noticed that the β′ islands became more coalesced with increasing cycles, consuming several α grains and their annealing twins. This is demonstrated in Figure 5a,d, where the remnant of the α phase is present in the newly formed β′ grains. In the TMP-2 scheme, the α grains are heavily connected, forming clusters of grains. Moreover, the βʹ islands are mostly separated from each other, and they contain a small fraction of HAGBs.
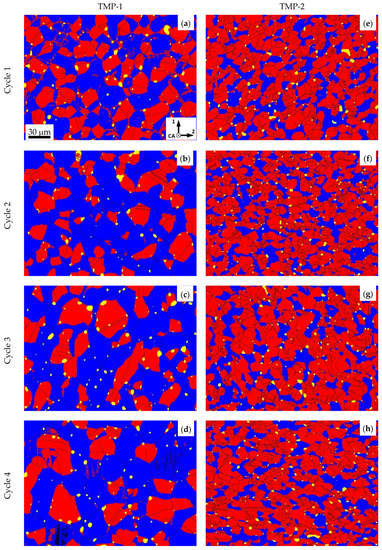
Figure 5.
Phase maps of leaded brass samples subjected to TMP: (a–d) TMP-1 scheme and (e–h) TMP-2 scheme. Red, blue, and yellow phases denote α and βʹ grains and lead particles, respectively, while black lines represent HAGBs.
Figure 6 presents the grain boundary construction maps for the same phase maps shown in Figure 5. The two TMP schemes generally led to an increase in the average grain size with increasing cycles. Nevertheless, grain coarsening is more pronounced for the TMP-1 scheme. It is also evident that the TMP-1 scheme is not an effective GBE process to promote the formation of a large fraction of annealing twins of Σ3n boundaries, as demonstrated in Figure 6a–d. Annealing twins are weakly present in the α grains, though most of these grains are fully recrystallized. Many βʹ grains contain LAGBs, suggesting that the annealing time was enough to cause recovery and not recrystallization since dislocation debris was still a remnant from the deformed state [16]. Moreover, the TMP-2 scheme produced a more homogenous duplex structure, where both α and βʹ grains contain a tiny fraction of LAGBs, as illustrated in Figure 6e–h. The formation of annealing twins of Σ3n boundaries substantially occurred in the α grains, resulting in clusters of α grains that are more connected together through a massive network of Σ3n boundaries. Consequently, further generation of Σ3n boundaries was facilitated with successive TMP cycles, as also reported by Randle [5].
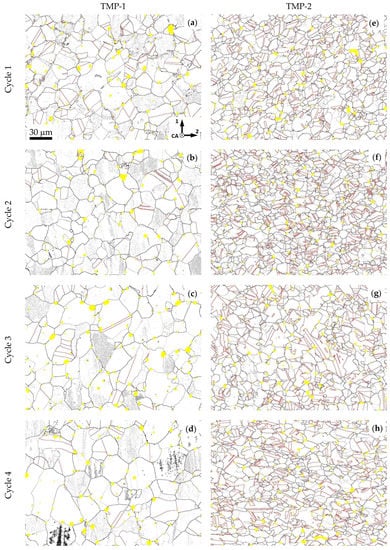
Figure 6.
Grain boundary construction maps of leaded brass samples subjected to TMP: (a–d) TMP-1 scheme and (e–h) TMP-2 scheme. LAGBs are depicted as thin grey lines, HAGBs as solid black lines, and Σ3n twin boundaries as solid red lines. Yellow phase represents lead particles.
Figure 7 represents the evolution of HAGBs in α and β′ phases for both TMP schemes. For the initial material, the α phase contains an enormous fraction of HAGBs (~90%), while the β′ phase has HAGBs of ~32%. For the two TMP schemes, the fraction of HAGBs in the α phase is high, in the range of 75–90%. Such a high fraction of HAGBs, in which most of the boundaries have Σ3n characteristics, indicates that the α phase has gone through complete recrystallization. On the other hand, the fraction of HAGBs in the β′ phase strongly depends on the TMP scheme. In the TMP-1 scheme, the fraction of HAGBs in the β′ phase was very low (5%) after cycle 1, and it gradually increased to ~17% after cycle 4. Such development is mainly attributed to the accumulation of LAGBs that were only recovered in some large β′ grains without complete recrystallization, as illustrated in Figure 6a–d. Moreover, the gradual reduction of LAGBs in the β′ phase with successive cycles in the TMP-1 scheme suggests that the newly formed β′ grains have a dislocation-free structure, while the remnant of the β′ grains from the initial structure still contains dislocation debris. For the TMP-2 scheme, the fraction of HAGBs in the β′ phase increases with successive cycles, rising from ~30% for cycle-1 sample to 42% for cycle-4 sample. As demonstrated in Figure 5, most of the β′ grains have recrystallized, enhancing the formation of HAGBs. Moreover, the area fraction of β′ phase remains almost unchanged for TMP-2 samples (~35%), as presented in Table 4. This suggests that the amount of energy provided for βʹ phase during annealing was sufficient for recrystallization of the deformed βʹ grains without noticeable phase growth.
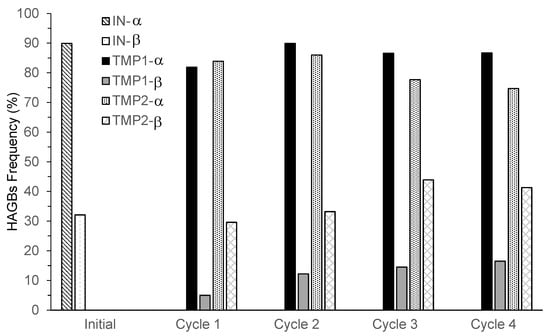
Figure 7.
Distribution of HAGBs in α and β′ phases for samples in initial and TMP conditions.
Table 5 summarizes the average grain size and Σ3n boundaries of α phase in samples processed by the TMP-2 scheme. The long annealing time produced a fully recrystallized initial structure of the α phase (fraction of Σ3n boundaries is about 64%). The TMP-2 scheme also promoted the extensive formation of Σ3n boundaries. However, a drop in the fraction of Σ3n boundaries (~57.5%) occurred in the first two cycles. With successive cycles, the fraction of Σ3n boundaries increased to 60%. The ratio of Σ3n boundaries to HAGBs also increased with increasing cycles. On the other hand, the contribution of Σ9 and Σ27 boundaries to the enhancement of special boundaries in the α structure was minimal, as demonstrated by the limited increase in the fractions of Σ9 and Σ27 boundaries with TMP cycles.
Table 5.
EBSD statistics of α phase in samples processed by TMP-2 scheme.
A similar trend in the development of Σ3n boundaries in α brass alloys has been examined by Randle [5], indicating that these special boundaries associated with annealing twins primarily serve at different stages of microstructural development. It was deduced that Σ3 boundaries perform multiple tasks during TMP cycles: they retain strain during the deformation stage, generate Σ3 and other special boundaries during annealing, and contribute to the breakup of the random boundary network. Other studies by Randle and coworkers [10,26] reported that the drop in the fraction of Σ3 boundaries during the first two cycles was required to homogenize the microstructure in preparation to obtain GBE characteristics in subsequent cycles. It was also demonstrated that the accumulation of strain energy during early TMP cycles was essential to provide sufficient driving force for extensive Σ3n interactions at later cycles [10,26]. Consequently, one expects similar developments in the α structure for the leaded brass samples processed by the TMP-2 scheme in the current study, where limited growth occurred for the β′ phase.
On the other hand, Lee et al. [16] reported different development of Σ3 boundaries in the α structure for an α-β′ duplex brass subjected to TMP. Annealing at 680 °C resulted in the growth of the α phase from an area fraction of 0.4 in cycle 1 to 0.7 in cycle 4. The growth was accompanied by grain coarsening with successive cycles. Unlike the TMP-2 scheme used in the current study, there was a continuous increase in the fraction of Σ3n boundaries in the first two cycles to a maximum of 80%, followed by a drop to 75% in cycle 4. This trend was related to the β′ → α phase transformation during early TMP cycles, for which more Σ3 boundaries were generated due to the formation of new α grains and coarsening of the preexisting α phase. In the later stages, no significant increase occurred in Σ3 boundaries, but rather the collision of the preexisting Σ3 boundaries promoted the generation of Σ9 and Σ27 boundaries. In addition, Lee et al. [16] suggested that the occurrence of phase transformation during annealing significantly altered the development of Σ3n boundaries in the α structure and thus affected the production of GBE material. In the current study, the TMP-1 scheme led to remarkable growth of the β′ phase accompanied by grain coarsening, reducing the formation of Σ3 boundaries in the α phase and resulting in less breakup of the random boundary network. On the contrary, the TMP-2 scheme produced negligible phase transformation and inhibited massive grain coarsening, promoting progressive development of Σ3n boundaries in the α phase and enhancing the breakup of the random boundary network.
Moreover, the presence of β′ phase and lead particles has contributed to suppressing grain coarsening in the α phase. Shibayanagi et al. [27] examined the effect of β′ phase on the grain growth of α phase of a cold-worked dual-phase Cu-Zn alloy subjected to 550 °C annealing treatment and indicated that the coarsening of α grains was restricted by the randomly distributed β′ grains. Consequently, limited grain growth was observed in the α phase, resulting in no significant texture development. It was also emphasized that the distribution and area fraction of the β′ phase has an essential role in restricting the grain growth of α phase, without neglecting the significance of the high surface energy of α-β′ interphase boundaries and grain boundary character on boundary migration. In addition, Konkova et al. [28] examined grain growth during annealing of cryogenically rolled α-phase brass. It was reported that lead-based particles formed preferentially at random HAGBs, whereas the annealing twin boundaries were generally precipitate-free, presumably due to their low surface energy. Most of these particles remained at the grain boundaries during grain growth with almost no particle precipitation within the grain interior. Such behavior was interpreted as the particles being dragged by migrating grain boundaries, and therefore, it provided evidence for the slow growth of α grains. From the works mentioned above, it can be deduced that the random distribution of β′ grains and the formation of lead particles at grain/interphase boundaries in the initial structure of the leaded brass rationalize the slight grain coarsening in the α phase for samples processed by TMP-2 scheme (see Figure 3, Figure 4 and Figure 5). In the case of the TMP-1 scheme, grain coarsening in the α phase occurred, and it is thought to be mainly driven, aside from the α → β′ transformation, by the increase in the annealing temperature that promoted grain boundary migration, and also by the formation of relatively large lead particles providing less area fraction and thus less impediment to grain/interphase boundary migration (Table 3).
3.2. Texture
Figure 8 shows the inverse pole figures (IPFs) and orientation maps of α and β′ phases sample in the initial condition. The IPFs and orientation maps were constructed to show the distributions of compression axis (CA) in the crystal coordinates. As presented in Figure 8a,c, the initial textures of both phases show strong tension fibers, where the {111} and {100} planes become perpendicular to the compression axis for the α (fcc) phase and {110} planes are perpendicular to the compression axis in the case of β′ (bcc) phase. The texture development demonstrates that the texture produced by cold drawing was strongly preserved even after annealing for 1 h. In addition, the IPF maps presented in Figure 8b,d show that partial weakening of the texture occurred in the α phase due to the formation of annealing twins. The texture weakening is demonstrated by the formation of a weak {110} fiber along the axial direction. On the other hand, the majority of the β′ grains are oriented parallel to {110} planes, implying that limited recrystallization occurred in the βʹ phase during the initial annealing treatment. Such texture development is strongly correlated with the microstructure presented in Figure 4 and Figure 7, where the moderate formation of LAGBs in the initial βʹ structure furthered the promotion of strong fiber texture in the β′ phase.
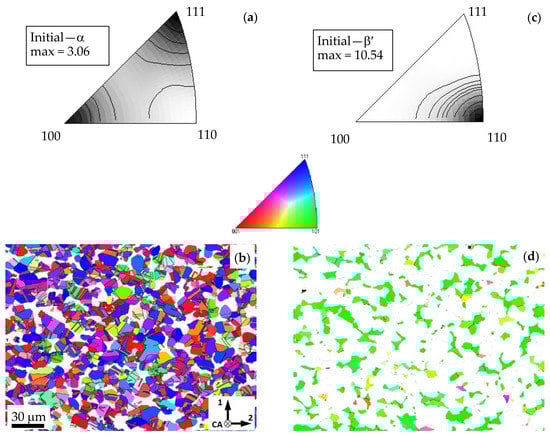
Figure 8.
Inverse pole figures (IPFs) and orientation maps of leaded brass in initial condition: (a,b) α phase and (c,d) β′ phase. A color code triangle is shown at the center. IPFs and orientation maps show the crystal axes aligned parallel to the compression axis (CA).
Moreover, the texture development for samples processed by the TMP-1 scheme is presented in Figure 9. Despite the grain growth in the cycle-1 sample, the initial texture is largely preserved for both α and β′ phases. With subsequent processing in cycle 4, the texture weakened relatively as further grain growth occurred for both phases. For the α phase, a weak fiber along {110} planes formed, while the tension fibers were still maintained. On the other hand, the tension fiber was strongly preserved for the βʹ phase. Therefore, the grain growth for both phases only caused limited weakening of the initial texture. Additionally, the texture results demonstrate that the phase transformation from α to βʹ promoted the formation of βʹ grains that are parallel to the {110} planes. The product βʹ grains have presumably preserved the orientation relationship of the parent α grains following the Kurdjumov–Sachs criterion [29], i.e., {1 1 0}bcc//{1 1 1}fcc, ⟨1 1 1⟩bcc//⟨1 1 0⟩fcc. Consequently, the TMP-1 scheme had a limited effect on altering the initial texture of leaded brass samples developed by cold drawing.
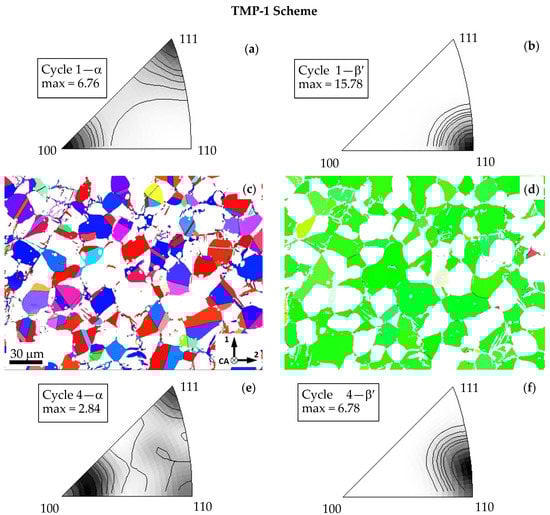
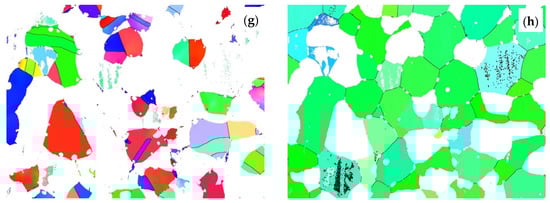
Figure 9.
Inverse pole figures and orientation maps of leaded brass samples processed by TMP-1 scheme: (a–d) cycle 1 and (e–h) cycle 4. IPFs and orientation maps show the crystal axes aligned parallel to the compression axis (CA).
Figure 10 presents the texture development for samples processed by the TMP-2 scheme. The IPFs shown in Figure 10a,b for a sample processed by one cycle indicate that the initial texture was strongly preserved for both phases. Nevertheless, the maximum intensity was less than obtained for a sample processed for one cycle using the TMP-1 scheme. In the case of four cycles, the texture intensity further weakened for both phases. Figure 10e shows that the {111} fiber disappeared in the α phase as the plane orientation of many grains shifted toward the {110} planes. On the other hand, the {110} fiber was preserved for the βʹ phase, as demonstrated in Figure 10f. However, there are more grains aligned nearby the {111} planes, as compared to the sample processed by one cycle.
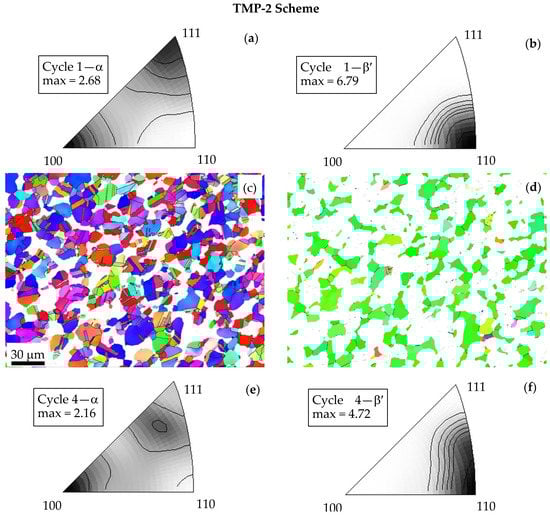
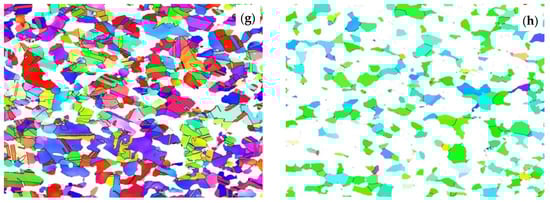
Figure 10.
Inverse pole figures and orientation maps of leaded brass samples processed by TMP-2 scheme: (a–d) cycle 1 and (e–h) cycle 4. IPFs and orientation maps show the crystal axes aligned parallel to the compression axis (CA).
Based on the findings mentioned above, it can be concluded that the behavior of texture development during annealing of the leaded brass alloy is a complex interplay of several factors including, and not limited to, the initial texture, the accumulated strain during compression, annealing time and temperature, grain growth, phase transformation, and formation of annealing twins. The texture results have clearly shown that the strong texture fibers formed by cold drawing in the initial material significantly affect the texture development during TMP. Moreover, applying repetitive TMP cycles of small compression strain of 0.1 followed by annealing for 15 min has a limited effect on altering the initial texture fibers. The application of small-strain compression during TMP was previously reported to vigorously retain the deformation texture after annealing an α-brass alloy [30]. This was attributed to the development of GBE structure via the strain-induced boundary migration method. The preservation of deformation texture in the dual-phase brass alloy was also examined by Garg et al. [31], indicating nucleation of grain orientations in α phase close to the rolling texture and growth of subgrains in βʹ phase having rolling texture orientation.
In early cycles of the TMP-1 scheme, coarsening of the α grains has been shown to preserve the initial texture orientation, implying no critical texture randomization. On the other hand, the β′ phase encountered two competing events that presumably favored the maintenance of the initial texture of {110} fiber. The two events are the coarsening of original β′ grains and production of new β′ grains via phase transformation following the Kurdjumov–Sachs orientation relationship. With successive cycles, the increase in area fraction of βʹ phase became minimal (Table 4), while the grains of both phases gradually coarsened. Accordingly, the maximum intensity of the texture decreased after four cycles. In the TMP-2 scheme, there was a limited coarsening of the α grains and insignificant change in the fraction of Σ3n boundaries for the sample processed in cycle 1 (Table 5), accompanied by a small growth of the βʹ phase. Therefore, a slight weakening in the initial texture was observed for both phases, as demonstrated by the reduction in the maximum intensity. Additional cycles gradually promoted the formation of annealing twins and ultimately an increase in the fraction of Σ3n (and HAGBs) boundaries, and thus favored texture randomization of the α phase. In the case of the βʹ phase, the initial texture fiber was further weakened, and more grains became oriented toward the {111} planes. The tendency for texture randomization of both phases in the later TMP cycles was related to converting LABGs into HAGBs [16,32,33].
4. Conclusions
Four cycles of TMP of low-strain compression and annealing were applied to examine the microstructure and texture development in an α-β′ brass alloy, considering the presence of lead particles. In addition, the effect of phase transformation was evaluated using two TMP schemes (TMP-1 scheme of 670 °C annealing and TMP-2 scheme of 525 °C annealing). The following conclusions have been reached:
- (i)
- TMP-1 scheme promoted undesirable growth of β′ phase, from an initial area fraction of 27% to 70%, while small β′ growth to 38% occurred using TMP-2 scheme. Moreover, coarser α and β′ grains were produced for samples processed by the TMP-1 scheme. For both schemes, lead particles were mainly located at the α-β interfaces, implying the contribution of lead particles in suppressing grain growth by limiting grain boundary migration via particle-dragging effect.
- (ii)
- As demonstrated in the TMP-2 scheme, hindering α → β′ phase transformation and grain coarsening are critical factors for developing GBE structure in leaded brass. Achieving such structure without excessive recrystallization is possible via strain-induced boundary migration mechanism. TMP-2 scheme aided in promoting cluster formation of α grains characterized by an enormous fraction of Σ3n boundaries, enhancing the interaction and generation of Σ3n boundaries and thus leading to the breakup of the random HAGBs network with increasing TMP cycles.
- (iii)
- In general, both TMP schemes strongly maintained the initial textures produced by cold drawing. Despite the remarkable β′ growth and grain coarsening in the TMP-1 scheme, the product β′ grains preserved the orientation relationship of the parent α grains following the Kurdjumov–Sachs. In the TMP-2 scheme, more texture randomization of the α phase occurred due to the increase in the fraction of Σ3n boundaries (and thus HAGBs) with successive cycles.
Author Contributions
Conceptualization, K.J.A.-F.; methodology, K.J.A.-F., M.A.R., and N.T.; formal analysis and investigation, K.J.A.-F., M.A.R., and N.T.; resources, K.J.A.-F., M.A.R., and N.T.; data curation, K.J.A.-F.; writing—original draft preparation, K.J.A.-F.; writing—review and editing, K.J.A.-F.; supervision and project administration, K.J.A.-F. All authors have read and agreed to the published version of the manuscript.
Funding
The authors would like to acknowledge the funding provided by Kuwait University under grant number EM02/13. Additional support was provided by Kuwait University General Facility (grant number GE 01/07) for sample preparation, optical microscopy, and SEM/EBSD measurements.
Institutional Review Board Statement
Not applicable.
Informed Consent Statement
Not applicable.
Data Availability Statement
The data that support the findings of this study are available from the corresponding author, K.J.A.-F., upon reasonable request.
Conflicts of Interest
The authors declare no conflict of interest.
References
- Palumbo, G.; King, P.J.; Aust, K.T.; Erb, U.; Lichtenberger, P.C. Grain boundary design and control for intergranular stress-corrosion resistance. Scr. Met. Mater. 1991, 25, 1775–1780. [Google Scholar] [CrossRef]
- Lin, P.; Palumbo, G.; Erb, U.; Aust, K.T. Influence of grain boundary character distribution on sensitization and intergranular corrosion of alloy 600. Scr. Met. Mater. 1995, 33, 1387–1392. [Google Scholar] [CrossRef]
- Lehockey, E.M.; Palumbo, G. On the creep behaviour of grain boundary engineered nickel. Mater. Sci. Eng. A 1997, 237, 168–172. [Google Scholar] [CrossRef]
- Watanabe, T. Approach to Grain Boundary Design for Strong and Ductile Polycrystals. Res. Mech. Int. J. Struct. Mech. Mater. Sci. 1984, 11, 47–84. [Google Scholar]
- Randle, V. Twinning-related grain boundary engineering. Acta Mater. 2004, 52, 4067–4081. [Google Scholar] [CrossRef]
- Lehockey, E.M.; Palumbo, G.; Brennenstuhl, A.; Lin, P. Grain boundary engineered lead alloys. Mater. Res. Soc. Symp. Proc. 1997, 458, 243–248. [Google Scholar] [CrossRef]
- Was, G.S.; Thaveeprungsriporn, V.; Crawford, D.C. Grain boundary misorientation effects on creep and cracking in Ni-based alloys. JOM 1998, 50, 44–49. [Google Scholar] [CrossRef]
- Davies, P.; Randle, V.; Watkins, G.; Davies, H. Triple junction distribution profiles as assessed by electron backscatter diffraction. J. Mater. Sci. 2002, 37, 4203–4209. [Google Scholar] [CrossRef]
- Davies, D.; Randle, V. The effect of low strain and annealing cycles on the ductility of alpha-brass. Philos. Mag. A 2001, 81, 2553–2564. [Google Scholar] [CrossRef]
- Randle, V.; Davies, H. Evolution of Microstructure and Properties in Alpha-Brass after Iterative Processing. Metall. Mater. Trans. A 2002, 33, 1853–1857. [Google Scholar] [CrossRef]
- Rohrer, G.S.; Randle, V.; Kim, C.S.; Hu, Y. Changes in the five-parameter grain boundary character distribution in α-brass brought about by iterative thermomechanical processing. Acta Mater. 2006, 54, 4489–4502. [Google Scholar] [CrossRef]
- Pinto, A.L.; Viana, C.S.; Luiz, H.A. Micromechanisms involved in grain boundary engineering of alpha-brass. Mater. Sci. Eng. A 2007, 445–446, 14–19. [Google Scholar] [CrossRef]
- Goehner, R.P.; Michael, J.R. Electron backscatter diffraction: A powerful tool for phase identification in the SEM. Mater. Res. Soc. Symp. Proc. 2001, 589, 39–49. [Google Scholar]
- Massalski, T.B.; Okamoto, H.; Subramanian, P.R.; Kacprzak, L. Binary Alloy Phase Diagrams, 2nd ed.; ASM International: Materials Park, OH, USA, 1990; Volume 2. [Google Scholar]
- Pantazopoulos, G.; Vazdirvanidis, A. Characterization of the Microstructural Aspects of Machinable α-β Phase Brass. Microsc. Anal. 2008, 22, 13–16. [Google Scholar]
- Lee, S.Y.; Chun, Y.B.; Han, J.W.; Hwang, S.K. Effect of thermomechanical processing on grain boundary characteristics in two-phase brass. Mater. Sci. Eng. A 2003, 363, 307–315. [Google Scholar] [CrossRef]
- Vilarinho, C.; Davim, J.P.; Soares, D.; Castro, F.; Barbosa, J. Influence of the chemical composition on the machinability of brasses. J. Mater. Process. Technol. 2005, 170, 441–447. [Google Scholar] [CrossRef] [Green Version]
- Fadhil, A.A.; Ghattas, M.S.; Iskander, B.A.; Ajeel, S.A.; Enab, T.A. Structural characterization and detecting processes of defects in leaded brass alloy used for gas valves production. Alex. Eng. J. 2018, 57, 1301–1311. [Google Scholar] [CrossRef]
- Pantazopoulos, G.; Vazdirvanidis, A. Failure Analysis of a Fractured Leaded-Brass (CuZn39Pb3) Extruded Hexagonal Rod. J. Fail. Anal. Preven. 2008, 8, 218–222. [Google Scholar] [CrossRef]
- Buršíková, V.; Buršík, J.; Navrátil, V.; Milička, K. Creep behaviour of leaded brass. Mater. Sci. Eng. A 2002, 324, 235–238. [Google Scholar] [CrossRef]
- Hussein, R.M.; Abd, O.I. Influence of Al and Ti Additions on Microstructure and Mechanical Properties of Leaded Brass Alloys. Indian J. Mater. Sci. 2014, 2014, 909506. [Google Scholar] [CrossRef] [Green Version]
- Egole, C.P.; Nzebuka, G.C. Effect of Aluminium Addition and Grain Refinement on the Microstructure, Mechanical and Physical Properties of Leaded Brass Alloys. J. Phys. Conf. Ser. 2019, 1378, 022043. [Google Scholar] [CrossRef]
- Mousavia, S.E.; Naghshekesha, N.; Ahmadib, F.; Sadeghic, B.; Cavaliere, P. Effect of lead on the crack propagation and the mechanical properties of Brass processed by ECAP at different temperatures. Mater. Sci. Eng. A 2018, 728, 231–238. [Google Scholar] [CrossRef]
- EN 12164:1998: Copper and Copper Alloys: Rod for Free Machining Purposes; European Committee for Standardization(CEN): Brussels, Belgium, 1998.
- Abramoff, M.D.; Magalhaes, P.J.; Ram, S.J. Image processing with Image. J. Biophotonics Int. 2004, 11, 36–42. [Google Scholar]
- Randle, V.; Coleman, M. A study of low-strain and medium-strain grain boundary engineering. Acta Mater. 2009, 57, 3410–3421. [Google Scholar] [CrossRef]
- Shibayanagi, T.; Takada, K.; Matsumoto, K.; Umakoshi, Y. Effect of Secondary Phase on Grain Growth Process of α/β Dual-Phase CuZn Alloy. Scr. Mater. 1997, 37, 667–672. [Google Scholar] [CrossRef]
- Konkova, T.; Mironov, S.; Korznikov, A.; Korznikova, G.; Myshlyaev, M.M.; Semiatin, S.L. Grain growth during annealing of cryogenically-rolled Cu-30Zn brass. J. Alloys Compd. 2016, 666, 170–177. [Google Scholar] [CrossRef] [Green Version]
- Kurdjumov, G.; Sachs, G. Crystallographic orientation relationship between α-and γ-Fe. Ann Phys. 1930, 64, 325. [Google Scholar]
- Al-Fadhalah, K. Microstructure and Texture Development in Alpha-Brass Using Repetitive Thermomechanical Processing. ASME J. Eng. Mater. Technol. 2018, 140, 021007. [Google Scholar] [CrossRef]
- Garg, R.; Gurao, N.P.; Ranganathan, S.; Suwas, S. Evolution of texture and grain boundary microstructure in two-phase (α + β) brass during recrystallization. Philos. Mag. 2011, 91, 4089–4108. [Google Scholar] [CrossRef]
- Mishin, O.V. Distributions of Grain Boundaries and Triple Junctions in Variously Textured Copper. Scr. Mater. 1998, 38, 423–428. [Google Scholar] [CrossRef]
- Humphreys, J.; Rohrer, G.S.; Rollett, A. Recrystallization and Related Annealing Phenomena, 3rd ed.; Elsevier: London, UK, 2017; pp. 640–641. [Google Scholar]
Publisher’s Note: MDPI stays neutral with regard to jurisdictional claims in published maps and institutional affiliations. |
© 2021 by the authors. Licensee MDPI, Basel, Switzerland. This article is an open access article distributed under the terms and conditions of the Creative Commons Attribution (CC BY) license (https://creativecommons.org/licenses/by/4.0/).