Abstract
The inhibition effect of Na2HPO4 on the electrochemical migration (ECM) of pure tin was investigated by means of water drop testing and surface characterizations. The effects of concentration of Na2HPO4 and applied direct current (DC) bias voltage on the ECM were also studied. Results showed that the mean time to failure caused by ECM decreased with the increasing bias voltage. Upon addition of relative high concentrations of Na2HPO4, Na2HPO4 can react with metallic tin or tin ions to form a protective film on the surface of anode and increase the pitting potential. The rate of anodic dissolution can be slowed down and thus ECM of tin was retarded. Fractal-like dendrites formed after ECM tests in the absence and presence of low concentrations of Na2HPO4 mainly consisted of tin elements. Relevant reactions were proposed to explain the inhibitory effect of Na2HPO4 on the ECM of tin.
1. Introduction
With the advent of microelectronics over the past few decades, electronic components are becoming more sensitive to corrosion due to miniaturization and integration processes [1]. As for various kinds of electronic materials, such as tin, copper, nickel, silver and their alloys [2], the common failure behaviors include: atmospheric corrosion [3], electrochemical migration (ECM) [4], formation of conductive filament [5] and deformation [6], etc. ECM can be defined as a form of corrosion caused by the applied bias voltage, which can result in insulation resistance degradation or short circuit in electronic devices [7]. The required conditions for ECM mainly include bias voltage between two electrodes, elevated relative humidity, temperature and time. Three basic steps consist of ECM, including anodic dissolution, migration of metal ions and deposition of metal ions.
Due to excellent electric conductivity, low melting point, moderate corrosion and oxidation resistance, tin-based alloys were commonly utilized in practical electronic connections [8]. This has made the research of reliability for tin-based solder alloys an important issue for electronic assembly and encapsulation [9]. Numerous authors have reported on atmospheric corrosion [10], mechanism of ECM [11], and the effect of some environmental or material factors on ECM (such as the addition of alloy elements [12], type of the applied bias voltage [13], thickness of the absorbed electrolyte [14], typical contaminants [15], etc.). Tin and tin-based alloys are sensitive to ECM [16], but few methods for mitigating ECM of tin and tin-based alloys have been established [17].
Phosphate compounds, including disodium hydrogen phosphate (Na2HPO4) [18], zinc phosphate [19], cerium dibutylphosphate [20], lithium zinc phosphate [21], etc., were widely used as environmentally-friendly inorganic inhibitors due to their low toxicity and low cost [22]. Awad et al. [23] found that tertiary phosphate ions exhibited a corrosion inhibition effect on tin owing to the formation of a passive film on the surface of electrode. Yohai et al. investigated the competitive adsorption inhibition mechanism of phosphate by changing [PO43−]/[Cl−] and [Cl−]/[OH−] ratios. It was found that tin phosphate complexes can retard the anodic dissolution and migration of metal ions as phosphate corroded metallic tin [24]. Na2HPO4 can be used as an inhibitor for tin in a proper concentration [25]. In this case, phosphate compounds can be used as an alternative inhibitor for ECM of tin by forming a protective film on the anode and retarding the migration behavior of tin ions.
The objective of the present work is to evaluate the inhibition effect of Na2HPO4 on the ECM of tin. The effects of Na2HPO4 concentration and applied DC bias voltage on the ECM of tin were studied. Potentiodynamic polarization was used to investigate the effect of Na2HPO4 on the anodic and cathodic reactions. The surface characterizations of scanning electron microscopy (SEM) and energy-dispersive spectrometry (EDS) were used to clarify the relevant mechanisms. This study can provide a basis for the development of phosphate compound-based ECM inhibitors for tin and tin alloys.
2. Materials and Methods
2.1. Materials and Solution Preparation
The tin samples were processed from commercial pure Sn (>99.999%, mass%) (Sichuan Xinlong Hoof Technology Development Co. Ltd., Sichuan, China) with dimensions of 2 mm × 5 mm × 10 mm. Each electrode for ECM test had two tin samples (one for the anode and one for the cathode) sealed in a cylindrical plastic tube using epoxy resin. The gap size was 0.5 mm in the parallel direction and the working area was 0.1 cm2. The sealed tin electrodes for polarization curve measurements had a working area of 0.5 cm2. Stranded copper wires were welded to the back of each electrode to ensure electrical contact. All the test surfaces were successively polished with 400, 800, 1200 grit silicon carbide papers, then sonicated continuously in de-ionized water and acetone each time before tests.
Na2HPO4 (Sigma, analytical grade) and NaCl (Sigma, analytical grade) solutions were prepared with de-ionized water (Resistivity of 18.2 MΩ cm). A DDS-307A conductivity tester (Shanghai Rex Instrument Factory, China) and a PHS-3C pH meter (Shanghai Rex Instrument Factory, China) were used to record the variations in the conductivity and pH value of the solutions, respectively.
2.2. Setup of Water Drop Test With and Without Na2HPO4 and ECM Measurements
The water drop (WD) test has been considered as a realistic method to simulate the ECM process in the case of droplets splashing on the surface of electronics. As shown in Figure 1, the setup of the WD test mainly consists of a CS350 electrochemical workstation (Wuhan Corrtest, China) and a digital microscopy (Betical XTL-6745J4, Nanjing, China). Prior to bias, a droplet of well-defined electrolyte was placed on the surface of electrodes using a pipetting device. A direct current (DC) bias voltage (3 V, 5 V, 8 V or 10 V) was applied between the twin electrodes. The current flowing was recorded as a function of time by the electrochemical workstation. The change of morphology on the electrode surface was in situ recorded by the digital microscope. Considering the vaporization process of droplets, the longest time for ECM test was set as 3000 s. All the ECM tests were repeated at least five times to check reproducibility.
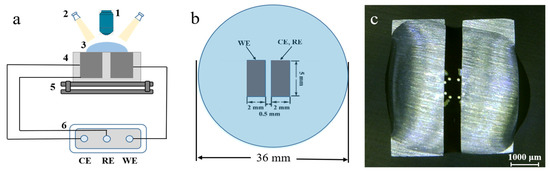
Figure 1.
Schematic diagram of setup for electrochemical migration using the water drop test (WDT): (a) (1) digital microscope; (2) cold light sources; (3) waterdrop; (4) electrodes; (5) horizontal stage; (6) electrochemical workstation; (b) vertical view of electrode; (c) optical photo of waterdrop before electrochemical migration (ECM) test.
2.3. Polarization Curves and Cyclic Voltammetry Measurements
A three-electrode single-compartment glass cell was employed for the electrochemical measurements at ambient temperature (24 ± 0.5 °C), including a Pt foil (2 cm2) as a counter electrode and a saturated calomel electrode (SCE) as a reference electrode. Polarization curves were performed in solutions containing various concentrations of Na2HPO4 with a scan rate of 0.5 mV/s from −0.15 V to 1.75 V versus the open-circuit potential.
2.4. Surface Characterization
The microstructure and composition of dendrite and precipitate obtained after ECM tests were examined by scanning electron microscopy (SEM; JSM-6701F, Hitachi Ltd., Tokyo, Japan) quipped energy-dispersive spectrometry (EDS; Oxford INCA energy 300, Oxford Instruments, Oxford, UK).
3. Results and Discussion
3.1. Effect of the Alert of Solution Chemistry on the Probability of the ECM of Sn
Figure 2 shows the change of pH value and conductivity of solutions containing various concentrations of Na2HPO4. As shown in Reactions (1) and (2) [26], hydrolysis of Na2HPO4 in water gave rise to the increase in concentration of OH− and some other ions (such as Na, H2PO4−, etc.). The pH value and conductivity of solution increased with the increasing concentration of Na2HPO4. For example, as the concentration of Na2HPO4 increases from 0 mg/L to 1000 mg/L, pH value increases from 6.2 to 8.9 while conductivity changes from 0.07 to 142.4 μS/cm.
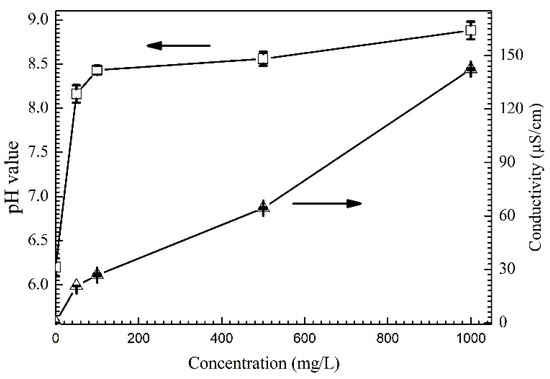
Figure 2.
Change of pH value and conductivity with the concentration of Na2HPO4.
HPO42− + H2O ⇌ H2PO4− + OH−
H2PO4− + H2O ⇌ H3PO4 + OH−
Normally, the rates of anodic and cathodic reactions process increase resulting from the decrease of solution resistance during ECM [27]. The rising of conductivity accelerates the growth of dendrite, but the relatively higher alkaline pH condition does not favor dendrite formation [28].
3.2. Effect of Na2HPO4 Concentration on the Probability of the ECM of Sn at Different DC Bias Voltages
Figure 3 shows the influence of Na2HPO4 concentration on the current density during ECM under a droplet of 15 μL at different DC bias voltages. During the ECM test, the dendrite grows from a cathode and then bridges the anode causing a short circuit [29]. The short circuit results in a sudden increase of current density up to one or two orders of magnitude. The time of short circuit can be defined as the time to failure (TTF) caused by ECM [30]. As shown in Figure 3a, in the absence of Na2HPO4, mean TTF of ECM for tin descended with the increase of DC bias voltage. For example, mean TTF descended from 31.9 s to 1.7 s while DC bias voltage increased from 3 V to 10 V. At low concentration levels of Na2HPO4 (such as 50 mg/L and 100 mg/L), results of mean TTF are similar with that obtained without Na2HPO4, as shown in Figure 3b and c. For example, under the 3 V bias condition, mean TTF is 32.23 s under a droplet without Na2HPO4 while mean TTF is 28.83 s in the presence of 50 mg/L and mean TTF is 33.02 s in the presence of 100 mg/L. At high concentration levels of Na2HPO4 (such as 500 mg/L and 1000 mg/L), the sudden increase of current density does not occur after 3000 s at different DC bias voltages, indicating that Na2HPO4 can inhibit the growth of the dendrite during ECM tests. As shown in Figure 3d,e, the significant fluctuation of current density can mainly result from the strong disturbance caused by the gas evolution in droplets.
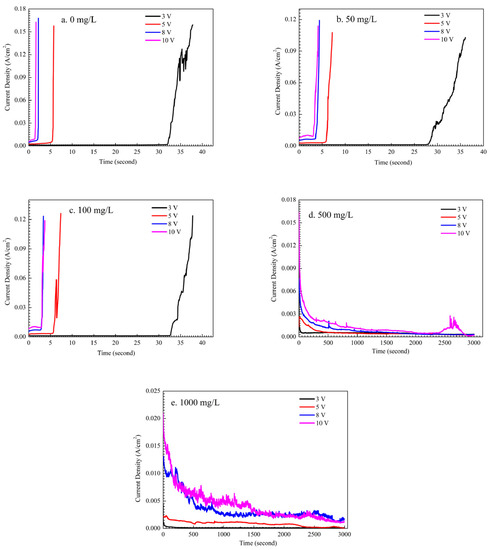
Figure 3.
Current density vs. time curves for ECM tests of tin under a droplet of 15 μL containing different concentrations of Na2HPO4 under various bias conditions: (a) 0 mg/L; (b) 50 mg/L; (c) 100 mg/L; (d) 500 mg/L; (e) 1000 mg/L.
Figure 4, Figure 5, Figure 6, Figure 7 and Figure 8 display the in-situ optical photos of tin electrodes during ECM tests under a droplet of 15 μL containing different concentrations of Na2HPO4 at various DC bias voltages. As shown in Figure 4a and Figure 5a, prior to ECM, droplets of 15 μL on the surfaces of electrodes are in different shapes. The contact area of the droplet on the electrode surface cannot be accurately controlled in the WD test [31]. As shown in Figure 4, Figure 5 and Figure 6, tree-like dendrites and white precipitates can be observed during ECM in WD tests without and with low concentrations of Na2HPO4 (such as 50 mg/L and 100 mg/L). Within the Na2HPO4 concentration range from 500 to 1000 mg/L, the dendrite cannot be observed while some white and dark products can be found on the surface of the anode. As shown in Figure 7, a thick layer of white precipitates can be observed on the surface of the anode at a concentration of 500 mg/L. A thin dark product layer can be seen from Figure 8 at a concentration of 1000 mg/L. The number of bubbles formed on the surface of the cathode was augmented with the increase of bias voltage.
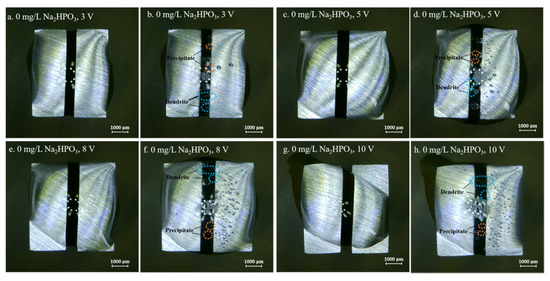
Figure 4.
Optic photos for ECM tests of tin under a droplet of 15 μL containing 0 mg/L Na2HPO4 at various bias voltages (Anode is on the left and cathode is on the right).
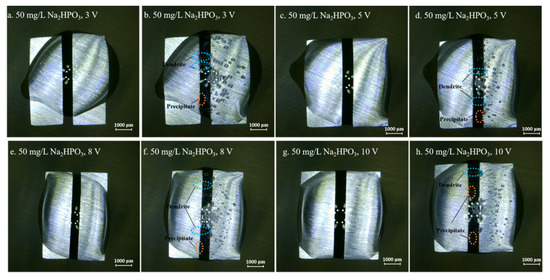
Figure 5.
Optic photos for ECM tests of tin under a droplet of 15 μL containing 50 mg/L Na2HPO4 at various bias voltages (Anode is on the left and cathode is on the right).
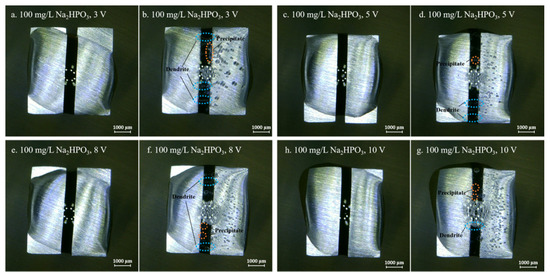
Figure 6.
Optic photos for ECM tests of tin under a droplet of 15 μL containing 100 mg/L Na2HPO4 at various bias voltages (Anode is on the left and cathode is on the right).
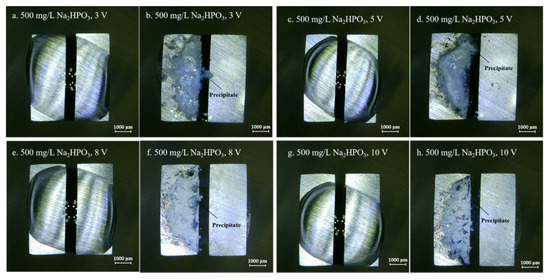
Figure 7.
Optic photos for ECM tests of tin under a droplet of 15 μL containing 500 mg/L Na2HPO4 at various bias voltages (Anode is on the left and cathode is on the right).
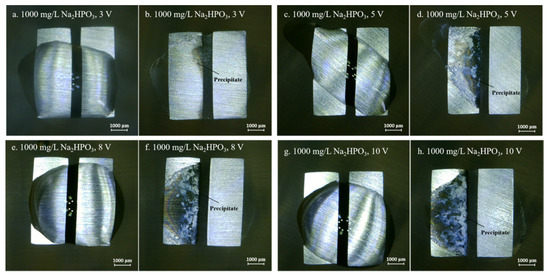
Figure 8.
Optic photos for ECM tests of tin under a droplet of 15 μL containing 1000 mg/L Na2HPO4 at various bias voltages (Anode is on the left and cathode is on the right).
Figure 9 shows the microstructures of dendrites obtained after ECM tests under a droplet of 15 μL containing different concentrations of Na2HPO4 at 3 V. Fractal-like dendrites formed in the absence and presence of low concentrations of Na2HPO4 (for example, 50 mg/L and 100 mg/L) mainly consisting of tin element. Dendrites formed are all covered with precipitates. Upon addition of low concentrations of Na2HPO4, as shown in Figure 9c,e, branches of dendrites become more dense and tiny. Figure 10 presents the morphologies and corresponding EDS results of products formed on the anode after ECM tests under a droplet of 15 μL containing different concentrations of Na2HPO4 at 3 V. As shown in Figure 10a,b, some pits can be found on the surface of the anode, and the anodic products mainly consist of Sn (At% 34.72), O (At% 59.96) and Cl (At% 5.32) elements (Figure 10c). In the presence of 500 mg/L Na2HPO4, a thick layer of precipitate can be observed on the surface of the anode (Figure 10d,e), which is composed of Sn (At% 13.13), O (At% 78.90) and P (At% 7.97) elements (Figure 10f). Upon addition of 1000 mg/L Na2HPO4, a compact film can be observed from Figure 10g,h. The results of EDS (Figure 10i) indicate that this film consists of Sn (At% 20.54), O (At% 65.76) and P (At% 13.70) elements. The amount of P element of anodic products augments with the increasing Na2HPO4 concentration.
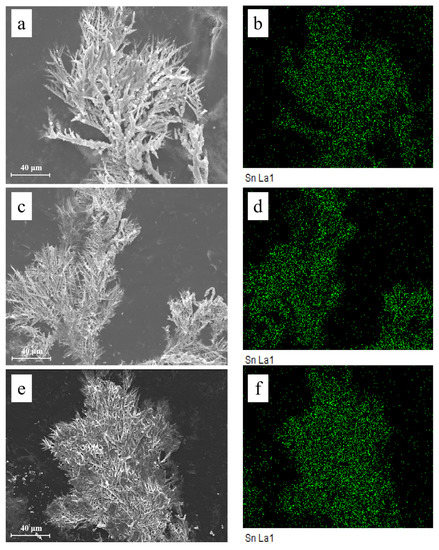
Figure 9.
SEM images and corresponding EDS results of dendrites formed after ECM tests of tin under a droplet of 15 μL containing various concentrations of Na2HPO4 at 3 V: (a) 0 mg/L; (b) EDS-Mapping results of image (a); (c) 50 mg/L; (d) EDS-Mapping results of image (c); (e) 100 mg/L; (f) EDS-Mapping results of image (e).
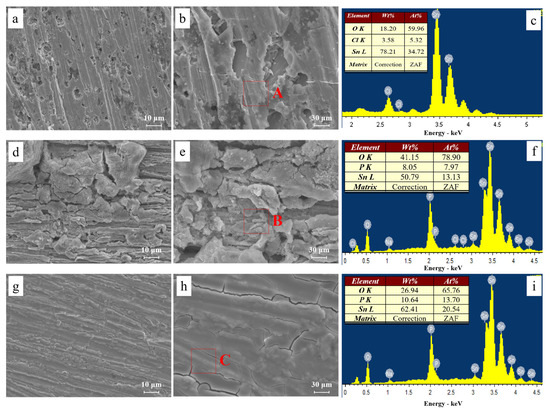
Figure 10.
SEM images and corresponding EDS results of precipitates formed after ECM tests of tin under a droplet of 15 μL containing various concentrations of Na2HPO4 at 3 V: (a) 0 mg/L; (b) enlarged image of image (a); (c) EDS results of section A; (d) 500 mg/L; (e) enlarged image of image (d); (f) EDS results of section B; (g) 1000 mg/L; (h) enlarged image of image (g); (i) EDS results of section C.
As is reported [32,33], the main anodic and cathodic reactions during ECM of tin in neutral NaCl solution are as follows:
Anodic reactions:
Sn → Sn2+ + 2e−
Sn2+ → Sn4+ + 2e−
Cathodic reactions:
2H2O + 2e− → H2 + 2OH−
Sn2+ + 2e− → Sn
Hydration, adsorption and complex formation of tin ions [34] can occur in the anodic stage and HPO42− can determine the appearance of characteristic anodic regions [35]. In alkaline solution, the anodic products can consist of Sn2+, Sn(OH)3+, Sn(OH)2, Sn(OH)4, SnHPO4, Sn(HPO4)34−, Sn3(PO4)2, HSnO2−, SnO32−, etc. (as shown in Reactions (8)–(12)) [36,37]. Polarization curves of tin in the absence and presence of Na2HPO4 are used to study the effect of Na2HPO4 on anodic behavior (Figure 11a). As shown in Figure 11b, the pitting potential (Epit) of tin increases with the increasing concentration of Na2HPO4. For example, Epit of tin increases from −194 mV (vs. SCE) to 1364 mV (vs. SCE) as concentration of Na2HPO4 increases from 0 mg/L to 1000 mg/L. Epit is closely related to metal dissolution processes, and a higher Epit means a lesser dissolution rate [38], indicating that the addition of Na2HPO4 can decrease the rate of anodic dissolution.
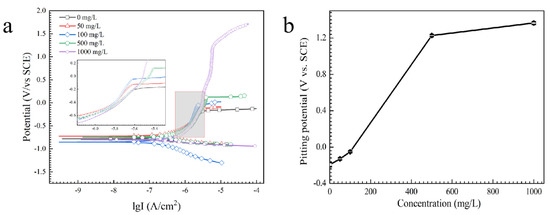
Figure 11.
(a) Potentiodynamic polarization curves and (b) pitting potential of tin in the presence of various concentrations of Na2HPO4.
As shown in Figure 10f,i, the anodic films formed after ECM mainly consist of Sn, O and P elements within the Na2HPO4 concentration range from 500 to 1000 mg/L. Compounds of tin phosphate can be formed during ECM. The following reactions are proposed to occur during the oxidation behavior of tin in Na2HPO4 solution [36]:
Sn + HPO42− ⇌ SnHPO4 + 2e−
Sn2+ + HPO42− ⇌ SnHPO4 (aq)
Sn2+ + HPO42− ⇌ SnHPO4 (s)
Sn2+ + 3HPO42− ⇌ Sn(HPO4)34−
3Sn2+ + 2PO43− ⇌ Sn3(PO4)2
3.3. Effect of Applied DC Bias Voltage on the ECM of Tin
As shown in Figure 3, higher applied DC bias voltages indicated larger current densities during ECM tests. Mean TTF decreased with rising DC bias voltage, indicating that the increasing bias voltage accelerated the growth of dendrite. As the precondition for ECM, rates of anodic dissolution, metal migration and metal deposition (as shown in Reactions (3), (4) and (6)) largely depend on the DC bias voltage. As shown in Figure 4, Figure 5, Figure 6, Figure 7 and Figure 8, the number of bubbles that formed on the surface of cathode increased at higher DC bias voltages, suggesting that the hydrogen evolution reaction (Reaction (5)) was also accelerated with the increasing bias voltage.
4. Conclusions
The inhibition effect of Na2HPO4 on the ECM of tin was evaluated by electrochemical methods and surface characterizations in this work. The following conclusions can be drawn:
(1) The growth rate of dendrite for tin increases with the increase of applied DC bias voltage. Dendrites formed after ECM tests in the absence and presence of low concentrations of Na2HPO4 (0–100 mg/L) have clearly a fractal-type structure and mainly consist of tin element.
(2) Within the relative higher Na2HPO4 concentration range (such as 500–1000 mg/L), owing to the formation of some insoluble compounds of tin phosphate on the surface of the anode, the rate of anodic dissolution is slowed down. The pitting potential of tin increases with the rising concentration of Na2HPO4 and the growth of the dendrite is retarded.
Author Contributions
B.L.: co-designed the project, characterization, data analysis and writing (review and editing); H.W.: co-designed the project, investigation and writing (original draft); S.W. and W.X.: provided data acquisition and analysis support; X.G.: co-designed the project and supervised the overall project. All authors have read and agreed to the published version of the manuscript.
Funding
This work was supported by the National Natural Science Foundation of China (Grant No. 51971067), Science and Technology Research Project of Guangzhou (No. 202002010007), Platform Research Capability Enhancement Project of Guangzhou University (Grant No. 69-620939), and Guangzhou University’s 2020 Training Program for Talent (Grant No. 69-62091109).
Acknowledgments
The authors would like to acknowledge the financial from the National Natural Science Foundation of China (Grant No. 51971067), Science and Technology Research Project of Guangzhou (No. 202002010007), Platform Research Capability Enhancement Project of Guangzhou University (Grant No. 69-620939), and Guangzhou University’s 2020 Training Program for Talent (Grant No. 69-62091109).
Conflicts of Interest
The authors declare no conflict of interest.
References
- Kyeremateng, N.; Brousse, T.; Pech, D. Microsupercapacitors as miniaturized energy-storage components for on-chip electronics. Nat. Nanotechnol. 2017. 12, 7–15. [CrossRef]
- Jin, S.K.; Kim, H.; Ryu, J.; Hahn, H.; Jang, S.; Joung, J.W. Inkjet printed electronics using copper nanoparticle ink. J. Mater. Sci. Mater. Electron. 2010, 21, 1213–1220. [Google Scholar]
- Liao, B.; Cen, H.; Chen, Z.; Guo, X. Corrosion behavior of Sn-3.0Ag-0.5Cu alloy under chlorine-containing thin electrolyte layers. Corros. Sci. 2018, 143, 347–361. [Google Scholar] [CrossRef]
- Qi, X.; Ma, H.; Wang, C.; Shang, S.; Li, X.; Wang, Y.; Ma, H. Electrochemical migration behavior of Sn-based lead-free solder. J. Mater. Sci. Mater. Electron. 2019, 30, 14695–14702. [Google Scholar] [CrossRef]
- Guo, T.; Elshekh, H.; Yu, Z.; Yu, B.; Wang, D.; Kadhim, M.; Chen, Y.; Hou, W.; Sun, B. Effect of crystalline state on conductive filaments forming process in resistive switching memory devices. Mater. Today Commun. 2019, 20, 1–5. [Google Scholar] [CrossRef]
- Niu, X.; Shen, L.; Chen, C.; Zhou, J.; Chen, L. An Arrhenius-type constitutive model to predict the deformation behavior of Sn-0.3Ag-0.7Cu under different temperature. J. Mater. Sci. Mater. Electron. 2019, 30, 14611–14620. [Google Scholar] [CrossRef]
- Zou, S.; Li, X.; Dong, C.; Ding, K.; Xiao, K. Electrochemical migration, whisker formation, and corrosion behavior of printed circuit board under wet H2S environment. Electrochim. Acta. 2013, 114, 363–371. [Google Scholar] [CrossRef]
- Gain, A.; Zhang, L. Effect of Ag nanoparticles on microstructure, damping property and hardness of low melting point eutectic tin-bismuth solder. J. Mater. Sci. Mater. Electron. 2017, 28, 15718–15730. [Google Scholar] [CrossRef]
- Abtew, M.; Selvaduray, G. Lead-free solders in microelectronics. Mater. Sci. Eng. R Rep. 2000, 27, 95–141. [Google Scholar] [CrossRef]
- Veleva, L.; Dzib-Pérez, L.; González-Sánchez, J.; Pérez, T.R. Initial stages of indoor atmospheric corrosion of electronics contact metals in humid tropical climate: Tin and nickel. Rev. Metal. Madrid. 2007, 43, 101–110. [Google Scholar] [CrossRef]
- Minzari, D.; Jellesen, M.; Moller, P.; Ambat, R. On the electrochemical migration mechanism of tin in electronics. Corros. Sci. 2011, 53, 3366–3379. [Google Scholar] [CrossRef]
- Jiang, S.; Liao, B.; Chen, Z.; Guo, X. Investigation of electrochemical migration of tin and tin-based lead-free solder alloys under chloride-containing thin electrolyte layers. Int. J. Electrochem. Sci. 2018, 13, 9942–9949. [Google Scholar] [CrossRef]
- Zhong, X.; Qiu, Y.; Chen, Z.; Zhang, G.; Guo, X. In situ study the electrochemical migration of tin under unipolar square wave electric field. J. Eectrochem. Soc. 2013, 160, D495–D500. [Google Scholar] [CrossRef]
- Zhong, X.; Zhang, G.; Guo, X. The effect of electrolyte layer thickness on electrochemical migration of tin. Corros. Sci. 2015, 96, 1–5. [Google Scholar] [CrossRef]
- Yi, P.; Xiao, K.; Dong, C.; Zou, S.; Li, X. Effects of mould on electrochemical migration behaviour of immersion silver finished printed circuit board. Bioelectrochemistry 2017, 119, 203–210. [Google Scholar] [CrossRef]
- Liao, B.; Jia, W.; Sun, R.; Chen, Z.; Guo, X. Electrochemical migration behavior of Sn-3.0Ag-0.5Cu solder alloy under thin electrolyte layers. Surf. Rev. Lett. 2019, 26, 185–208. [Google Scholar] [CrossRef]
- Liao, B.; Wang, H.; Xiao, E.; Cai, Y.; Guo, X. Recent advances in method of suppressing dendrite formation of tin-based solder alloys. J. Mater. Sci. Mater. Electron. 2020. Accepted. [Google Scholar] [CrossRef]
- Abd El Haleem, S.M.; Abd El Wanees, S.; Abd El Aal, E.; Diab, A. Environmental factors affecting the corrosion behavior of reinforcing steel II. Role of some anions in the initiation and inhibition of pitting corrosion of steel in Ca(OH)2 solutions. Corros. Sci. 2010, 52, 292–302. [Google Scholar] [CrossRef]
- Bastos, A.; Ferreira, M.; Simões, A. Corrosion inhibition by chromate and phosphate extracts for iron substrates studied by EIS and SVET. Corros. Sci. 2006, 48, 1500–1512. [Google Scholar] [CrossRef]
- van Soestbergen, M.; Erich, S.; Huinink, H.; Adan, O. Dissolution properties of cerium dibutylphosphate corrosion inhibitors. Corros. Eng. Sci. Technol. 2013, 48, 234–240. [Google Scholar] [CrossRef]
- Alibakhshi, E.; Ghasemi, E.; Mahdavian, M. Corrosion inhibition by lithium zinc phosphate pigment, Corros. Sci. 2013, 77, 222–229. [Google Scholar]
- Etteyeb, N.; Dhouibi, L.; Takenouti, H.; Alonso, M.; Triki, E. Corrosion inhibition of carbon steel in alkaline chloride media by Na3PO4. Electrochim. Acta. 2007, 52, 7506–7512. [Google Scholar] [CrossRef]
- Awad, S.; Kassab, A. Behaviour of tin as metal-metal phosphate electrode and mechanism of promotion and inhibition of its corrosion by phosphate ions. J. Electroanal. Chem. 1969, 20, 203–212. [Google Scholar] [CrossRef]
- Yohai, L.; Vázquez, M.; Valcarce, B. Phosphate ions as corrosion inhibitors for reinforcement steel in chloride-rich environments. Electrochim. Acta. 2013, 102, 88–96. [Google Scholar] [CrossRef]
- Almobarak, N. Cyclic voltammetry study of passivation of tin in sodium dihydrogen phosphate solution. Chem. Technol. Fuels Oils 2012, 48, 321–330. [Google Scholar] [CrossRef]
- Fulmer, M.; Brown, P. Hydrolysis of dicalcium phosphate dihydrate to hydroxyapatite. J. Mater. Sci. Mater. Electron. 1998, 9, 197–202. [Google Scholar] [CrossRef]
- Zhong, X.; Zhang, G.; Qiu, Y.; Chen, Z.; Guo, X. Electrochemical migration of tin in thin electrolyte layer containing chloride ions. Corros. Sci. 2013, 74, 71–82. [Google Scholar] [CrossRef]
- Liao, B.; Wei, L.; Chen, Z.; Guo, X. Na2S-influenced electrochemical migration of tin in a thin electrolyte layer containing chloride ions. RSC Adv. 2017, 7, 15060–15070. [Google Scholar] [CrossRef]
- Medgyes, B.; Rigler, D.; Illés, B.; Harsányi, G.; Gál, L. Investigating of electrochemical migration on low-Ag lead-free solder alloys. In Proceedings of the 18th International Symposium for Design and Technology of Electronic Packaging, Alba Iulia, Romania, 25–28 October 2012; pp. 147–150. [Google Scholar]
- Liao, B.; Li, Z.; Cai, Y.; Guo, X. Electrochemical migration behavior of Sn-3.0Ag-0.5Cu solder alloy under SO2 polluted thin electrolyte layers. J. Mater. Sci. Mater. Electron. 2019, 30, 5652–5661. [Google Scholar] [CrossRef]
- Zhong, X.; Yu, S.; Chen, L.; Hu, J.; Zhang, Z. Test methods for electrochemical migration: A review. J. Mater. Sci. Mater. Electron. 2016, 28, 1–11. [Google Scholar] [CrossRef]
- Liao, B.; Cen, H.; Chen, Z.; Guo, X. Effect of Organic Acids on the Electrochemical Migration of Tin in Thin Electrolyte Layer. Innov. Corros. Mater. Sci. (Former. Recent Pat. Corros. Sci.) 2019, 9, 74–84. [Google Scholar] [CrossRef]
- Liao, B.; Chen, Z.; Qiu, Y.; Zhang, G.; Guo, X. Effect of citrate ions on the electrochemical migration of tin in thin electrolyte layer containing chloride ions. Corros. Sci. 2016, 112, 393–401. [Google Scholar] [CrossRef]
- Cilley, W.A. Solubility of tin (II) orthophosphate and the phosphate complexes of tin (II). Inorg. Chem. 1968, 7, 612–614. [Google Scholar] [CrossRef]
- Kamel, K.; Awad, S.; Kassab, A. Non-corrosive action of the tertiary phosphate ion on aluminium. J. Electroanal. Chem. 1981, 127, 195–202. [Google Scholar] [CrossRef]
- Ciavatta, L.; Iuliano, M. Formation equilibria of tin (II) orthophosphate complexes. Polyhedron 2000, 19, 2403–2407. [Google Scholar] [CrossRef]
- Duc, H.D.; Tissot, P. Anodic behaviour of tin in neutral phosphate solution. Corros. Sci. 1979, 19, 179–190. [Google Scholar] [CrossRef]
- Britton, S. The Corrosion and Oxidation of Metals. J. Electrochem. Soc. 1977, 12, 5. [Google Scholar] [CrossRef]


© 2020 by the authors. Licensee MDPI, Basel, Switzerland. This article is an open access article distributed under the terms and conditions of the Creative Commons Attribution (CC BY) license (http://creativecommons.org/licenses/by/4.0/).