Article

Fracture–Mechanical Assessment of the Effect of Defects on the Fatigue Lifetime and Limit in Cast and Additively Manufactured Aluminum–Silicon Alloys from HCF to VHCF Regime

1
Department of Materials Test Engineering (WPT), TU Dortmund University, Baroper Str. 303, 44227 Dortmund, Germany
2
Department of Mechanical Engineering, The University of Lahore, Raiwind Road, 53700 Lahore, Pakistan
3
Department of Materials Science & Materials Testing (WWHK), University of Applied Sciences Kaiserslautern, Schoenstraße 11, 67659 Kaiserslautern, Germany
*
Author to whom correspondence should be addressed.
Metals 2020, 10(7), 943; https://doi.org/10.3390/met10070943
Submission received: 9 June 2020 / Revised: 6 July 2020 / Accepted: 8 July 2020 / Published: 14 July 2020
(This article belongs to the Special Issue Fatigue Life Calculation Approaches for Metallic Materials)

Abstract

:
Aluminum–silicon alloys are commonly used in die-cast and additively manufactured (AM) light-weight components due to their good processability and high strength-to-weight ratio. As both processing routes lead to the formation of defects such as gas and shrinkage porosity, a defect-sensitive design of components is necessary for safe application. This study deals with the fatigue and crack propagation behavior of die-cast alloy AlSi7Mg0.3 and additively manufactured alloy AlSi12 and its relation to process-induced defects. The different porosities result in significant changes in the fatigue stress-lifetime (S–N) curves. Therefore, the local stress intensity factors of crack-initiating defects were determined in the high and very high cycle fatigue regime according to the fracture mechanics approach of Murakami. Through correlation with fatigue lifetime, the relationship of stress intensity factor (SIF) and fatigue lifetime (N) could be described by one power law (SIF–N curve) for all porosities. The relationship between fatigue limit and defect size was further investigated by Kitagawa–Takahashi (KT) diagrams. By using El Haddad’s intrinsic crack length, reliable differentiation between fracture and run out of the cast and AM aluminum alloys could be realized. SIF–N curves and KT diagrams enable a reliable fatigue design of cast and AM aluminum alloys for a finite and infinite lifetime.

1. Introduction

Aluminum alloys are promising candidates for light-weight applications in highly loaded components like in the automotive or railway industries. The low density of 2.66 kg/dm3 and the excellent strength-to-weight ratio enables a weight reduction of up to 35% in practical applications [1]. Hereby, casting and additive manufacturing (e.g., by laser powder bed fusion (L-PBF)) allow near-net-shape manufacturing from large- to small-scale components. While cast aluminum alloys are used for low-cost solutions with medium quantities, L-PBF aluminum alloys are high-cost solutions for custom or individual components (e.g., internal cooling or heating channels, bionic structures) with high-complexity and small-quantities down to single-item production.
Aluminum cast alloys are grouped according to the major alloying element, the Si alloying element is in group 4xx.x, and the Si–Mg alloying elements in group 3xx.x (wrought alloy 4xxx and 3xxx). These alloys are very suitable for casting because Si increases the fluidity of the melt and reduces the melting temperature. Si also has a low density of 2.34 kg/dm3, which provides the alloy with the advantage of reducing weight. This is why this alloy group is used for automotive and aerospace applications. Al–Si alloys are ideal for replacing high-density alloys due to their mechanical properties and wearing resistance [2]. Figure 1 shows a section of the binary Al–Si phase diagram. Alloys can be classified as hypoeutectic (<12 wt.% Si), eutectic (12–13 wt.% Si), and hypereutectic (14–25 wt.% Si). Commercial Al–Si alloys that contain Fe form two types of intermetallic phases by eutectic reaction: α-Al12Fe3Si (cubic crystal structure), and at higher Si levels, β-Al9Fe2Si will be formed [3].
In cast components, hypoeutectic aluminum alloys with a silicon amount of 7–9 wt.% are most commonly used due to their combination of good castability and ductility as well as the possibility of precipitation hardening by alloying magnesium [4]. The fatigue performance in cast aluminum alloys is primarily limited by process-induced shrinkage and gas porosity [5,6,7]. Modern cast processes and hot isostatic pressure (HIP) treatment results in a reduced or even removed porosity [8,9]. Through a reduction in pore size to 25–100 µm [8,10], the weakest link for fatigue crack initiation changes from structural (e.g., porosity, oxides) to microstructural inhomogeneities (e.g., eutectic silicon particles, intermetallic precipitates) [8,11,12,13]. The size and morphology of the eutectic silicon particles can be controlled by the addition of Na or Sr refining and by increasing the cooling rates, leading to refinement and spherodization of Si particles [9].
Selective laser melting of AlSi12 leads to the formation of a 3D interconnected network of Si dendrites infiltrating an aluminum matrix resulting in a eutectic morphology. Anticipating gas porosity, it was proposed to apply heat (200 °C) to the deposition platform to reduce heat gradient and thus inflict more stable melt pools to enhance degassing. The result was coarsening of the structure and an increase in the width of the dendrites [14]. The boundaries between melt pools were microstructurally distinguishable as the microstructure coarsened there. This was a consequence of laser scan overlap giving rise to more exposure to heat and lower cooling rate [15]. Such unique formation was a result of heterogeneous nucleation conditions inflicted by the limitation of the solubility of Si in Al and high cooling rates during the process. Due to limited solid solubility of Si in Al as temperature drops (1.65 wt.% at 850 K, 0.06 wt.% at 300 °C), Si particles are rejected to the boundaries of the solid solution. However, this limited solid solubility is extended in high cooling rates, giving way to a decreased solute concentration in the liquid and reduced constitutional undercooling. As a result, α-Al solidifies in cellular morphology, while Si particles accumulate at the α-Al boundaries [16]. Such a microstructure of dispersed Si round particles in the α-Al matrix as they are rejected by the Al lattice [15,17] properties provide the potential for microstructural coarsening and eventual agglomeration of Si particles at sufficiently high temperatures and holding times. One more result of annealing treatments (6 h, 200–450 °C), is an increase of dispersed Si round particles in the α-Al matrix as they are rejected by Al lattice [15,17].
The effect of defects on the fatigue limit depends on the defect morphology and the notch sensitivity of the material. By increasing the notch radius ρ of the specimens (notch depth t is constant), Frost [18] found that the fatigue limit rapidly decreased with an increasing stress concentration factor K t , but beyond a critical value K t , 0 , the fatigue limit remained constant. For this region, where the notch radius has no effect on fatigue limit, Smith and Miller [19] demonstrated that all notched specimens with a certain notch depth or length, respectively, behaved comparably to the cracked specimen with the same crack length (crack-like notch), described by the following equation for the stress intensity factor (SIF) range ΔK of the linear elastic fracture mechanics (LEFM) near fatigue limit:
Δ σ t h = Δ K t h Y · π a
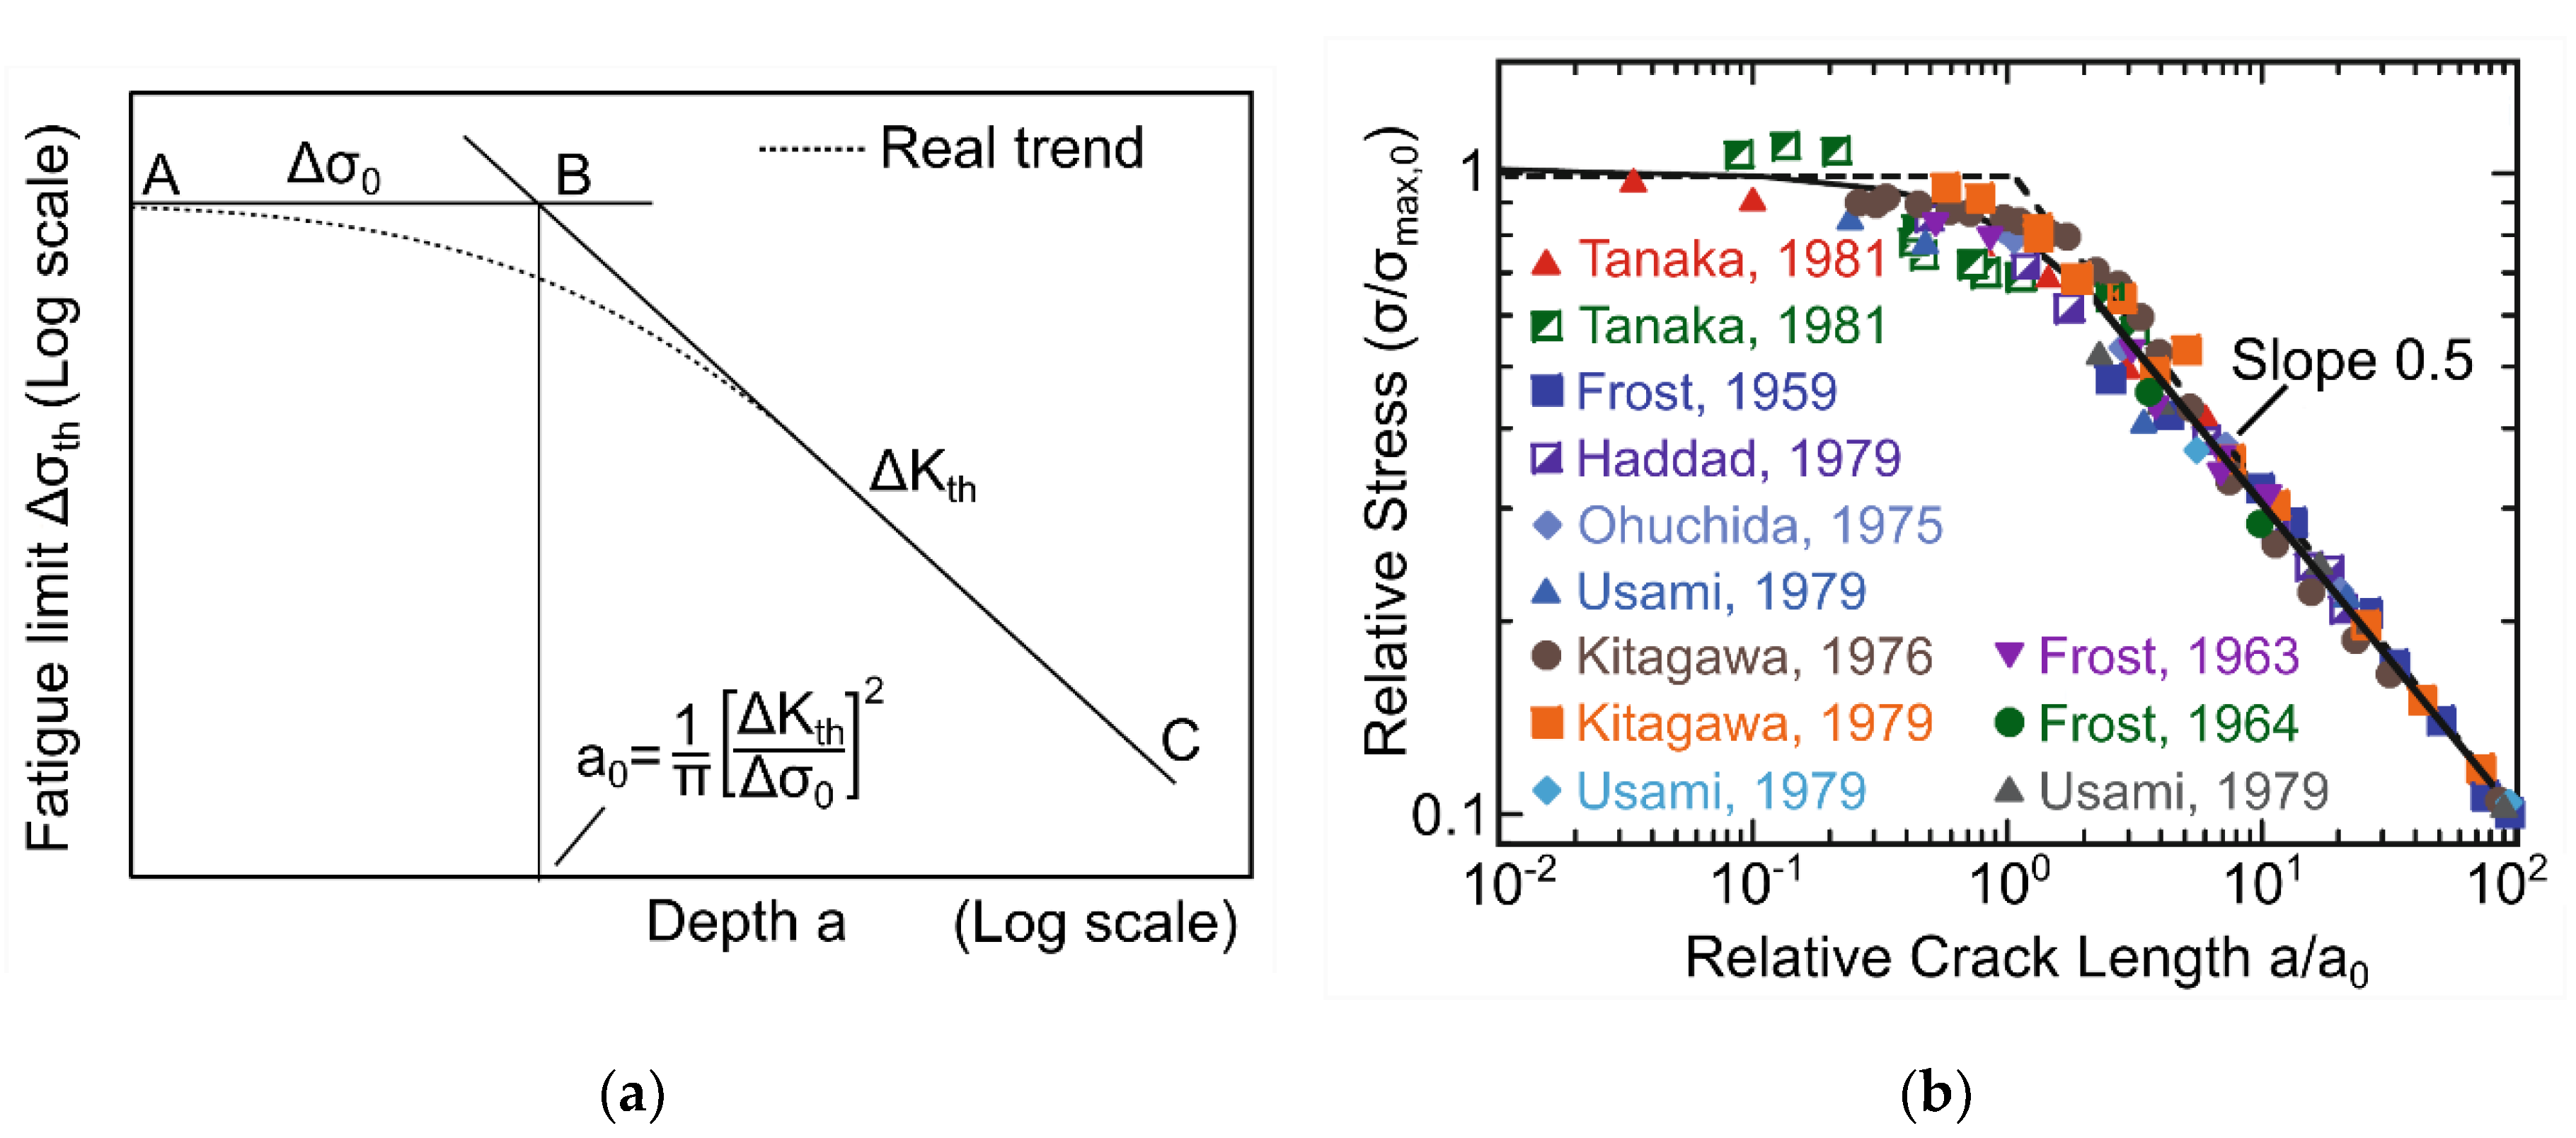
where Δ K t h is the threshold of SIF range for long-crack propagation; Y is the geometric factor; and Δ σ t h is the fatigue limit for a specimen containing a crack or a defect of size a. This relation is illustrated in Figure 2a as line in the Kitagawa–Takahashi diagram [20] (log–log Δ σ t h - a ) and is limited by the intrinsic material fatigue limit Δ σ 0 of a defect-free specimen. The intersection at point B gives El Haddad’s intrinsic crack length a 0 [21], which can be calculated by the following equation ( Y = 1):
a 0 = 1 π [ Δ K t h Δ σ 0 ] 2
Experimental results on metallic materials have shown that there is a continuous transition between section A–B and section B–C [21,22,23], as summarized by Sadananda and Sarkar in Figure 2b.
The continuous transition from point A to C within the Kitagawa–Takahashi diagram (Figure 2a) can be explained by El Haddad’s equation:
Δ σ t h = Δ K t h π · ( a + a 0 )
and allows for the estimation of fatigue limit Δ σ t h for materials with a specific defect length a. Several investigations have proven that the effect of defects on the fatigue limit of aluminum alloys can be described using the Kitagawa–Takahashi diagram under uniaxial and multiaxial loading, especially for AlSi7Mg0.3-T6 [24,25,26], AlSi7Mg0.3-T7 [27], and AlSi8Cu3-T6 [28].
The effect of variations in defect and crack geometries (e.g., different positions (surface or volume) or finite specimen size cannot be described within one traditional Kitagawa–Takahashi diagram, as Equations (2) and (3) have to be modified by the geometric factor Y to avoid inconsistency between the material fatigue limit ( Δ σ 0 ), as shown in the following equations [29,30]:
a 0 = 1 π [ Δ K t h Y · Δ σ 0 ] 2
Δ σ t h = Δ K t h Y · π · ( a + a 0 )
As a result, a 0 is affected by the defect or crack geometry and is no longer a material constant. Atzori et al. [22] further modified Equation (5) by using a 0 as the material constant (Equation (2)) and related the geometric factor to a of Equation (5) in Equation (6). In the modified Kitagawa–Takahashi diagram, Δ σ t h is then plotted against Y 2 · a , which enables the comparison of fatigue datasets for different defect and crack geometries within one unified Kitagawa–Takahashi diagram:
Δ σ t h = Δ K t h π · ( Y 2 · a + a 0 )
In materials with initial defects (e.g., process-induced gas and shrinkage porosity in the cast and additively manufactured aluminum alloys), the “defect-free” intrinsic material fatigue limit ( Δ σ 0 ) and intrinsic crack length a 0 mostly cannot be determined experimentally and can be estimated based on the “defective” fatigue limit ( Δ σ 0 ) and “defective” intrinsic crack length a 0 by the initial defect length a i , according to the equations of Tanaka et al. [31]:
a 0 = 1 π [ Δ K t h Δ σ 0 ] 2
a 0 = a 0 a i
Δ σ 0 = Δ σ 0 a 0 a 0  
In industrial components, defects and cracks have a complex 3-dimensional crack geometry, and the determination of crack length a is difficult and time-consuming. Due to this, Murakami et al. [32,33] found out that Equation (1) can be modified to calculate the SIF range Δ K for a wide range of short defects and cracks in the materials and components by using the square root of the projected defect or crack area perpendicular to the load direction A together with a geometric factor Y of 0.65 for surface defects and 0.5 for internal defects:
Δ K = Y · Δ σ π · A e f f
Here, the convex defect area is used as an effective area of the defect A e f f , instead of the real complex cross-section as the interspaces of complex defects have a negligible bearing effect and further increase the stress intensity factor. Sub-surface defects with a distance to the surface of equal or smaller than half the square root of the defect area A are defined as surface defects (cf. Mayer et al. [34]), where the free area between the defect and specimen surface A f r e e is added to the effective surface defect area A e f f , according to Murakami [35].
The above equations enable us to study the effect of process-induced defects in various alloys related to their specific crack sensitivity. For this purpose, the fatigue behavior for die-cast (DC) and additively manufactured (AM) aluminum alloys were characterized related to fatigue lifetime and limit as well as crack-initiating defects. The results were discussed in the S–N curves as well as SIF–N curves by using the local stress intensity factor of a crack-initiating defect, according to Murakami et al. [32,33]. Finally, the results were analyzed by the modified Kitagawa-Takahashi diagram for DC and AM aluminum alloys. A normalized description of the Kitagawa-Takahashi diagram allows a unified visualization of the effects of defects in aluminum alloys with variation in microstructure and defects.

2. Materials and Methods

2.1. Die-Cast Aluminum Alloy

Die-cast (DC) samples of aluminum alloy AlSi7Mg0.3 were manufactured by gravity die-casting. The alloy was molten in an electric resistance furnace, including the alloying procedure with the addition of AlTi5B1 for grain refinement and Strontium (Sr) for Si eutectic modification. The melt was heated up to 730 °C and poured into a steel mold, which was pre-heated to 450 °C. To investigate the effect of cast porosity, selected castings were given a melt cleaning by nitrogen releasing tablets for improving the hydrogen-induced porosity, i.e., batch DC-1 without and batch DC-2 with melt cleaning. Moreover, selected samples of batch B (incl. melt cleaning) were hot isostatically pressed (HIPed) by Bodycote DensalTM process (Bodycote, Haag-Winden, Germany) to significantly reduce the casting porosity compared to as-cast batch DC-1 and DC-2, named batch DC-3. Finally, cast batches DC-1 to DC-3 got a T6 heat treatment, i.e., solution treatment at 545 °C for 1 h. in an air-circulated furnace, water-quenched at room temperature, and artificially aged at 160 °C for 5 h Further details on the casting process are described in Tenkamp et al. [26].
The chemical composition was analyzed by means of spark emission spectroscopy and is shown in Table 1. Samples for microstructural characterization were cold-embedded, ground, and polished to a grit size of 0.3 µm using oxide polishing suspension (OPS with colloidal SiO2). The secondary dendrite arm spacing (SDAS) was determined by a linear intercept method based on a minimum of ten dendrites at 50× magnification. Si particle morphology (e.g., size, shape) within the interdendritic Al-Si eutectic has been quantified by binary greyscale analysis with image processing program ImageJ (Open source software) on micrographs with 500× magnification on a minimum of five micrographs. Hereby, mean values of area, major and minor dimension, as well as sphericity of Si particles, were determined for each batch. The 2-dimensional sphericity Ψ 2 D was determined by the following equation
Ψ 2 D = P c i r c l e ( A = A r e a l ) P r e a l = 2 · π · A r e a l P r e a l
Using area Areal and perimeter Preal. The sphericity takes values between 0 and 1, whereby 0 is attributed to an elongated ellipse and 1 to an ideal spherical particle. For each cast alloy batch, more than 1000 Si particles were analyzed to determine representative values. Afterward, the grain size was determined in Barker etched micrographs and quantified by the linear intercept method under polarized light using a stereoscopic light microscope Zeiss Imager M1m (Carl Zeiss Microscopy, Jena, Germany).
Hardness measurements were performed on Wolpert Dia-Testor 2 RC (Wilson Wolpert Instruments, Aachen, Germany) using a force of 98.07 N (HV10) with a minimum of five indentations.

2.2. Additive Manufactured Aluminum Alloy

The additively manufactured (AM) specimens were processed on an SLM solutions SLM 250 HL with manufacturer recommended L-PBF process parameter with a 400 W fiber laser in the vertical direction. The base plate was heated up to 200 °C, and SLM-AutoFabCAM software (SLM Solutions, Luebeck, Germany) was integrated into the machine system. Melt pools were shielded by Argon gas in the build chamber, where scanning followed the so-called chessboard strategy. SLM-AutoFabCAM is the laser vector orientation software, which, e.g., controls energy changes locally and avoid over melting at a location where the direction changes by 180°. It consisted of contour solidification followed by island hatches. Contour hatches were perpendicular to each other while the vector orientation plane was rotated by 79° per layer.
Cuboids were manufactured according to the above-mentioned strategy to be cold-embedded and then ground and polished to a final grit size of 0.3 µm, at which point OPS was applied. The sections were studied in the scanning electron microscope (SEM) Tescan Mira XMU (Tescan, Brno, Czech Republic), which is equipped with an EDAX detector for composition analysis by energy-dispersive X-ray (EDX/EDS).

2.3. Computed Tomography

Computed tomography (CT) investigations were carried out with Nikon XT H 160 (Nikon Metrology, Alzenau, Germany) to quantify the statistical and 3-dimensional distribution of process-induced porosity in the region of gage length. The CT system is equipped with a 160 kV/60 W micro-focus X-ray tube. In DC investigations’ voxel sizes of approx. 11.5 µm were used together with the following CT parameters: 130 kV, tube current 60 µA, exposure time 354 ms, 1583 projections, and 8-fold superimposition. For AM alloy voxel sizes of approx. 7 µm were used with comparable CT parameters [36]. The pore size was quantified by the square root of the projected area perpendicular to the load direction, according to Murakami et al. [32,33]. The 3-dimensional sphericity Ψ 3 D was determined by the following equation according to Wadell [37]:
Ψ 3 D = S s p h e r e ( V = V r e a l ) S r e a l = π · ( 6 · V r e a l ) 2 3 S r e a l
using the real volume V r e a l and surface area S r e a l of each pore to calculate the ratio between the surface area of an ideal spherical pore with the same volume as the real pore ( S s p h e r e ) and the surface area of the real pore ( S r e a l ). The 3-dimensional sphericity takes values between 0 and 1, whereby 0 is attributed to an elongated, needle-like ellipsoid and 1 to an ideal sphere.

2.4. Quasi-Static Testing

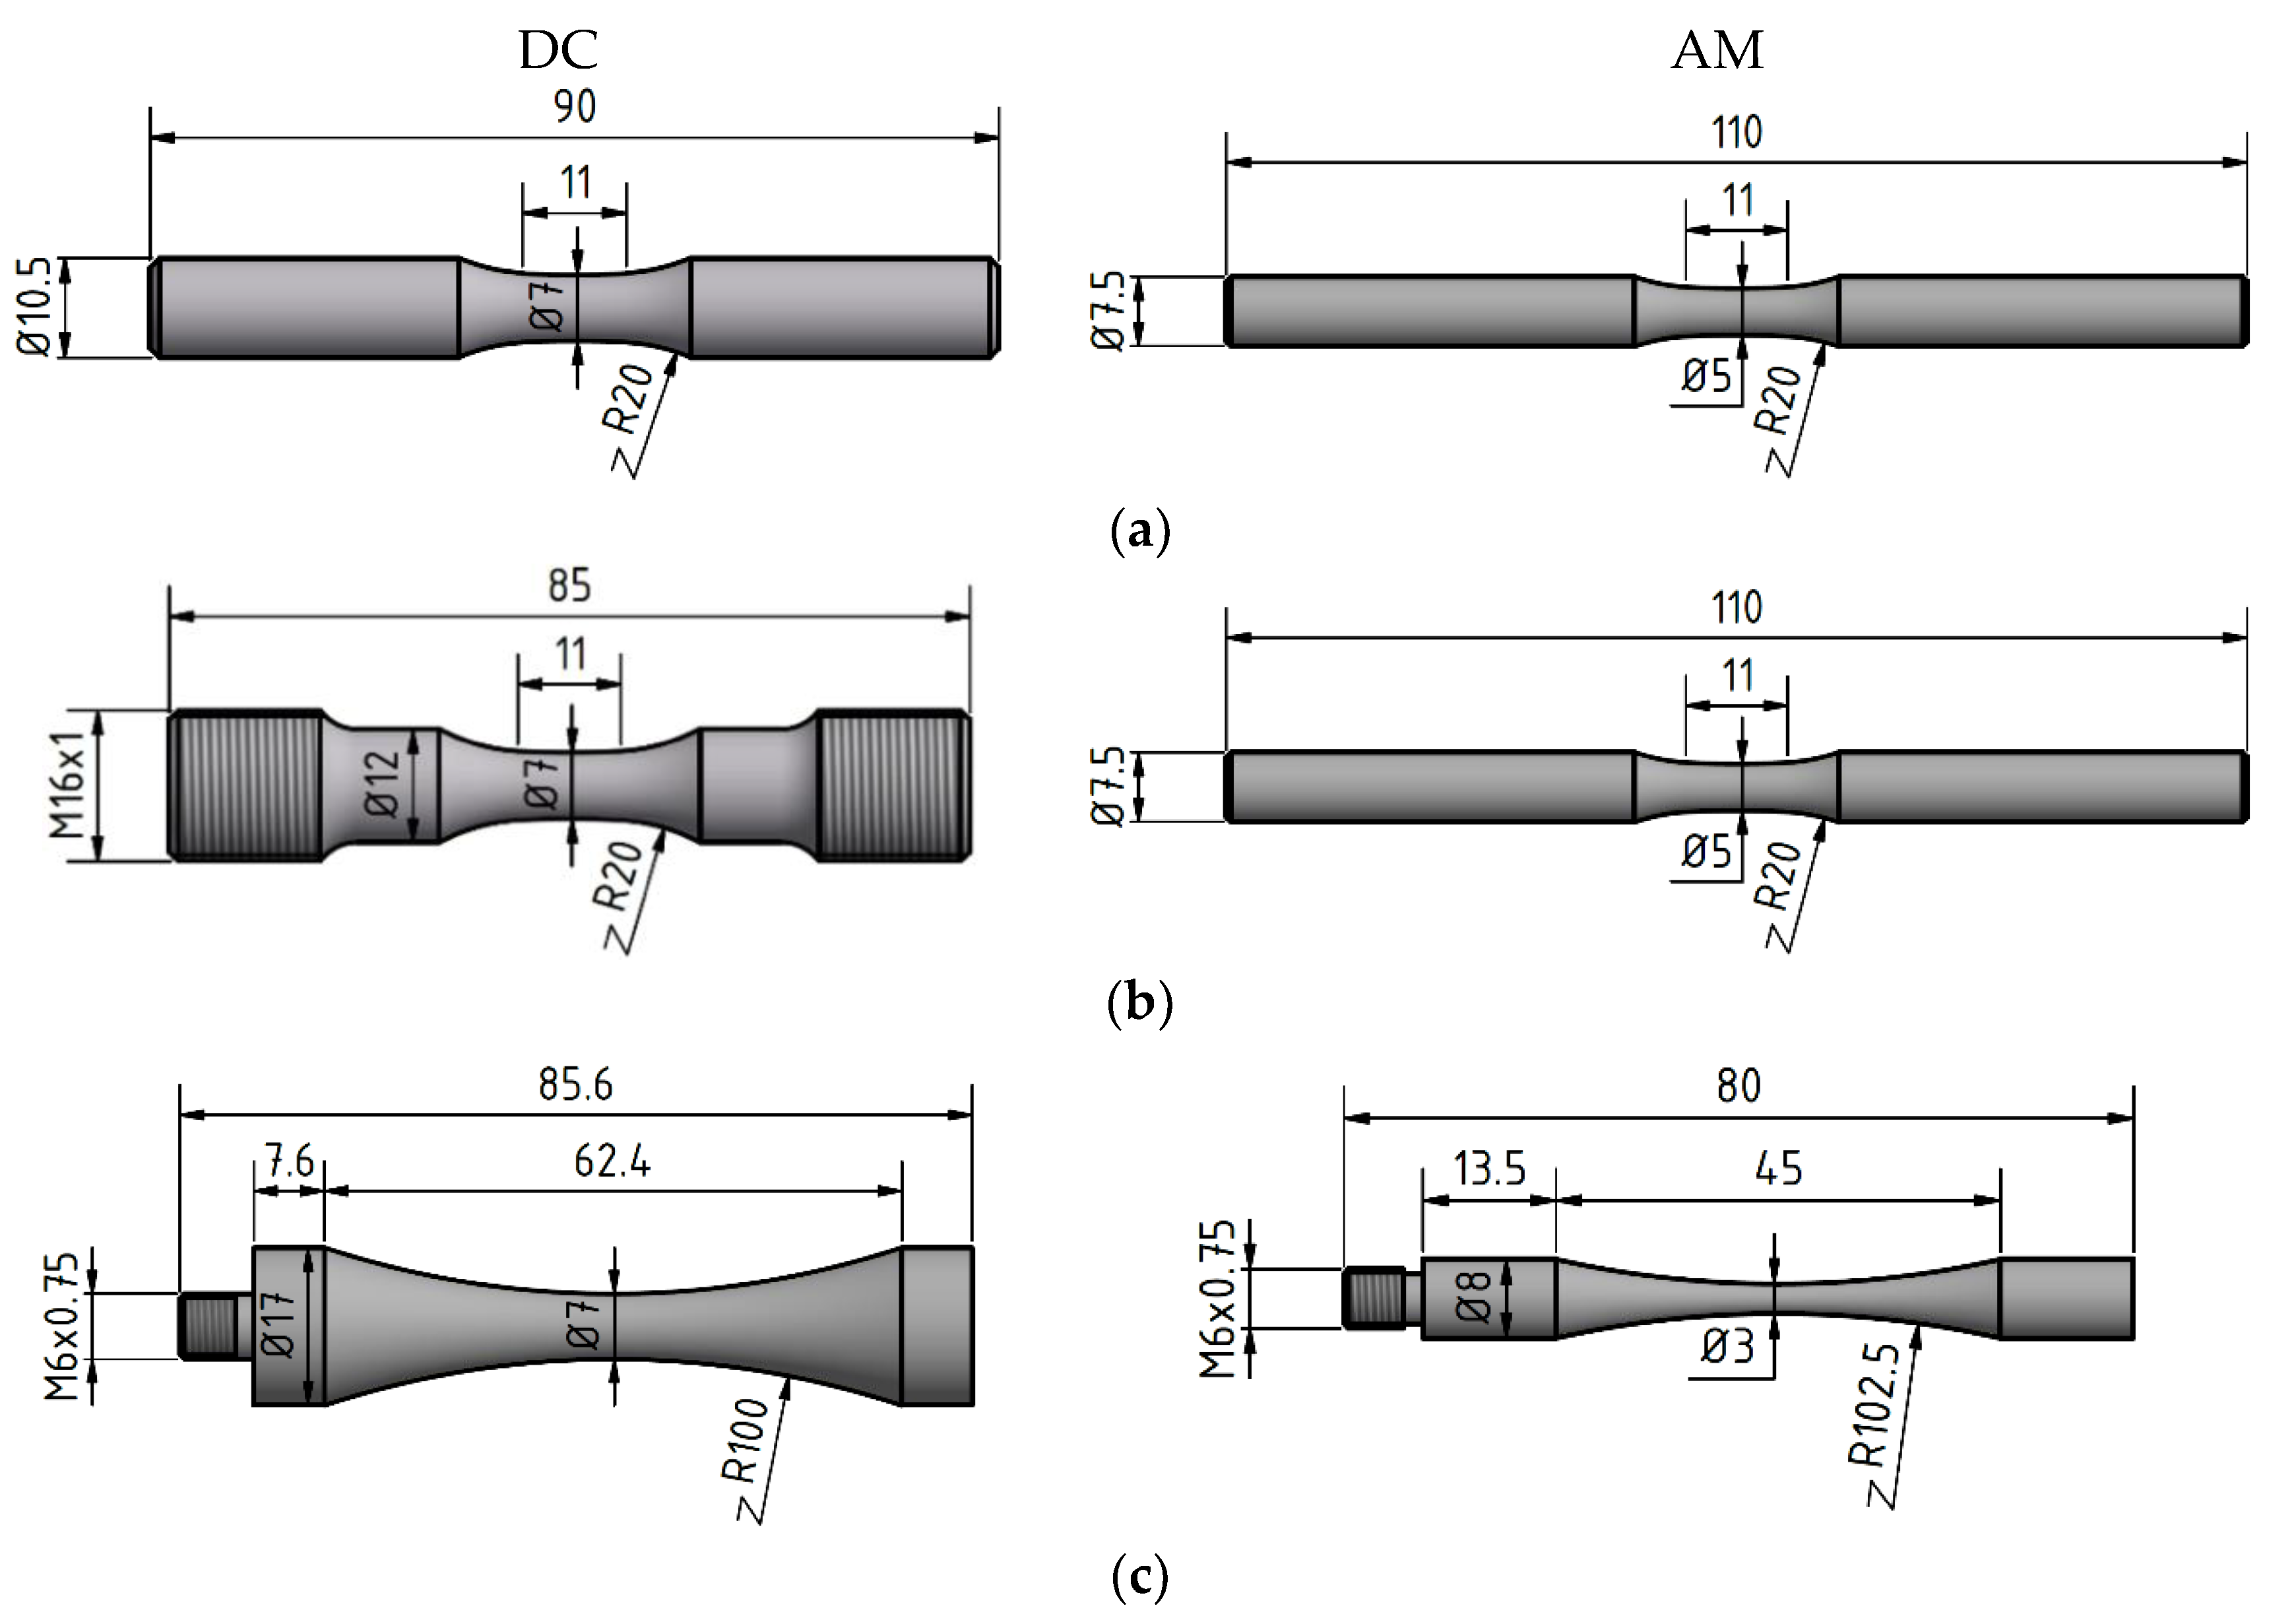
The monotonic stress-strain behavior was characterized by quasi-static tensile tests using servo-hydraulic testing machines Schenck PC63M (DC alloy) and Instron 8872 (AM alloy). For both alloys, the strain was measured using tactile extensometer with a gauge length of 10 mm. Cast alloys were tested strain-controlled at a strain rate of 0.07·10−3/s (elastic region) and 0.25·10−3/s (elastic-plastic region) according to DIN 6892-1. Tensile tests for AM alloys were performed at a displacement rate of 1 mm/min. The specimen geometries for DC and AM alloy are shown in Figure 3a.

2.5. Fatigue Testing

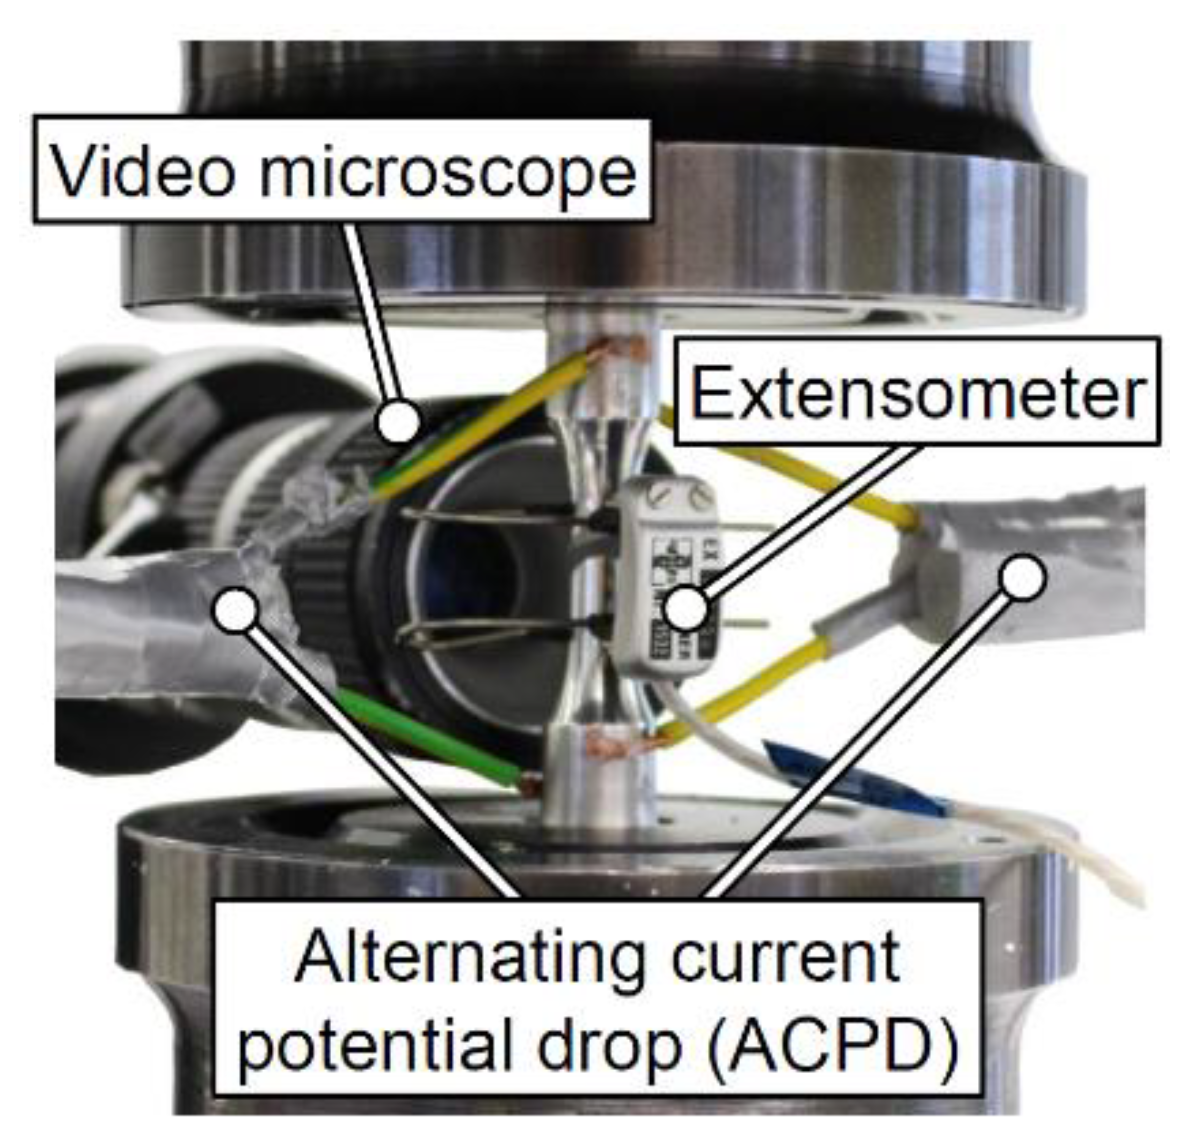
The fatigue behavior was characterized in HCF and VHCF tests at room temperature. For DC alloy, HCF tests were carried out on resonant testing system Rumul Testronic (Russenberger Pruefmaschinen AG, Neuhausen am Rheinfall, Schwitzerland) with a 20 kN load cell at a frequency of f = 70 ± 5 Hz. The HCF tests were performed stress-controlled with a load ratio of R = −1 (fully-reversed loading) at various constant stress amplitudes σa between 100 and 260 MPa. The fatigue progresses, and mechanisms are monitored by stress-strain hysteresis analysis (extensometer), alternating current potential drop (ACPD), and video microscopy (Figure 4). The number of cycles to crack initiation was defined as a drop in the resonant frequency of 0.005 Hz for each DC batch to separate between fatigue crack initiation and propagation lifetime. For AM alloy, HCF tests were performed on a servo-hydraulic testing system Instron 8872 with a 10 kN load cell at f = 20 Hz and R = −1.
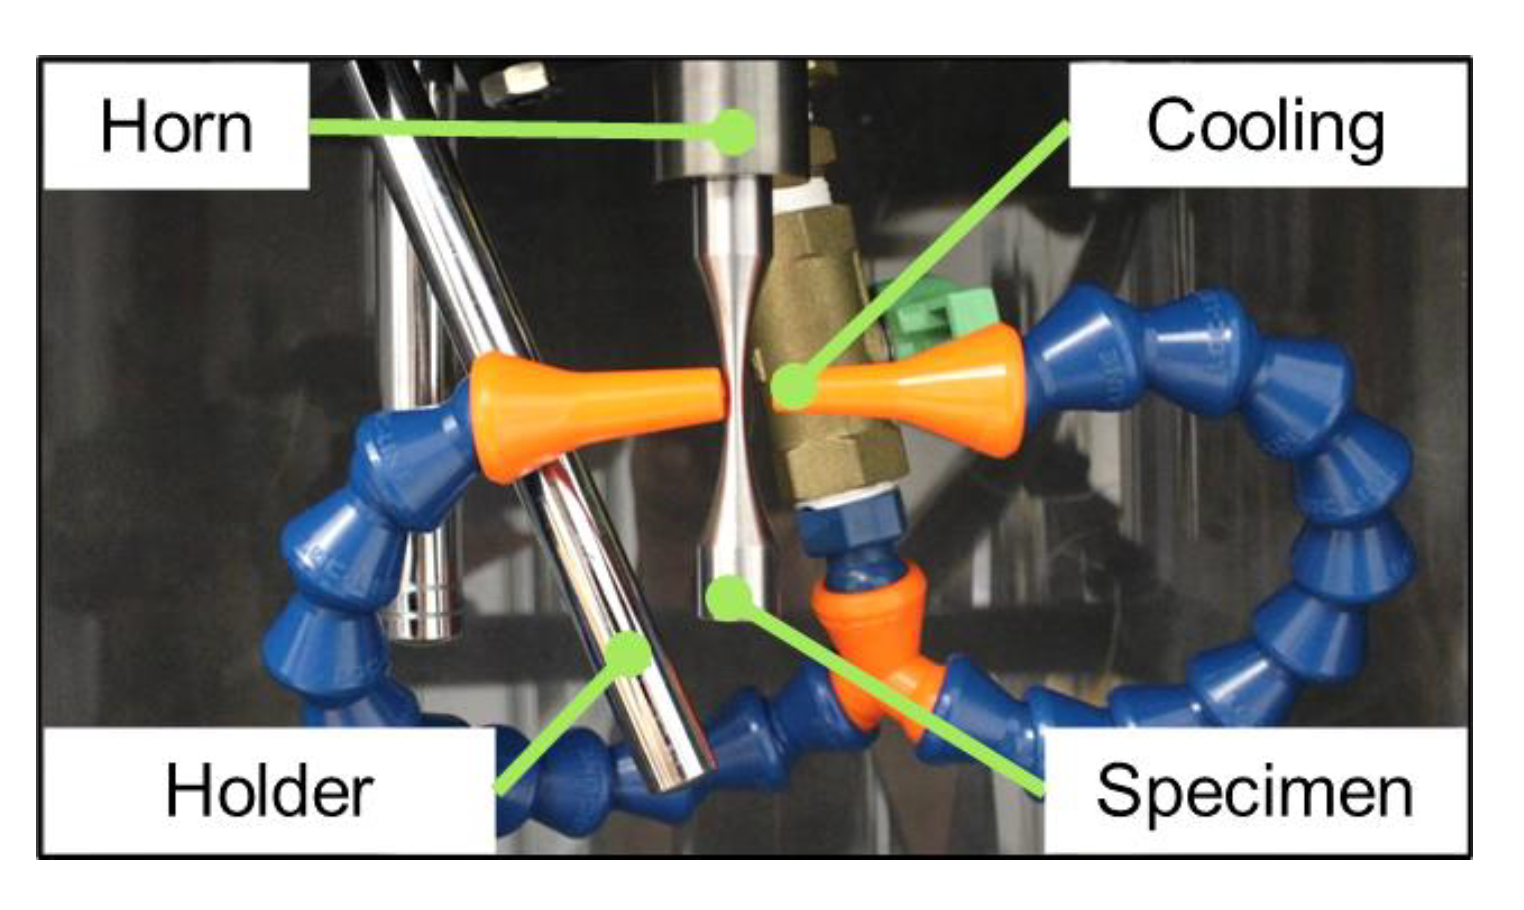
For the VHCF tests, an ultrasonic testing system Shimadzu USF-2000A (Shimadzu, Duisburg, Germany) has been used (Figure 5). In this USF system, the mechanical oscillation is applied to a piezoelectric crystal, which converts a sinusoidal (f ≈ 20.0 ± 0.5 kHz) electric power generated by a frequency generator and amplifier into a mechanical oscillation. The oscillation is amplified in its amplitude by a titanium horn and axially transferred into the screwed-in fatigue specimen. The specimen is loaded by a cyclic push-pull loading at a stress ratio of R = −1 in the gauge length. The test frequency of the fatigue specimen is monitored during the fatigue test as it changes due to crack formation and growth as well as cyclic hardening or softening. A defined drop of test frequency serves as a shut-off criterion for the ultrasonic fatigue system.
When damage in the form of cracks accumulates, the machine, which runs at specific displacement amplitude, detects a deviation in frequency due to damping behavior. When the threshold value for frequency deviation is passed, a fracture is detected, and the test stops. This compares to analogous failure detection mechanisms in [39,40]. Specimen heating is avoided by the pneumatic air-cooling system and by performing the fatigue tests in pulse-pause mode (50:50), which reduces the effective test frequency to 10.0 kHz. The specimen geometries used for HCF and VHCF tests are shown in Figure 3b,c. The specimens were machined following DIN EN 6072:2011-06. With this, the gage sections were ground and polished up to 1 μm diamond paste.

2.6. Crack-Propagation Testing

Crack propagation specimens were manufactured and machined according to ISO 12108:2012, and tests were performed according to the same standard. For AM alloys, the test stress ratio and frequency were set to R = 0.1 and f = 20 Hz, respectively, while the test run was performed at a pulsating stress intensity factor. The tests were carried out on the servo-hydraulic testing system Instron 8801 with a 100 kN load cell. The crack length development was measured by crack opening displacement (COD) gage with a 5 mm gauge length and 2 mm travel. To capture the fatigue driven crack growth, a pre-cracking phase is carried out to detect the threshold region and Paris region. Comparable tests were performed on DC alloys using a resonant fatigue system Rumul Cracktronic (R = 0.1; f = 65 Hz). Further details can be found for AM alloys in [41] and for DC alloys in [26].

3. Results and Discussion

3.1. Microstructure

The chemical composition of DC and AM alloy are shown in Table 1. The microstructure analyses of grain size, secondary dendrite arm spacing (sDAS) for DC, and dendrite width for AM alloy, as well as Si particle analyses, are shown in Table 2. DC batches have a comparable grain and sDAS size, while the HIP treatment in DC-3 leads to some coarsening of Si particles compared to batch DC-2. All DC batches show high and comparable sphericity of Si particles due to the high solution annealing temperature in T6 heat treatment.
In the L-PBF process, it can be evident that the cooling rate, which is 104–107 K/s, leads to significant refinement of AlSi12 by two orders of magnitude. Furthermore, within AM batches, the application of stress relief heat treatment allowed further dendritic width growth in AM-2 due to more thermal energy to drive the segregation of Si particles from the Al matrix to the grain boundaries. Since the AM microstructure is significantly finer, the available microscopy equipment was not certain to produce highly accurate measurements for Si particles’ area, major and minor axes, and sphericity at such scale with significant scatter of dimensional morphology.

3.2. Defect Distribution

Based on CT scans, the relative density, the pore or defect size A , respectively, and its sphericity Ψ 3 D distribution was quantified. Figure 6a,b show the defect size and shape of the detected porosity within the specimens as well as the distribution of defect size within each batch. The relative density was determined to ρrel = 99.91% for batch DC-1, 99.83% for batch DC-2, and approx. 100.00% for batch DC-3. AM alloy had a relative density of 99.51% for AM-1 and 99.67% for AM-2. As-cast batches DC-1 and DC-2 show the largest pores with up to 600 µm. The porosity within the HIPed batch DC-3 is significantly reduced to a maximum size up to 60 µm including an increase in shape factor to more spherical pores. Batch AM-1 contains maximum pores of 160 µm with a more spherical shape than as-cast batches DC-1 and DC-2. The total defect density of AM-1 and AM-2 is approx. 51.6 and 43.5 pores per mm3, respectively, and much higher than cast batches DC-1, DC-2, and DC-3 with approx. 4.6, 7.1, and <0.1 pores per mm3, respectively, which increases the possibility of a large pore at AM specimen surface.

3.3. Monotonic Stress-Strain Properties

The monotonic stress-strain behavior for die-cast and additively manufactured alloys were determined by a minimum of three tensile tests for each batch. The properties are summarized in Table 3. Hereby, batch DC-3 (HIPed) has sufficiently increased yield and tensile strength as well as fracture strain compared to DC-1 and DC-2 (non-HIPed). These differences in strength and ductility can be attributed to the notch effect of large-volume porosity leading to significant plastic deformations at decreased stresses. Batch DC-1 and DC-2 have comparable values for strength and fracture strain, which means that nitrogen melt cleaning (batch DC-2) had no significant impact on tensile strength and fracture strain. AM alloys have a comparable hardness and Young’s modulus to DC alloys. The yield strength is in the same rage for “defective” DC batches DC-1 and DC-2, while DC-3 show a significantly increased yield and ultimate tensile strength. This can be related to increased porosity including large pore in DC-1 and DC-2 as the resulting stress concentration by large pores lead to the formation of plastic deformation at lower nominal stresses compared to DC-3, as shown by Weiler and Wood for porous magnesium alloys [42]. The ultimate tensile strength is significantly higher in AM alloys, which can be addressed to the Hall-Petch effect as the microstructure is finer by two orders of magnitude.

3.4. Fatigue Lifetime Behavior

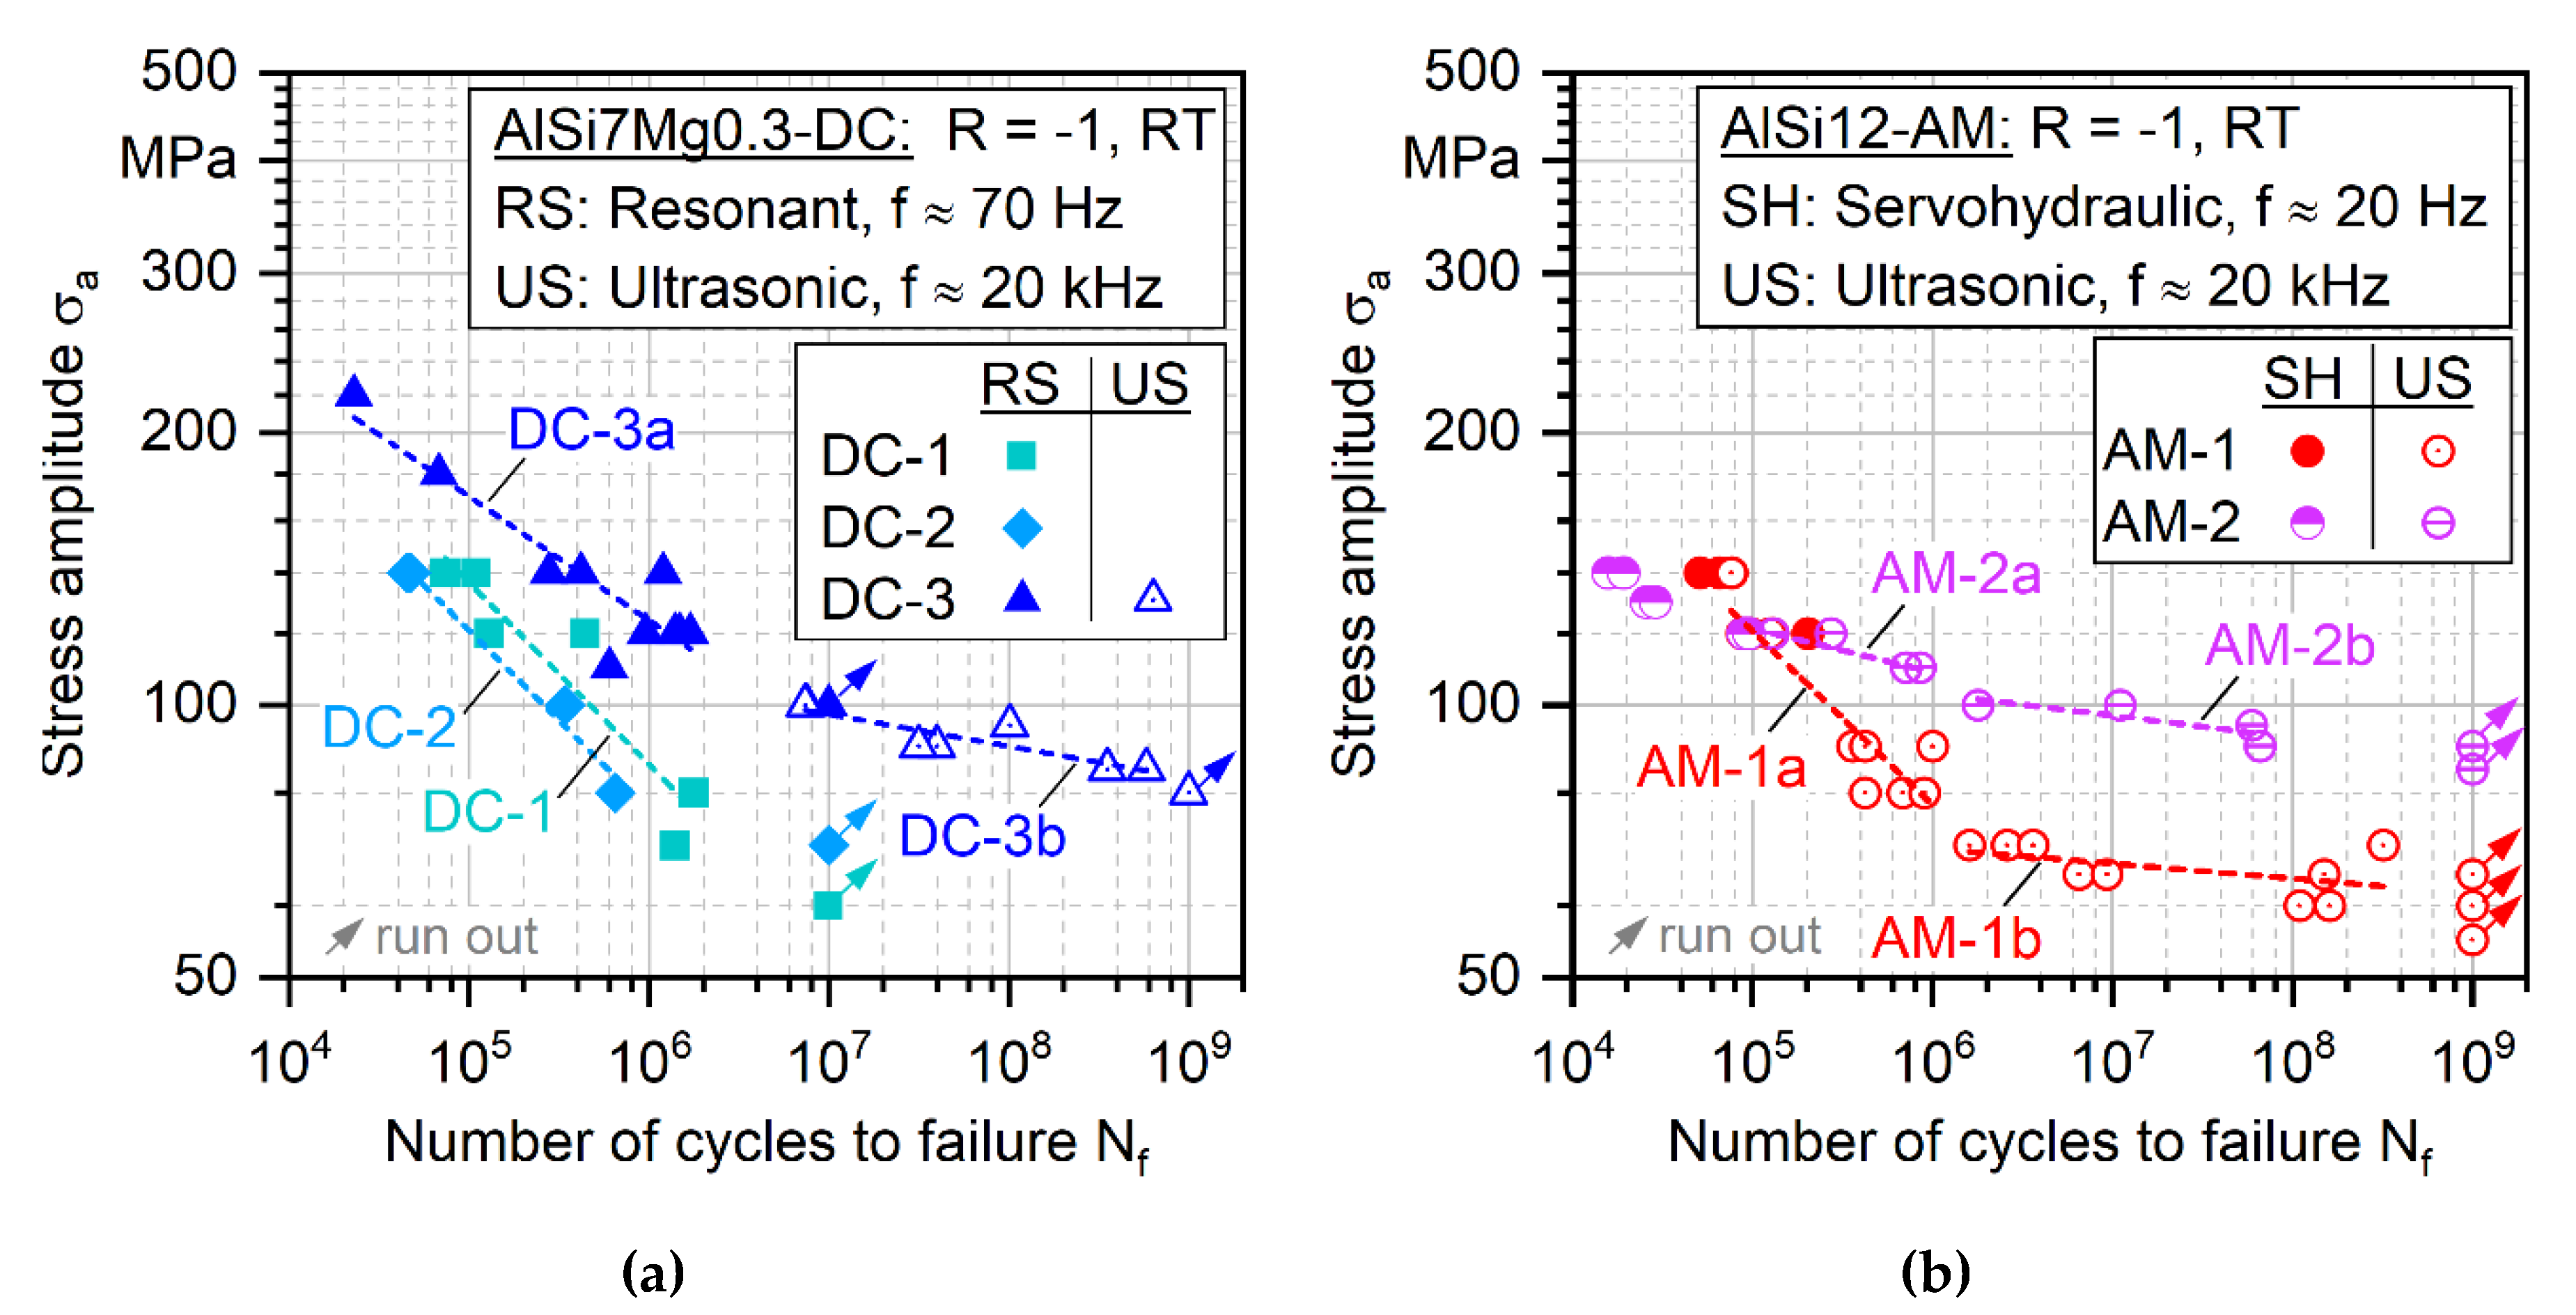
The results of fatigue experiments are plotted in Figure 7 as S-N (Woehler) curves for DC batches (Figure 7a) and AM batches (Figure 7b). The specific S-N curves are described by Basquin equation
σ a = σ f · ( N f ) b
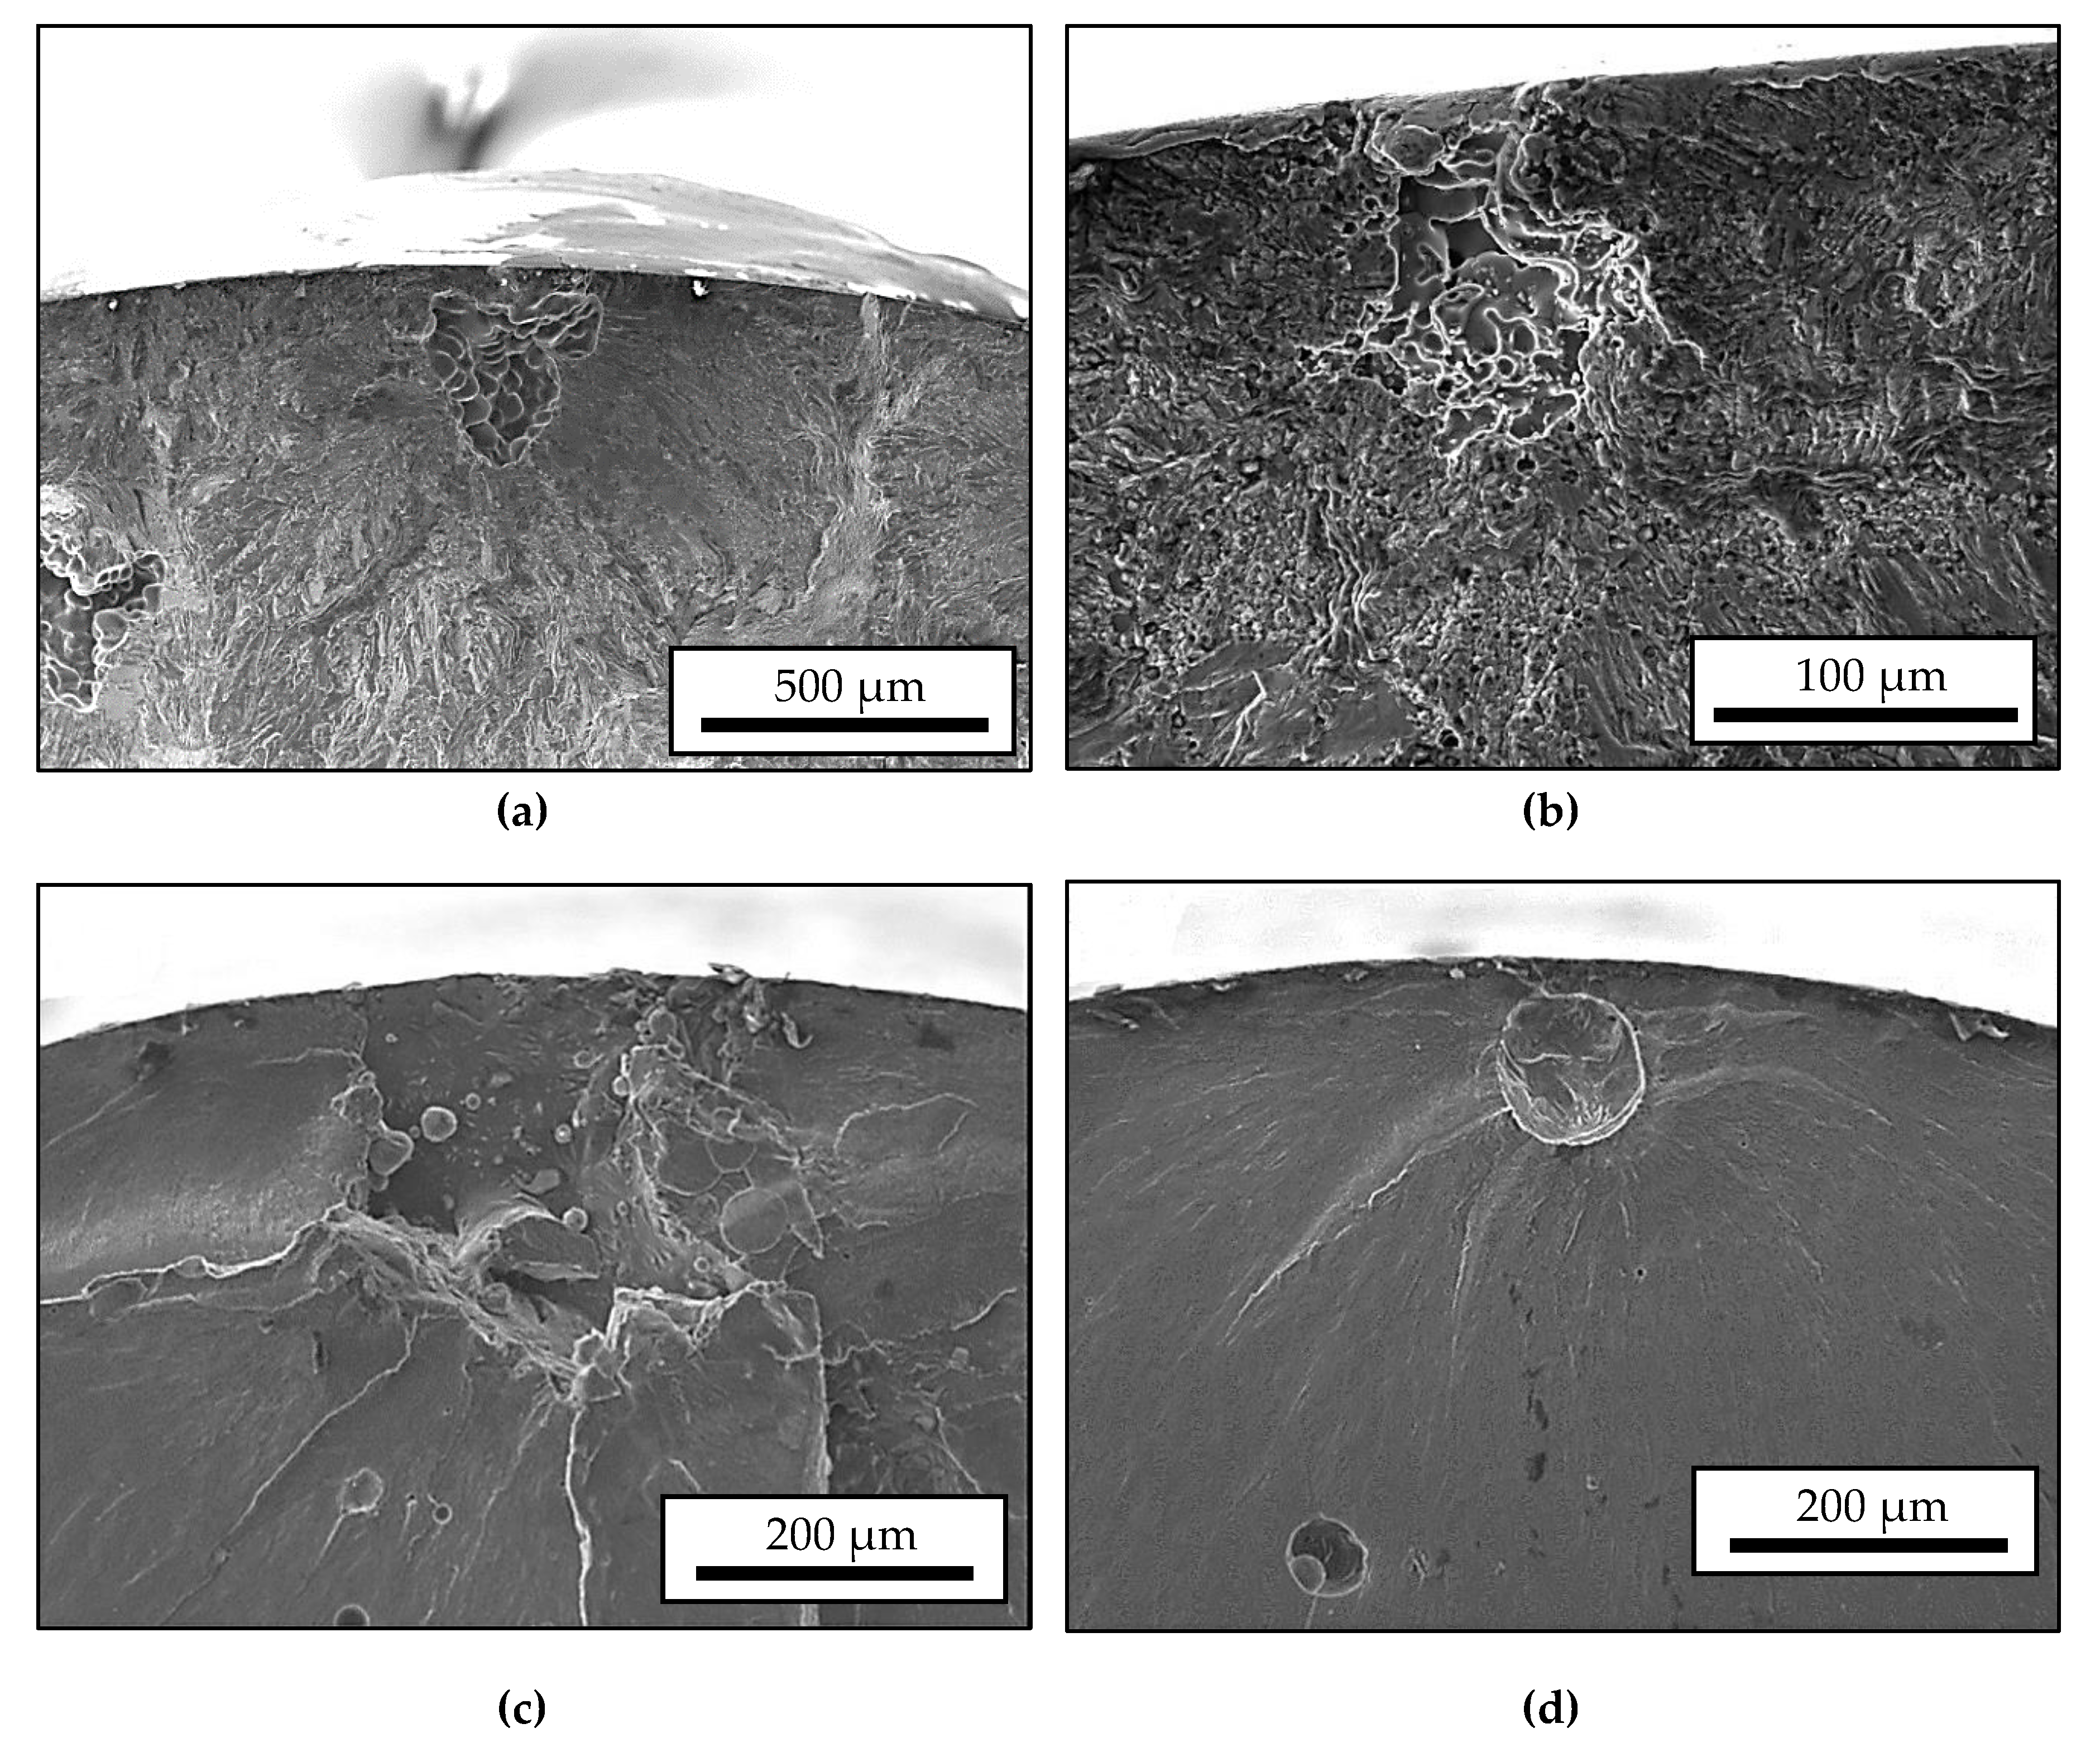
which were fitted by linear regression in log(S)-log(N)-diagram excluding run outs. The related parameters are plotted in Table 4. Batches DC-1 and DC-2 have a significantly reduced fatigue strength and lifetime compared to DC-3 due to the small porosity amount and the movement of large-volume pores. In Figure 8a,b crack-initiating pores are shown for batch DC-2 and DC-3. The reduced porosity in DC-3 leads to a fatigue lifetime magnification by a factor of around 5 (DC-1) to 9 (DC-2) at a stress amplitude of 140 MPa. In the HCF regime at the resonant testing machine, first, run outs at 1·107 are determined at 100 MPa for DC-3 as well as 70 MPa and 60 MPa for DC-2 and DC-1, respectively. Ultrasonic fatigue testing system determined at 100 MPa a lifetime of around 1·107 for DC-3. The S-N slope is significantly decreased in the VHCF regime compared to the HCF regime by a factor of 4. The first run out at 1E9 was determined at 80 MPa.
Batch AM-1 have a significantly reduced fatigue strength and lifetime compared to AM-2 due to the increased gas porosity amount with low sphericity that acts as internal micro notches. In Figure 8c,d crack-initiating pores are shown for batch AM-1. The defect size is three times larger with non-regular shape and internal notch morphology that leads to significantly less fatigue lifetime at a stress amplitude of 70 MPa in comparison to the fatigue lifetime of the same batch where the defect is spherical without crack-like shape. In the LCF regime, the fatigue strength difference is much less due to the interaction between porosity and microstructure. In other words, porosity is not the main influencing factor behind fatigue failure, such as in VHCF. It is rather the much finer microstructure of AM-1 in that resist plastification at crack tips and hinders propagation from a higher amount of porosity in comparison to AM-2. The finer microstructure of AM-1 resists fatigue crack initiation significantly higher, which leads to delayed fracture.
Based on fractographic SEM investigations, crack-initiating defects or pores, respectively, could be determined for selected specimens of each batch, and representative fractographic images are shown in Figure 8. In DC alloys, the fatigue crack initiated at surface and sub-surface pores. Figure 8a is a representative for DC-1 and DC-2, as crack initiated in botch batches from large-volume pores. The differences in the crack-initiating pore of 301 µm to 106 µm result in a change of fatigue lifetime of around factor 3 in the HCF regime. For batch AM-1, fatigue cracks initiate at surface and sub-surface pores comparable to DC batches, as shown in Figure 8c,d. In batch AM-1, a reduced defect size of 276 µm (Figure 8c) and 116 µm (Figure 8d) results in an increase of lifetime by more than factor 10 in HCF to VHCF regime.
Herewith, DC and AM alloy show significant sensitivity to the initial defect size, respectively, and the reason will be discussed later based on SIF–N curves and Kitagawa-Takahashi-diagram. No fatigue crack initiation from surface or sub-surface defects could be identified for batch AM-2, as remnant gas porosity is reduced, and the fatigue crack initiation resistance becomes more dependent on microstructure.
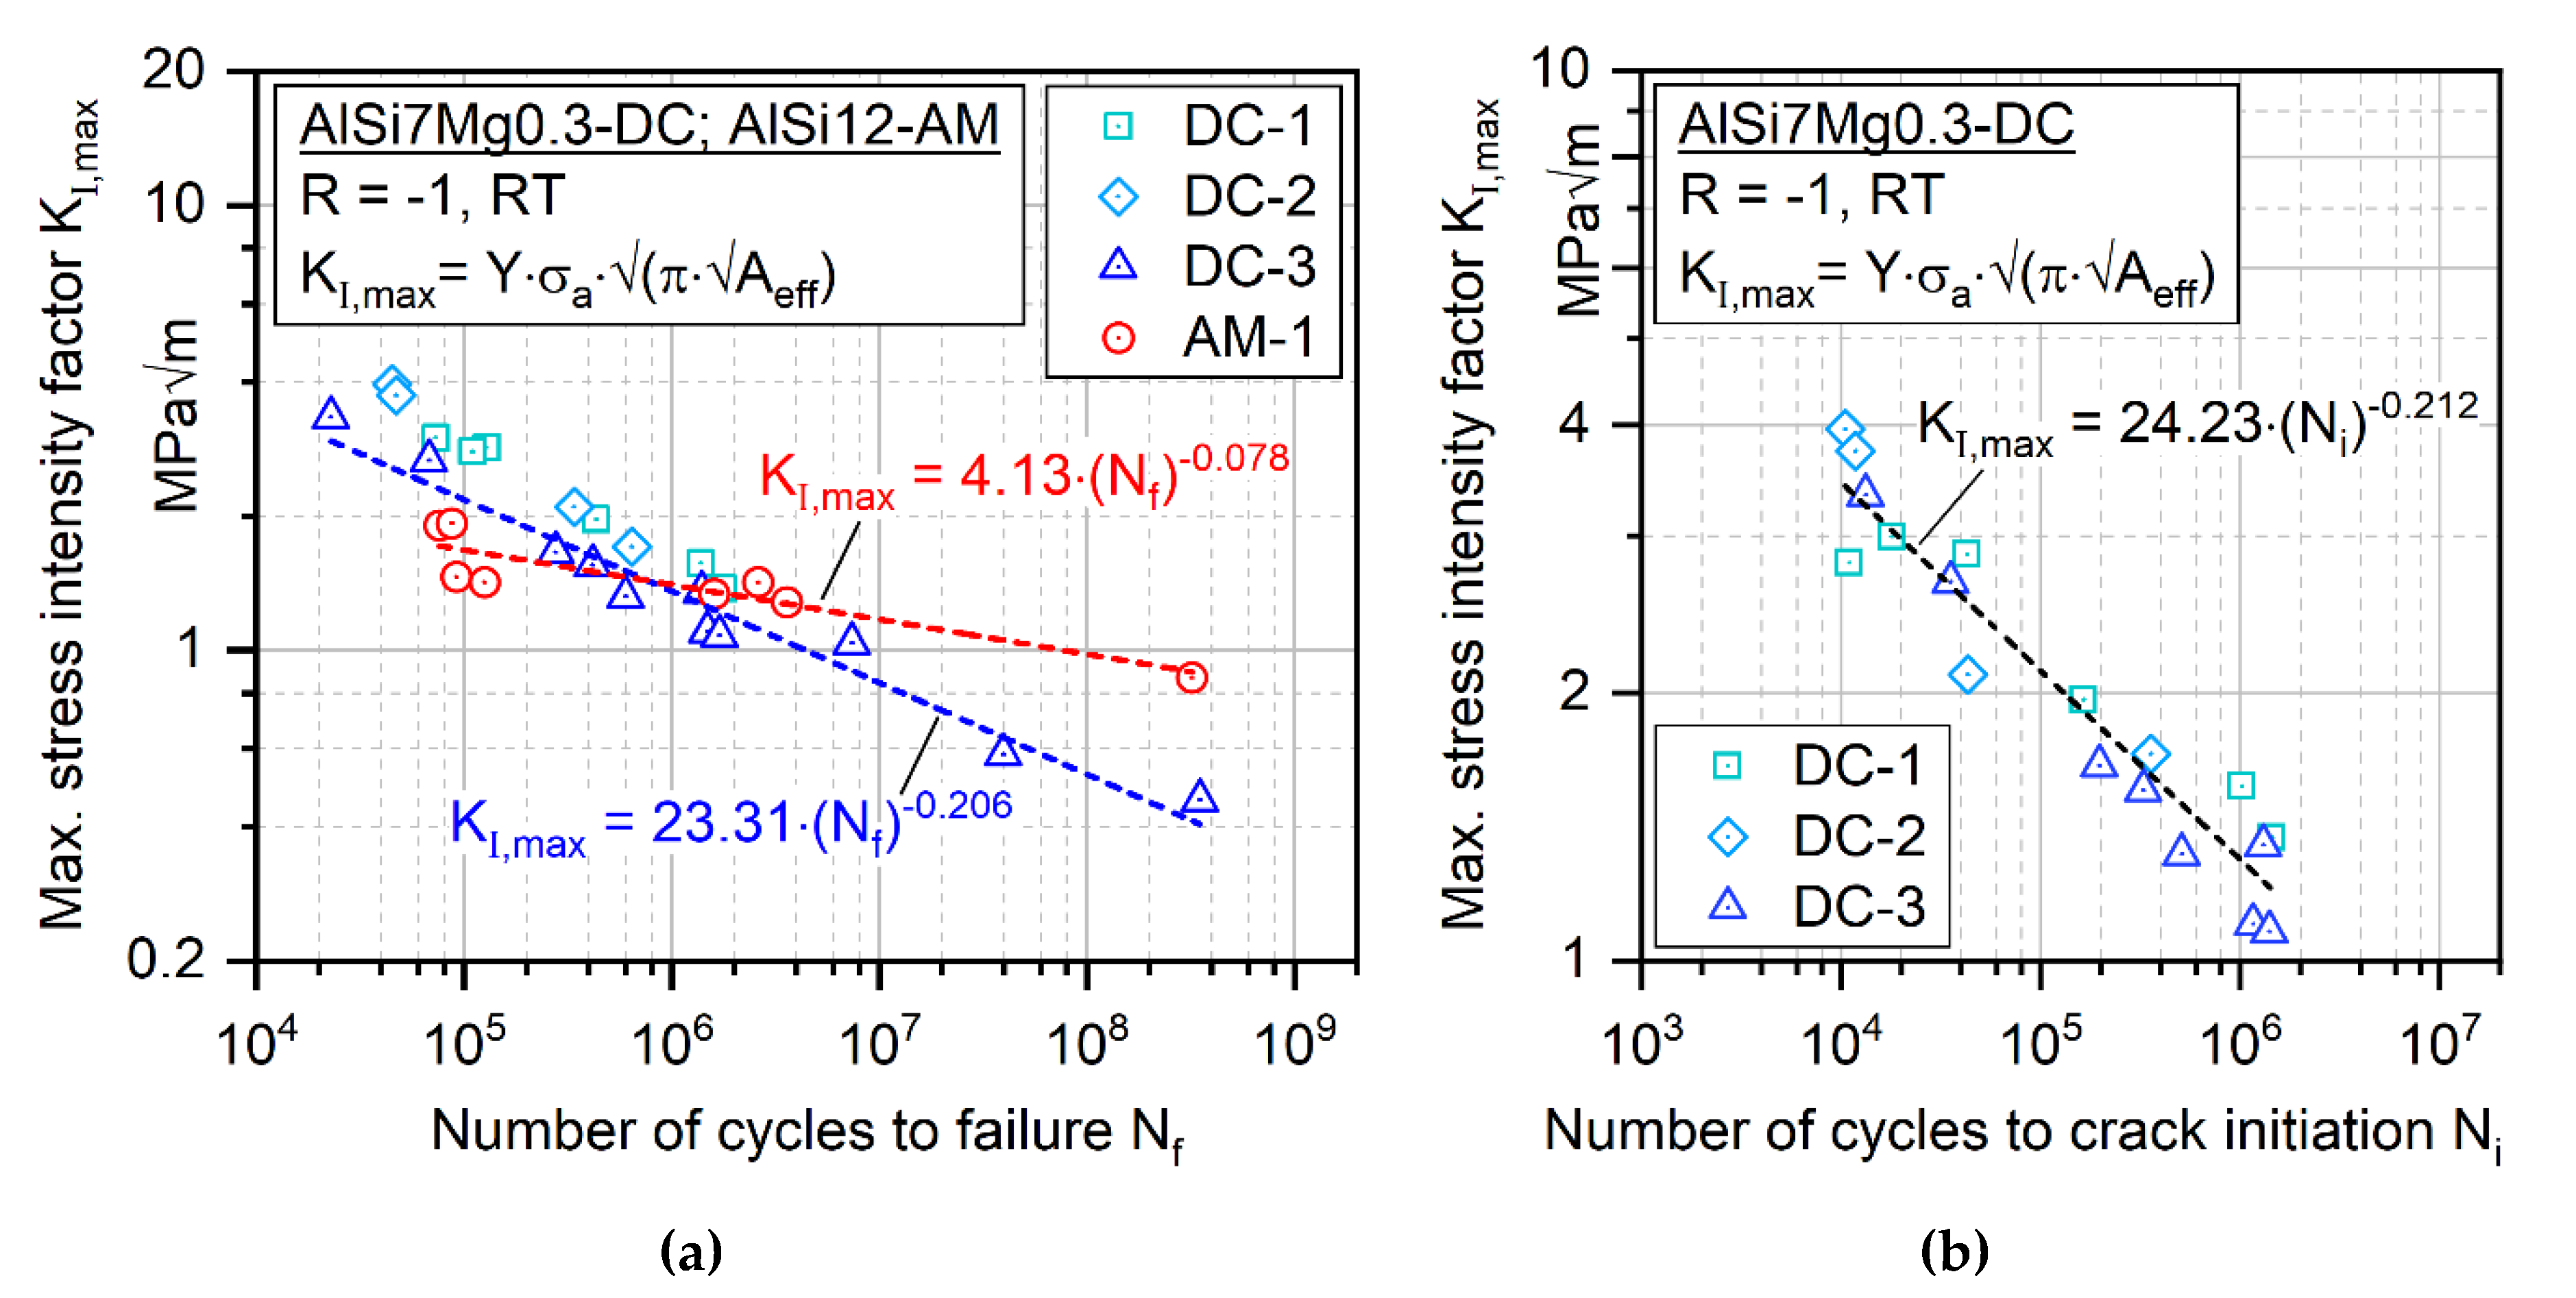
In Figure 9a, the SIF for each pore was determined based on stress amplitude ( σ a ) and effective defect size ( A e f f ) for a surface and sub-surface defect related to Murakami et al. [32,33] with a correction factor of 0.65 or 0.5, respectively, and plotted against fatigue lifetime (SIF-N diagram) for DC batches and AM-1. The stress intensity factor shows a very good correlation with fatigue lifetime for DC and AM alloy. DC batches show a comparable correlation between SIF and lifetime. Hereby, batches with larger porosity DC-1 and DC-2 show a slightly increased fatigue lifetime at a certain stress intensity factor level. In Figure 9b, the SIF is plotted against crack initiation lifetime for a specific drop in resonant frequency, as explained in Chapter 2.5. At this crack initiation criterion, a total crack area A of around 200 to 250 µm2 or crack length A of around 400 to 500 µm in the gauge, the volume can be estimated based on intermittent CT analysis by Tenkamp et al. [43] and includes related to Bang et al. [44,45] a large amount of short crack propagation lifetime specified for short cracks to a crack length less than 0.5 to 1.0 mm. The crack initiation lifetime correlates compared to total lifetime better to the crack-initiating SIF, as batches DC-1 and DC-2 show no longer an increased lifetime compared to DC-3. This means that the increased fatigue lifetime in Figure 9a can be related to the increased fatigue propagation for batches with large pores, as the nominal stress amplitude is significantly reduced at the same SIF level compared to batch DC-3 with small pores. Due to this, the local stress intensity factor could be determined as a defect-sensitive parameter for the fatigue crack initiation phase in DC aluminum alloys.
Through a comparison of the DC and AM alloy, AM-1 showed a different defect sensitivity, resulting in a decreased resistance in the LCF regime, a comparable resistance in the HCF regime around a fatigue lifetime of 106, and an increased resistance in the VHCF regime. The correlation between stress intensity factor and fatigue lifetime can be described by a power-law comparable to the Basquin equation, as shown in Figure 9a. The differences in defect sensitivity for DC and AM alloys led to a drop in the AM slope of around a factor 2.6. Here, the decreased slope of −0.078 fits well with the fatigue investigations of Shiozawa et al. [13] on the cast AlSi12CuNiMg alloy, where comparable curve parameters with a slope of −0.107 and a coefficient of 3.45 were determined in the SIF–N diagram. Therefore, the difference in slope could be related to the difference in chemical composition and the resulting reduction in ductility, as shown in Table 3 compared to DC-AlSi7Mg0.3. The reduced slope further underlines the increased defect sensitivity of the AM alloy compared to the DC alloy and the increased dependence of lifetime on the initial defect size for the AM alloy (Figure 8c,d, factor 10) compared to the DC alloy (Figure 8a,b, factor 3). To summarize, it is interesting that no drop in the slope from HCF to the VHCF regime could be determined for both alloys and processing routes in the SIF–N diagram, which would dramatically simplify the fatigue design of defective components in application.

3.5. Kitagawa–Takahashi diagram

For each batch, the threshold of SIF range K t h , R 0.1 for R = 0.1, and the slope m of the Paris’ equation was experimentally determined in crack propagation tests, as shown in Table 5. The threshold of SIF range K t h , R 1 for R = −1 was converted based on K t h , R 0.1 by the following equation [46]:
Δ K t h , R = Δ K t h , R 0 · 1 R m
The “defective” fatigue limit ( Δ σ 0 ) was used with Equation (7) to determine the “defective” intrinsic crack length a 0 . Afterward, the mean value of crack-initiating defect sizes around the fatigue limit was calculated for each batch A e f f , i and used by the following modification of Equation (8) to determine the intrinsic crack length a 0 of the specific batch:
a 0 = a 0 Y 2 · A e f f , i
By comparison the intrinsic crack lengths a 0 with a 0 , it can be resumed that a 0 has a strong dependence on porosity while a 0 is negligibly affected by porosity. As a 0 is a material constant, it should only be affected by microstructure such as SDAS, Si eutectic, and intermetallic phases, but are not affected by porosity or other defects. As these restrictions fit for DC batches 1 to 3 with a mean intrinsic crack length a 0 of approx. 258 ± 16 µm (approx. ± 6%), Equation (13) could be validated for the determination of the intrinsic crack length a 0 for “defective” and “defect-free” materials. For the AM alloy, the reduction in a 0 is characteristic of finer microstructures. For all batches and process routes, a mean intrinsic crack length a 0 of approx. 234 ± 36 µm (approx. ± 15%) could be determined.
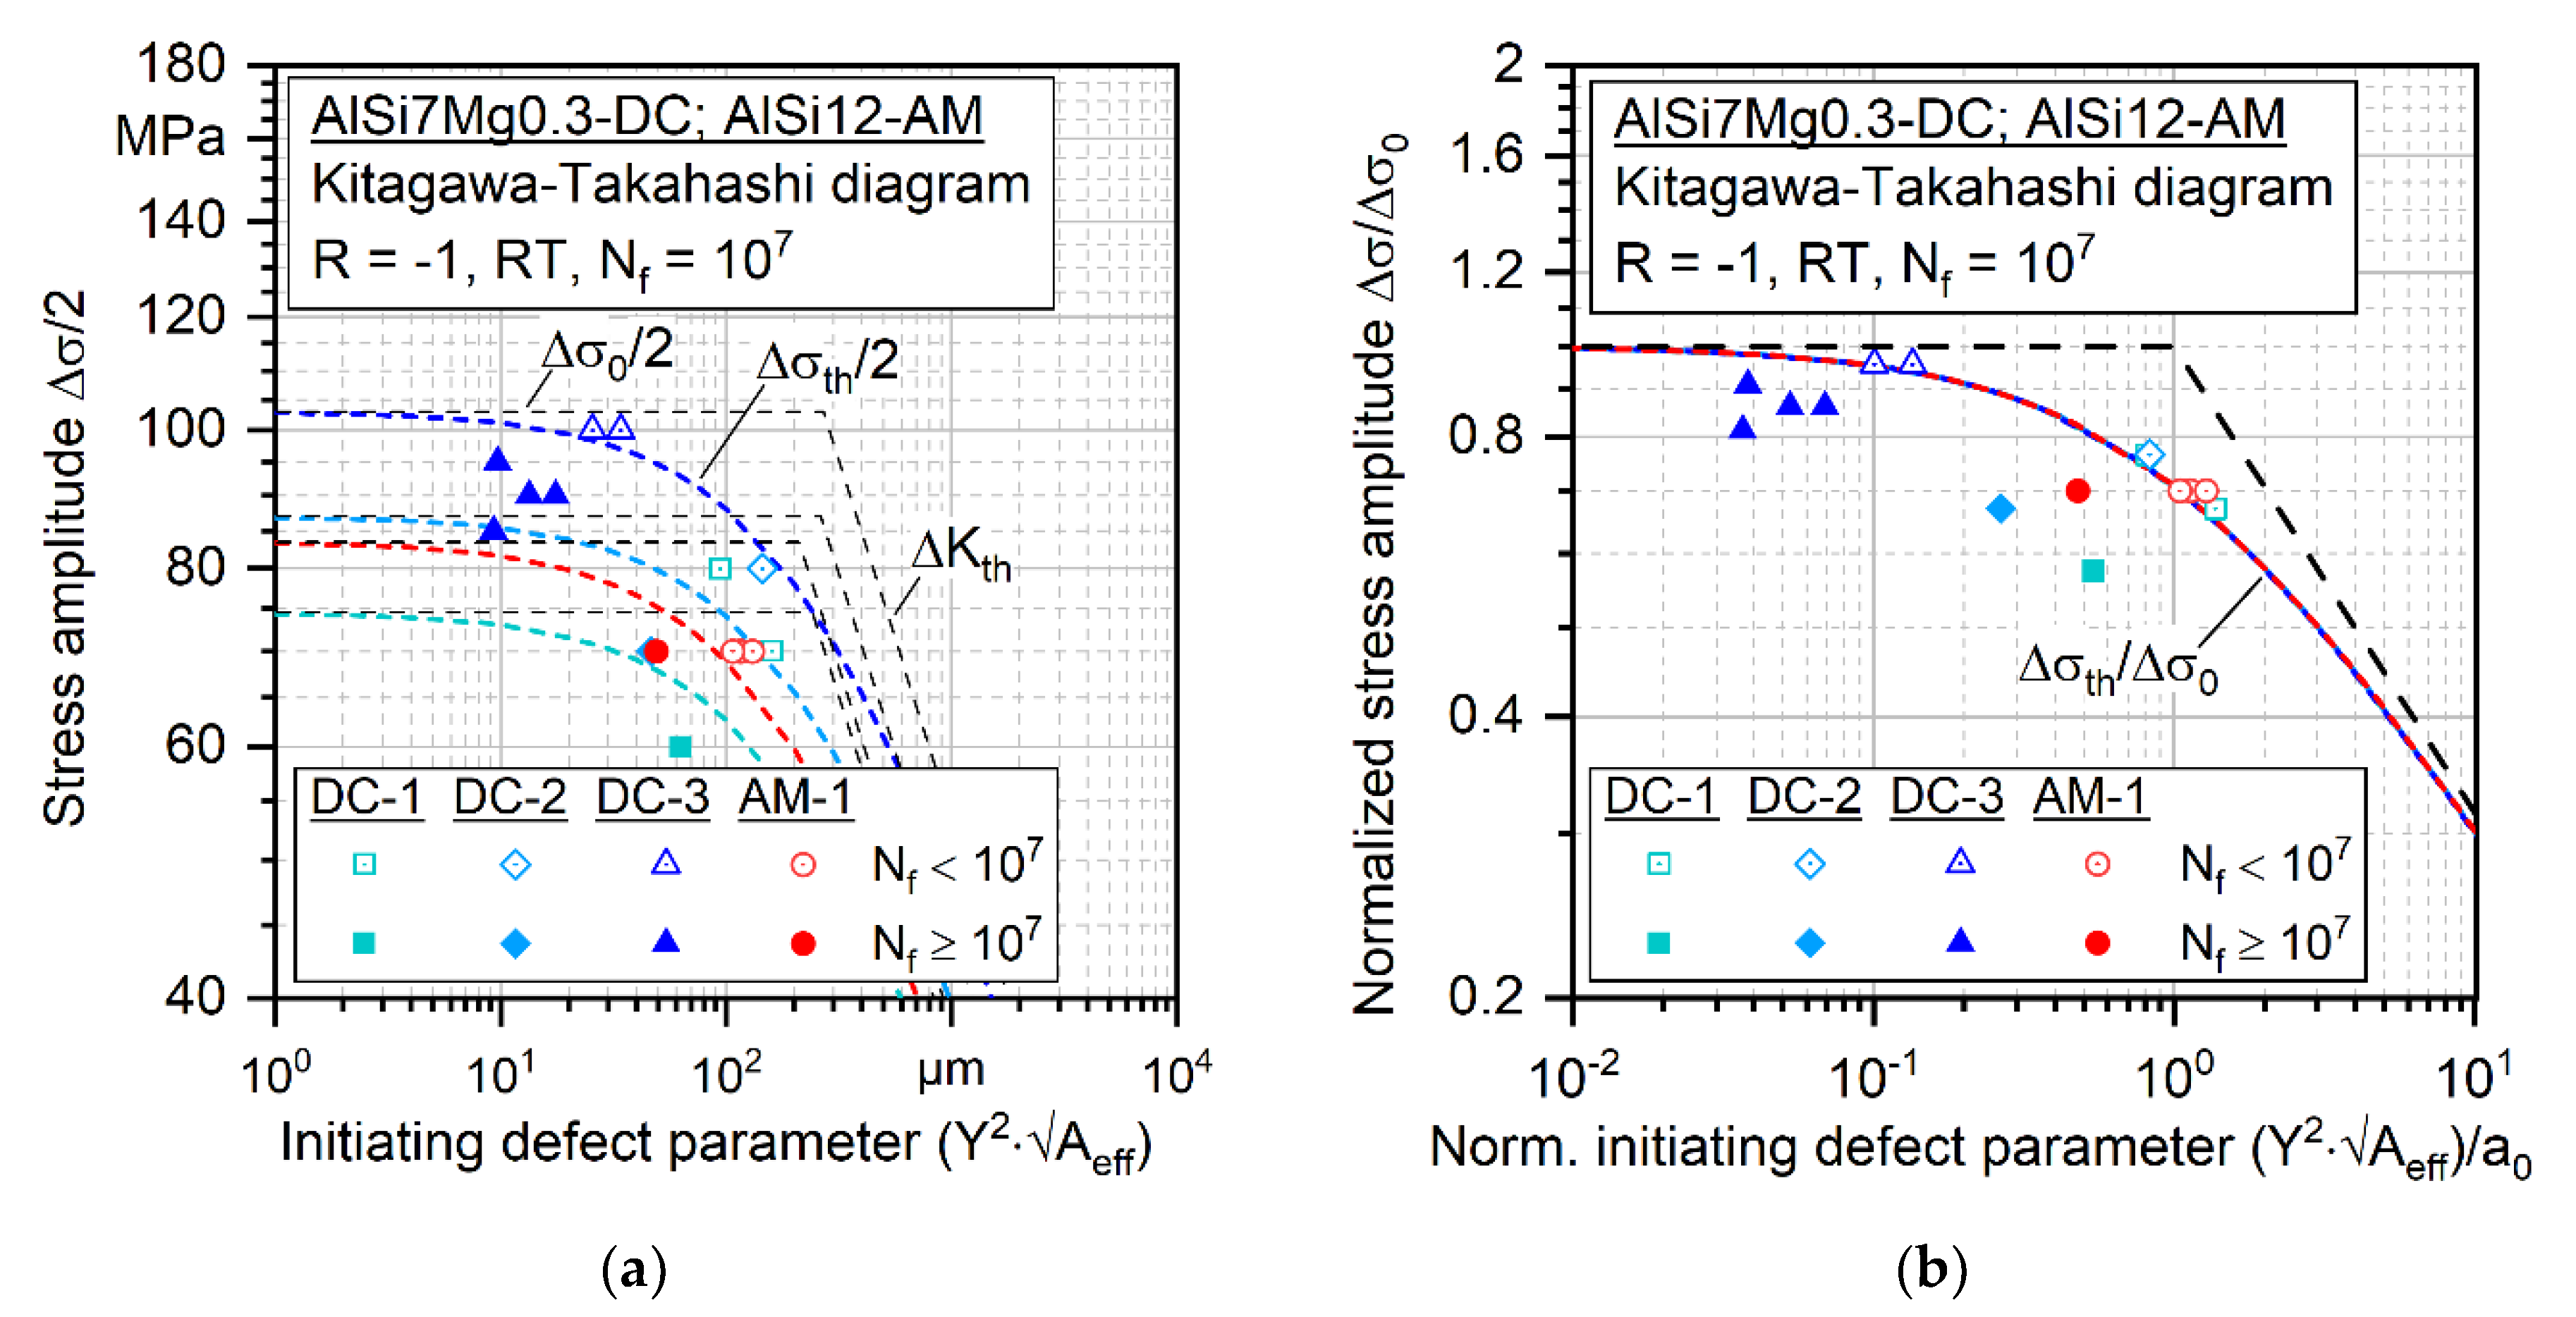
The values for intrinsic fatigue limit and crack length as well as the threshold of SIF range for R = −1 were further used to generate Kitagawa–Takahashi diagrams in Figure 10a,b. In Figure 10a, the fractured specimens before 107 cycles were plotted for DC batches and AM-1 with their defect parameter Y 2 · A e f f and stress amplitude σ a against the calculated El Haddad lines based on Equation (6). The defect size of run out specimens ( N f ≥ 107) were estimated based on the determined SIF–N curves in Figure 8b and plotted as “run out” together with specimens with a lifetime N f lower than 107. Each fractured specimen lay above or on the El Haddad lines, while the run out specimens are below. This underlines that the El Haddad equations are capable of differentiation between the fractured and run out specimens in the HCF regime. Finally, all fatigue datasets were plotted in a normalized Kitagawa–Takahashi diagram in Figure 10b, illustrating the high accuracy for determining the fatigue limit at 107 for specific defect parameters as well as the independence on the process route of the aluminum alloy. In comparison to the fracture mechanics-based approach presented here, a plasticity-based approach that simulates stress build-up around the real pore morphology was published in [47].

4. Summary and Outlook

The effect of process-induced porosity on the fatigue lifetime and limit was investigated for die-cast (DC) alloy AlSi7Mg0.3 and additively manufactured (AM) alloy AlSi12. Porosity resulted in a decreased fatigue lifetime in the HCF and VHCF regime by a factor of 3 to 10. By determination of the local stress intensity factor (SIF) at the crack-initiating pore according to the Murakami concept, a SIF–N diagram can be determined, which shows that the pore size and fatigue stress can be correlated to fatigue lifetime by using the local stress intensity factor. The effect of batch-specific porosity condition is hereby negligible, and the relationship between SIF and the fatigue crack initiation lifetime can be estimated by one SIF–N curve for material with local variation in porosity. The relationship between porosity and fatigue limit can be plotted in the Kitagawa–Takahashi diagram by using El Haddad intrinsic crack length a 0 . For DC and AM aluminum alloys, the defect-specific fatigue limit can be determined accurately and validated by selected fractographic investigations. The mechanical fracture assessment of defects in die-cast and additively manufactured aluminum–silicon alloys enables a reliable fatigue lifetime and limit estimation for coarse cast and fine AM microstructures by taking the specific pore distributions into account. Through this, variations in process and component geometries, which both significantly affect the local porosity due to changes in solidification and cooling rates, can be directly considered by local stress intensity factor. Finally, SIF-based fatigue design can derive synthetic S–N curves for specific pore dimensions as well as component S–N curves based on local porosity and loading profiles.
To further separate the effect of porosity on the fatigue crack initiation and propagation progress, crack initiation lifetime will be determined for AM-AlSi12 alloy to quantify the impact of crack initiation, and vice versa, crack propagation on the fatigue lifetime in HCF and VHCF regime comparable to the DC-AlSi7Mg0.3 alloy. Moreover, VHCF tests on the die-cast alloy AlSi7Mg0.3 without HIP treatment will be performed to further evaluate that there is one major SIF–N relationship from the HCF to the VHCF regime independently of initial pore or defect size, respectively.

Author Contributions

Conceptualization, methodology, J.T., M.A., and F.W.; Validation, J.T., M.A., S.S., and F.W.; Investigation, J.T., S.S., and M.A.; Resources, F.W.; Writing—original draft preparation, J.T., M.A., and F.W.; Writing—review and editing, M.A., S.S., P.S., and F.W.; Visualization, J.T., M.A., and S.S.; Supervision, F.W.; Project administration, J.T., M.A., and S.S.; Funding acquisition, F.W. All authors have read and agreed to the published version of the manuscript.

Funding

The authors thank the German Research Foundation (Deutsche Forschungsgemeinschaft, DFG) for its financial support within the research project “Identification and modeling of damage mechanisms in Al–Si–Mg cast alloys during HCF and VHCF” (WA 1672/15-2) and “Mechanism-based understanding of functional grading focused on fatigue behavior of additively processed Ti–6Al–4V and Al–12Si alloys” (WA 1672/25-1).

Acknowledgments

The authors would like to express their special thanks to Ohm & Haener Metallwerk GmbH for supplying the AlSi7Mg0.3 base alloy and Bodycote GmbH for HIP-treatment.

Conflicts of Interest

The authors declare no conflicts of interest.

References

  1. Menge, M.; Rath, D.; Zeuner, T. New chassis components as aluminum castings. ATZ Worldw. 2005, 107, 9–10. [Google Scholar] [CrossRef]
  2. Hernandez, F.C.; Ramírez, J.M.; Mackay, R. Al-Si Alloys: Automotive, Aeronautical, and Aerospace Applications, 1st ed.; Springer International Publishing: Cham, Switzerland, 2017; ISBN 978-3-319-58379-2. [Google Scholar]
  3. Asensio-Lozano, J.; Vander-Voort, G.V. The Al-Si phase diagram. Microsc. Microanal. 2009, 15, 60–61. [Google Scholar] [CrossRef] [Green Version]
  4. Apelian, D.; Shivkumar, S.; Sigworth, G. Fundamental aspects of heat treatment of cast Al-Si-Mg alloys. AFS Trans. 1989, 97, 727–742. [Google Scholar]
  5. Wang, Q.; Apelian, D.; Lados, D. Fatigue behavior of A356-T6 aluminum cast alloys. Part I. Effect of casting defects. J. Light Met. 2001, 1, 73–84. [Google Scholar] [CrossRef]
  6. Ammar, H.R.; Samuel, A.M.; Samuel, F.H. Effect of casting imperfections on the fatigue life of 319-F and A356-T6 Al-Si casting alloys. Mater. Sci. Eng. A 2008, 473, 65–75. [Google Scholar] [CrossRef]
  7. Campbell, J. An overview of the effects of bifilms on the structure and properties of cast alloys. Metall. Mater. Trans. 2006, 37B, 857–863. [Google Scholar] [CrossRef]
  8. Wang, Q.; Apelian, D.; Lados, D. Fatigue behavior of A356/357 aluminum cast alloys. Part II—Effect of microstructural constituents. J. Light Met. 2001, 1, 85–97. [Google Scholar] [CrossRef]
  9. Ceschini, L.; Morri, A.; Sambogna, G. The effect of hot isostatic pressing on the fatigue behavior of sand-cast A356-T6 and A204-T6 aluminum alloys. J. Mater. Process. Technol. 2008, 204, 231–238. [Google Scholar] [CrossRef]
  10. Zhang, B.; Poirier, D.; Chen, W. Microstructural effects on high-cycle fatigue-crack initiation in A356.2 casting alloy. Metall. Mater. Trans. 1999, 30A, 2659–2666. [Google Scholar] [CrossRef]
  11. Bowles, C.; Schijve, J. The role of inclusions in fatigue crack initiation in an aluminium alloy. Int. J. Fract. 1973, 9, 171–179. [Google Scholar] [CrossRef]
  12. Joyce, M.; Styles, C.; Reed, P. Elevated temperature short crack fatigue behaviour in near eutectic Al-Si alloys. Int. J. Fatigue 2003, 25, 863–869. [Google Scholar] [CrossRef]
  13. Shiozawa, K.; Thoda, Y.; Sun, S. Crack initiation and small fatigue crack growth behaviour of squeeze-cast Al-Si aluminium alloys. Fatigue Fract. Eng. Mater. Struct. 1997, 20, 237–247. [Google Scholar] [CrossRef]
  14. Siddique, S.; Imran, M.; Wycisk, E.; Emmelmann, C.; Walther, F. Influence of process-induced microstructure and imperfections on mechanical properties of AlSi12 processed by selective laser melting. J. Mater. Process. Technol. 2015, 221, 205–213. [Google Scholar] [CrossRef]
  15. Prashanth, K.G.; Scudino, S.; Klauss, H.J.; Surreddi, K.B.; Löber, L.; Wang, Z.; Chaubey, A.K.; Kühn, U.; Eckert, J. Microstructure and mechanical properties of Al–12Si produced by selective laser melting: Effect of heat treatment. Mater. Sci. Eng. A 2014, 590, 153–160. [Google Scholar] [CrossRef]
  16. Awd, M.; Siddique, S.; Walther, F. Microstructural damage and fracture mechanisms of selective laser melted Al-Si alloys under fatigue loading. Theor. Appl. Fract. Mech. 2020, 106. [Google Scholar] [CrossRef]
  17. Li, X.P.; Wang, X.J.; Saunders, M.; Suvorova, A.; Zhang, L.C.; Liu, Y.J.; Fang, M.H.; Huang, Z.H.; Sercombe, T.B. A selective laser melting and solution heat treatment refined Al–12Si alloy with a controllable ultrafine eutectic microstructure and 25% tensile ductility. Acta Mater. 2015, 95, 74–82. [Google Scholar] [CrossRef]
  18. Frost, N.E. Notch effects and the critical alternating stress required to propagate a crack in an Al alloy subject to fatigue loading. J. Mech. Eng. Sci. 1960, 2, 109–119. [Google Scholar] [CrossRef]
  19. Smith, R.A.; Miller, K.J. Prediction of fatigue regimes in notched components. Int. J. Mech. Sci. 1978, 20, 201–206. [Google Scholar] [CrossRef]
  20. Kitagawa, H.; Takahashi, S. Applicability of fracture mechanics to very small cracks or the cracks in the early stage. In Proceedings of the Second International Conference on Mechanical Behavior of Materials 1976, Boston, MA, USA, 16–20 August 1976; pp. 627–631. [Google Scholar]
  21. El Haddad, M.H.; Smith, K.N.; Topper, T.H. Fatigue crack propagation of short cracks. J. Eng. Mater. Technol. 1979, 101, 42–46. [Google Scholar] [CrossRef]
  22. Atzori, B.; Lazzarin, P.; Meneghetti, G. Fracture mechanics and notch sensitivity. Fatigue Fract. Eng. Mater. Struct. 2003, 26, 257–267. [Google Scholar] [CrossRef]
  23. Sadananda, K.; Sarkar, S. Modified Kitagawa diagram and transition from crack nucleation to crack propagation. Metall. Mater. Trans. A 2013, 44, 1175–1189. [Google Scholar] [CrossRef]
  24. Roy, M.J.; Nadot, Y.; Nadot-Martin, C.; Bardin, P.-G.; Maijer, D.M. Multiaxial Kitagawa analysis of A356-T6. Int. J. Fatigue 2011, 33, 823–832. [Google Scholar] [CrossRef] [Green Version]
  25. Houria, M.I.; Nadot, Y.; Fathallah, R.; Roy, M.; Maijer, D.M. Influence of casting defect and SDAS on the multiaxial fatigue behavior of A356-T6 alloy including mean stress effect. Int. J. Fatigue 2015, 80, 90–102. [Google Scholar] [CrossRef]
  26. Tenkamp, J.; Koch, A.; Knorre, S.; Krupp, U.; Michels, W.; Walther, F. Defect-correlated fatigue assessment of A356-T6 aluminum cast alloy using computed tomography based Kitagawa-Takahashi diagrams. Int. J. Fatigue 2018, 108, 25–34. [Google Scholar] [CrossRef]
  27. Le, V.-D.; Morel, F.; Bellett, D.; Saintier, N.; Osmond, P. Simulation of the Kitagawa-Takahashi diagram using a probabilistic approach for cast Al-Si alloys under different multiaxial loads. Int. J. Fatigue 2016, 93, 109–121. [Google Scholar] [CrossRef] [Green Version]
  28. Gerbe, S.; Tenkamp, J.; Scherbring, S.; Bleicher, K.; Krupp, U.; Michels, W.; Walther, F. Microstructural influences on the fatigue crack initiation and propagation mechanisms in hypo-eutectic Al-Si cast alloys. Procedia Struct. Integr. 2019, 23, 511–516. [Google Scholar] [CrossRef]
  29. DuQuesnay, D.L.; Yu, M.T.; Topper, T.H. An analysis of notch-size effects at the fatigue limit. J. Test. Eval. 1988, 16, 375–385. [Google Scholar] [CrossRef]
  30. Yu, M.T.; DuQuesnay, D.L.; Topper, T.H. Notch fatigue behavior of SAE 1045 steel. Int. J. Fatigue 1988, 10, 109–116. [Google Scholar] [CrossRef]
  31. Tanaka, K.; Nakai, Y.; Yamashita, M. Fatigue growth threshold of small cracks. Int. J. Fract. 1981, 17, 519–533. [Google Scholar] [CrossRef]
  32. Murakami, Y.; Endo, M. Effects of hardness and crack geometries on ΔKth of small cracks emanating from small defects. In The Behaviour of Short Fatigue Cracks; EGF Pub. 1: London Miller, UK, 1986; pp. 275–293. [Google Scholar]
  33. Murakami, Y. Material defects as the basis of fatigue design. Int. J. Fatigue 2012, 41, 2–10. [Google Scholar] [CrossRef]
  34. Mayer, H.; Papakyriacou, M.; Zettl, B.; Stanzl-Tschegg, S.E. Influence of porosity on the fatigue limit of die cast magnesium and aluminium alloys. Int. J. Fatigue 2003, 25, 245–266. [Google Scholar] [CrossRef]
  35. Murakami, Y. Effects of small defects and nonmetallic inclusions on the fatigue strength of metals. Jsme Int. J. 1989, 32, 167–180. [Google Scholar] [CrossRef] [Green Version]
  36. Siddique, S.; Imran, M.; Rauer, M.; Kaloudis, M.; Wycisk, E.; Emmelmann, C.; Walther, F. Computed tomography for characterization of fatigue performance of selective laser melted parts. Mater. Des. 2015, 83, 661–669. [Google Scholar] [CrossRef]
  37. Wadell, H. Volume, shape, and roundness of quartz particles. J. Geol. 1935, 43, 250–280. [Google Scholar] [CrossRef]
  38. Tenkamp, J.; Koch, A.; Knorre, S.; Krupp, U.; Michels, W.; Walther, F. Effect of microstructure characteristics on the fatigue and crack propagation behavior of the aluminum cast alloy EN AC-AlSi7Mg0.3. ICF14. In Proceedings of the 14th International Conference on Fracture, Rhodes, Greece, 18–23 June 2017. [Google Scholar]
  39. Ilie, P.; Lesperance, X.; Ince, A. Design and development of an ultrasonic fatigue testing machine for very high cycle fatigue. SAE Tech. Pap. 2020, 1, 183. [Google Scholar]
  40. Ilie, P.; Lesperance, X.; Ince, A. Development of an ultrasonic fatigue testing system for gigacycle fatigue. Mater. Des. Process. Commun. 2019, 2, 120. [Google Scholar] [CrossRef] [Green Version]
  41. Siddique, S.; Imran, M.; Walther, F. Very high cycle fatigue and fatigue crack propagation behavior of selective laser melted AlSi12 alloy. Int. J. Fatigue 2017, 94, 246–254. [Google Scholar] [CrossRef]
  42. Weiler, J.P.; Wood, J.T. Modeling the tensile failure of cast magnesium alloys. J. Alloys Compd. 2012, 537, 133–140. [Google Scholar] [CrossRef]
  43. Tenkamp, J.; Bleicher, K.; Klute, S.; Chrzan, K.; Koch, A.; Walther, F. Advanced Characterization of the Cyclic Deformation and Damage Behavior of Al-Si-Mg Cast Alloys Using Hysteresis Analysis and Alternating curRent Potential Drop Method. Light Metals 2019; Springer: Berlin/Heidelberg, Germany, 2019; pp. 167–175. ISBN 978-3-030-05864-7. [Google Scholar] [CrossRef]
  44. Bang, D.J.; Ince, A.; Tang, L.Q. A modification of UniGrow 2-parameter driving force model for short fatigue crack growth. Fatigue Fract. Eng. Mater. Struct. 2019, 42, 45–60. [Google Scholar] [CrossRef] [Green Version]
  45. Bang, D.J.; Ince, A.; Noban, M. Modeling approach for a unified crack growth model in short and long fatigue crack regimes. Int. J. Fatigue 2019, 128, 105182. [Google Scholar] [CrossRef]
  46. Radaj, D.; Vormwald, M. Fatigue Strength—Basics for Engineers (in German: Ermüdungsfestigkeit—Grundlagen Für Ingenieure); Springer: Berlin/Heidelberg, Germany, 2011; p. 395. ISBN 978-3-540-71458-3. [Google Scholar]
  47. Awd, M.; Labanie, F.; Moehring, K.; Fatemi, A.; Walther, F. Towards deterministic computation of internal stresses in additively manufactured materials under fatigue loading: Part I. Materials 2020, 13, 2318. [Google Scholar] [CrossRef] [PubMed]
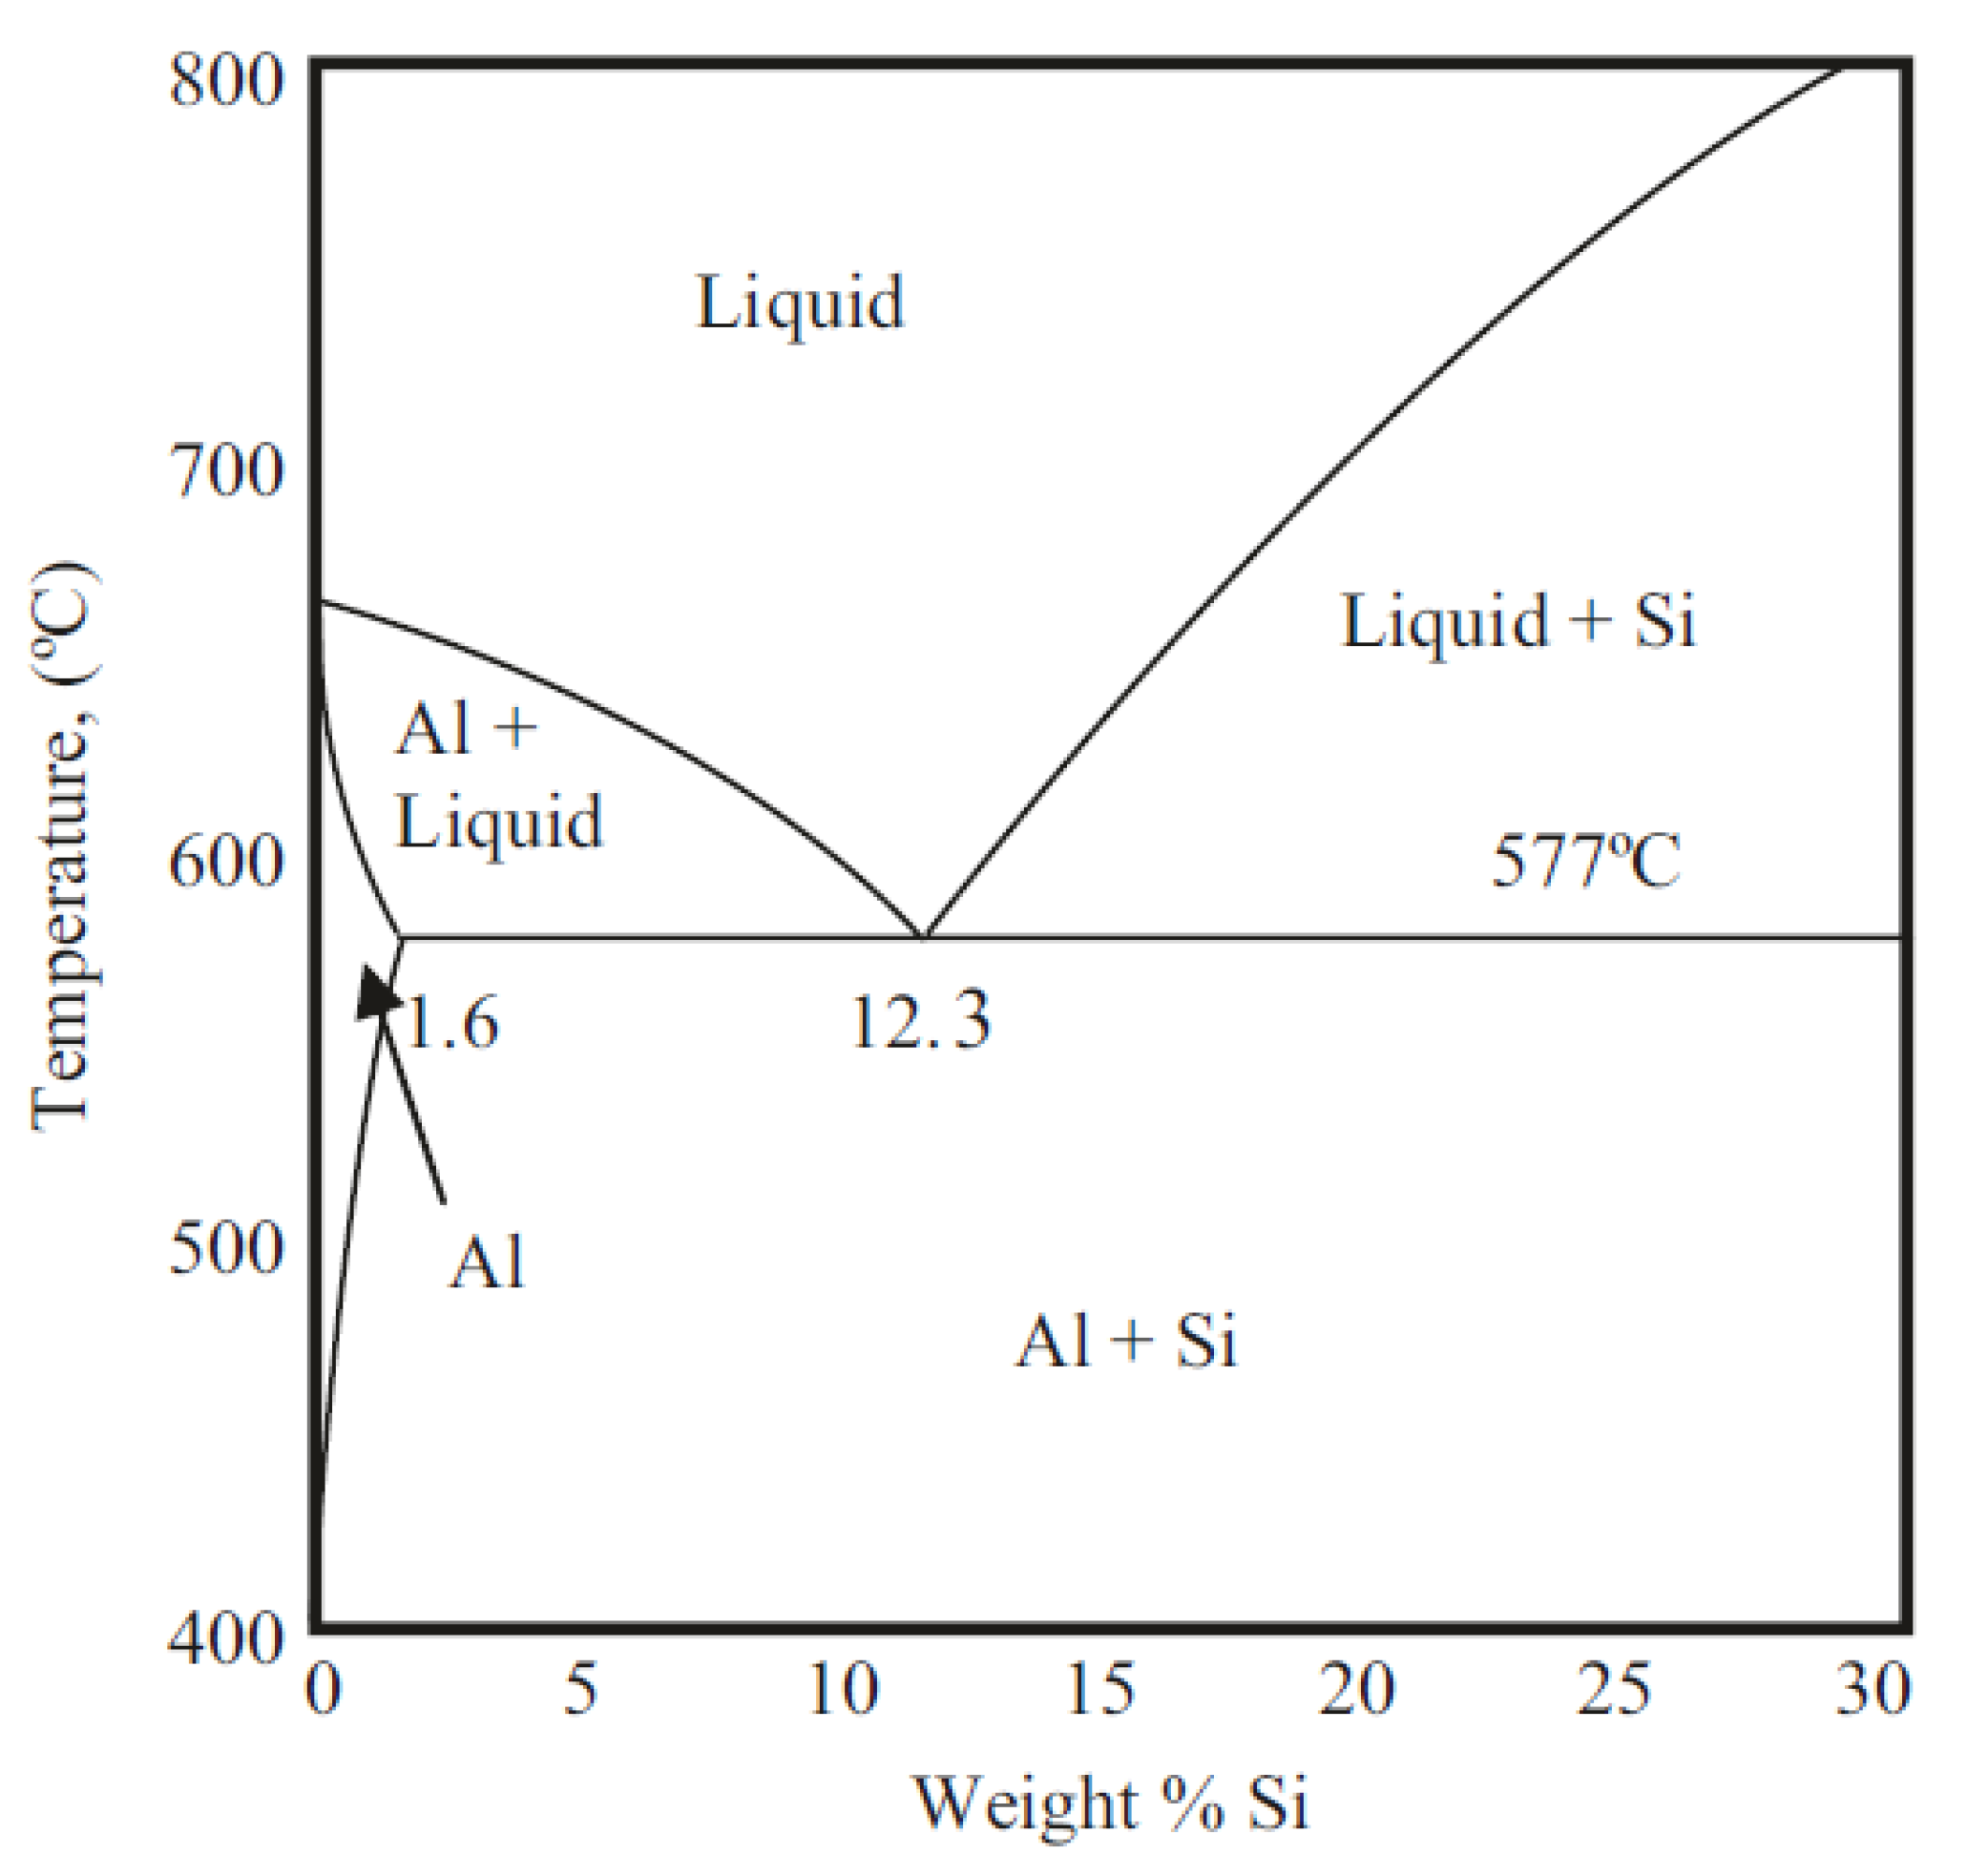
Figure 1. Section of binary Al–Si phase diagram [2].
Metals 10 00943 g001
Figure 2. Fatigue strength σ t h dependent on defect size a , the intrinsic defect size a 0 , and threshold of stress intensity factor range for long-crack propagation Δ K t h : (a) Schematic illustration [22] and (b) experimental validation [23].
Metals 10 00943 g002
Figure 3. Specimen geometries for (a) quasi-static, (b) HCF and (c) VHCF testing of die-cast (DC) alloy (left) and additively manufactured (AM) alloy (right).
Metals 10 00943 g003
Figure 4. Experimental setup of resonant fatigue testing system equipped with extensometer, ACPD, and video microscope (cf. [38]).
Metals 10 00943 g004
Figure 5. Experimental setup of an ultrasonic fatigue testing system equipped with a pneumatic air cooling system.
Metals 10 00943 g005
Figure 6. (a) Defect size A and sphericity Ψ 3 D and (b) histograms of the defect size distribution for die-cast (DC) and additively manufactured (AM) alloy (defect density is equal to the frequency of counts per class and per volume).
Metals 10 00943 g006
Figure 7. S-N (Woehler) curves from HCF to VHCF regime for (a) die-cast (DC) alloy AlSi7Mg0.3 and (b) additively manufactured (AM) alloy AlSi12.
Metals 10 00943 g007
Figure 8. Fractographic identification of crack initiation side for (a) DC-1 at 140 MPa and Nf = 1.1·105, (b) DC-3 at 140 MPa and Nf = 2.8·105, (c) AM-1 at 70 MPa and Nf = 1.6·106 and (d) AM-1 at 70 MPa and Nf = 3.2·108.
Metals 10 00943 g008
Figure 9. SIF–N curves for the (a) die-cast (DC) alloy AlSi7Mg0.3 and additively manufactured (AM-1) alloy AlSi12 from the LCF to VHCF regime and (b) die-cast (DC) alloys related to crack initiation lifetime from the LCF to HCF regime.
Metals 10 00943 g009
Figure 10. Modified Kitagawa–Takahashi diagram for die-cast (DC) alloy AlSi7Mg0.3 and additively manufactured (AM) alloy AlSi12 (a) for specific batches ( Δ σ / 2 = σ a ) and (b) normalized to batch-specific intrinsic material fatigue limit Δ σ 0 and crack length a 0 .
Metals 10 00943 g010
Table 1. Chemical composition of die-cast (DC) and additively manufactured (AM) alloy AlSi7Mg0.3 and AlSi12, all data in wt.%.
ProcessAlloySiMgFeMnTiAl
DCAlSi7Mg0.37.50.2880.0940.00180.146Bal.
AMAlSi1211.0–13.00.100.60.15n.a.Bal.
Table 2. Microstructural characteristics of die-cast (DC) and additively manufactured (AM) alloy AlSi7Mg0.3 and AlSi12.
BatchGrain Size
[µm]
Dendrite Size
[µm]
Area
[µm2]
Major Axis
[µm]
Minor Axis
[µm]
Sphericity   Ψ 2 D
[–]
DC-1628 ± 31234.1 ± 3.05.113.061.710.91
DC-2660 ± 26635.1 ± 5.04.102.751.610.85
DC-3562 ± 30035.3 ± 5.15.693.251.790.84
AM-1-0.31 ± 0.17 *----
AM-2-0.46 ± 0.23 *----
* Mean value for the z-plane (build direction) and xy-plane (the perpendicular direction).
Table 3. Hardness and quasi-static properties of die-cast (DC) and additively manufactured (AM) alloy AlSi7Mg0.3 and AlSi12.
BatchHV10E [GPa] σ y , 0.02 [MPa] σ y , 0.2 [MPa] σ U T S [MPa] ε t
DC-196 ± 671.5 ± 3.2153 ± 16196 ± 18253 ± 15.6 ± 2.2
DC-292 ± 373.0 ± 2.0149 ± 22192 ± 14257 ± 205.6 ± 1.0
DC-3108 ± 174.6 ± 2.5185 ± 4237 ± 3308 ± 59.4 ± 1.5
AM-1107 ± 376.7 ± 4.2145 ± 4218 ± 7372 ± 73.4 ± 0.29
AM-2100 ± 472.5 ± 4.3126 ± 4201 ± 4361 ± 54.1 ± 0.15
Table 4. S-N curve parameters of die-cast (DC) and additively manufactured (AM) alloy AlSi7Mg0.3 and AlSi12 related to Basquin.
BasquinDC-1DC-2DC-3aDC-3bAM-1aAM-1bAM-2aAM-2b
σ f [MPa]13821193821 172110787212144
b−0.201−0.199−0.137−0.035−0.193−0.017−0.048−0.024
Table 5. Fatigue and crack propagation properties of die-cast (DC) and additively manufactured (AM) alloy AlSi7Mg0.3 and AlSi12.
Batchm [–] Δ K t h , R 0.1   [ MPa m ] Δ K t h , R 1   [ MPa m ] Δ σ 0
[MPa]
a 0
[µm]
A e f f , i
[µm]
a 0
[µm]
Δ σ 0
[MPa]
DC-14.93.54.1120 *372313240149
DC-25.24.35.0140 *406338263174
DC-35.45.26.019629865271206
AM-12.73.24.3134328279210167
AM-22.83.54.7---185195
* Estimated based on run out stress amplitude.