


Abstract
Green hydrogen receives attention across academia, governments, and practitioners as a technical solution to decarbonize economic sectors, yet its large-scale deployment faces significant barriers and depends on effective policy incentives. There is little research examining how actors perceive barriers and incentives. Understanding such perspectives is key to designing impactful policies. This study investigates actors’ perceptions of barriers and incentives and how these vary across organizational characteristics, gender, managerial role, and Romanian market exposure. An online survey conducted in 2025 collected responses from diverse stakeholders across the European hydrogen value chain (N = 236). Responses were analyzed using Chi-square, Mann–Whitney U, and Kruskal–Wallis tests, as well as Pearson’s correlations. Results show that “high capital costs”, “regulatory uncertainty”, and “lack of infrastructure” are seen as the most critical barriers, while “financial subsidies”, “regulatory mandates”, and “public policies” are the preferred incentives. Statistically significant differences emerge for “public acceptance” and “limited market demand” across organizational roles and types, and for “public–private partnerships” among respondents with Romanian market contact. By showing that barriers and incentives are not only structural, but also shaped by individual and organizational characteristics, this study highlights conceptually that green hydrogen policies must consider diverse business perspectives to be successful.
1. Introduction
Hydrogen is increasingly viewed as a cornerstone of energy transition strategies throughout the world [1,2], yet the pace of deployment depends on overcoming key barriers [3,4,5] and leveraging available incentives [6,7,8]. The Intergovernmental Panel on Climate Change (IPCC) highlights the importance of zero-carbon or “extremely low-carbon” hydrogen, including green hydrogen, as an important solution to lower carbon emissions in some economic sectors, such as certain industrial and transport segments, since these lack electrification options or electrification would be impractical (p. 679, [9]). Although green hydrogen has received growing attention, its adoption is slow, indicating that current solutions and measures are insufficient, so understanding the underlying factors better is of paramount importance.
While existing research has extensively examined the techno-economic feasibility of green hydrogen and related policy designs, comparatively little empirical evidence exists on how different stakeholders perceive barriers and incentives to green hydrogen adoption, or how these perceptions vary across organizational and individual characteristics.
The theoretical foundation underlying the present research is the Multi-Level Perspective (MLP) on sociotechnical transitions. It provides a useful analytical lens for socioeconomic development pathways that are sustainable from an environmental point of view: hydrogen technologies represent niche innovations, barriers signal regime misalignments, and incentives reflect landscape and regime pressures shaping adoption of this technology [10,11,12]. Actors are considered to be located at various levels (niche, regime and landscape) depending on their role in the transition.
Within the theoretical context of the MLP on sociotechnical transitions, while niches refer to innovations like hydrogen pilot projects, regimes refer to the dominant sociotechnical system in place, like fossil fuel infrastructure and existing market trends. Landscapes refer to macro trends like public policies and geopolitical events, which are usually exogenous.
By green hydrogen, we refer to hydrogen that is produced with renewable electricity. More on the various color labels of hydrogen, depending on the technologies and energy sources employed, can be found in previous research by the authors [13,14].
Despite the growing policy, research and business focus on green hydrogen, less is known about how different actors perceive barriers and incentives to adopt green hydrogen technologies. Actor heterogeneity within the hydrogen niche and regime levels may influence which challenges are prioritized, which policy instruments are effective, and how transition pathways unfold at the societal level. Therefore, this leads to the question: how do hydrogen actors perceive barriers and incentives to green hydrogen deployment, and how do these perceptions vary across respondents’ characteristics?
2. Literature Review
2.1. Social Sciences vs. Techno-Economic Research on Green Hydrogen
Green hydrogen receives a lot of attention among researchers in the decarbonization debate, especially when it comes to its contribution to so-called hard-to-decarbonize sectors, like iron and steelmaking, cement and lime, some transport segments, or chemicals and petrochemicals, where electrification has its limitations [1,2]. However, beyond the pure financial and technical aspects, including feasibility and technological innovations, the social and economic aspects of green hydrogen remain less researched. In fact, some researchers argue that “hydrogen research in the social sciences and humanities can currently not cope with the pace of political action and technological development” (p. 83 [3]).
Recent studies have investigated barriers and incentives to the adoption of green hydrogen given that green hydrogen projects do not yet reach the required and desired levels for climate change mitigation. Beyond technical and financial aspects, since this is a capital-intensive technology to be implemented, social, economic and policy aspects deserve further investigation as these could unearth why green hydrogen is still lagging behind the desired mass adoption.
A growing body of literature has examined the barriers affecting green hydrogen adoption across different regions and institutional contexts [5,15] and it situates green hydrogen within the dynamics of the energy transition [16]. Some research analyzes hydrogen adoption barriers from a regional capabilities perspective [5], but these do not examine how these barriers are perceived or prioritized by different stakeholder groups in a wider geographical scope.
2.2. Sample Characteristics in the Literature (Public vs. Expert Surveys, Gender, Geography, etc.)
Since private-sector stakeholders are among the pioneers that develop and implement this technology (at the niche level), and since public-sector stakeholders hold the power to change the regulatory and policy framework required for green hydrogen adoption (at the landscape level), analyzing their perceptions on barriers and incentives, along with other stakeholders across the hydrogen value chain (including at the regime level), becomes crucial.
Even when stakeholders’ or public perspectives have been surveyed, the number of participants was relatively low (e.g., 10 stakeholders [17], 15 organizations [5], 20 experts [18], 43 stakeholders [15], 58 participants across various focus groups [19], 73 respondents [20], 80 participants [21,22], etc.). And where a large number of stakeholders were surveyed, the study was limited to one subnational region in the United Kingdom (N = 1021, [23]), or to one country, like Germany (N = 1203, [24]) or Norway (N = 2503, [25]).
In other relevant research, although researchers found that some socio-psychological traits of employees impact the willingness to adopt green hydrogen, further individual and/or organizational differences have not been assessed [26], nor have barriers and incentives been analyzed [27].
Even when a large number of participants was surveyed, most participants were men. An Indian case study surveyed 90% men with women representing only 10% [26], while a German case study included 72% men and 27% women [24]. While some studies include a balanced share of men and women [28], others fail to indicate the gender distribution of the sample altogether [17,18,23,27].
It is also important to highlight that, while some studies included experts [18,29], capturing a high level of knowledge of the hydrogen industry, most studies focus on the public [8,17,21,28] and do not necessarily target the green hydrogen industry or experts in this and related fields, nor do these investigate specifically the barriers and incentives to green hydrogen adoption, but rather they focus on the public/social acceptability of the technology.
There is also a concentrated geographical coverage regarding green hydrogen in the literature. The limited body of research that has investigated this matter covers between one and three countries, mainly developed green hydrogen markets. It is important to look at country-specific contexts, given that recent research found diverging views among experts from China, Germany and the USA [30] on where priorities need to be placed to advance green hydrogen technology. The importance of socioeconomic and sociopolitical contexts is also highlighted by other researchers [31].
Moreover, since green hydrogen is seen as a solution for various sectors, across various geographies, it is important to also understand why some markets are lagging behind others. In this context, Romania, which is a member of the European Union, remains largely unstudied when it comes to research on the economic and policy aspects of green hydrogen—with one exception [20] that has a very small sample (N = 5).
Studies have focused so far on Germany, the Netherlands, Spain [32], Luxembourg [17], India [26], China or the USA [18,30] to name some examples. The European Union was also studied as a whole, but less than individual member states [32], while in Eastern Europe, case studies on Poland [22,28], Czechia [28], Slovakia [28] and Slovenia [32] were conducted.
2.3. Synthesis of Identified Research Gap
Despite the relevance of actor heterogeneity in sociotechnical transition research, as per the MLP framework, empirical studies that systematically examine perception-based differences across stakeholder groups in green hydrogen adoption across various markets remain scarce. Most existing studies either aggregate barriers across actors or focus on specific technological or policy dimensions.
Taken together, these studies provide strong explanations of what constrains green hydrogen adoption at the system and market levels but offer limited insight into how these constraints are understood and prioritized by different actors involved in the transition at various (niche, regime, landscape) levels, as per the MLP framework.
An MLP was successfully applied in some research on the energy transition in Norway [33], or on heavy-duty fuel-cell trucks [34]. However, expert perceptions are less surveyed, with a significant emphasis put on the public perceptions/acceptability/awareness. From an MLP, this represents a significant gap, as actor heterogeneity and differing interpretations of constraints are central to understanding how niche technologies interact with incumbent regimes, influenced by external landscape-based actors.
By addressing this gap, the present study adopts a perception-based approach to green hydrogen adoption, examining how barriers and incentives are prioritized across organizational roles, socio-demographic characteristics, and market exposure, based on the Romanian case study. Rather than identifying new barriers, the study contributes by showing how existing barriers and incentives are interpreted differently by actors occupying distinct positions at various levels of the energy transition, as defined by the MLP framework.
Table 1 summarizes the key literature on topics that are closely linked to the present research endeavor.
Table 1.
Identified research gaps in the relevant literature.
Overall, most studies emphasize techno-economic or policy-level dimensions, while offering limited insight into expert-level perceptions across heterogeneous actor groups involved in the green hydrogen sector.
3. Materials and Methods
3.1. Conceptual Framework: Multi-Level Perspective (MLP) on Sociotechnical Transitions
This study is an empirical, quantitative, cross-sectional, survey-based investigation with a descriptive and exploratory research scope, positioned at an intermediate level of depth within the research pyramid, as it aims to identify and compare patterns in stakeholders’ perceptions across the European Union rather than establish causal relationships at a global level. The research follows a positivist research paradigm and is non-experimental in design. According to its purpose, the study is analytical and comparative, examining differences in perceived barriers and incentives to green hydrogen deployment across the organizational and individual characteristics of the respondents.
With respect to the type of inference, the study applies inferential statistical analysis to test predefined hypotheses using primary data, collected through an online questionnaire. It adopts a cross-sectional time dimension, as data was gathered at a single point in time. Data collection and analysis were conducted using a structured survey technique, descriptive statistics, non-parametric statistical tests, and correlation analysis.
Building on the MLP framework on sociotechnical transitions, barriers and incentives are conceptualized as being actor-specific, therefore shaped by the position of the organization in the energy transition based on the three levels (niche, regime, landscape). For example, technology providers or equipment manufacturers are seen to be closer to the innovation itself, at the niche level, while public sector organizations are closer to the landscape level since this influences or shapes the public policies directly/indirectly. Therefore, the study aims to identify differences between these predefined categories rather than estimate the cause and effect.
To reply to the research question of how actors perceive barriers and incentives to green hydrogen deployment, and how these perceptions vary across actor characteristics, we tested the following hypotheses: H1: Perceptions of incentives for adopting green hydrogen differ across organizational roles and types. H2: Perceptions of incentives differ depending on individual attributes such as gender, managerial role, and geographical market exposure. H3: Perceptions of barriers to green hydrogen adoption differ across organizational roles and types. H4: Perceptions of barriers differ depending on gender, managerial role, and geographical market exposure. H5: There are significant correlations between perceived barriers and incentives to green hydrogen adoption.
To operationalize the MLP framework analytically, the present study maps respondent categories onto the three MLP levels. Technology providers, equipment manufacturers and start-ups are considered to operate primarily at the niche level, as they develop and test green hydrogen technologies in relatively protected spaces [11]. Large corporations and energy utilities represent regime-level actors, embedded in the dominant sociotechnical system and its incumbent rules [10,35], while public authorities, regulators and research institutions are positioned closer to the landscape level, given their role in shaping macro-level policy signals and institutional conditions [12,36]. From this mapping, several analytical expectations follow.
Niche-level actors, given their proximity to technological development, are expected to be more attuned to capital costs and technological barriers, as these directly affect their capacity to bring innovations to market. Regime-level actors, operating within established market structures and regulatory environments, are expected to emphasize regulatory uncertainty and market demand constraints, since these determine whether incumbent business models can accommodate the new technology, while landscape-level actors, whose function involves setting the institutional framework, are expected to favor policy-oriented incentives such as regulatory mandates and public strategies.
Such expectations do not replace the exploratory hypotheses (H1–H5) but provide an interpretive framework that is theoretically grounded against which empirical results can be evaluated, ensuring that the MLP functions as an analytical tool rather than solely as a descriptive backdrop. Accordingly, hypotheses H1 through H5, which test for differences in perceptions of barriers and incentives across organizational and individual characteristics, are not formulated as purely exploratory propositions but derive their analytical rationale from the MLP’s expectation that actors at different system levels will interpret constraints and enablers through the lens of their structural position within the sociotechnical regime.
3.2. Case Study: Romania
Since Romania has a strong industrial base, including an important natural gas infrastructure—which could have a significant role in the transition towards green hydrogen—and a sophisticated economy, while also having undergone a transition from a state-controlled economy prior to 1989 to a market-based economy thereafter, it can serve as an insightful case study on how the transition to a low-carbon economy unfolds, compared to other European Union members.
Romania also serves as an interesting case study because it has successfully uncoupled its economic growth from the emission of greenhouse gases, despite such an important social and political transition witnessed in the 1990s after the end of the communist regime.
Although Romania’s economy grew tenfold to 382.6 billion USD in 2024 [37], the carbon intensity of gross domestic product (GDP) decreased from 0.5 kg of carbon dioxide emissions of GDP in 1991 to 0.1 kg in 2024 [38]. Moreover, the carbon dioxide emissions per capita are 33% lower in Romania than emissions for the 27 member states of the European Union for 2024, i.e., 3.61 tons of carbon dioxide per capita compared to 5.39 tons at the pan-European level, which is explained mainly by the reduction in coal and natural gas use [39].
Moreover, Romania’s energy transition, although rather stagnant until recent years, has started to pick up pace, as illustrated for example by the number of prosumers in the country which surpassed that of Poland by 2023 with 110.335 in Romania, compared to about 77.000 in Poland [40]. On other indicators, however, Romania is still lagging, which is why studying the perceptions of actors across the various segments of the hydrogen value chain can help researchers, policy-makers and businesses to take informed actions.
The Romanian market fails to appear with any hydrogen projects in the database of green hydrogen projects of the International Energy Agency [41], so comparing barriers and incentives among developed European green hydrogen markets as opposed to Romania helps provide insights into these aspects, depending on the market maturity.
Stakeholder perceptions on green hydrogen remain basically unresearched in Romania, except for a few technical studies [42,43], as well as one that surveyed public perception in climate change adaptation and mitigation topics, including hydrogen, but not limited to green hydrogen [44]. Therefore, the Romania case study has been fully embedded in the present research design.
3.3. Questionnaire Design
An EU-wide survey with a case study lens on Romania titled “The role of green hydrogen in sector coupling” was conducted online between 26 June and 23 July 2025 with the aim to conduct “research into green hydrogen (i.e., produced with renewable energy) as an enabler for decarbonization and sector coupling (i.e., the integration of the power sector with end-use sectors) within the European Union.” It was explicitly stated that “knowledge of the Romanian market is also of interest”.
During the questionnaire design phase, items were derived from the literature review, and the survey questions were tested by a group of 10 experts researching or working in the fields of engineering, economics, and energy. Following feedback received from these experts by the authors, the survey questions were amended and deemed final, after which the survey was sent to the survey participants.
In terms of structure, the survey included questions on individual characteristics like gender, organization type, the organization’s primary role, managerial role, self-rated knowledge of green hydrogen and contact through work or research to the Romanian market, followed by questions on perceptions of the key barriers and incentives that impact a company’s decision to invest in green hydrogen or pursue business in this sector.
The survey contained a mix of categorical and ordinal items, as shown in Appendix A, whereby respondents were allowed to select several organizational roles to better reflect the positioning of their organization in the energy transition context and along the hydrogen value chain. The perception of barriers was measured using a ranking, whereby they were asked to rank each barrier as 1st, 2nd or 3rd choice, which allowed authors to measure the severity of each barrier. For incentives, respondents had a multiple choice among listed items.
Table 2 presents an overview of the barriers and incentives assessed, with a corresponding description and underlying literature sources.
Table 2.
Green hydrogen incentives and barriers for which data was collected.
3.4. Data Collection and Sampling Strategy
The data collection took place fully online using the snowball technique [22], whereby participants were targeted based on these criteria: (a) gender, whereby equilibrium was sought between men and women; (b) management/non-management role; (c) knowledge or professional engagement in and outside Romania; and (d) professionals/researchers in relevant industries (energy, industry, transport, chemicals and petrochemicals, etc.).
Given the use of a non-probability snowball sampling approach, the final sample size was not determined a priori but reflects the number of valid responses collected during the survey period.
The snowball technique was deemed appropriate because the study targets a specific and relatively hard-to-reach population of professionals and experts involved in hydrogen-related activities, for which no comprehensive sampling frame is available. Snowball sampling is therefore appropriate for exploratory research aiming to capture informed expert perspectives.
This method was used successfully in previous research [15,32,48,49]. Limitations of the snowball technique include, however, potential self-selection bias, while a general conclusion cannot be drawn. Moreover, given the cross-sectional design, the evolution over time of actor perceptions cannot be analyzed. Nevertheless, this analysis could be built upon in subsequent research.
The potential respondents were invited to reply to the survey using a predefined message. Contact was established via email and through LinkedIn, mainly via private messages, and some professional groups and pages like “Women in Green Hydrogen”, but also advanced LinkedIn features like private messaging through SalesNavigator for a wider reach of relevant stakeholders.
Respondents reported demographic and organizational characteristics (e.g., gender, organization type, managerial role, hydrogen knowledge, Romania contact), and replied to the questions: “What do you think are the main incentives that influence a company’s decision to invest in green hydrogen solutions or do business with green hydrogen? Select all that apply” and “What do you think are the biggest barriers a company faces when considering investment in green hydrogen projects? Rank the top 3, with the 1st being the most important”.
The present study assumes that the professionals and researchers working closely on green hydrogen aspects are best positioned to identify the key barriers and incentives to green hydrogen adoption at their respective level, e.g., the niche level for technology providers, or regulators in the case of regime/landscape level actors, as opposed to the public or other professional categories. Therefore, hydrogen professionals and experts were specifically targeted to reply to this survey, which is reflected in the high self-rated level of hydrogen knowledge of the sample.
3.5. Sample Analyzed
A total of 236 replies were collected through Google Forms. The sample presented in Table 3 reflects a diverse representation of stakeholders across various industries and activities related to green hydrogen, including a balanced distribution of gender, with 62.3% of the respondents being men and 36.9% women, while 0.8% responded “Other” gender.
Table 3.
Sample characteristics.
Two questions were asked regarding the main role and the type of organization represented by the respondents. When it comes to the organizational type, large corporations (30.1%) and public-sector organizations (30.9%) together dominate, followed by SMEs (19.5%) and NGOs (10.6%). Start-ups and freelancers/independent/self-employed actors represent a smaller share with 4.7% and 4.2% respectively.
When it comes to the main organizational role, nearly one-quarter of respondents come from consultancies and think-tanks (24.8%), highlighting the strong analytical and advisory expertise underlying the present analysis. Public authorities and regulators make up almost one-fifth (18.6%), complemented by 13.6% from research and academic institutions, together underscoring a significant policy–research background. Further, project developers or Engineering, Procurement and Construction companies (EPC) represented 12.8%, followed by energy utilities or suppliers with 9.7% and technology providers or equipment manufacturers with 8.1%.
As shown in Table 3 and Figure 1, most participants (60.5%) hold managerial roles, suggesting that responses reflect decision-making perspectives rather than purely technical ones. Moreover, 38.6% of respondents indicated having contact with Romania through their work or research, while 61.4% indicated lacking such contact. Respondents who indicated other market exposure beyond the European Union (including Romania), have experience in Africa, Asia, Australia, Brazil, Japan, the Middle East, Egypt, India, Jordan, Latin America, Malaysia, Sri Lanka, Switzerland, as well as “worldwide” experience.
Figure 1.
Share of respondents with managerial (Yes) versus non-managerial (No) role.
Self-assessed knowledge of green hydrogen skews toward intermediate and advanced levels (mean at 3.4 on a 5-point scale), with nearly half (48.7%) rating themselves at level 4 or higher, and fewer than 5% reporting no knowledge of green hydrogen, as shown in Table 1 and Figure 2. This composition ensures that the dataset balances informed insights with sufficient variation to explore differences in perception and experience across groups. Some differences emerged between the respondents depending on the market exposure, with 72.4% of respondents who have contact with the Romanian market rating their knowledge between 3 and 5 (expert knowledge), while 92.4% of the respondents who lack such market exposure indicated the same level of knowledge. Therefore, we assume that most respondents were experts in their field.
Figure 2.
Self-rated green hydrogen knowledge.
3.6. Data Processing, Statistical Analysis, Interpretation, and Visualization
To investigate differences in perceived incentives across organizational role and type (H1), as well as individual characteristics (H2), as conceptualized within the MLP framework, the raw survey data was manually encoded in Microsoft Excel and afterwards processed in IBM SPSS Statistics, Version 31.0.
To analyze the multiple responses recorded for the organizational roles, a data restructuring technique was employed, using SPSS’s VARSTOCASES (variables to cases) function. Originally, respondents were allowed to select multiple roles across a set of binary (dummy-coded) variables (e.g., Q2_project_developer, Q2_energy_utility_or_supplier, etc.), each representing a distinct organizational role.
All related binary variables were selected and restructured into cases, with the new variable “OrgRole” indicating whether a specific role was selected (1) and an accompanying index variable “RoleName” identifying the specific role (coded 1 to 9). This approach allowed each row to represent a single role selection per respondent, enabling disaggregated role-level analysis while preserving respondent-level data integrity. The same approach was adopted with the data collected on incentives, which is standard practice in multiple-response surveys.
To analyze replies for the perceived barriers across organizational role and type (H3), as well as individual characteristics (H4), prior data preparation was also needed. Authors created weighted scores (0–3) for each barrier based on respondents’ rankings, whereby the barrier that ranked first received 3 points, the second one 2, and eventually the last one received 1 point, whereby 0 points were attributed to all unselected options. The variables have the suffix “SCORE”. This transformation yielded a continuous measure of perceived importance.
Additionally, binary dummy variables with the suffix “TOP3” were generated, with 1 = selected in Top 3 and 0 = not selected, to capture whether each barrier was included among respondents’ three most important choices, therefore the measurement was:
- 3 points for the 1st ranked barrier;
- 2 points for the 2nd ranked barrier;
- 1 point for the 3rd ranked barrier;
- 0 points for all other barriers.
To analyze differences in perceived barriers across respondent roles, the multiple binary variables representing the organization’s primary role were combined into a single categorical variable. Each respondent was assigned to a single category based on their selections, resulting in a mutually exclusive grouping variable with nine levels. Respondents who selected more than one role were grouped into a separate “multiple roles” category, adding a tenth level, ensuring that no data was lost while preserving the assumption of independent groups required by the Kruskal–Wallis H test. This transformation was necessary to enable a valid comparison of barrier severity scores across organizational roles using a single grouping factor.
It should be noted that the transformation of ordinal rankings into weighted scores implicitly treats the intervals between ranks as equal, which is a simplification. However, this approach is consistent with standard practice in survey research on perceived barriers and priorities [5,49].
The Kruskal–Wallis H test used to compare barrier perceptions across groups operates on ranked data rather than on the raw score values, which means the test does not require strict interval-level measurement properties. Furthermore, the complementary binary TOP3 variables provide a robustness check that captures whether each barrier was included among the respondent’s top three choices without imposing assumptions about the distance between rank positions.
The consistency between results obtained from SCORE and TOP3 variables indicates that the findings are robust to the choice of operationalization. In practice, the direction and statistical significance of group differences were systematically compared across both variable types, and no material discrepancies were identified: barriers that emerged as statistically significant under the weighted SCORE approach were also confirmed when analyzed using the binary TOP3 indicators, which serves as an empirical robustness check independent of the scoring assumptions.
All data was analyzed with IBM SPSS Statistics, Version 31.0, following two steps. First, descriptive statistics were computed for all barriers and incentives to summarize central tendencies and variation across the sample. Second, in-depth statistical analysis was performed to test the hypothesis, as follows.
For the first two hypotheses on incentives, which focus on whether preferences for incentives differ across various stakeholder groups defined by organizational type, role (H1), actor characteristics and market exposure (H2), Chi-square tests of independence were performed on cross-tabulations between incentives and characteristics of individual respondents. This approach is consistent with the MLP assumption that actors have different perceptions based on their positioning in the energy transition (niche, regime, landscape). This statistical test was successfully applied in previous research on green hydrogen [45,50].
To test the third and fourth hypotheses, Kruskal–Wallis H tests were done, analyzing barrier scores across the above-mentioned characteristics, i.e., organization type, organization’s main role (H3), gender, and contact with Romania (H4), while Mann–Whitney U tests were used for binary comparisons, i.e., managerial role. These tests are appropriate for ordinal data and are aligned with the objective of identifying systematic differences among various actor groups. Such tests were successfully performed in green hydrogen research [50,51].
The last hypothesis was tested using Spearman’s correlations across all barriers and incentives, thereby exploring their relationship (H5), so the analysis included all twelve barrier scores and seven incentive categories (including “Other”). Correlation analysis was the preferred option since it allowed authors to uncover co-occurring barriers and incentives without assuming causality. This is in line with the theoretical focus on actor perceptions and the cross-sectional survey design used. This test was successfully used in previous green hydrogen research [21,27].
Only results that are significant from a statistical perspective are presented (p < 0.05).
Table 4 provides an overview of the research objectives, linking these to the hypothesis, the variables analysis, the tests performed, as well as the reporting threshold.
Table 4.
Link between research objectives, hypothesis, variables and statistical tests.
Although correlation analysis may indicate associations between perceived barriers and incentives, the present study does not aim to establish causal relationships. The survey design, the ordinal nature of several variables, and the exploratory focus on actor perceptions do not support the assumptions required for regression-based inference. Therefore, correlation analysis is considered the most appropriate approach for capturing perception patterns without implying causality.
4. Results
4.1. Main Incentives to Invest in or Do Business with Green Hydrogen
Before testing the first and second hypothesis (H1, H2), authors performed some descriptive analysis, which shows that 27.1% of the respondents consider direct financial support as the main enabler for green hydrogen business uptake, while a quarter emphasize that a clear regulatory framework and supportive public policies or high-level strategies are primary enablers with 21.8% and 20.2% respectively. Tax incentives with 17% are followed by public–private-partnerships with 10.7% among the perceived main incentives able to unlock green hydrogen. This data is presented in Figure 3.
Figure 3.
Main incentives influencing a company’s decision to invest in green hydrogen solutions or do business with green hydrogen.
When it comes to the “Other” incentives listed by participants, the most frequently cited incentives emphasize regulatory stability and predictable frameworks (“regulatory stability over time, harmonized transposition of EU policies at national level, cross-border recognition of Guarantees of Origin”), supported by a clear market environment with secured demand (“offtakers long-term commitment,” “long-term contracts,” “market creation/certainty of offtakers,” “having pre-arranged off-takers,” “offtake agreements at the right price (willingness to pay),” “customers!”).
Respondents also highlighted the importance of financial and economic viability (“return on investment,” “business case,” “financial subsidies or grants; costs vis-à-vis other technologies,” “currently, the prices are quite high, especially for hydrogen-related products transportation import/export,” “price,” “the benchmark/cost of other alternatives”) as well as cost reduction for green hydrogen itself (“the cost of green hydrogen”).
Several answers pointed to the need for supportive infrastructure and affordable energy inputs (“infrastructure-building support,” “availability of low-cost renewable energy for the project”), along with execution capability and collaboration (“relative prices of alternatives/execution experience consortia building/value chain creation”).
Respondents also mentioned regulatory simplification (“the lower bureaucratic hurdles, the higher the try-it-out incentive”) and policy instruments that shift the playing field (“effective carbon price and reduction of fossil fuel subsidies”). Finally, some pointed to institutional missions and non-financial decision drivers (“constitutional values (the mission) of the institution…”), showing that choices are not purely economic.
4.2. Barriers a Company Faces When Considering Investment in Green Hydrogen Projects
Similarly, before testing the third and fourth hypothesis (H3, H4), the authors performed some descriptive analysis, which show that “high capital costs” stand out as the most critical barrier, with a weighted score selected by 70.3% of respondents and dominating both the continuous and binary metrics. This reflects a strong consensus that the high upfront investment requirements represent the single greatest challenge for companies considering green hydrogen projects.
“Regulatory uncertainty” (46.6%) and “lack of infrastructure (storage, transport)” (40.7%) follow as major barriers, emphasizing the importance of policy stability and the availability of hydrogen transport and storage solutions. “Limited market demand” (39.8%) and “high operating costs” (36.0%) were also frequently cited, indicating persistent concerns around commercial viability and the cost of ongoing operations.
All remaining barriers, including “availability of renewable electricity” (13.6%), “technological uncertainty” (11%), “grid connection” (8.1%), “supply chain limitations” (7.2%), “skilled workforce shortage” (5.5%), “public acceptance” (5.5%), and “permitting” (5.1%), were selected far less often, suggesting they are secondary considerations relative to financial, regulatory and infrastructure-related issues.
Table 5 presents the weighted scoring approach (0–3) applied to respondents’ rankings of perceived barriers to green hydrogen investment. The SCORE variables provide a continuous measure of each barrier’s relative importance, whereby the first barrier received, as indicated previously, three points, the second two points, and the last one received one point, with zero points allocated to the unselected options.
Table 5.
Score of individual barriers a company faces when considering investment in green hydrogen projects, as perceived by respondents (SCORE variables).
The TOP3 variables complement this measure by indicating the proportion of respondents who included each barrier among their top three, thus capturing prioritization behavior.
Diving deeper into the data, Table 6 shows that “high capital costs” not only have the highest overall selection (70.3%) but are also disproportionately ranked as the top barrier, with 41.9% of all respondents placing it first. This confirms that capital intensity is viewed as the single most pressing challenge, rather than simply one of many.
Table 6.
Prioritization of barriers to green hydrogen investment (ranked 1st, 2nd and 3rd) and overall top 3 selection rate by respondents (TOP3 variables).
“Limited market demand” (15.3%) and “regulatory uncertainty” (13.1%) emerge as the second and third most common first-ranked barriers, respectively. This suggests that concerns about market maturity and policy stability are not only widespread but often considered the most decisive factors after capital costs.
Another noteworthy finding is that although the “availability of renewable electricity” was selected by only 13.6%, it is ranked third disproportionately often (9.3%), suggesting that respondents acknowledge it as a constraint but not necessarily the dominant one.
4.3. Differences in Perceptions of Barriers and Incentives Across Groups
Prior to testing the fifth hypothesis (H5), the authors performed a descriptive analysis, which indicates that perceptions vary across stakeholder groups with most incentives being widely shared, but with some differences in barriers’ perception.
For barriers, “public acceptance” differs according to organizational role, while “limited market demand” perception differs by organization type. For incentives, some differences arise with regard to the perception of “public–private partnerships”, which are preferred by non-technological providers and stakeholders who have contact with the Romanian market.
Figure 4 shows the top three barriers versus the top three incentives picked by respondents when it comes to companies’ decision to invest in green hydrogen projects.
Figure 4.
Top 3 barriers (yellow) and incentives (blue) perceived by surveyed participants regarding green hydrogen adoption.
To better understand these results, several statistical tests were run to reveal whether there are different perceptions when it comes to incentives and barriers across groups, i.e., depending on the role and type of the organization, gender, managerial role of respondents, or contact with the Romanian market.
When it comes to incentives, across all actor groups, “financial subsidies or grants”, “regulatory mandates or standards”, and “public policies or high-level strategies” were the most frequently selected incentives.
Diving deeper, performing multiple Chi-square tests helped analyze whether incentive preferences differed across actor groups (H1). These analyses revealed that most incentives were selected at similar rates across groups when it comes to the type of organization and its main role (p > 0.05), suggesting broadly shared priorities. However, one statistically significant association emerged.
As shown in Table 7, respondents who were not technology providers or equipment manufacturers were more likely to select “public–private partnerships” (97.3%) compared to those who were (88.3%). This suggests that non-technology actors express relatively stronger support (1 = selected, 0 = not selected) for public–private partnerships as a preferred incentive mechanism (χ2 = 5.11, df = 1, p = 0.024). Therefore, the first hypothesis (H1) is partially supported.
Table 7.
Cross-tabulation for preference in public–private partnerships among technology providers or equipment manufacturers and other organizations.
When it comes to individual characteristics (H2), like gender, a Chi-square test resulted in a statistically significant association between gender and the selection of “Other” incentives (χ2 = 8.65, df = 2, p = 0.013). Women were less likely than men to select “Other”, but the small number of respondents identifying as “Other” gender makes this subgroup result less reliable. However, these findings still suggest some gender-based differences in preferences for policy incentives outside the predefined categories.
The Chi-square test of independence failed to show a significant association between the managerial role and any of the incentive variables, which suggests that both groups had similar preferences.
Further, as shown in Table 8, Chi-square tests of independence revealed significant differences in preference for “public–private partnerships” (χ2 = 6.20, df = 2, p = 0.045), with respondents who had contact with Romania being more likely to select “public–private partnerships” than those with no contact.
Table 8.
Cross-tabulation for preference in “public–private partnerships” among actors who have contact with Romania in their work or research.
A significant difference also emerged for the “Other” category of incentives (χ2 = 7.41, df = 2, p = 0.025), indicating that participants with Romanian market contact were more likely to propose additional policy measures not covered by the predefined list. No significant differences were observed for the remaining incentives (p > 0.05).
Therefore, the second hypothesis (H2) is partially supported, as some gender differences emerged, and because incentive preferences differ across groups depending on whether they reported having contact with Romania in their work or research.
Regarding barriers (H3), a Kruskal–Wallis H test resulted in statistically significant variations in perceptions of “public acceptance” across organizational roles (H = 22.16, df = 9, p = 0.008), with respondents’ roles influencing how strongly this barrier was rated. No other barriers were statistically significant across roles (all p > 0.05), although “skilled workforce shortage” approached significance (p = 0.054).
Similarly, when comparing by organization type, as shown in Table 9, a statistically significant difference was found for “limited market demand” (H = 12.83, df = 5, p = 0.025) with SMEs and non-profit/NGOs rating it as more severe than large corporations and government actors.
Table 9.
Kruskal–Wallis H test comparing barrier severity scores and organization types.
All other barriers showed no statistically significant differences across organization types (p > 0.05). These findings therefore partially support the third hypothesis (H3), as only “limited market demand” significantly varied by organization type.
When analyzing the data on individual characteristics (H4), no statistically significant differences were observed for gender (Kruskal–Wallis, all p > 0.05) or managerial role (Mann–Whitney U tests, all p > 0.05), suggesting that barrier perceptions are broadly shared across these groups, irrespective of these characteristics.
Further, although mean ranks differed slightly between respondents with and without Romanian market contact, these differences were not statistically significant, indicating that market exposure to Romania does not substantially alter barrier perception. Therefore, the fourth hypothesis (H4) was rejected.
4.4. Correlations Between Incentives and Barriers to Green Hydrogen Adoption
The correlation analysis between perceived barriers and incentives (H5), whose key results are summarized in Table 10, provides further insights into the underlying structure of respondents’ perceptions.
Table 10.
Significant correlations between incentives and barriers to green hydrogen adoption.
Several statistically significant negative associations emerged among barriers, suggesting that stakeholders tend to emphasize some obstacles at the expense of others. For example, “high capital costs” were negatively correlated with “regulatory uncertainty” (ρ = −0.25, p < 0.001), “limited market demand” (ρ = −0.227, p < 0.001), “grid connection” (ρ = −0.17, p = 0.007), and the “availability of renewable electricity” (ρ = −0.194, p = 0.003). This indicates that actors who perceive capital intensity as the dominant challenge may downplay institutional or infrastructural barriers, pointing toward differentiated priorities across stakeholder groups.
At the same time, correlations between barriers and incentives suggest alignment between perceived challenges and preferred policy responses. Respondents who identified “limited market demand” as a severe barrier were more likely to propose additional incentives beyond the predefined list (ρ = −0.202, p = 0.002), underlining the perceived need for innovative or context-specific support mechanisms.
Similarly, concerns over “public acceptance” were negatively correlated with “regulatory mandates or standards” (ρ = −0.168, p = 0.01), while “high operating costs” correlated negatively with a lower likelihood of prioritizing “public–private partnerships” (ρ = −0.201, p = 0.002).
Patterns also emerged among incentives themselves. Strong positive correlations between “financial subsidies or grants” and “tax incentives” (ρ = 0.295, p < 0.001), as well as between “public policies” and “regulatory mandates or standards” (ρ = 0.169, p = 0.009), suggest that respondents perceive incentives in clusters, e.g., financial instruments on the one hand, and institutional or regulatory frameworks on the other. This is rather intuitive and unsurprising, but this clustering highlights the existence of two complementary policy pathways: reducing financial risks and costs for early technology adopters, and providing institutional clarity and stability in the long run.
Therefore, the fifth hypothesis (H5), stating that there are significant correlations between the choice of perceived barriers and opted incentives to green hydrogen adoption, is supported.
5. Discussion
5.1. Advancement of the Existing Knowledge Base
The present study builds upon and expands the growing literature on green hydrogen adoption by advancing an actor-centric, perception-based interpretation of the barriers and incentives of green hydrogen technologies using renewable-sourced electricity, framed within the Multi-Level Perspective on sociotechnical transitions.
While there is a rich body of research on green hydrogen from a techno-economic point of view, including feasibility, system constraints or policy design options, there is comparatively little research into how actors across the hydrogen value chain and related sectors are interpreting and prioritizing such barriers and incentives—beyond public perceptions of the technology.
Beyond widely recognized barriers to green hydrogen adoption, like high capital costs, regulatory uncertainty and infrastructure gaps, the present study reveals, as a key point, that market demand, public acceptance and incentives like public–private partnerships are viewed differently by actors across various groups.
It is important to note that few green hydrogen studies include Romania, and none were found to be gathering information from professionals from the industry, which is a key novelty of the present study. This was also reflected in the high number of survey participants that showed interest in participating in future research (e.g., willingness to participate in in-depth interviews in the future).
Results reveal no major differences observed between the gender or managerial role of individual actors, while there is a limited emphasis put by actors on the technological uncertainty. The analysis did not reveal any major differences in terms of geographical market exposure, although some incentives were favored by actors who have contact with Romania.
5.2. Comparison with Previous Research
Consistent with previous research on sociotechnical transitions, which emphasizes the importance of aligning actor expectations and resources within the sociotechnical regime [10,30,36,52], the findings suggest that—while there is broad consensus on many of the most pressing issues, like high capital costs, regulatory uncertainty, and infrastructure gaps—there are also meaningful differences across certain groups that highlight the heterogeneity of individual and organizational characteristics.
High capital costs and the lack of infrastructure are often cited as key barriers in policy-relevant publications [2], which is in line with the present findings and the relevant literature [15,52]. However, unlike the present results and previous research [15,53], regulatory uncertainty has sometimes been overlooked as a key barrier both in some policy-relevant documents [2], as well as in about half of the research body included in the previous literature review [52].
This finding is supported by quantitative analysis, but also by the qualitative assessment of respondents’ replies. Respondents had the option to add comments for incentives, but none indicated innovation or R&D or any other related technological terms as needing incentives. On the contrary, all of those who added comments indicated either regulatory measures and—more importantly—market-related incentives like “long-term contracts”, “offtake agreements at the right price (willingness to pay)”, “market creation/certainty of offtakers”, “having pre-arranged off-takers”, “price”, “business case”, “business opportunities, e.g., green products”, and “effective carbon price and reduction in fossil fuels subsidies”.
This finding suggests that there is a research gap around the identification of supportive regulations and the creation of favorable market conditions for green hydrogen to advance at the desired adoption level.
The statistically significant difference observed for public acceptance across organizational roles indicates that some actor groups are more sensitive to societal buy-in and social legitimacy concerns than others. However, public acceptance, a skilled workforce shortage and permitting are among the least cited barriers to green hydrogen adoption.
This finding is in stark contrast with the debate on public acceptance or social acceptability for hydrogen [53] or for renewable energy, which has benefitted from an important body of research in past decades [54]. It could be explained by the fact that renewable energy has gained such a level of public acceptance that its use for green hydrogen production is assumed to be accepted socially, which is supported by some research [17], or that stakeholders consider that this aspect does not represent a barrier (yet) since green hydrogen technologies are still in their infancy. Future research would need to shed further light on this.
Another new element of the presented results lies in the fact that the analysis focuses on the perceptions of the stakeholders/actors/respondents in the hydrogen industry and related sectors, while most of the research on hydrogen focuses on the economic and technical features of green hydrogen technology. Few studies have surveyed the stakeholders’ perspective, and when they have done it, the number of participants is relatively low (e.g., 15 organizations [5], 58 participants [19], or 73 respondents [20]).
Unlike previous research results, the technological aspects were perceived as less critical in the present study [5,28,55] compared to other barriers when it comes to factors influencing a company’s decision to invest in such projects. Similarly, some research highlights the need for renewable capacity for hydrogen production [16], but this ranks only sixth in the list of barriers listed by the surveyed professionals in this study with 13.5% of respondents citing it. However, other barriers and incentive perceptions are aligned with the recent literature.
Stakeholders with Romanian market contact showed higher support for public–private partnerships, which indicates that such arrangements are not a preferred solution in all cases, but such incentives could be favored in less developed green hydrogen markets like Romania.
Moreover, previous studies have included green versus other (“blue” [52] or “non-renewable sources” [20] or “low-carbon hydrogen” [18]) in their studies, while the present analysis dived deeper into one of the least polluting technological options, as per the IPCC, i.e., this study focused on green hydrogen produced with renewable-sourced electricity.
Unlike previous research that includes almost exclusively men among the respondents to their surveys, like a case study on India where 90% of survey participants were men [26], the present research endeavor covers both men and women, with women representing 36.9% of respondents. Therefore, conclusions on gender perspectives can be drawn with confidence.
Interestingly, gender and managerial role did not significantly influence perceptions of barriers, pointing toward a broadly shared understanding of structural challenges across these demographic dimensions. This finding is reassuring in terms of policy alignment since it suggests that interventions targeted at removing key barriers are likely to be widely supported across diverse stakeholder groups.
By providing statistical comparisons across the socio-demographic characteristics of the respondents surveyed and systematically capturing differences which are not common in the green hydrogen literature to date, this study contributes to the energy transition literature and supports the design of more targeted, actor-sensitive policy and business strategies for accelerating green hydrogen adoption in the long term.
5.3. Interpretation Through the MLP Lens
The MLP views climate change as putting pressure on the current sociotechnical system at the landscape level, requiring changes that are both technical and policy-related. Negative environmental impacts are seen as externalities, whereby actors within an existing regime are deemed to show resistance to change, for example by downplaying negative environmental impacts. Such resistance can, however, be counteracted by other actors including the civil society [35].
By anchoring the analysis in the MLP, the analysis goes a step further than listing barriers and incentives by conceptualizing these as actor-specific interpretations of regime misalignments and landscape pressures. Through this theoretical lens, the study demonstrates that even well-documented barriers to green hydrogen adoption—like high capital costs, regulatory uncertainty or the lack of necessary infrastructure—are heterogeneously perceived across the current sociotechnical system in place, and vary also depending on the institutional context analyzed.
The main theoretical contribution is that actor heterogeneity is important both for diffusing the innovation itself, i.e., green hydrogen production technologies, but also for how barriers and incentives are framed from a cognitive point of view, as the transition towards a low-carbon economy is advancing. From an MLP standpoint, the cognitive dimension is equally important as the normative and regulative ones.
Per the MLP, niche allows new technologies like green hydrogen to develop in a protected space by less stringent rules. However, moving beyond that level it becomes clear that rules, regulations and policies that are “legally sanctioned”, “morally governed” and/or “culturally supported” become increasingly important [35]. The present results, indicating that regulatory uncertainty is negatively correlated with high capital costs and public acceptance barriers, are therefore coherent with the MLP theoretical framing in the sense that as technology has advanced, the regime level pressures become more predominant as perceived by actors across various groups.
More precisely, actors do not perceive public–private partnerships equally but instead perceptions reflect their structural position within the energy transition, e.g., technology providers or equipment manufacturers are highly represented among respondents that do not identify public–private partnerships to be of great value to them. This hints towards the fact that public–private partnerships are more regime-level instruments than niche-level instruments that can help advance green hydrogen technology.
This is confirmed by the fact that respondents with access to the Romanian market support public–private partnerships, which highlights that the national context (at the regime and landscape level) influences actors’ perception of needed incentives, so actors positioned at the regime level, i.e., the Romanian regulatory context, favor such public–private arrangements. Therefore, barriers and incentives to hydrogen adoption are not to be treated as fixed structural elements, but assessed, as the MLP theory indicates, from various points of view depending on where the actors are positioned in the energy transition.
The significant difference in perceptions of limited market demand between organization types further reinforces the idea that market formation remains a central challenge for smaller and mission-driven actors such as SMEs. These organizations often operate closer to niche-level experimentation and may face higher risks when demand is uncertain.
In line with the MLP framework on sociotechnical transitions, this finding underscores the tension between niche innovations seeking scale and the inertia of existing market structures [11]. Therefore, depending on where actors are positioned on the hydrogen value chain (production, transport, end-use, etc.), the type and role of organization they represent, and to a lesser extent to which markets they are exposed, will impact how they perceive and prioritize various enabling and hampering factors for green hydrogen adoption. This reflects their proximity to niche innovation, regime stability or landscape pressures, as per MLP concepts.
Therefore, the present findings are aligned with the idea that green hydrogen, although very promising and supported by many types of stakeholder, including technology providers and policy-makers, still lacks very clearly defined regulations. This is particularly important in the debate on how to accelerate the transition [56] from today’s fossil fuel-dominated energy system towards a sustainable, low-carbon energy system, including the production of green hydrogen from renewable-sourced electricity.
Overall, results show that the market-specific design of incentives is perhaps less important than the necessity of designing policy incentives for green hydrogen adoption, taking actor-specific aspects into account.
Beyond mapping results to MLP levels, several analytical implications emerge. The fact that capital costs are overwhelmingly perceived as the dominant barrier across all actor groups, regardless of their position within the sociotechnical system, suggests that green hydrogen has not yet crossed the threshold from protected niche experimentation to regime-level market competition. In MLP terms, when financial viability remains the primary concern even for regime-level incumbents, it signals that the technology has not yet achieved the cost reductions and market integration necessary for a regime shift [10,12]. This cross-cutting consensus on capital costs functions, in effect, as a diagnostic indicator of the transition stage.
The divergence observed for specific barriers and incentives, however, is theoretically instructive. Public acceptance was perceived differently across organizational roles, with actors closer to the public interface, such as public authorities and consultancies, rating it more highly than technology providers. This pattern is consistent with the multi-dimensional nature of regime alignment emphasized in the MLP.
While niche actors focus on the technical-economic dimension, regime and landscape actors must also navigate the socio-cultural dimension of acceptance and legitimacy [35]. The stronger preference for public–private partnerships among respondents with Romanian market exposure reflects a regime-level dynamic specific to less mature markets. Where the incumbent regime has not yet developed supportive institutional arrangements for the new technology, collaborative instruments become essential for creating the protective space that niche innovations require [11].
This finding suggests that the function of public–private partnerships shifts depending on market maturity. In developed hydrogen markets, they serve to scale existing innovations, whilst in emerging markets, they serve the more fundamental purpose of establishing institutional infrastructure for the niche itself.
The negative correlation between high capital costs and regulatory uncertainty provides additional analytical depth. Actors who prioritize financial barriers tend to emphasize regulatory ones to a lesser extent, and vice versa. From an MLP, this trade-off indicates that stakeholders’ cognitive frameworks are shaped by the specific pressures they face at their respective level.
This implies that niche actors experience financial constraints most acutely, while regime actors are more exposed to regulatory misalignment. This differentiated perception matters for policy. If interventions target only one dimension of the transition, whether financial or regulatory, they risk failing to address the constraints most salient to all actor groups simultaneously. A transition-sensitive policy design would therefore need to combine financial de-risking instruments with regulatory clarity, calibrated to the specific actor groups and market contexts involved.
5.4. Limitations
As with any research, the present analysis has several limitations which are acknowledged as follows. Firstly, because the non-probability snowball sampling was applied, authors cannot draw general conclusions from the results. While this approach is appropriate for accessing a specialized and hard-to-reach population of hydrogen professionals, it may introduce self-selection bias and does not allow statistical inference to a broader population.
Secondly, the present study relies on self-reported perceptions, which reflect subjective evaluations rather than objective constraints. While this is consistent with the study’s theoretical focus on actor perceptions, it implies that results capture how barriers and incentives are interpreted, not necessarily how they operate in practice.
Thirdly, having designed the study to be cross-sectional, the analysis shows a single point in time, while views may change as time passes by, particularly as hydrogen markets mature and policy frameworks change.
Finally, although the survey includes respondents with diverse geographical exposure, the analytical focus on Romania as a case study lens may limit the applicability of some findings to other institutional contexts.
5.5. Implications for Policy, Regulation and Businesses
Despite these limitations, the study provides important implications for policy, regulatory coordination, future research agendas, and strategic decision-making by businesses involved in the green hydrogen sector.
Firstly, the clear focus on capital costs confirms that financial de-risking instruments are indispensable to advance or accelerate green hydrogen adoption at scale, especially in an early project development phase. At the same time, the observed differences across actor groups indicate that one-size-fits-all policy instruments are likely to be ineffective. For example, since SMEs appear more sensitive to market demand constraints, these would likely benefit from demand-side instruments like offtake guarantees, contracts for difference (CfDs) or similar.
Secondly, the importance of regulatory uncertainty emphasized by respondents underlines that stable, predictable and supportive regulatory frameworks are of great value in the low-carbon transition, especially regarding green hydrogen classification and certification schemes, including those for cross-border trade. In line with the MLP, this highlights that reducing regime uncertainty helps niche innovations to be scaled up. This implies that regulators need to direct their attention towards the green hydrogen sector and develop adequate regulatory frameworks, if they are not to become a bottleneck as this new technology expands its user base.
Thirdly, differences observed for public–private partnerships highlight that institutional coordination with market actors is especially needed in less mature markets, like Romania, where creating a green hydrogen ecosystem needs different collaboration mechanisms compared to more developed green hydrogen markets.
For businesses, these results suggest that strategic positioning within the green hydrogen value chain does not only influence investment decisions, but also the organizations’ expectations in terms of desired policy support. Companies operating closer to the niche level may prioritize technological and financial support over market creation and supportive regulations compared to regime-level actors.
Moreover, the importance of the perceived limited market demand among SMEs implies that smaller players may need to adopt cooperative strategies, such as forming consortia or benefiting from long-term offtake agreements, to reduce exposure to disproportionally high capital costs.
5.6. Potential Future Research Directions
Future research could build on these findings and the limitations of this study by combining quantitative and qualitative methods, for example by adding case studies and interviews to complement and validate the statistical results presented. Such an approach would allow researchers to uncover more insights into the differences in perceptions. Research into differences across regions inside and outside the European Union could help unearth further relevant insights. A cross-border perspective or a global angle could uncover even more interesting policy, research, and business aspects.
Longitudinal studies could also track the evolution of such perceptions over time as market adoption of green hydrogen technologies advances. Comparing experts’ perceptions compared to the public as distinct groups in a given market could also provide interesting insights into the barriers and incentives required for this technology to pick up.
Shedding light on favorable regulatory frameworks and how to ensure the necessary market conditions for businesses to thrive and adopt green hydrogen in relevant end-use sectors is of paramount importance in the light of the present findings. Since a sociotechnical transition to green hydrogen will likely impact societies [57], policies, polities and politics for decades to come, researching green hydrogen beyond technical/engineering and financial/economic aspects is increasingly important. One respondent’s reply is particularly striking, since it highlighted that fossil fuel subsidies would need to be reduced and an effective carbon price would need to be in place for green hydrogen to be effectively incentivized. More light needs to be shed on such topics.
Moreover, the theoretical foundation of the study, as well as the inclusion of the Romanian geographical context as a differentiating element across groups, is innovative and can be expanded in future studies to understand the perceptions of various actor groups across mature and emerging hydrogen markets.
Last, but not least, combining perception-based data with project-level or policy outcome data could help bridge the gap between subjective evaluations and observed market developments.
6. Conclusions
From an empirical point of view, the present study confirms that high capital costs are by far perceived to be the most critical barrier to green hydrogen investments, followed by regulatory uncertainty and the lack of necessary infrastructure, which is in line with previous research.
Beyond the capital-intensive and policy-dependent character of green hydrogen technologies, the analysis also reveals nuances in terms of the emergence of such barriers across actor groups. More precisely, public acceptance is perceived differently across organizational roles, while limited market demand is deemed to be a more severe barrier by actors that are positioned further away from the niche level, like SMEs, compared to other, larger private actors, or public sector actors, that are closer to the regime and landscape level, as defined by the Multi-Level Perspective on sociotechnical transitions. This suggests that market maturity is experienced depending on the scale, size and the level of resources of an organization, rather than the actual geographical market they find themselves in.
Regarding incentives, although most receive similar support across groups analyzed, public–private partnerships stand out as a key instrument depending on the organizational role and the Romanian market exposure. In other words, actors without a direct technological focus, as well as actors that have knowledge and/or experience with the Romanian market, put a greater emphasis on such collaborative arrangements, hinting towards a preference of such instruments in less mature hydrogen markets.
The correlation analysis highlights systematic associations between perceived barriers and incentives, indicating that respondents tend to perceive financial, regulatory and infrastructure-related challenges as interconnected rather than isolated obstacles. Such associations are interpreted as co-occurring, rather than having a causal relationship, in line with the exploratory design of the study.
Beyond its immediate empirical context, this study demonstrates that the challenges facing green hydrogen adoption and the necessary incentives are not only of an economic and technical nature, but are also dependent on their interpretation by actors from both the public and private sector. By showing systematic nuances in barrier and incentive interpretation, depending on the niche, regime and landscape position of actors, this article highlights the importance of incorporating actor heterogeneity into both policy design and transition theory.
These findings carry implications that go beyond the empirical context reported here. If actors positioned at different levels of the sociotechnical system consistently interpret the same constraints through different cognitive lenses, then the theoretical framework used to analyze transitions must account for this perceptual variation.
This study refines the application of the Multi-Level Perspective by shifting attention from the structural positions that actors occupy within the sociotechnical system to the cognitive frames through which they interpret the constraints and opportunities associated with a niche technology.
Classical applications of the MLP have predominantly analyzed transitions in terms of structural dynamics, i.e., how niche innovations build momentum, how regime actors resist or accommodate change, and how landscape pressures create windows of opportunity [10,12,36]. What has received less systematic treatment is the role of perception itself as a variable that mediates between structural position and strategic behavior.
The present findings suggest that actors situated at different MLP levels face the same set of constraints but perceive and prioritize them differently, which in turn shapes the policy instruments they consider legitimate and the investment decisions they are prepared to take. The cognitive dimension of sociotechnical transitions, so how actors mentally frame technology’s barriers and enablers, constitutes a mechanism that influences transition dynamics independently of the material and institutional structures that the MLP typically assesses.
Recognizing this perceptual mediation has consequences for transition theory. It implies that regime alignment is not achieved solely through changes in technology costs, regulations, or infrastructure, but also through shifts in how actors at each level interpret and respond to those changes [35]. Future theoretical work on sociotechnical transitions should integrate cognitive and perceptual dimensions more explicitly into the analytical architecture of the MLP framework.
Author Contributions
Conceptualization, E.O. and M.S.; methodology, E.O. and M.S.; software, E.O.; validation, M.S.; formal analysis, E.O. and M.S.; investigation, E.O.; resources, E.O.; data curation, E.O.; writing—original draft preparation, E.O.; writing—review and editing, E.O. and M.S.; visualization, E.O.; supervision, E.O. and M.S.; project administration, E.O.; funding acquisition: E.O. and M.S. All authors have read and agreed to the published version of the manuscript.
Funding
This paper was co-financed by the Bucharest University of Economic Studies as part of the PhD program.
Institutional Review Board Statement
The study was conducted in accordance with the Declaration of Helsinki, and approved by the Faculty of Business Administration, in foreign languages, Bucharest University of Economic Studies, Romania, as per letter of 27 October 2025.
Informed Consent Statement
Informed consent was obtained from all subjects involved in the study.
Data Availability Statement
The data presented in this study are available on request from the corresponding author. The data are not publicly available due to privacy considerations regarding survey respondents.
Conflicts of Interest
The authors declare no conflicts of interest.
Abbreviations
The following abbreviations are used in this manuscript:
| CAPEX | Capital expenditure |
| CfD | Contract for difference |
| EPC | Engineering, procurement, and construction |
| EU | European Union |
| GDP | Gross domestic product |
| IPCC | Intergovernmental Panel on Climate Change |
| MLP | Multi-Level Perspective (on sociotechnical transitions) |
| NGO | Non-governmental organization |
| OPEX | Operating expenditure |
| PPP | Public–private partnership |
| R&D | Research and development |
| Ref. | Reference |
| SME | Small and medium-sized enterprise |
| SPSS | Statistical package for the social sciences |
Appendix A. Survey Questions
- What is your gender? *
- Woman
- Man
- Other
- What is your organization’s primary role? Select all that apply.*
- Project developer or Engineering, Procurement and Construction (EPC)
- Energy utility or supplier
- Industrial end-user
- Transport or logistics company
- Technology provider or equipment manufacturer
- Financial or investment institution
- Public authority or regulator (e.g., ministry, agency)
- Research or academic institution
- Consultancy or think-tank
- Other: […]
- What type of organization is it? *
- Start-up
- Small or medium-sized enterprise (SME, <250 employees)
- Large corporation (250+ employees)
- Government or public sector organization (e.g., public university)
- Nonprofit or NGO
- Freelance/independent/self-employed
- Other: […]
- Do you have a managerial role? *
- Yes
- No
- Other: […]
- How would you rate your knowledge of green hydrogen? *
- 1 = No knowledge
- 2
- 3
- 4
- 5 = Expert knowledge
- Do you work in Romania or do you have any contact with Romania in your work/research? If not, which country is predominant in your work/research? *
- Yes
- No
- Other: […]
- What do you think are the main incentives that influence a company’s decision to invest in green hydrogen solutions or do business with green hydrogen? Select all that apply. *
- Public policies or high-level strategies
- Regulatory mandates or standards
- Financial subsidies or grants
- Tax incentives
- Public–private partnerships
- None/Not applicable
- Other: […]
- What do you think are the biggest barriers a company faces when considering investment in green hydrogen projects? Rank the top 3, with the 1st being the most important.
| 1st Choice | 2nd Choice | 3rd Choice | |
| High capital costs | |||
| High operating costs | |||
| Regulatory uncertainty | |||
| Permitting | |||
| Lack of infrastructure (storage, transport) | |||
| Limited market demand | |||
| Technological uncertainty | |||
| Skilled workforce shortage | |||
| Grid connection | |||
| Availability of renewable electricity | |||
| Supply chain limitations | |||
| Public acceptance |
* The asterisk indicates that answering these questions was compulsory.
References
- IRENA. World Energy Transitions Outlook 2024. Available online: https://www.irena.org/Publications/2024/Nov/World-Energy-Transitions-Outlook-2024 (accessed on 22 September 2025).
- IEA Global Hydrogen Review 2025—Analysis. Available online: https://www.iea.org/reports/global-hydrogen-review-2025 (accessed on 9 October 2025).
- Niemsakul, J.; Hiranmahapol, S.; Janmontree, J.; Zadek, H.; Ransikarbum, K. Analysis of Barriers for Hydrogen-Fueled Logistics under Integrated Sustainability: A DEMATEL-TOWS Framework. J. Clean. Prod. 2025, 513, 145720. [Google Scholar] [CrossRef] [Scilit]
- Subedi, A.; Bucelli, M.; Paltrinieri, N. Reframing Safety Barriers as Socio-Technical Systems: A Review of the Hydrogen Sector. Saf. Sci. 2025, 192, 106995. [Google Scholar] [CrossRef] [Scilit]
- Bolz, S.; Thiele, J.; Wendler, T. Regional Capabilities and Hydrogen Adoption Barriers. Energy Policy 2024, 185, 113934. [Google Scholar] [CrossRef] [Scilit]
- Shahzad, S.; Alrumayh, O.; Almutairi, A.; Altamimi, A. Green Hydrogen: A Review of Technological Innovations, Economic Viability, and Global Prospects. Renew. Sustain. Energy Rev. 2026, 225, 116162. [Google Scholar] [CrossRef] [Scilit]
- Fan, Y.; Shi, L. The Role of Government Fiscal Incentives in Green Technological Innovation: A Nonlinear Analytical Framework. Int. Rev. Econ. Financ. 2025, 103, 104529. [Google Scholar] [CrossRef] [Scilit]
- Leuthold, A.; Terrapon-Pfaff, J.; Viebahn, P. Implementation Factors for Green Hydrogen Projects: A Systematic Literature Review. Sustain. Energy Technol. Assess. 2025, 82, 104555. [Google Scholar] [CrossRef] [Scilit]
- IPCC Climate Change 2022: Mitigation of Climate Change. Contribution of Working Group III to the Sixth Assessment Report of the Intergovernmental Panel on Climate Change. Available online: https://www.ipcc.ch/report/ar6/wg3/chapter/chapter-6/ (accessed on 10 September 2025).
- Geels, F.W. Technological Transitions as Evolutionary Reconfiguration Processes: A Multi-Level Perspective and a Case-Study. Res. Policy 2002, 31, 1257–1274. [Google Scholar] [CrossRef] [Scilit]
- Kemp, R.; Schot, J.; Hoogma, R. Regime Shifts to Sustainability through Processes of Niche Formation: The Approach of Strategic Niche Management. Technol. Anal. Strateg. Manag. 1998, 10, 175. [Google Scholar] [CrossRef] [Scilit]
- Geels, F.W. Processes and Patterns in Transitions and System Innovations: Refining the Co-Evolutionary Multi-Level Perspective. Technol. Forecast. Soc. Change 2005, 72, 681–696. [Google Scholar] [CrossRef] [Scilit]
- Ocenic, E.; Tanțău, A. Redefining the Hydrogen “Colours” Based on Carbon Dioxide Emissions: A New Evidence-Based Colour Code. Proc. Int. Conf. Bus. Excell. 2023, 17, 111–121. [Google Scholar] [CrossRef] [Scilit]
- Ocenic, E. Beyond the Rainbow: Aligning Hydrogen Color Codes with CO2 Emissions for a Transparent Energy Transition. Ovidius Univ. Annals. Econ. Sci. Ser. 2025, 25, 215–224. [Google Scholar] [CrossRef] [Scilit]
- Iacob, I.; Morgan, M.G.; Curtis, S. Barriers to Creating a Market for Hydrogen: Insights from Global Roadmaps and Stakeholders in the United States. Energy Res. Soc. Sci. 2025, 121, 103947. [Google Scholar] [CrossRef] [Scilit]
- Franco, A. Green Hydrogen and the Energy Transition: Hopes, Challenges, and Realistic Opportunities. Hydrogen 2025, 6, 28. [Google Scholar] [CrossRef] [Scilit]
- Vespa, M.; Hildebrand, J. Who Is in and How? A Comprehensive Study on Stakeholder Perspectives in the Green Hydrogen Sector in Luxembourg. Hydrogen 2025, 6, 87. [Google Scholar] [CrossRef] [Scilit]
- Dua, R.; Shabaneh, R. An Expert Opinion-Based Perspective on Emerging Policy and Economic Research Priorities for Advancing the Low-Carbon Hydrogen Sector. Energy Sustain. Dev. 2025, 88, 101774. [Google Scholar] [CrossRef] [Scilit]
- Gordon, J.A.; Balta-Ozkan, N.; Nabavi, S.A. Gauging Public Perceptions of Blue and Green Hydrogen Futures: Is the Twin-Track Approach Compatible with Hydrogen Acceptance? Int. J. Hydrogen Energy 2024, 49, 75–104. [Google Scholar] [CrossRef] [Scilit]
- Parente, C.; Teixeira, F.; Cerdeira, J. Stakeholders’ Perceptions of Hydrogen and Reflections on Energy Transition Governance. Energ. Sustain. Soc. 2024, 14, 15. [Google Scholar] [CrossRef] [Scilit]
- Medrano-Sánchez, E.J.; Ochoa-Tataje, F.A. Impact of Green Hydrogen on Climate Change in Peru: An Analysis of Perception, Policies, and Cooperation. Energy Convers. Manag. X 2024, 24, 100778. [Google Scholar] [CrossRef] [Scilit]
- Przybylowski, A.; Palewski, K.; Owczarek, T.; Przybylowski, A.; Palewski, K.; Owczarek, T. Hydrogen Vehicle Adoption: Perceptions, Barriers, and Global Strategies. Energies 2025, 18, 5467. [Google Scholar] [CrossRef] [Scilit]
- Cotton, M.; Cooper, C.; Milner, J.; Towers, L. Hydrogen Innovation and Just Transitions: Exploring Sociotechnical Configurations of Energy Futures in a Post-Industrial Community. Energy Res. Soc. Sci. 2025, 127, 104181. [Google Scholar] [CrossRef] [Scilit]
- Buchner, J.; Menrad, K.; Decker, T. Public Acceptance of Green Hydrogen Production in Germany. Renew. Sustain. Energy Rev. 2025, 208, 115057. [Google Scholar] [CrossRef] [Scilit]
- Bentsen, H.L.; Skiple, J.K.; Gregersen, T.; Derempouka, E.; Skjold, T. In the Green? Perceptions of Hydrogen Production Methods among the Norwegian Public. Energy Res. Soc. Sci. 2023, 97, 102985. [Google Scholar] [CrossRef] [Scilit]
- Harichandan, S.; Kar, S.K. Promoting Sustainable Industrialization by Exploring Workforce Perception towards Green Hydrogen Adoption. World Dev. Sustain. 2025, 7, 100252. [Google Scholar] [CrossRef] [Scilit]
- Falfushynska, H.; Holz, M.; Scott, C. Comparative Socio-Economic Analysis and Green Transition Perspectives in the Green Hydrogen Economy of Sub-Saharan Africa and South America Countries. Int. J. Hydrogen Energy 2025, 176, 151543. [Google Scholar] [CrossRef] [Scilit]
- Ingaldi, M.; Klimecka-Tatar, D.; Ingaldi, M.; Klimecka-Tatar, D. People’s Attitude to Energy from Hydrogen—From the Point of View of Modern Energy Technologies and Social Responsibility. Energies 2020, 13, 6495. [Google Scholar] [CrossRef] [Scilit]
- Beasy, K.; Lodewyckx, S.; Mattila, P. Industry Perceptions and Community Perspectives on Advancing a Hydrogen Economy in Australia. Int. J. Hydrogen Energy 2023, 48, 8386–8397. [Google Scholar] [CrossRef] [Scilit]
- Shan, R.; Kittner, N. Sector-Specific Strategies to Increase Green Hydrogen Adoption. Renew. Sustain. Energy Rev. 2025, 214, 115491. [Google Scholar] [CrossRef] [Scilit]
- Vallejos-Romero, A.; Cordoves-Sánchez, M.; Cisternas, C.; Sáez-Ardura, F.; Rodríguez, I.; Aledo, A.; Boso, Á.; Prades, J.; Álvarez, B.; Vallejos-Romero, A.; et al. Green Hydrogen and Social Sciences: Issues, Problems, and Future Challenges. Sustainability 2022, 15, 303. [Google Scholar] [CrossRef] [Scilit]
- Jensen, A.M.; Jensen, E.A.; Martin, D.; Wagoner, B. Evidence Synthesis: Public Perceptions of Hydrogen and Fuel Cell Technologies in the European Union 2025. Open Res. Eur. 2025, 5, 393. [Google Scholar] [CrossRef] [Scilit]
- Cheng, C.S.W. Does Time Matter? A Multi-Level Assessment of Delayed Energy Transitions and Hydrogen Pathways in Norway. Energy Res. Soc. Sci. 2023, 100, 103069. [Google Scholar] [CrossRef] [Scilit]
- Küffner, C. Multi-Level Perspective for the Development and Diffusion of Fuel Cell Heavy-Duty Trucks. Transp. Res. Part D Transp. Environ. 2022, 111, 103460. [Google Scholar] [CrossRef] [Scilit]
- Geels, F.W. From Sectoral Systems of Innovation to Socio-Technical Systems: Insights about Dynamics and Change from Sociology and Institutional Theory. Res. Policy 2004, 33, 897–920. [Google Scholar] [CrossRef] [Scilit]
- Geels, F.W.; Schot, J. Typology of Sociotechnical Transition Pathways. Res. Policy 2007, 36, 399–417. [Google Scholar] [CrossRef] [Scilit]
- World Bank GDP (Current US$)—Romania. Available online: https://data.worldbank.org (accessed on 16 January 2026).
- World Bank Carbon Intensity of GDP (Kg CO2e per 2021 PPP $ of GDP)—Romania. Available online: https://data.worldbank.org (accessed on 16 January 2026).
- Ritchie, H.; Rosado, P. CO2 and Greenhouse Gas Emissions. Available online: https://ourworldindata.org/co2-and-greenhouse-gas-emissions (accessed on 16 January 2026).
- Sandu, M.; Ocenic, E. Models of Economic Recovery Through Digitalization in the European Union: A Comparative Study on Energy Companies in Romania and Poland. Rev. Int. Comp. Manag. 2025, 26, 803–817. [Google Scholar] [CrossRef] [Scilit]
- Ocenic, E. “Green” Hydrogen Products and Their Economic End-Uses: A Statistical Perspective. Proc. Int. Conf. Bus. Excell. 2024, 18, 1197–1211. [Google Scholar] [CrossRef] [Scilit]
- Iordache, I.; Gheorghe, A.V.; Iordache, M. Towards a Hydrogen Economy in Romania: Statistics, Technical and Scientific General Aspects. Int. J. Hydrogen Energy 2013, 38, 12231–12240. [Google Scholar] [CrossRef] [Scilit]
- Iordache, I.; Schitea, D.; Gheorghe, A.V.; Iordache, M. Hydrogen Underground Storage in Romania, Potential Directions of Development, Stakeholders and General Aspects. Int. J. Hydrogen Energy 2014, 39, 11071–11081. [Google Scholar] [CrossRef] [Scilit]
- Dumitraşcu, M.; Roznoviețchi, I.; Sima, M.; Grigorescu, I.; Mitrică, B.; Micu, D.; Fălcescu, V.; Bulai, A.; Cheval, S. Public Perception of Climate Change Impacts and Sectoral Adaptation in Romania. Environ. Dev. 2026, 57, 101346. [Google Scholar] [CrossRef] [Scilit]
- Hussein, M.; Jen, T.-C.; Imoisili, P.E. South Africa Clean Energy Transition: The Future of Green Hydrogen Energy Technology. Energy Rep. 2025, 13, 5501–5511. [Google Scholar] [CrossRef] [Scilit]
- Genovese, M.; Cigolotti, V.; Jannelli, E.; Fragiacomo, P. Current Standards and Configurations for the Permitting and Operation of Hydrogen Refueling Stations. Int. J. Hydrogen Energy 2023, 48, 19357–19371. [Google Scholar] [CrossRef] [Scilit]
- Marocco, P.; Gandiglio, M.; Santarelli, M. Optimal Design of PV-Based Grid-Connected Hydrogen Production Systems. J. Clean. Prod. 2024, 434, 140007. [Google Scholar] [CrossRef] [Scilit]
- Alsheimer, S.; Dütschke, E.; Mattes, J. Regional Technology Legitimation: The Case of Green Hydrogen-Based Steelmaking. Geoforum 2026, 169, 104499. [Google Scholar] [CrossRef] [Scilit]
- Bisognin Garlet, T.; de Souza Savian, F.; Duarte Ribeiro, J.L.; Mairesse Siluk, J.C. Unlocking Brazil’s Green Hydrogen Potential: Overcoming Barriers and Formulating Strategies to This Promising Sector. Int. J. Hydrogen Energy 2024, 49, 553–570. [Google Scholar] [CrossRef] [Scilit]
- Bonesso, F.; D’Adamo, I.; Gastaldi, M.; Giannini, M. Green Hydrogen as a Sustainable Operations Strategy: A Socio-Economic Perspective. Sustain. Oper. Comput. 2025, 6, 1–14. [Google Scholar] [CrossRef] [Scilit]
- da Silveira Cachola, C.; Peyerl, D. Mapping Green Hydrogen Clusters in Brazil: A Data-Driven Approach for Industrial Decarbonization. Int. J. Hydrogen Energy 2026, 206, 153202. [Google Scholar] [CrossRef] [Scilit]
- Gordon, J.A.; Balta-Ozkan, N.; Nabavi, S.A. Socio-Technical Barriers to Domestic Hydrogen Futures: Repurposing Pipelines, Policies, and Public Perceptions. Appl. Energy 2023, 336, 120850. [Google Scholar] [CrossRef] [Scilit]
- De-León Almaraz, S.; Kocsis, T.; Azzaro-Pantel, C.; Szántó, Z.O. Identifying Social Aspects Related to the Hydrogen Economy: Review, Synthesis, and Research Perspectives. Int. J. Hydrogen Energy 2024, 49, 601–618. [Google Scholar] [CrossRef] [Scilit]
- Wüstenhagen, R.; Wolsink, M.; Bürer, M.J. Social Acceptance of Renewable Energy Innovation: An Introduction to the Concept. Energy Policy 2007, 35, 2683–2691. [Google Scholar] [CrossRef] [Scilit]
- Younus, H.A.; Al Hajri, R.; Ahmad, N.; Al-Jammal, N.; Verpoort, F.; Al Abri, M. Green Hydrogen Production and Deployment: Opportunities and Challenges. Discov. Electrochem. 2025, 2, 32. [Google Scholar] [CrossRef] [Scilit]
- Sovacool, B.; Geels, F.; Dahl Andersen, A.; Grubb, M.; Jordan, A.; Kern, F.; Kivimaa, P.; Lockwood, M.; Markard, J.; Meadowcroft, J.; et al. The Acceleration of Low-Carbon Transitions: Insights, Concepts, Challenges, and New Directions for Research. Energy Res. Soc. Sci. 2025, 121, 103948. [Google Scholar] [CrossRef] [Scilit]
- Hanusch, F.; Schad, M. Hydrogen Research: Technology First, Society Second? GAIA—Ecol. Perspect. Sci. Soc. 2021, 30, 82–86. [Google Scholar] [CrossRef] [Scilit]
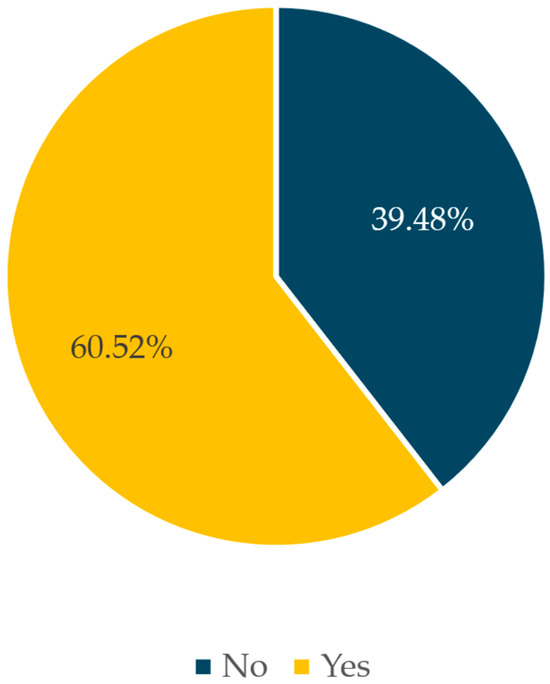
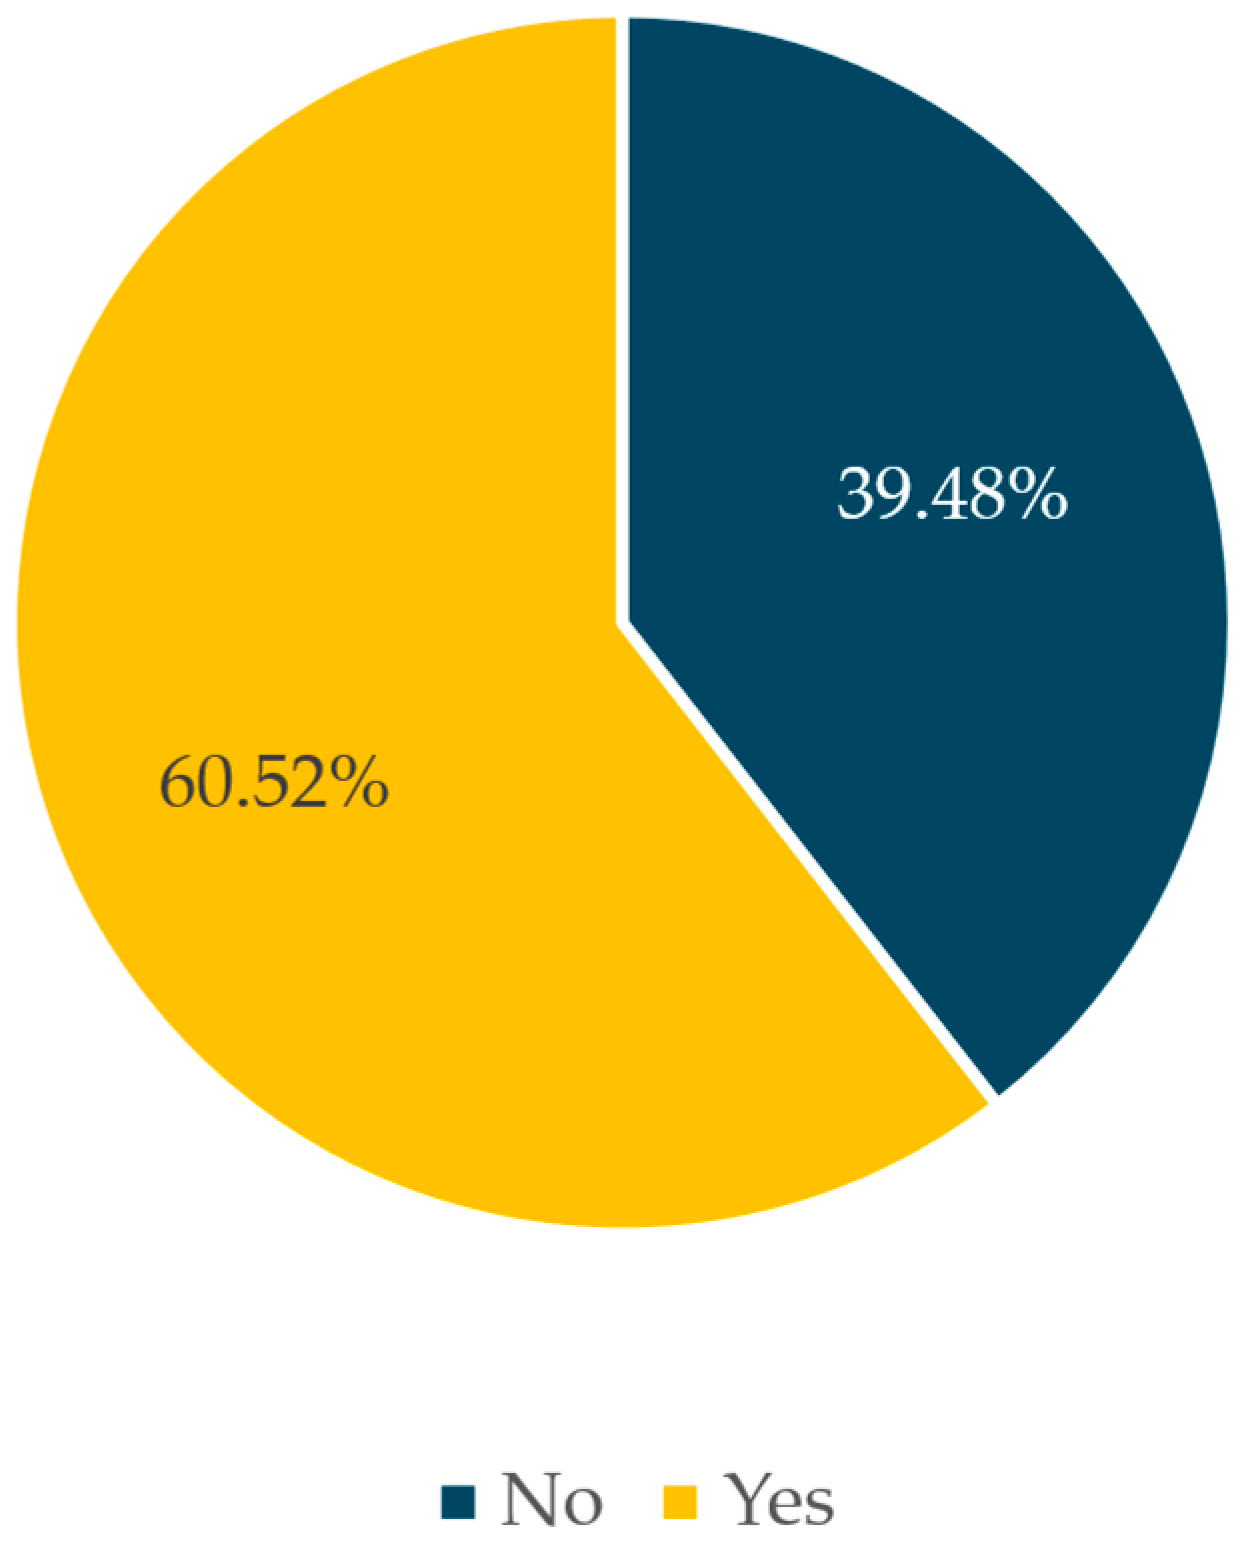
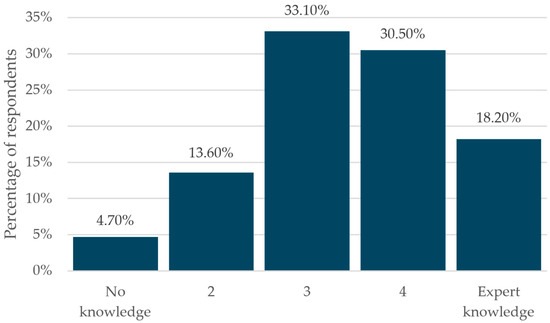
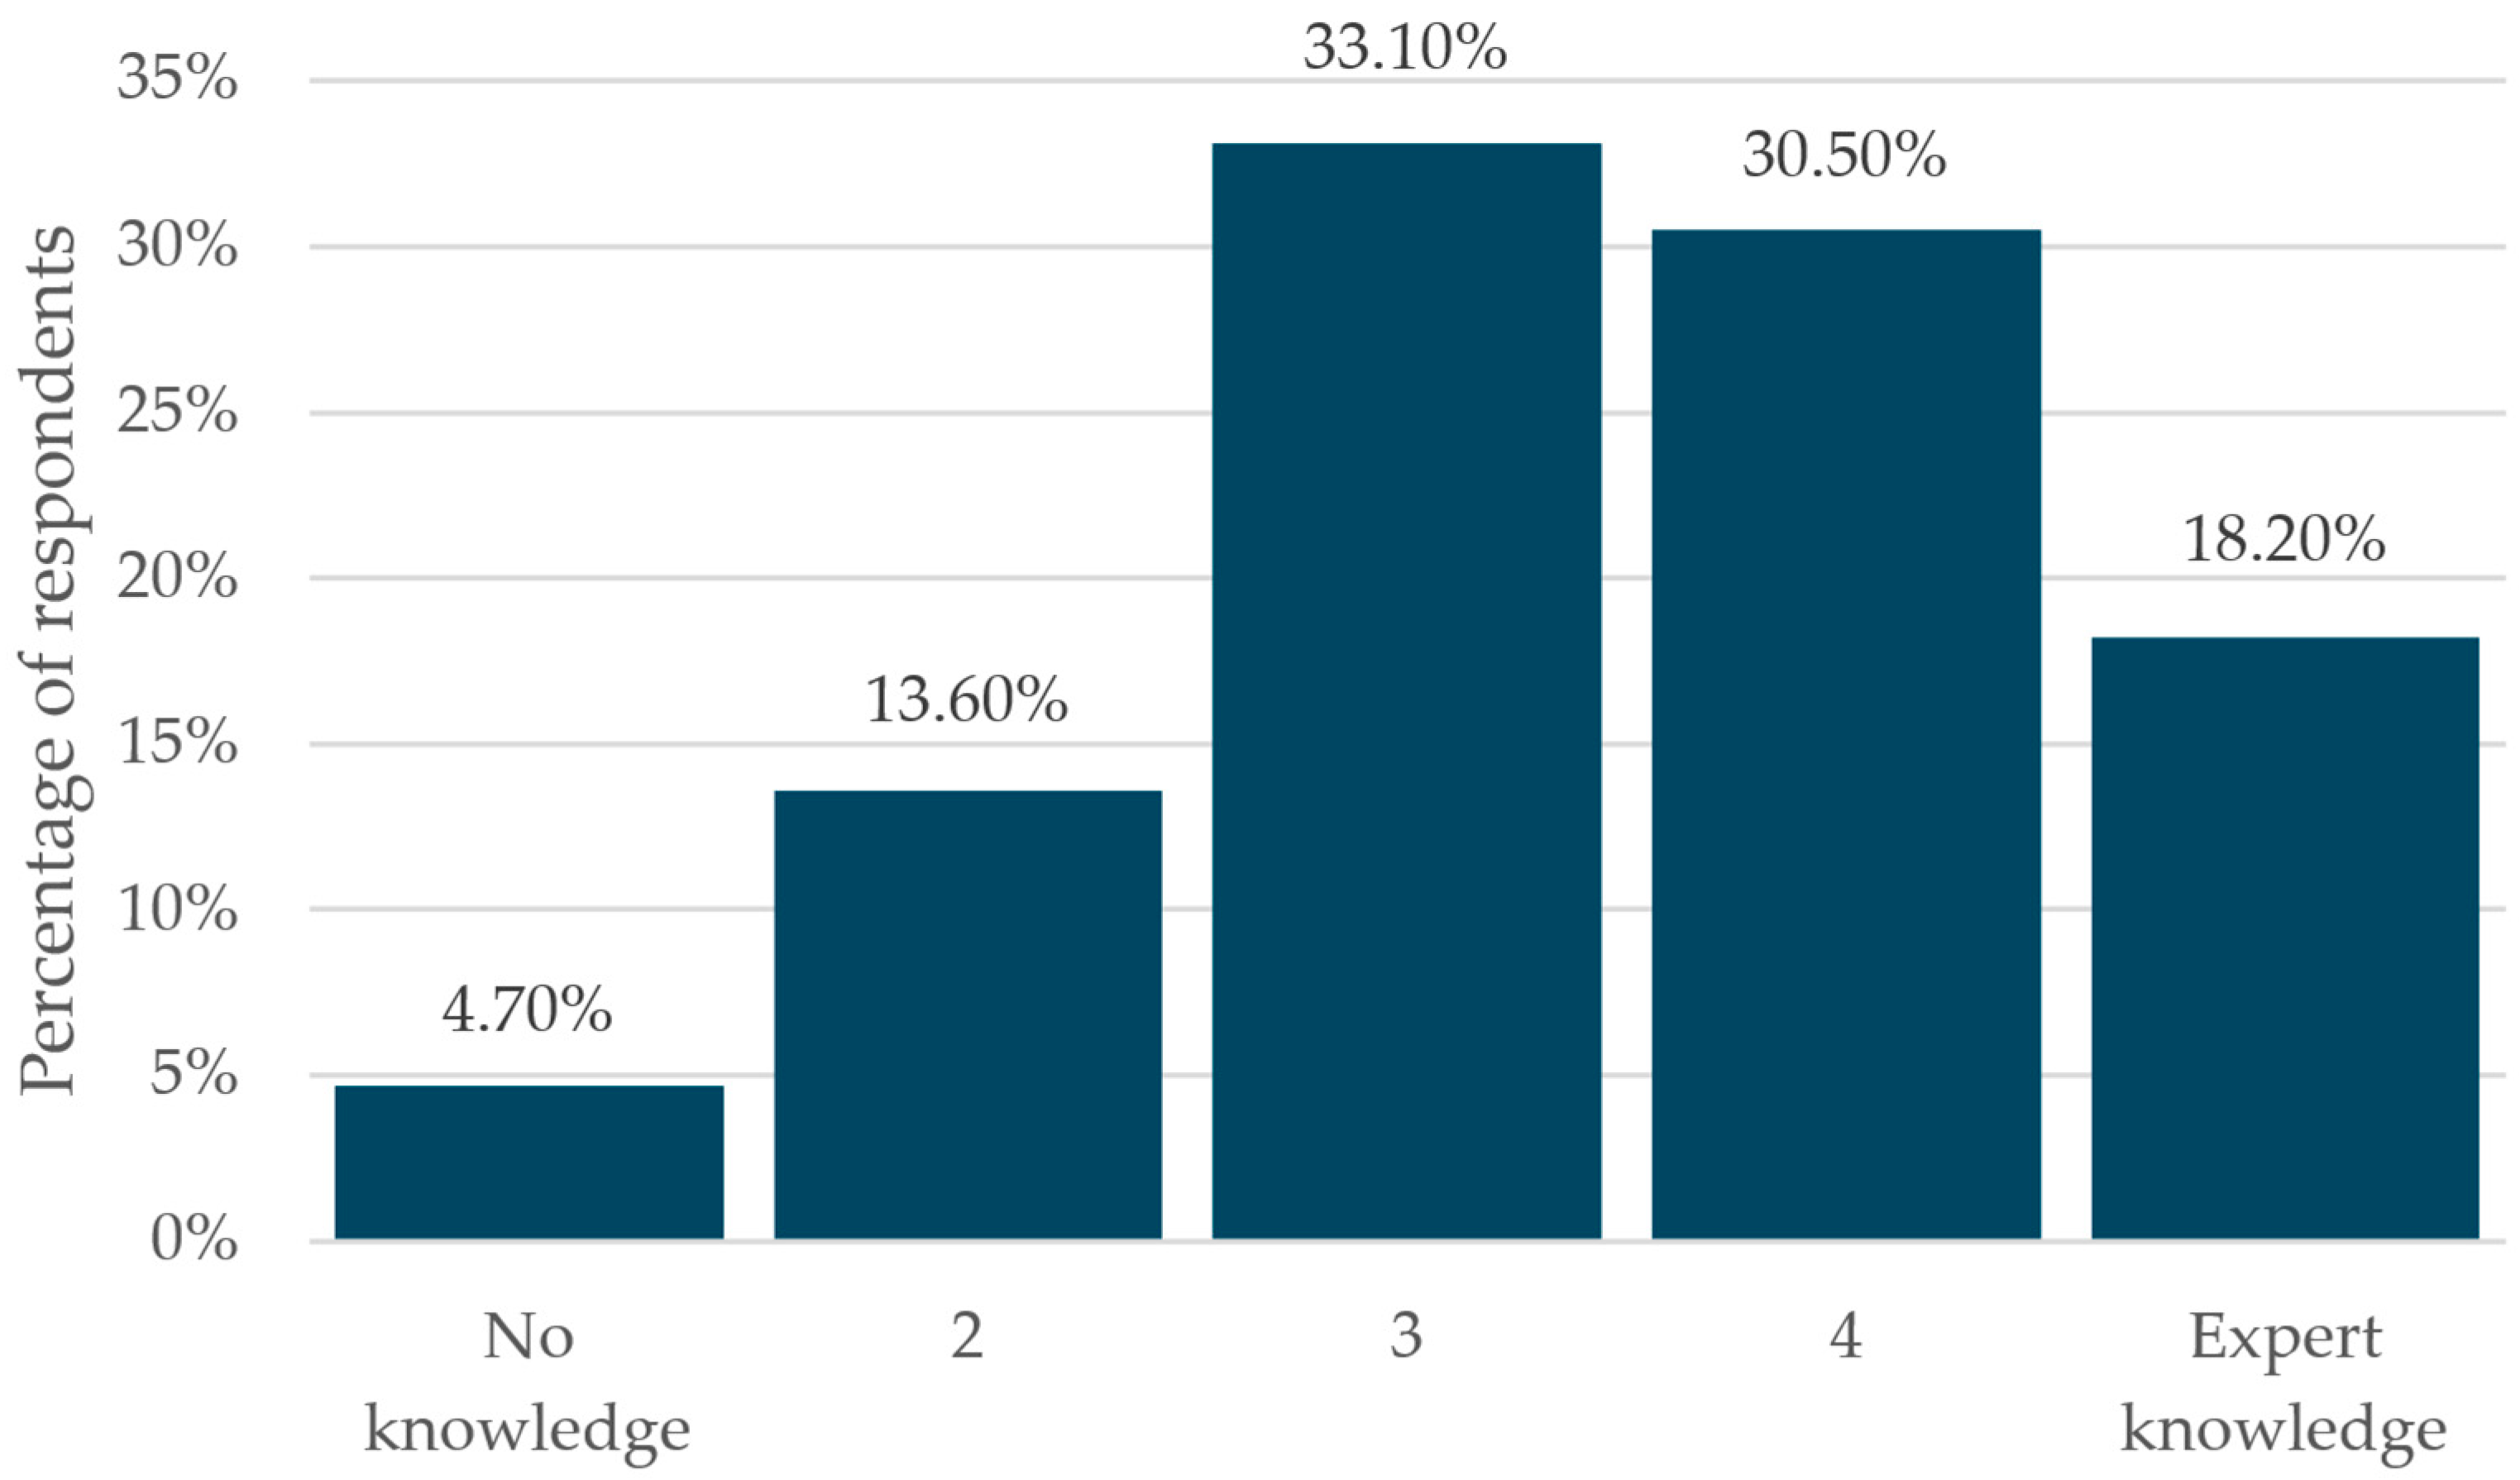
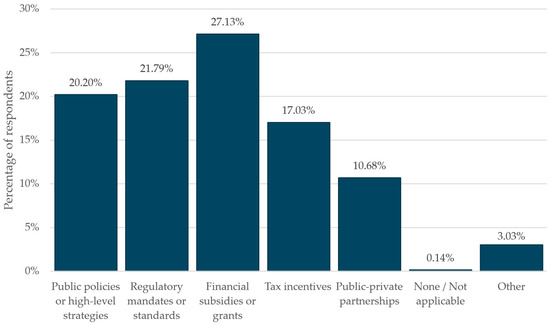
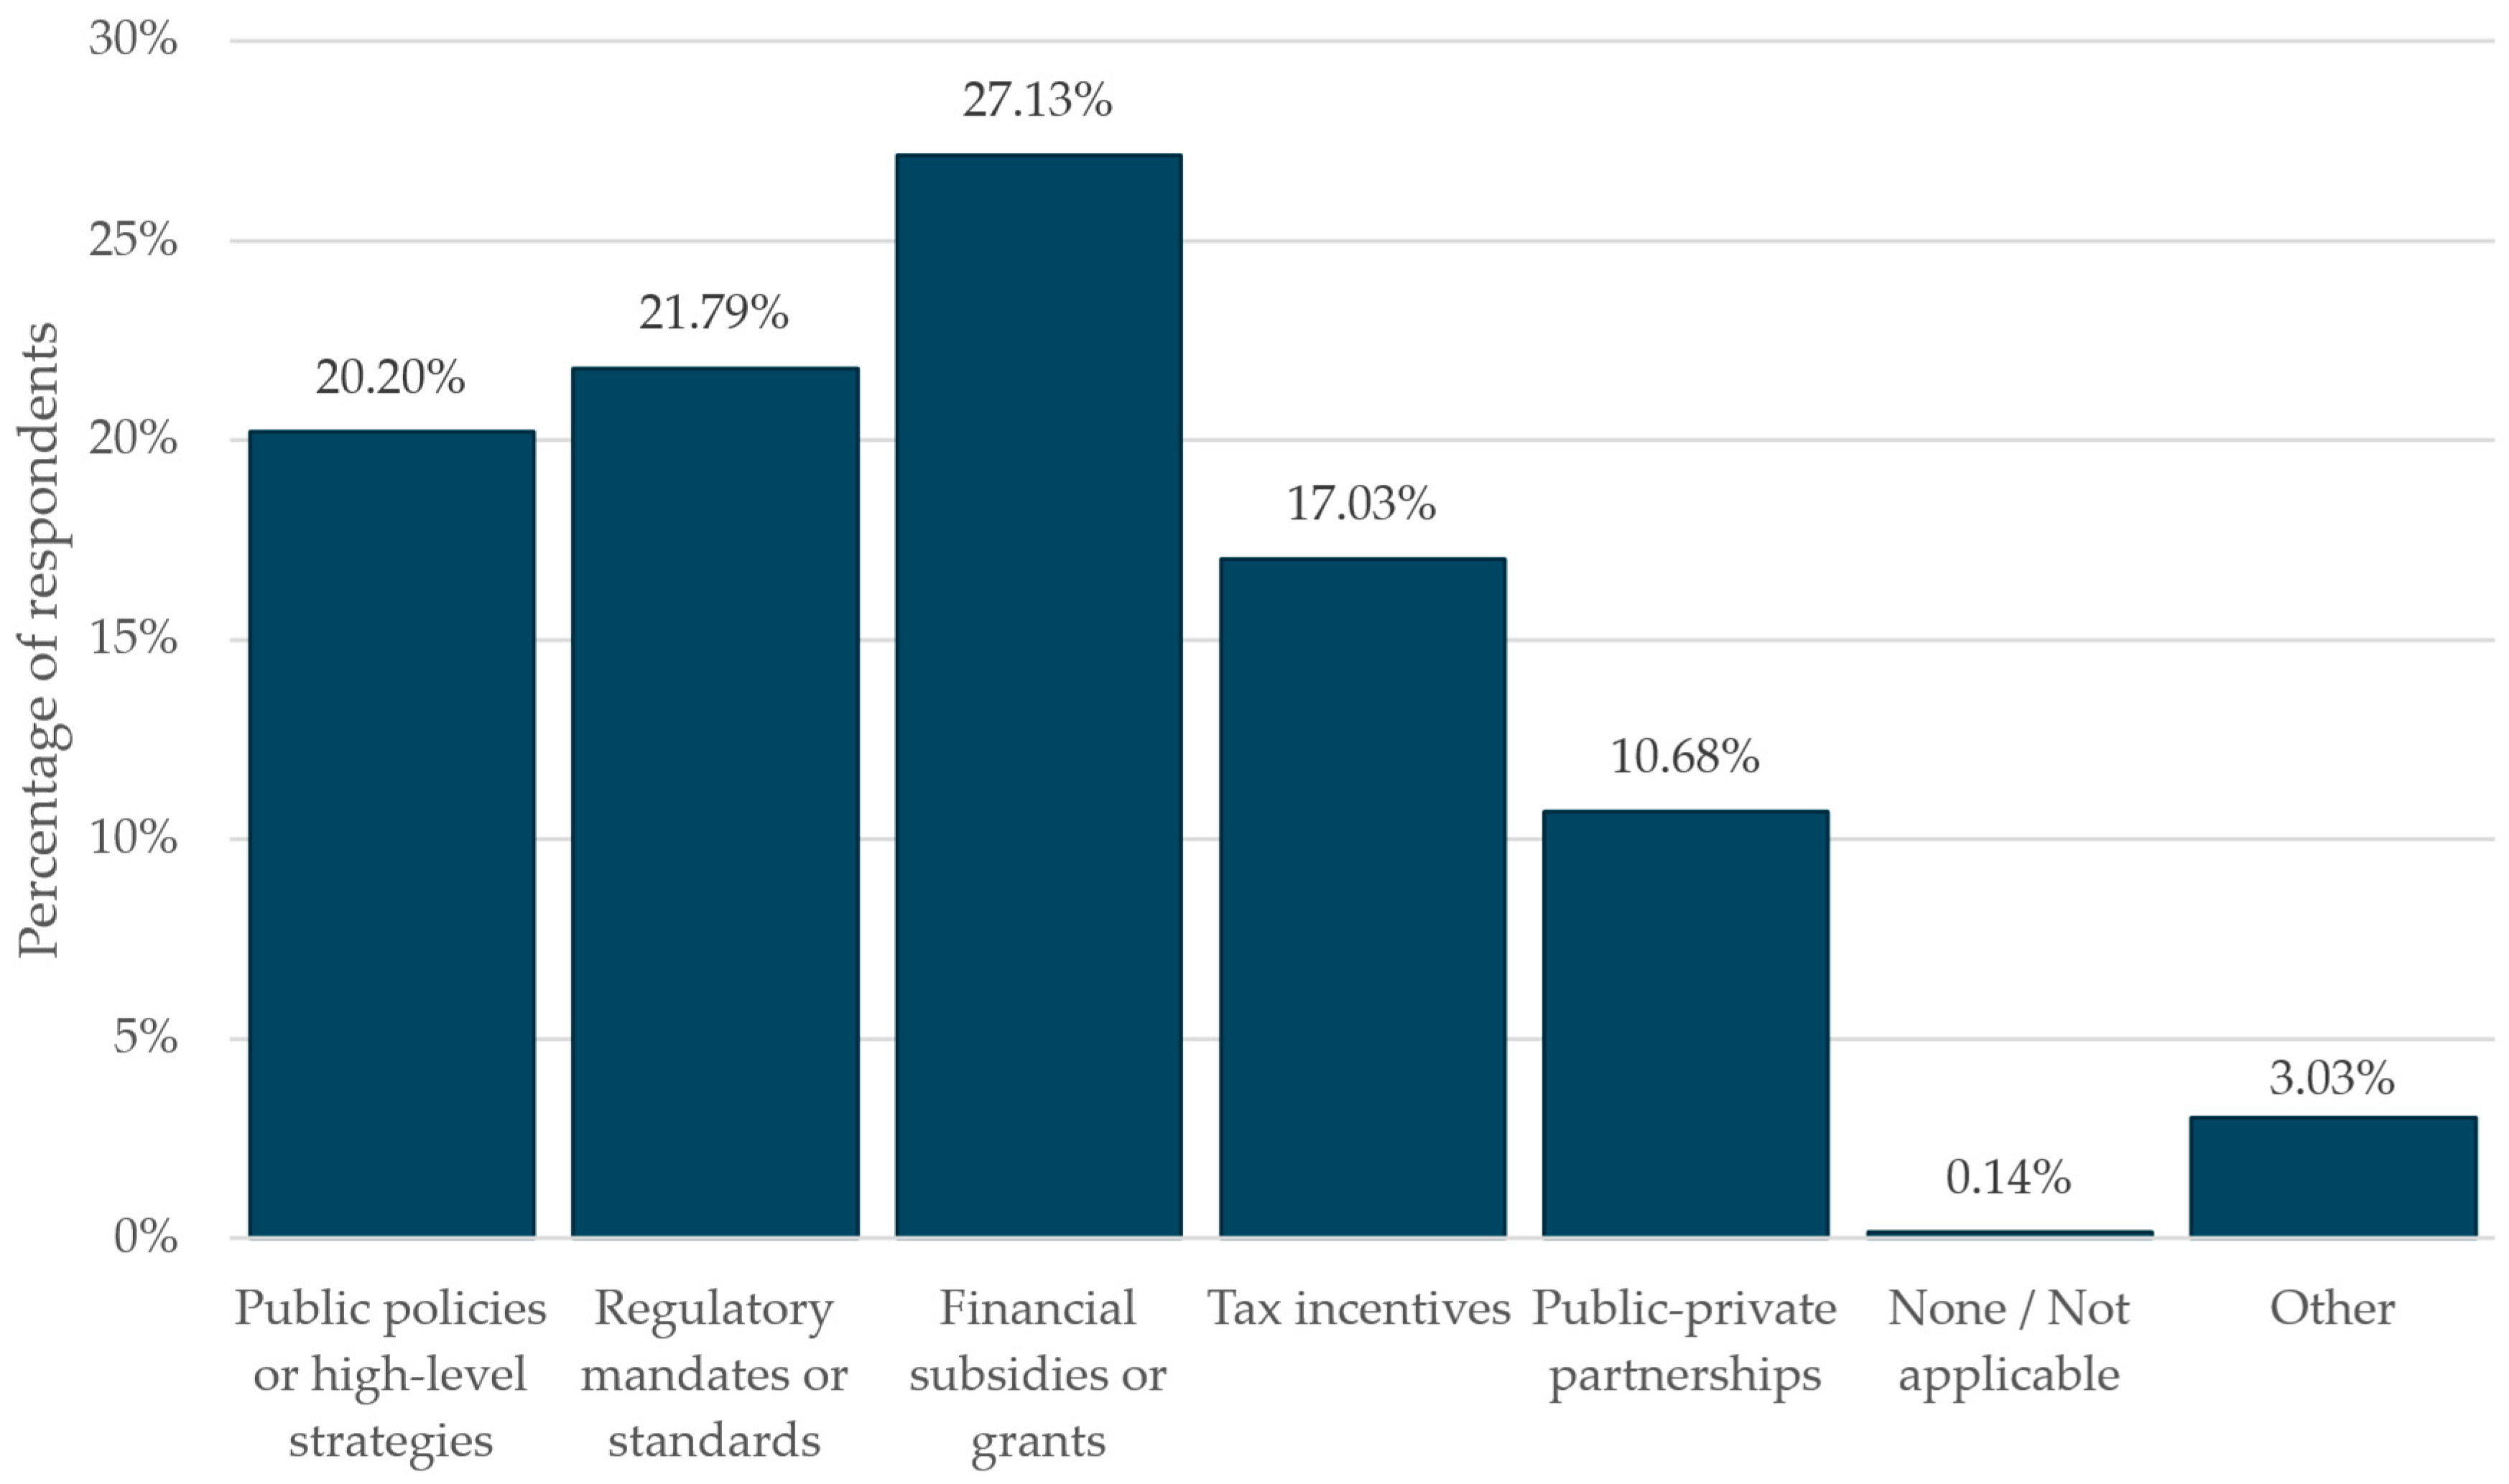
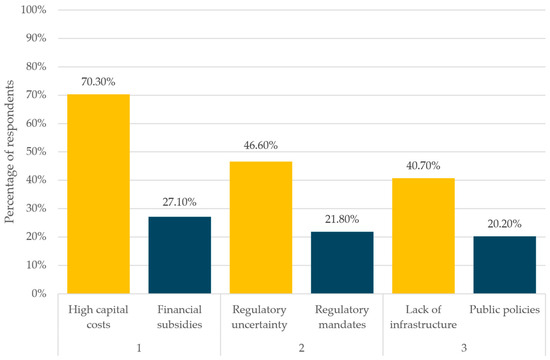
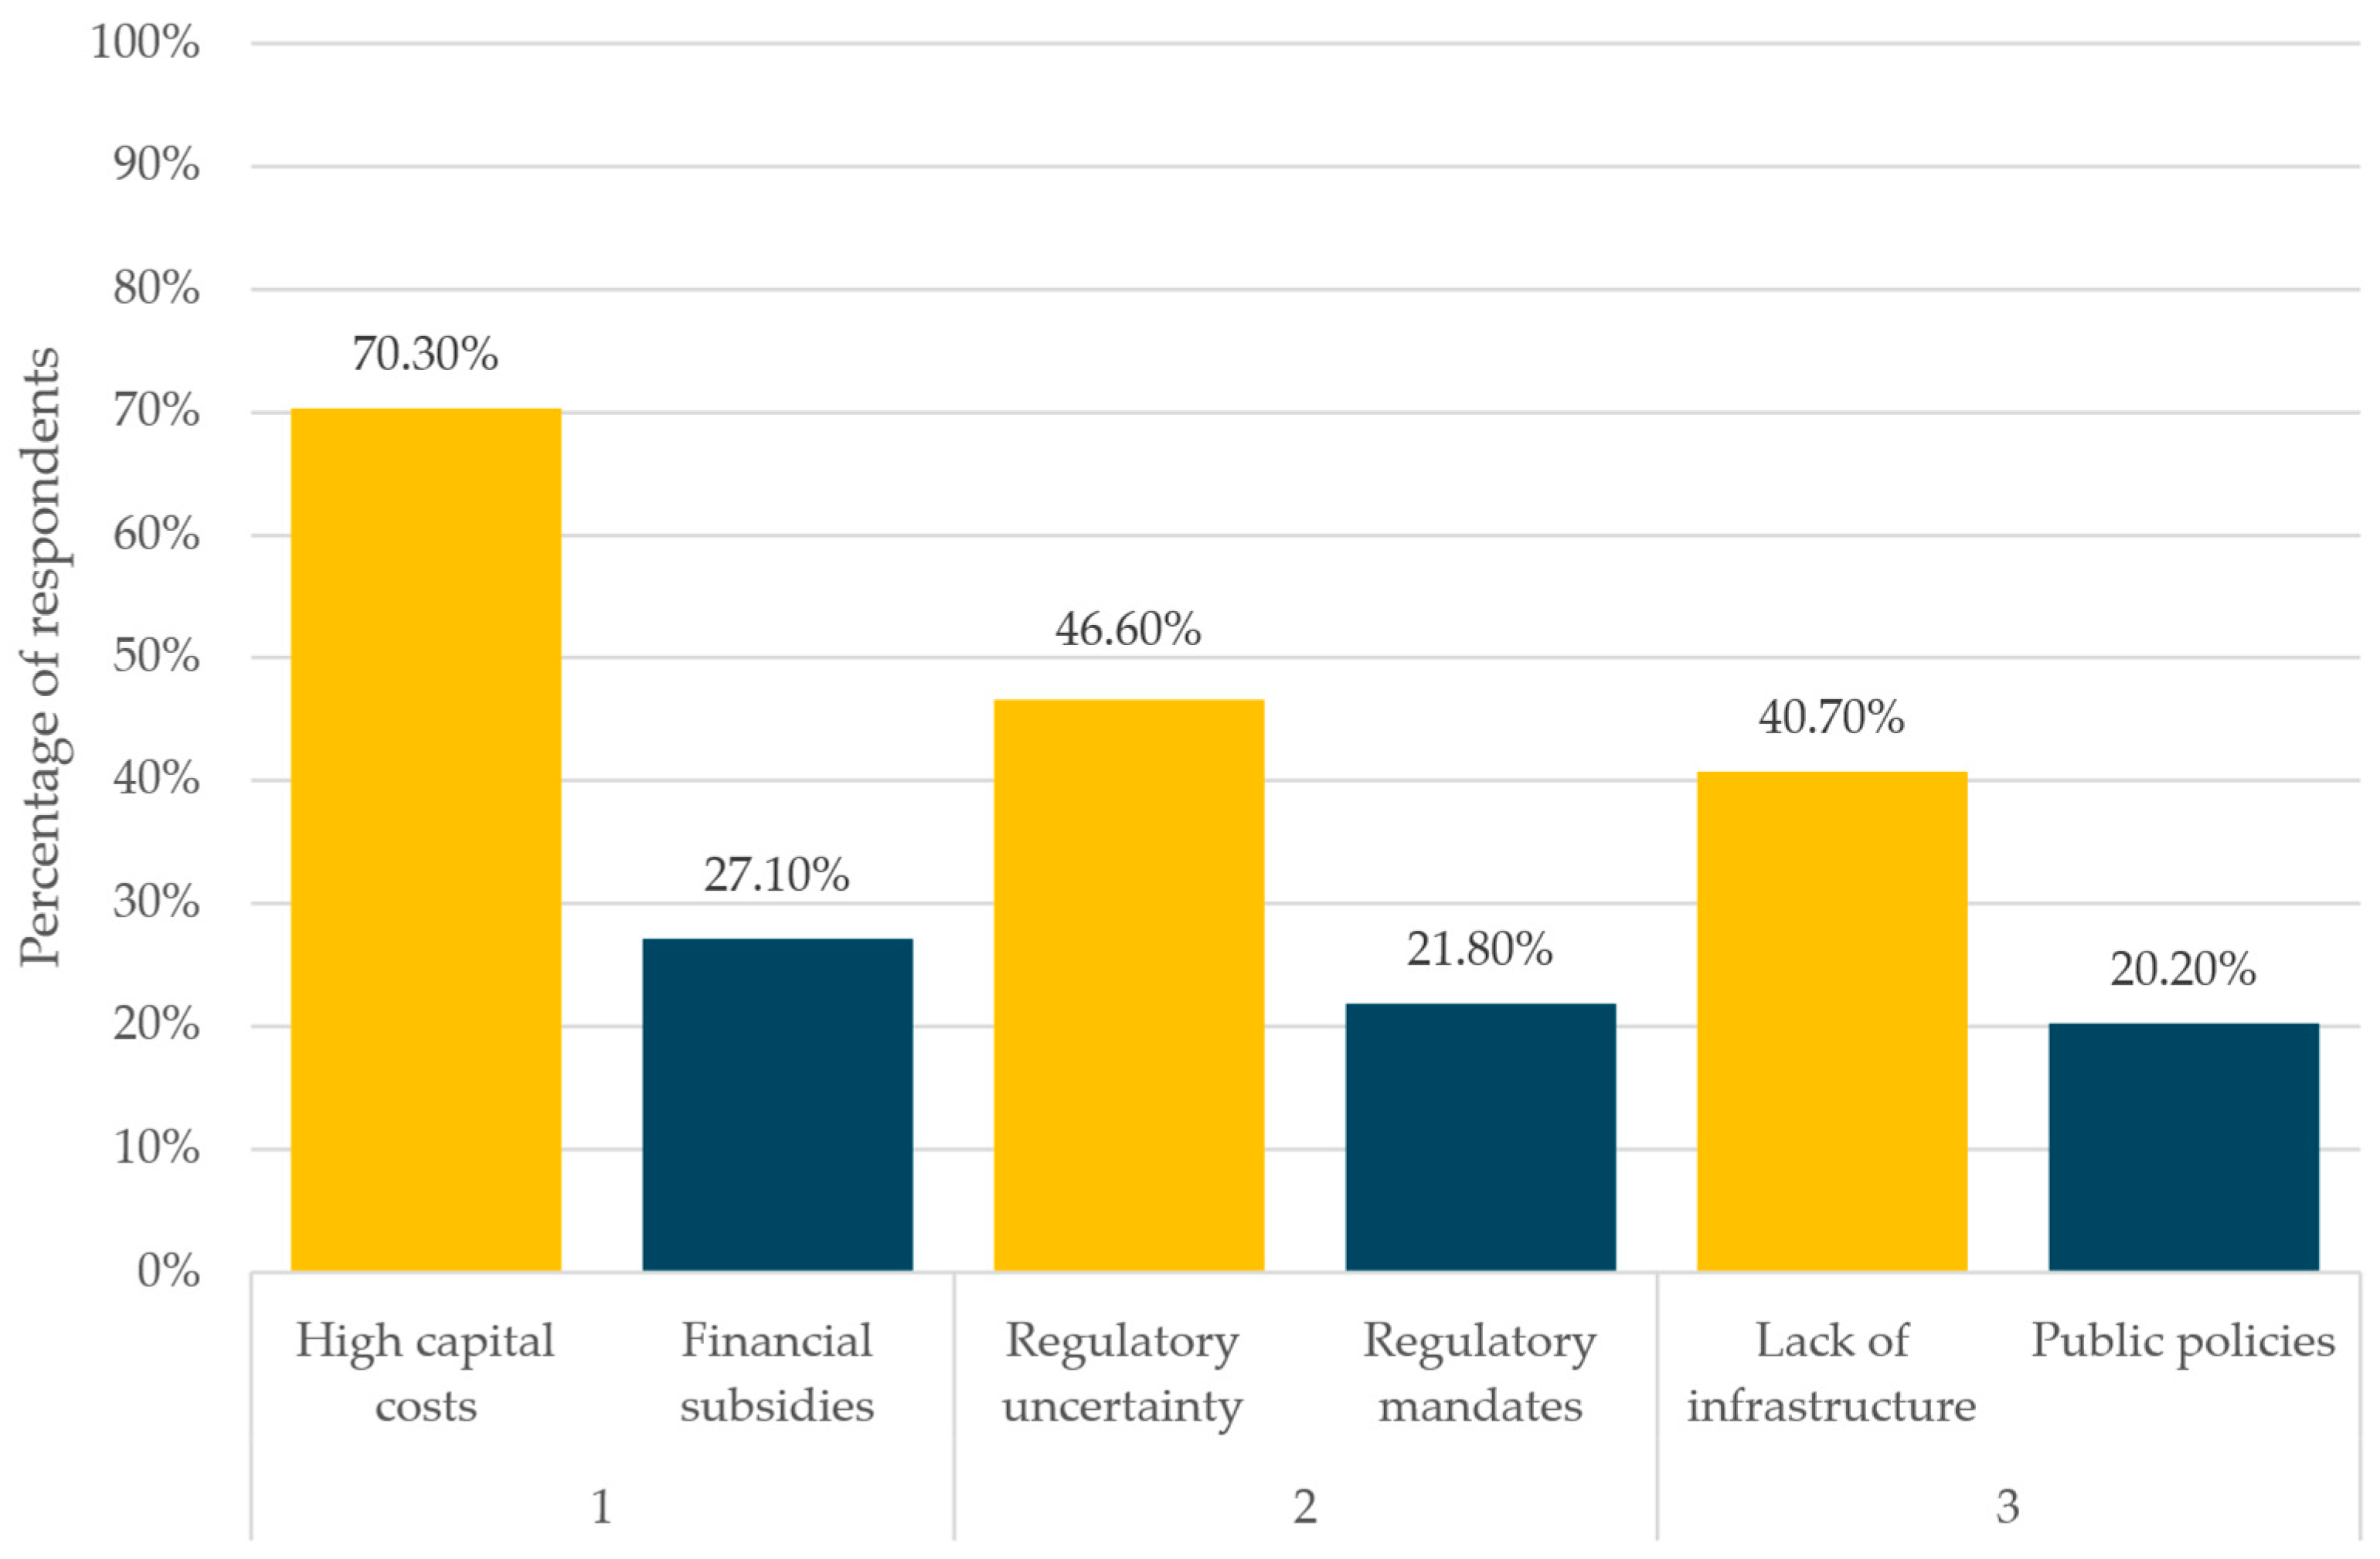

Disclaimer/Publisher’s Note: The statements, opinions and data contained in all publications are solely those of the individual author(s) and contributor(s) and not of MDPI and/or the editor(s). MDPI and/or the editor(s) disclaim responsibility for any injury to people or property resulting from any ideas, methods, instructions or products referred to in the content. |
© 2026 by the authors. Licensee MDPI, Basel, Switzerland. This article is an open access article distributed under the terms and conditions of the Creative Commons Attribution (CC BY) license.