Abstract
Curiosity supports adaptive cognitive and psychological functioning across the lifespan, yet prior research suggests that some dimensions of curiosity decline with age, and little is known about the psychosocial and lifestyle factors that are associated with higher curiosity in later life. This study investigated age-related differences in joyous exploration (JE) and identified key correlates of high JE among older adults. Data were drawn from the 2018 Ageing as Future study (N = 435; age 19–89). JE levels were compared between younger (<60 years) and older (≥60 years) adults using both linear regression and independent samples t-tests. To identify correlates of high JE in later life, Random Forest (RF) classification models were applied within the ≥60 cohort using stratified train-test splits and repeated cross-validation. Older adults reported significantly less JE than younger adults (p < 0.001, d = 0.52). Across multiple model specifications and sensitivity analysis, high JE in older adults was consistently associated with leisure-time hobbies, engagement in interests outside work, meaning- and purpose-related factors, generativity, select future-oriented beliefs, and social embeddedness. These findings suggest that JE in later life tends to co-exist with emotionally meaningful, socially connected activities and offers valuable insights for geriatric interventions that promote healthy aging.
1. Introduction
The demographic shift toward aging populations has intensified research interest in delineating biopsychosocial and cognitive pathways that promote healthy aging [1,2]. Among these, curiosity constitutes a critical but comparatively understudied mechanism. Curiosity is widely regarded as a foundation of learning, exploration, and knowledge acquisition across the human lifespan [1]. For centuries, scholars have sought to conceptualize curiosity as a cognitive, motivational, and affective process, while also identifying its psychological and contextual drivers. As with many psychological constructs, a persistent challenge lies in its operationalization and expression across cognitively diverse age groups.
In this study, we define curiosity as a trait-like disposition characterized by an intrinsic motivation to seek out new knowledge and experiences, emphasizing self-expansion over security [3]. This dimension of curiosity, often captured by the construct of joyous exploration (JE), has been consistently linked to enhanced well-being, adaptability, and prosocial engagement across the lifespan [3].
More recently, curiosity has gained increasing attention in gerontological research, as evidence links higher curiosity to better cognitive performance, greater resilience, and even extended longevity in older adults [4,5,6]. A longitudinal study investigating mortality in a cohort of community-dwelling older adults found that curiosity was significantly linked to increased survival over a five-year period [2]. Other studies have identified a positive association with increased memory and recall performance [7,8,9]. In an fMRI study, Kang et al. examined the neural and behavioral effects of curiosity and found that higher self-reported curiosity was associated with greater activation in the caudate nucleus, a region linked to reward anticipation [8].
Notwithstanding its demonstrated benefits, the relationship between chronological age and curiosity remains mixed. Empirical evidence generally suggests a negative association between age and curiosity, with various sociological and neurological mechanisms potentially underlying this pathway [1,6].
From a neurological perspective, curiosity relies on an integrated network linking dopaminergic reward regions (ventral tegmental area, nucleus accumbens), the hippocampus, and prefrontal–cingulate control areas [7,10]. Activation of this network motivates exploration and enhances memory consolidation [7,8,11,12]. Yet these same regions are highly vulnerable to age-related decline, including reduced dopaminergic function, hippocampal atrophy, and diminished prefrontal control, which plausibly contribute to decreases in both curiosity levels and the efficacy of curiosity-driven learning [13,14].
Sociological theories also provide a complementary lens. The Socioemotional Selectivity Theory posits that as people age and perceive a more limited future time horizon, their motivational priorities shift from exploration and information acquisition to emotionally meaningful goals [15]. Similarly, Cattell’s Theory of Fluid and Crystallized Intelligence proposes that fluid abilities, such as cognitive flexibility, rapid problem solving, and novel reasoning, peak in young adulthood and decline with age, while crystallized intelligence, increases with age [16]. This shift may lead older adults to rely more on prior knowledge and adopt emotionally salient, knowledge-conserving strategies in place of curiosity-driven exploration. Supporting this, Chu et al. reported that intellectual curiosity decreased in tandem with reduced future time perspective, highlighting a motivational shift that may underlie age-related declines in curiosity [6].
Despite such evidence, inconsistencies remain. This is partly attributable to the fact that studies have operationalized curiosity in different ways. Some findings suggest that state curiosity, or momentary interest in novel stimuli, fluctuates across the lifespan, whereas trait curiosity, a more stable disposition, follows different developmental trajectories [1]. This conceptual heterogeneity highlights the complexity in the association between age and curiosity. In the present study, we focus specifically on the JE subcomponent of curiosity, which reflects a stable, trait-like orientation toward novelty learning and seeking new experiences.
Based on this rationale, our first aim is to examine whether JE declines with age. We adopt 60 years as the threshold, consistent with Taiwan’s retirement norms and the age at which neurological and biological markers of cognitive change become more pronounced [14,17]. Second, we aim to identify the drivers of JE among older adults. Building on the aforementioned sociological theories, we anticipate that these drivers may prioritize more meaningful engagement. To date, few studies have directly examined sociological drivers of JE in later life [18]. Thus, this study represents one of the first attempts to systematically identify and classify the sociological drivers of the JE component of curiosity among older adults.
2. Materials and Methods
2.1. Participants
Data were obtained from a Taiwan cohort who took part in the 2018 Ageing as Future online questionnaire study [19]. Respondents were recruited through online channels and completed a structured, web-based questionnaire administered centrally within the project infrastructure. For a more detailed description of the procedures and sampling in the Ageing of Future project, see [19]. The final sample consisted of N = 435 participants, as n = 11 participants were eliminated due to missing or incomplete data. The sociodemographic information for the total sample and the ≥60 subgroup is presented in Table 1 below.

Table 1.
Sociodemographic table.
2.2. Measures
Twenty-two scales were employed to comprehensively assess personality, psychological, behavioral, and temporal constructs influencing perceptions of and preparations for aging. All eligible candidate predictors were derived from these scales and measured using ordinal Likert-type, which were treated as numeric ordinal variables reflecting their original response scales. All items that implicitly or explicitly assessed curiosity or openness to learning, including all non-JE dimensions of the Five-Dimensional Curiosity Scale, were excluded from further analysis. Scale-level descriptions and exclusions for all retained measures are provided in Section 2.2.1, Section 2.2.2, Section 2.2.3 and Section 2.2.4. All predictors entered into the Random Forest (RF) models were measured at the item level.
2.2.1. Psychological Constructs Assessing Individual Expectations and Views on Aging
The Big Five Inventory (BFI-S scale) measures aspects of personality (neuroticism, extraversion, agreeableness, and conscientiousness) [20]. All items related to openness (O+) were removed due to its conceptual and empirical correlation with joyous exploration. Subjective age and desired life-time duration measures elements of individuals’ subjective age, life position, and expectancy [21,22]. Optimism (Revised Life Orientation Test “LOT-R”) evaluates participants’ overall positive outlook on life [23]. Thinking about the future assesses futuristic thinking between one’s current and future self within a ten-year span [23,24]. The Meaning in Life Questionnaire (MLQ, MLQ-P, and MLQ-S) measures the presence of, and the search for, meaning in life [25]. Generativity (Loyola Generativity Scale) measures generative activity in one’s thoughts and actions [26]. Gudykunst Self-Construal Scale assesses cultural differences in self-perceptions (Self-Construal Scale) [26]. Affect (PANAS Scale) assesses how individuals felt during the past four weeks [26]. Satisfaction and Depression scales assesses current and future life satisfaction [27].
2.2.2. Time Management and Future Time Orientation
Some scales were used to assess participants’ prospective transition into aging and their perceived evaluation of time allocated to aging preparatory activities (e.g., finances, living arrangements, care, loneliness, and death), including their generative capacity, timing, subjective control and perceived importance [28]. These were as follows: Future Time Perspective (FTP) [29], Transformational Future Time [30], Experience of time and future and optimism (Brandstädter scale) [31], and Time Discounting (Zimbardo Time Perspective Inventory “ZTPI”) [28].
2.2.3. Perceived Responsibility and Motivations for Aging Provisions
Motivations and responsibilities for aging preparation [32], Perceived utilities/risks of aging preparatory activity [33,34], and Perceived adaptive utility of technology (Subjective Technology Adaptivity Inventory (STAI) [35] were used to assess participants’ preparation and motivations for long-term provisions, risks associated with aging preparation (finances, living arrangements, care, loneliness, and death/dying), and technology use to support independence in aging.
2.2.4. Outcome Variable
The outcome variable was the cumulative score of the JE subscale from the joyous exploration (Five-Dimensional Curiosity Scale) [36]. This subscale consists of five items each rated on a 7-point Likert scale (1 = strongly disagree to 7 = strongly agree), assessing one’s preference for new information and experiences, and the valuing of self-expansion over security. The cumulative score was computed by averaging the five JE items, yielding a continuous score ranging from 1 to 7, with higher values indicating greater levels of JE.
2.3. Design and Procedures
Data, comprising features derived from the individual items across all scales, were processed in Jupyter Notebook 6.5.2, an open-source web application that supports multiple programming languages and allows for the sequential execution of programming codes. Python3 programming language and its corresponding packages, pandas, numpy, matplotlib, sklearn, joblib, and seaborn, were used for data analysis.
Prior to analysis, participants with any missing item-level data across the ordinal predictor scales or the curiosity outcome were excluded, resulting in the removal of 11 cases. The remaining analytic sample contained complete item-level data, with no missing values across predictors or outcome variables. No imputation procedures were required.
To examine age-related differences, we first modeled age as a continuous predictor of curiosity using linear regression across the full sample. For comparability with prior lifespan research and to focus on later-life processes, an additional age-group comparison (<60 vs. ≥60) was conducted using an independent samples t-test. Differences were considered statistically significant at p < 0.05.
Prior to any dichotomization of age, an RF regression was applied to predict continuous JE across the full sample as a benchmark analysis to avoid potential information loss. Subsequently, within the ≥60 cohort, an RF classifier was applied for feature selection, with high JE defined as scores in the upper quartile (≥75th percentile). The top 20 predictors were retained and the model was retrained to evaluate predictive performance. This choice of model was informed by benchmarking RF performance against logistic regression, gradient boosting, and decision tree classifiers using repeated stratified cross-validation (see Table A1). Feature scaling or normalization was not applied, as these analytic models do not rely on distance-based assumptions or scale-sensitive splitting criteria [37]. While logistic regression demonstrated stronger performance on several threshold-dependent, imbalance-sensitive metrics (balanced accuracy, recall for the high JE class, and macro F1), RF showed superior discrimination performance as indexed by ROC-AUC and PR-AUC. Because the primary analytic objective was discrimination and predictor ranking rather than optimization at a single decision threshold, ROC-AUC was specified a priori as the primary metric guiding model selection. On this premise, all subsequent classification, feature selection, and interpretive results reported in this study are based on RF models.
To assess robustness, sensitivity analyses were conducted using alternative extreme-group percentile thresholds (top vs. bottom 35%, 40%, and 50%), and the stability of top predictors was examined across classification specifications. We evaluated the reduced RF classifier using a nested repeated stratified cross-validation procedure to prevent potential information leakage. Within each outer fold (5 folds × 10 repeats), the top 20 predictors were identified using the training partition only, after which the reduced model was refit on the same training data, and evaluated on the held-out test fold. Mean and standard deviation are reported for ROC-AUC, PR-AUC, balanced accuracy, macro F1, and recall for the high JE class. The full analysis workflow is summarized in Figure 1 below.
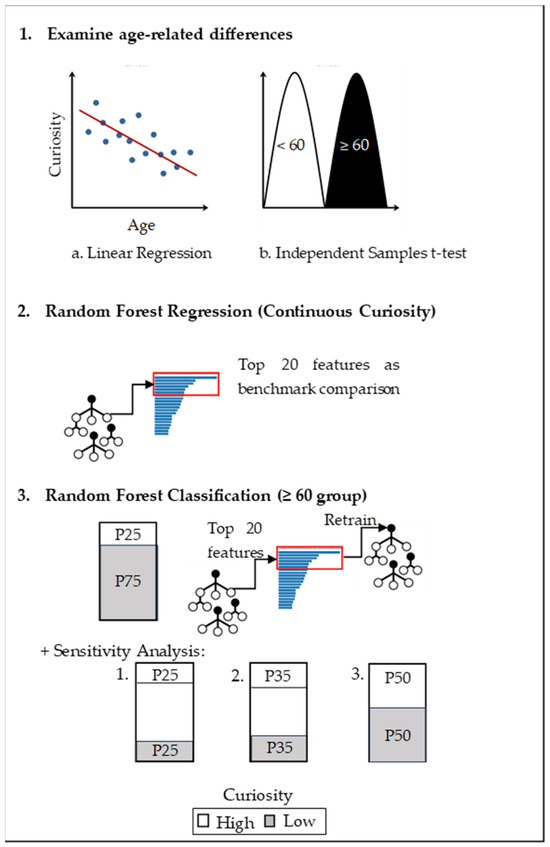
Figure 1.
Data analysis workflow examining age-related differences in JE, RF regression for continuous JE, and RF classification (high and low JE) in the ≥60 cohort, with sensitivity analyses across alternative thresholds.
2.4. Statistical Analysis
2.4.1. Model Specification
RF models were implemented in Python using the scikit-learn library. For both RF regression and classification analyses, models were fit with 500 trees (n_estimators = 500), with the random seed fixed at random_state = 42 to ensure reproducibility and n_jobs = −1 to enable parallel processing. For classification models, class imbalance was addressed using class_weight = “balanced”. All remaining hyperparameters were left at scikit-learn defaults (including max_depth = None, max_features = “sqrt” for classification, min_samples_split = 2, and min_samples_leaf = 1). No additional hyperparameter tuning was performed.
2.4.2. PR
For single-split analyses, data were partitioned into training (80%) and testing (20%) sets using stratified sampling for classification models. To mitigate instability associated with a small high-curiosity test sample, repeated stratified k-fold cross-validation (k = 5 folds, 10 repetitions) was additionally performed. Mean and standard deviation values are reported for ROC-AUC, PR-AUC, balanced accuracy, macro F1 and recall for the high JE class.
2.4.3. Performance Metrics
Model performance was evaluated using accuracy, balanced accuracy, macro-averaged F1, ROC-AUC, precision–recall AUC (PR-AUC), and class-specific recall. Given class imbalance, balanced accuracy, PR-AUC, and recall for the high JE class were emphasized in interpretation.
2.4.4. RF Classification Evaluation Measures
Classification performance was evaluated using confusion matrices, summarizing true positives (TP), true negatives (TN), false positives (FP), and false negatives (FN). These metrics were used to characterize classification errors and to support the computation of performance indices reported below.
2.4.5. Feature Importance and Interpretability
Feature importance was assessed using permutation importance, quantified as the mean decrease in model performance (ROC-AUC) when predictor values were randomly permuted. Partial dependence plots were generated for the top predictors to illustrate marginal associations with JE while averaging over other features. Gini-based impurity importance was used only for preliminary screening and was not interpreted as an effect size.
3. Results
3.1. Linear Regression of JE on Age
Age was modeled as a continuous predictor of JE using ordinary least squares regression. Age was significantly negatively associated with JE, b = −0.026, SE = 0.005, t(433) = −5.29, and p < 0.001, indicating lower JE scores with increasing age. The model explained approximately 6.1% of the variance in curiosity, R2 = 0.061, F(1, 433) = 28.01, and p < 0.001. The results are shown in Table 2 below.
Table 2.
Ordinary least squares regression predicting curiosity from age.
3.2. Age Group Differences in JE
An independent samples t-test with Welch’s correction was conducted to examine whether JE levels differed between participants younger than 60 and those aged 60 or older. Results indicated that younger participants (M = 4.70, SD = 1.40, n = 232) reported significantly higher JE than older participants (M = 3.92, SD = 1.60, n = 203), Welch’s t(403.59) = 5.36, p < 0.001. The mean difference was 0.78 (95% CI [0.49, 1.06]), corresponding to a moderate effect size (Cohen’s d = 0.52). Results are shown in Table 3 below.
Table 3.
Group differences in JE scores by age group.
3.3. Random Forest Regression of Continuous JE
An RF regression model was applied to predict continuous JE scores across the full sample. Model performance evaluated using repeated cross-validation yielded a mean R2 of 0.64 (SD = 0.09) and an RMSE of 0.95. Feature importance analysis indicated that future time perspective items were the strongest predictors of JE, followed by engagement in leisure and meaning-oriented activities (Figure 2). Partial dependence plots illustrating the marginal effects of the most influential predictors are provided in the Appendix A (Figure A1).
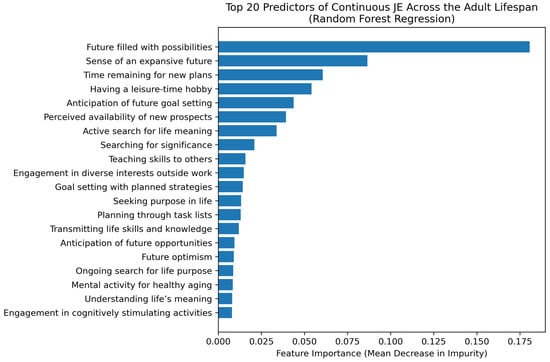
Figure 2.
Feature importance plot showing the top predictors of continuous JE.
3.4. Splitting
In the ≥60 age group, the 75th percentile of JE was 5.20. This was used to split the group into high and low JE categories. To assess the robustness of this classification, additional sensitivity analyses were conducted using alternative split definitions, including exact bottom-top splits at 35% and 40%, as well as a median split at JE = 4.0, which divided the sample into approximately equal high and low JE groups. The box-and-whisker plot illustrating the interquartile range is illustrated in Figure 3.
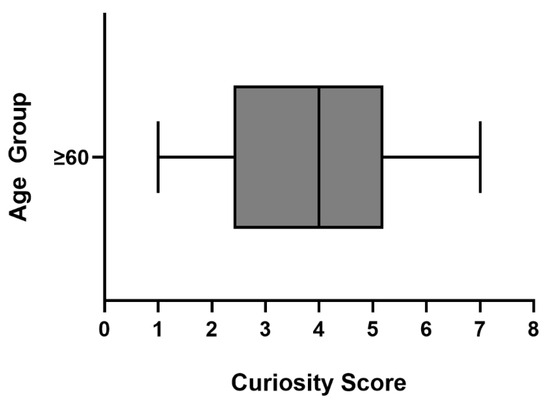
Figure 3.
Box-and-whisker plot of JE scores for participants ≥ 60. Filled boxes represent the interquartile range with min: 1.0, median: 4.0, max: 7.0, 25th percentile: 2.4, and 75th percentile: 5.2.
3.5. Random Forest Classification (Top 75th Percentile) and Sensitivity Analysis in ≥60 Age Group
Table 4 below presents the RF classification reports for distinguishing high JE (top 25%) from lower JE (remaining 75%), comparing the full model (all variables) and the reduced model retrained on the top 20 variables.
Table 4.
Classification report for high/low JE among ≥60 age group (75th percentile split).
For the full model, the RF classifier achieved high single-split discrimination (ROC-AUC = 0.97) and accuracy (0.93). Precision was high for both low and high JE groups (0.91 and 1.00, respectively), whereas recall for the high JE group was more modest (0.73), indicating that some highly curious individuals were misclassified as low JE. Consistent with the imbalanced class distribution, balanced accuracy (0.86), macro-averaged F1 (0.90), and precision–recall AUC (PR-AUC = 0.95) provide a more conservative summary of classification performance.
For the retrained model using the top 20 predictors, the RF showed comparable overall performance, with a ROC-AUC of 0.97 and identical accuracy (0.93). Recall for the high JE group improved to 0.82, alongside higher balanced accuracy (0.89) and macro-averaged F1 (0.90), indicating that the reduced feature set retained, and in some respects improved, the model’s ability to identify highly curious individuals while maintaining strong precision. Repeated stratified k-fold cross-validation further supported the stability of this performance, yielding a mean ROC-AUC of 0.94 (SD = 0.03) and balanced accuracy of 0.75 (SD = 0.06). Table A2 details the feature importance and bivariate correlation scores.
Predictor relevance was further evaluated using permutation importance (Appendix A Figure A2, Table A3). Although individual permutation importance values (ΔROC-AUC) were modest, several predictors remained consistent, including leisure engagement, future-oriented beliefs, and meaning in life. Additional predictors that emerged as influential included financial preparation and autonomy-related motivations.
Additional sensitivity analyses using alternative extreme-group definitions (top vs. bottom 35%, 40%, and a median split 50%) yielded consistently strong discrimination and balanced accuracy across thresholds, indicating that the classification performance of the reduced RF model was robust to variations in outcome definition (see Appendix A Table A4, Table A5, Table A6, Table A7, Table A8 and Table A9—classification reports and feature importance bivariate correlation scores, Figure A3, Figure A4 and Figure A5—feature importance plots).
Nested cross-validated performance estimates for the reduced (top 20) model for the 75/25 split are summarized in Table 5 below. Under this primary split, the model demonstrated strong average discrimination (ROC-AUC = 0.93 ± 0.03; PR-AUC = 0.83 ± 0.08) with good class-balanced performance (balanced accuracy = 0.79 ± 0.07; macro F1 = 0.81 ± 0.07) and moderate recall for the high JE class (recall = 0.64 ± 0.15). Nested cross-validated results for alternative outcome definitions (35/35, 40/40, and median split) are presented in Table A10, indicating stable performance across sensitivity analyses.
Table 5.
Nested cross-validated performance of the reduced (top 20) Random Forest model for high vs. low JE among age ≥60 (75th percentile split).
Confusion matrices for RF classification of high and low JE among participants aged ≥ 60 is shown in Figure 4 below. Using all variables, the model correctly classified 30 of 30 low JE participants (100%) and 8 of 11 high JE participants (73%). Errors included three high JE participants misclassified as low JE.
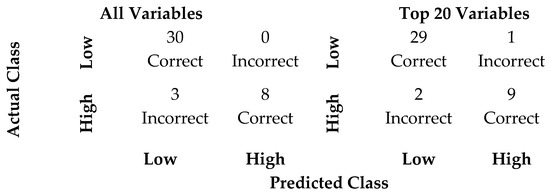
Figure 4.
Confusion matrices for RF classification of high and low JE in participants aged ≥60 (75th percentile split), using all variables (left) and the top 20 variables (right). Rows represent actual JE groups, and columns represent predicted classes. Low = low JE; High = high JE.
When retrained on the top 20 most important variables, the model correctly classified 29 of 30 low JE participants (97%) and 9 of 11 high JE participants (82%). Compared with the full model, the reduced model made slightly more errors in the low JE group, while performance for the high JE group improved modestly, as reflected by an increase in recall from 0.73 to 0.82.
Figure 5 and Figure 6 summarize the most influential predictors of high JE among participants aged ≥60 identified by the RF classifier. The feature importance plot in Figure 5 displays the top 20 predictors, with engagement in leisure-time hobbies being the strongest predictor of high JE. Measures of purpose and meaning in life (i.e., ‘seeking purpose in life,’ ‘understanding life’s meaning,’ and ‘searching for significance’) consistently appeared among the highest-ranked features, highlighting the central role of existential and motivational factors in sustaining JE. Figure 6 presents partial dependence plots (PDPs) for four predictors that consistently ranked among the most important across sensitivity analyses.
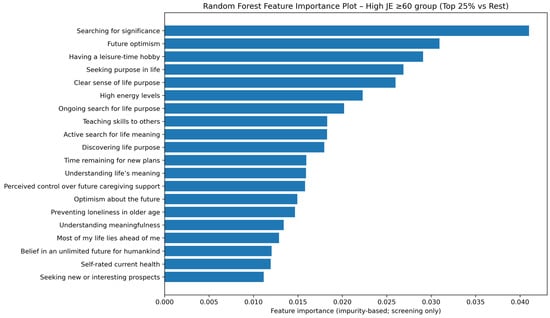
Figure 5.
Feature importance plot of top 20 features (75th percentile, ≥60).
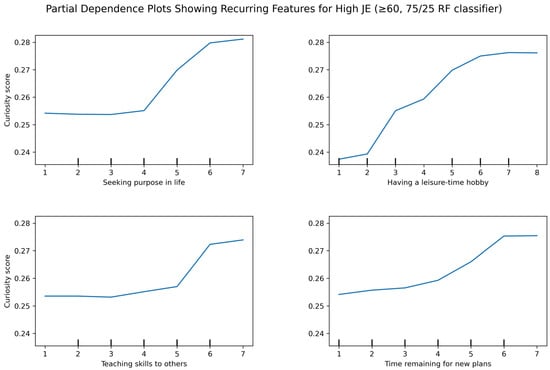
Figure 6.
Partial dependence plots for recurring predictors of high JE among adults aged ≥ 60.
Behavioral and social dimensions also contributed meaningfully. Variables such as developing diverse interests outside of work, resisting temptations when tasks must be completed, and respecting group decisions highlight that both self-regulation and social integration may support JE. Similarly, teaching others important skills and valuing past achievements appeared as relevant predictors, suggesting that intergenerational and generative roles may help maintain JE in later life. Table A1 in the Appendix A presents the feature importance rankings from the RF classifier alongside the corresponding Pearson correlation coefficients with JE scores.
4. Discussion
In this study, curiosity was operationalized using the JE subscale of the Five-Dimensional Curiosity Scale, which reflects a trait-like disposition characterized by an intrinsic motivation to seek out new knowledge and experiences. The study had two primary objectives: first, to examine age-related differences in curiosity, and second, to identify the key social and contextual correlates of curiosity in an older Taiwanese cohort.
To address the first objective, we examined age differences using both a linear regression approach and an independent t-test comparing reported curiosity between participants younger than 60 and those aged 60 or older. Across both approaches, participants younger than 60 reported higher levels of JE. These findings are consistent with the prior literature generally showing a negative relationship between age and curiosity [6,38].
For the second objective, RF models were applied to identify psychosocial correlates of high JE among adults aged 60 and above. Findings from the RF regression applied to the full adult sample emphasized future-oriented predictors such as future time perspective and anticipated/goal-setting opportunities. On the other hand, the classification analyses focused on the ≥60 cohort revealed a somewhat different pattern. In older adulthood, high JE was more strongly associated with meaning-oriented, generative, and lifestyle-related factors, alongside select future-oriented beliefs.
Among the strongest correlates of high JE in the ≥60 group was engagement in leisure-time activities or hobbies. In addition, other lifestyle and vitality factors such as developing interests outside work, and reporting high levels of energy also emerged as significant predictors. These findings highlight the association between adaptive behavioral engagement and higher curiosity in older adulthood. Supporting this view, Morita et al. reported that leisure-time activities were significantly associated with greater curiosity in a Japanese cohort [39]. Previous research has also positively linked curiosity with mood, suggesting that higher curiosity has been associated with lower levels of depressive symptoms in adulthood [40,41].
A striking pattern in our data was the central role of existential factors concerning the understanding and discovery of life’s meaning. Such factors have been positively associated with well-being, adaptive coping, and therapeutic growth [25]. In relation to curiosity, research across diverse cultural contexts has similarly demonstrated strong associations with both meaningfulness in life, and mindfulness [42,43,44]. The Socioemotional Selectivity Theory may offer a useful interpretive framework, suggesting that as chronological age may shrink perceived time horizons, older adults increasingly prioritize emotionally meaningful and existentially relevant pursuits.
Our findings also highlight associations between future-oriented factors and JE among older adults. In particular, future time perspective and optimism about the future emerged as notable predictors. These results align with prior research showing that individuals with broader perceived future horizons are more likely to invest in exploratory, growth-oriented pursuits [7]. Similarly, dispositional optimism has been associated with greater openness to new experiences and resilience in the face of uncertainty [28]. Together, these findings suggest that positive orientations toward the future may be associated with differences in motivational orientation that tend to co-exist with higher JE in later life.
Socially embedded and generative orientations were also associated with higher JE in later life. Endorsing group decisions, occupying generative roles (e.g., teaching others, valuing intergenerational progress), and lower loneliness or loneliness-related attitudes were each linked to higher JE scores. In a Taiwanese context where collectivist norms and interdependence are salient, these orientations may be associated with a shared sense of psychological safety and meaning, which co-exists with greater exploration and openness to new experiences. Consistent with this interpretation, Hirose and Kotani reported that inquisitiveness supported happiness via both intergenerational and intragenerational communication in a Japanese cohort [45].
4.1. Conclusions and Future Research
Taken together, these findings offer a dynamic and multifaceted synthesis of the factors associated with JE in later life. They align closely with both the Socioemotional Selectivity Theory and Cattell’s theory of fluid and crystallized intelligence, suggesting that while the more fluid, novelty-seeking aspects of curiosity may decline with age, its expression evolves toward crystallized forms of meaningfulness derived from life experiences.
From an applied perspective, these results may inform community-based and geriatric programming aimed at promoting psychological engagement in later life. Rather than targeting curiosity directly, programs could prioritize contexts that enable older adults to meaningfully apply their accumulated skills, knowledge, and life experience. Such approaches align with theories of crystallized intelligence which emphasize the value of experience-based strengths in later adulthood. These may include hobby-based groups, intergenerational teaching or mentoring initiatives, and community education programs which uniquely position older adults as contributors rather than passive recipients. Importantly, these applications should be viewed as aligned with, rather than causally derived from, the present findings.
4.2. Limitations
This study is not without limitations. First, the findings are based on a Taiwanese cohort, and thus cultural values emphasizing interdependence and collectivism may have shaped the observed relationships. Future studies should include more culturally diverse samples to gain a clearer and more generalizable understanding of the predictors of curiosity, as well as to examine how cultural context may moderate these relationships.
Second, curiosity was measured using the JE subscale, which primarily captures a trait-like, intrinsic orientation toward novelty and learning. Other dimensions of curiosity such as Deprivation Sensitivity, Social Curiosity, and Stress Tolerance, may reflect more situational or adaptive expressions of curiosity that fluctuate across time and context. Examining these subtypes could clarify whether certain forms of curiosity are more conducive to healthy aging and psychological resilience.
Third, several predictors reflected closely related psychosocial constructs, including meaning in life, optimism, and future-oriented beliefs. Given the use of RF models and other test measures of robustness, rankings should be interpreted as reflecting shared contributions to prediction rather than independent or causal effects of individual variables. In addition, model performance and predictor rankings were derived from a single train/test split with a relatively small minority-class test sample. While prior work has shown that similar small, class-imbalanced, and feature-rich datasets are common in applied predictive modeling and can still yield meaningful and interpretable results when appropriate robustness checks are applied [46,47,48], the present findings should still be considered provisional until replicated in independent samples.
Fourth, recruitment via online channels may have introduced selection bias, particularly within the ≥60 subgroup. Older adults who participate in online surveys are more likely to be healthier, more educated, and more digitally engaged than the broader older population. As a result, the observed predictor rankings and model performance may disproportionately reflect correlates of curiosity among relatively high-functioning older adults, and may not fully generalize to more vulnerable, less digitally connected, or institution-based populations. Replication using offline or mixed-mode recruitment strategies will be essential to evaluate the robustness of these findings across more heterogeneous older-adult samples.
Finally, the cross-sectional design precludes causal inference. Although the identified behavioral and psychosocial factors were associated with higher curiosity, the present findings cannot determine directionality or whether these factors actively sustain curiosity over time. Longitudinal and intervention-based studies are needed to establish causal pathways and to evaluate whether modifying these factors leads to changes in curiosity across the aging process.
Nonetheless, the present study provides a meaningful step toward understanding the social and psychological mechanisms underlying curiosity in older adults and offers valuable insights for policymakers and geriatric institutions seeking to better understand curiosity and its associated social and psychological correlates as part of strategies for promoting healthy and adaptive aging.
Author Contributions
Conceptualization, C.A.M. and S.L.; methodology, C.A.M.; software, C.A.M.; validation, C.A.M.; formal analysis, C.A.M.; investigation, C.A.M.; resources, S.L.; data curation, C.A.M.; writing—original draft preparation, C.A.M. and S.L.; writing—review and editing, C.A.M. and S.L.; visualization, C.A.M.; supervision, S.L.; project administration, S.L.; funding acquisition, S.L. All authors have read and agreed to the published version of the manuscript.
Funding
This research was funded by Volkswagen Foundation, grant number B107-K002.
Institutional Review Board Statement
The study was conducted in accordance with the Declaration of Helsinki and approved by of National Cheng Kung University Human Research Ethics Committee (protocol code 104-217, 21 November 2016).
Informed Consent Statement
Informed consent was obtained from all subjects involved in the study.
Data Availability Statement
The datasets used and analyzed during the current study are available from the corresponding author on reasonable request.
Acknowledgments
The authors have reviewed and edited the output and take full responsibility for the content of this publication.
Conflicts of Interest
The authors declare no conflicts of interest.
Abbreviations
The following abbreviations are used in this manuscript:
| RF | Random Forest |
| JE | Joyous Exploration |
| TP | True Positives |
| TF | True Negatives |
| FP | False Positives |
| FN | False Negatives |
| PPV | Precision Score |
| AUC-ROC | Area Under the Receiver Operating Characteristic Curve |
Appendix A
Table A1.
Model performance comparison for high JE classification (≥60 group, 75/25 split).
Table A1.
Model performance comparison for high JE classification (≥60 group, 75/25 split).
| Model | ROC-AUC | PR-AUC | Balanced Accuracy | Recall (High JE) | Macro F1 |
|---|---|---|---|---|---|
| Random Forest (500 trees) | 0.936 ± 0.033 | 0.849 ± 0.076 | 0.752 ± 0.065 | 0.536 ± 0.131 | 0.779 ± 0.065 |
| Logistic Regression | 0.912 ± 0.043 | 0.829 ± 0.079 | 0.829 ± 0.066 | 0.743 ± 0.126 | 0.831 ± 0.061 |
| Gradient Boosting | 0.913 ± 0.047 | 0.804 ± 0.088 | 0.776 ± 0.070 | 0.641 ± 0.139 | 0.784 ± 0.066 |
| Decision Tree | 0.690 ± 0.085 | 0.440 ± 0.092 | 0.690 ± 0.085 | 0.520 ± 0.164 | 0.691 ± 0.084 |
High JE defined as the top 25% of the JE distribution within the ≥60 age group. Performance was evaluated using repeated stratified 5-fold cross-validation with 10 repetitions.

Figure A1.
Partial dependence plots showing the top predictors of continuous JE.
Figure A1.
Partial dependence plots showing the top predictors of continuous JE.

Table A2.
Feature importance table with bivariate correlations (top 20 variables, 25/75 split).
Table A2.
Feature importance table with bivariate correlations (top 20 variables, 25/75 split).
| Feature | Question | Feature Importance Score | Correlation (r) |
|---|---|---|---|
| I am always searching for something that makes my life feel significant. 1 = absolutely untrue to 7 = absolutely true | 0.041013 | 0.54 *** |
| I’m always optimistic about my future. 1 = I agree a lot to 5 = I disagree a lot | 0.030949 | 0.56 *** |
| I pursued an interesting leisure-time activity or a hobby. 1 = never to 8 = daily | 0.029098 | 0.57 *** |
| I am seeking a purpose or mission for my life. 1 = absolutely untrue to 7 = absolutely true | 0.026872 | 0.57 *** |
| My life has a clear sense of purpose. 1 = absolutely untrue to 7 = absolutely true | 0.025996 | 0.58 *** |
| How much of the time during the past 4 weeks did you have a lot of energy? 1 = all of the time to 7 = none of the time | 0.022299 | 0.51 *** |
| I am always looking to find my life’s purpose. 1 = absolutely untrue to 7 = absolutely true | 0.020205 | 0.52 *** |
| I have important skills that I try to teach others. 1 = does no apply at all to 8 = applies very much | 0.018304 | 0.61 *** |
| I am looking for something that makes my life feel meaningful. 1 = absolutely untrue to 7 = absolutely true | 0.018287 | 0.62 *** |
| I have discovered a satisfying life purpose. 1 = absolutely untrue to 7 = absolutely true | 0.017967 | 0.54 *** |
| There is plenty of time left in my life to make new plans. 1 = absolutely untrue to 7 = absolutely true | 0.015953 | 0.67 *** |
| I understand my life’s meaning 1 = absolutely untrue to 7 = absolutely true | 0.015920 | 0.54 *** |
| I am searching for meaning in life. I can personally control whether I am provided for in the event that I need the assistance of a caregiver. 1 = Does not apply at all to 7 = Applies very much | 0.015813 | 0.44 *** |
| The future will bring a lot of good things for me. 1 = does not apply at all to 5 = applies completely | 0.014932 | 0.60 *** |
| By taking actions to prevent loneliness in old age, I accept burdens today. 1 = strongly disagree to 7 = strongly agree | 0.014674 | 0.39 *** |
| I have a good sense of what makes my life meaningful. 1 = absolutely untrue to 5 = absolutely true | 0.013405 | 0.56 *** |
| Most of my life lies ahead of me. 1 = does not apply at all to 7 = applies very much | 0.012888 | 0.64 *** |
| The future of humankind is unlimited. 1 = Does not apply at all to 7 = Applies very much | 0.012047 | 0.50 *** |
| How would you describe your current health? 1 = very good to 6 = bad | 0.011934 | 0.48 *** |
| In my life there are always new and interesting prospects. 1 = does not apply at all to 5 = applies completely | 0.011150 | 0.65 *** |
Note. [r] indicates reverse coded. Significance reported at *** p < 0.001.

Figure A2.
Permutation feature importance plot with error bars.
Figure A2.
Permutation feature importance plot with error bars.

Table A3.
Permutation importance of top predictors of high curiosity (≥60 cohort, 75/25 split).
Table A3.
Permutation importance of top predictors of high curiosity (≥60 cohort, 75/25 split).
| Feature | Δ ROC-AUC (Mean) | SD |
|---|---|---|
| 0.0087 | 0.0051 |
| 0.0072 | 0.0037 |
| 0.0068 | 0.0030 |
| 0.0055 | 0.0029 |
| 0.0048 | 0.0050 |
| 0.0046 | 0.0025 |
| 0.0045 | 0.0041 |
| 0.0043 | 0.0032 |
| 0.0042 | 0.0038 |
| 0.0041 | 0.0031 |
| 0.0037 | 0.0020 |
| 0.0031 | 0.0032 |
| 0.0028 | 0.0044 |
| 0.0028 | 0.0027 |
| 0.0027 | 0.0031 |
| 0.0026 | 0.0038 |
| 0.0025 | 0.0015 |
| 0.0023 | 0.0014 |
| 0.0022 | 0.0021 |
| 0.0022 | 0.0022 |

Figure A3.
Feature importance plot of top 20 features (sensitivity analysis: top 35% vs bottom 35%, ≥60).
Figure A3.
Feature importance plot of top 20 features (sensitivity analysis: top 35% vs bottom 35%, ≥60).

Table A4.
Classification report using top 20 variables (sensitivity analysis: top 35% vs. bottom 35%, ≥60).
Table A4.
Classification report using top 20 variables (sensitivity analysis: top 35% vs. bottom 35%, ≥60).
| Classification Report Using Top 20 Variables (Top 35% vs. Bottom 35%) | ||||
|---|---|---|---|---|
| AUC Score: | 0.96 | |||
| PR-AUC: | 0.97 | |||
| Accuracy: | 0.86 | |||
| Balanced Acc: | 0.86 | |||
| Macro F1: | 0.86 | |||
| Classification Report: | ||||
| precision | recall | f1-score | Support | |
| Low Curiosity | 0.87 | 0.87 | 0.87 | 15 |
| High Curiosity | 0.86 | 0.86 | 0.86 | 14 |
| Accuracy | 0.86 | 29 | ||
| Macro avg | 0.86 | 0.86 | 0.86 | 29 |
| Weighted avg | 0.86 | 0.86 | 0.86 | 29 |
| Repeat Stratified K-Fold CV | Mean | SD | ||
| ROC-AUC | 0.99 | 0.02 | ||
| PR-AUC | 0.99 | 0.01 | ||
| Balanced Accuracy | 0.93 | 0.04 | ||
| Macro F1 | 0.93 | 0.05 | ||
| Recall (High Curiosity) | 0.92 | 0.07 | ||
Table A5.
Feature importance table with bivariate correlations (top 20 variables, 35/35 split).
Table A5.
Feature importance table with bivariate correlations (top 20 variables, 35/35 split).
| Feature | Question | Feature Importance Score | Correlation (r) |
|---|---|---|---|
| I am seeking a purpose or mission for my life. 1 = absolutely untrue to 7 = absolutely true | 0.053559 | 0.57 *** |
| I am looking for something that makes my life feel meaningful. 1 = absolutely untrue to 7 = absolutely true | 0.043347 | 0.62 *** |
| I am always searching for something that makes my life feel significant. 1 = absolutely untrue to 7 = absolutely true | 0.042993 | 0.54 *** |
| There is plenty of time left in my life to make new plans. 1 = absolutely untrue to 7 = absolutely true | 0.037663 | 0.67 *** |
| I pursued an interesting leisure-time activity or a hobby. 1 = never to 8 = daily | 0.035293 | 0.57 *** |
| I am always looking to find my life’s purpose. 1 = absolutely untrue to 7 = absolutely true | 0.030868 | 0.52 *** |
| I expect that I will set many new goals in the future. 1 = does not apply at all to 8 = applies very much | 0.028996 | 0.65 *** |
| I have important skills that I try to teach others. 1 = does not apply at all to 8 = applies very much | 0.027776 | 0.61 *** |
| In my life there are always new and interesting prospects. 1 = does not apply at all to 5 = applies completely | 0.026308 | 0.65 *** |
| I participated in continuing education (e.g., community colleges). 1 = never to 8 = daily | 0.025053 | 0.51 *** |
| I’m always optimistic about my future. 1 = I agree a lot to 5 = I disagree a lot | 0.022349 | 0.56 *** |
| My life has a clear sense of purpose. 1 = absolutely untrue to 7 = absolutely true | 0.022106 | 0.58 *** |
| My future is filled with possibilities. 1 = Does not apply at all to 7 = Applies very much | 0.020987 | 0.67 *** |
| I have a good sense of what makes my life meaningful. 1 = absolutely untrue to 5 = absolutely true | 0.017838 | 0.56 *** |
| I make lists of things to do. 1 = does not apply at all to 5 = applies completely | 0.017615 | 0.55 *** |
| I tried to develop diverse interests outside of my job. 1 = never to 8 = daily | 0.017536 | 0.57 *** |
| My future seems infinite to me. 1 = does not apply at all to 7 = applies very much | 0.016471 | 0.66 *** |
| I try to pass along the knowledge I have gained through my experiences. 1 = Does not apply at all to 7 = Applies very much | 0.016404 | 0.63 *** |
| How much of the time during the past 4 weeks did you have a lot of energy? [r] 1 = all of the time to 7 = none of the time | 0.015136 | 0.51 *** |
| The future will bring a lot of good things for me. 1 = does not apply at all to 5 = applies completely | 0.013598 | 0.60 *** |
Note. [r] indicates reverse coded. Significance reported at *** p < 0.001.

Figure A4.
Feature importance plot of top 20 features (sensitivity analysis: top 40% vs. bottom 40%, ≥60).
Figure A4.
Feature importance plot of top 20 features (sensitivity analysis: top 40% vs. bottom 40%, ≥60).

Table A6.
Classification report using top 20 variables (sensitivity analysis: top 40% vs. bottom 40%, ≥60).
Table A6.
Classification report using top 20 variables (sensitivity analysis: top 40% vs. bottom 40%, ≥60).
| Classification Report Using Top 20 Variables (Top 40% vs. Bottom 40%) | ||||
|---|---|---|---|---|
| AUC Score: | 0.98 | |||
| PR-AUC: | 0.98 | |||
| Accuracy: | 0.94 | |||
| Balanced Acc: | 0.94 | |||
| Macro F1: | 0.94 | |||
| Classification Report: | ||||
| precision | recall | f1-score | support | |
| Low Curiosity | 0.94 | 0.94 | 0.94 | 17 |
| High Curiosity | 0.94 | 0.94 | 0.94 | 16 |
| Accuracy | 0.94 | 33 | ||
| Macro avg | 0.94 | 0.94 | 0.90 | 33 |
| Weighted avg | 0.94 | 0.94 | 0.90 | 33 |
| Repeat Stratified K-Fold CV | Mean | SD | ||
| ROC-AUC | 0.98 | 0.02 | ||
| PR-AUC | 0.98 | 0.02 | ||
| Balanced Accuracy | 0.90 | 0.05 | ||
| Macro F1 | 0.90 | 0.05 | ||
| Recall (High Curiosity) | 0.90 | 0.09 | ||
Table A7.
Feature importance table with bivariate correlations (top 20 variables, 40/40 split).
Table A7.
Feature importance table with bivariate correlations (top 20 variables, 40/40 split).
| Feature | Question | Feature Importance Score | Correlation (r) |
|---|---|---|---|
| I am looking for something that makes my life feel meaningful. 1 = absolutely untrue to 7 = absolutely true | 0.040288 | 0.54 *** |
| My future seems infinite to me. 1 = does not apply at all to 7 = applies very much | 0.037193 | 0.67 *** |
| There is plenty of time left in my life to make new plans. 1 = absolutely untrue to 7 = absolutely true | 0.032931 | 0.67 *** |
| I am seeking a purpose or mission for my life. 1 = absolutely untrue to 7 = absolutely true | 0.032807 | 0.57 *** |
| The future of humankind is unlimited. 1 = does not apply at all to 7 = applies very much | 0.029013 | 0.50 *** |
| I am looking for something that makes my life feel meaningful. 1 = absolutely untrue to 7 = absolutely true | 0.027914 | 0.62 *** |
| I look into the future with confidence. 1 = does not apply at all to 8 = completely applies | 0.024578 | 0.61 *** |
| I have important skills that I try to teach others. 1 = does not apply at all to 8 = applies very much | 0.024430 | 0.61 *** |
| I pursued an interesting leisure-time activity or a hobby. 1 = never to 8 = daily | 0.022652 | 0.57 *** |
| I am always looking to find my life’s purpose. 1 = absolutely untrue to 7 = absolutely true | 0.021564 | 0.52 *** |
| How much of the time during the past 4 weeks did you have a lot of energy? 1 = all of the time to 7 = none of the time | 0.020017 | 0.51 *** |
| Most of my life lies ahead of me. 1 = does not apply at all to 7 = applies very much | 0.019931 | 0.64 *** |
| I try to pass along the knowledge I have gained through my experiences. 1 = Does not apply at all to 7 = Applies very much | 0.018486 | 0.63 *** |
| I understand my life’s meaning 1 = absolutely untrue to 7 = absolutely true | 0.018268 | 0.54 *** |
| My life has a clear sense of purpose. 1 = absolutely untrue to 7 = absolutely true | 0.018143 | 0.58 *** |
| I expect that I will set many new goals in the future. 1 = does not apply at all to 8 = applies very much | 0.018067 | 0.65 *** |
| I participated in continuing education (e.g., community colleges). 1 = never to 8 = daily | 0.017188 | 0.51 *** |
| I’m always optimistic about my future. 1 = I agree a lot to 5 = I disagree a lot | 0.015692 | 0.56 *** |
| In my life there are always new and interesting prospects. 1 = does not apply at all to 5 = applies completely | 0.015409 | 0.65 *** |
| Overall, I expect more good things to happen to me than bad. 1 = I agree a lot to 5 = I disagree a lot | 0.014036 | 0.51 *** |
Note. [r] indicates reverse coded. Significance reported at *** p < 0.001.

Figure A5.
Feature importance plot of top 20 features (sensitivity analysis: top 50% vs. bottom 50%, ≥60).
Figure A5.
Feature importance plot of top 20 features (sensitivity analysis: top 50% vs. bottom 50%, ≥60).

Table A8.
Classification report using top 20 variables (sensitivity analysis: top 50% vs. bottom 50%, ≥60).
Table A8.
Classification report using top 20 variables (sensitivity analysis: top 50% vs. bottom 50%, ≥60).
| Classification Report Using Top 20 Variables (Top 50% vs. Bottom 50%) | ||||
|---|---|---|---|---|
| AUC Score: | 0.93 | |||
| PR-AUC: | 0.94 | |||
| Accuracy: | 0.85 | |||
| Balanced Acc: | 0.85 | |||
| Macro F1: | 0.85 | |||
| Classification Report: | ||||
| precision | recall | f1-score | support | |
| Low Curiosity | 0.88 | 0.78 | 0.82 | 18 |
| High Curiosity | 0.84 | 0.91 | 0.88 | 23 |
| Accuracy | 0.85 | 41 | ||
| Macro avg | 0.86 | 0.84 | 0.85 | 41 |
| Weighted avg | 0.86 | 0.85 | 0.85 | 41 |
| Repeat Stratified K-Fold CV | Mean | SD | ||
| ROC-AUC | 0.93 | 0.04 | ||
| PR-AUC | 0.95 | 0.03 | ||
| Balanced Accuracy | 0.84 | 0.05 | ||
| Macro F1 | 0.84 | 0.05 | ||
| Recall (High Curiosity) | 0.91 | 0.06 | ||
Table A9.
Feature importance table with bivariate correlations (top 20 variables, median 50/50 split).
Table A9.
Feature importance table with bivariate correlations (top 20 variables, median 50/50 split).
| Feature | Question | Feature Importance Score | Correlation (r) |
|---|---|---|---|
| I am seeking a purpose or mission for my life. 1 = absolutely untrue to 7 = absolutely true | 0.044799 | 0.54 *** |
| I am always searching for something that makes my life feel significant. 1 = absolutely untrue to 7 = absolutely true | 0.042664 | 0.56 *** |
| My future seems infinite to me. 1 = does not apply at all to 7 = applies very much | 0.033992 | 0.57 *** |
| Many opportunities await me in the future. 1 = does not apply at all to 7 = applies very much | 0.027291 | 0.57 *** |
| I expect that I will set many new goals in the future. 1 = does not apply at all to 8 = applies very much | 0.025342 | 0.58 *** |
| I could do anything I want in the future. 1 = absolutely untrue to 7 = absolutely true | 0.025149 | 0.51 *** |
| I am looking for something that makes my life feel meaningful. 1 = absolutely untrue to 7 = absolutely true | 0.024419 | 0.52 *** |
| I’m always optimistic about my future. 1 = I agree a lot to 5 = I disagree a lot | 0.022212 | 0.61 *** |
| There is plenty of time left in my life to make new plans. 1 = absolutely untrue to 7 = absolutely true | 0.021949 | 0.62 *** |
| Most of my life lies ahead of me. 1 = does not apply at all to 7 = applies very much | 0.021468 | 0.54 *** |
| The future of humankind is unlimited. 1 = does not apply at all to 7 = applies very much | 0.018564 | 0.67 *** |
| My future is filled with possibilities 1 = does not apply at all to 7 = applies very much | 0.017062 | 0.54 *** |
| I am always looking to find my life’s purpose. 1 = absolutely untrue to 7 = absolutely true | 0.015859 | 0.44 *** |
| My life has a clear sense of purpose. 1 = absolutely untrue to 7 = absolutely true | 0.014425 | 0.60 *** |
| I am searching for meaning in life. 1 = absolutely untrue to 7 = absolutely true | 0.013921 | 0.39 *** |
| I look into the future with confidence. 1 = does not apply at all to 8 = completely applies | 0.012318 | 0.56 *** |
| I participated in continuing education (e.g., community colleges). 1 = never to 8 = daily | 0.012195 | 0.64 *** |
| I have important skills that I try to teach others. 1 = does not apply at all to 8 = applies very much | 0.011644 | 0.50 *** |
| In my life there are always new and interesting prospects. 1 = does not apply at all to 5 = applies completely | 0.011635 | 0.48 *** |
| Overall, I expect more good things to happen to me than bad. 1 = I agree a lot to 5 = I disagree a lot | 0.010490 | 0.65 *** |
Note. [r] indicates reverse coded. Significance reported at *** p < 0.001.
Table A10.
Nested cross-validated performance of the reduced (top 20) Random Forest model across sensitivity analyses for high vs. low joyous exploration (≥60).
Table A10.
Nested cross-validated performance of the reduced (top 20) Random Forest model across sensitivity analyses for high vs. low joyous exploration (≥60).
| Top 35% vs. Bottom 35% | |
|---|---|
| Metric | ROC-AUC |
| Accuracy | 0.920 ± 0.036 |
| ROC-AUC | 0.983 ± 0.015 |
| PR-AUC | 0.984 ± 0.014 |
| Balanced Acc | 0.920 ± 0.036 |
| Macro F1 | 0.920 ± 0.037 |
| Recall (High JE) | 0.921 ± 0.070 |
| Top 45% vs. Bottom 45% | |
| Metric | ROC-AUC |
| Accuracy | 0.886 ± 0.049 |
| ROC-AUC | 0.968 ± 0.020 |
| PR-AUC | 0.970 ± 0.019 |
| Balanced Acc | 0.886 ± 0.049 |
| Macro F1 | 0.885 ± 0.050 |
| Recall (High JE) | 0.892 ± 0.082 |
| Median Split, Top 50% vs. Bottom 50% | |
| Metric | ROC-AUC |
| Accuracy | 0.823 ± 0.055 |
| ROC-AUC | 0.920 ± 0.034 |
| PR-AUC | 0.942 ± 0.027 |
| Balanced Acc | 0.817 ± 0.057 |
| Macro F1 | 0.818 ± 0.057 |
| Recall (High JE) | 0.868 ± 0.072 |
References
- Birenbauma, M.; Alhijaa, F.N.-A.; Shiltonb, H.; Kimronc, H.; Rosanskid, R. Perceived quality of life, well-being, and curiosity of older adults. Societies 2024, 15, 224. [Google Scholar] [CrossRef]
- Brandtstädter, J.; Wentura, D. Veränderungen der Zeit-und Zukunftsperspektive im Übergang zum höheren Erwachsenenalter: Entwicklungspsychologische und differentielle Aspekte. Z. Für Entwicklungspsychol. Und Pädagogische Psychol. 1994, 26, 2–21. [Google Scholar]
- Breiman, L. Random Forests. Mach. Learn. 2001, 45, 5–32. [Google Scholar] [CrossRef]
- Carstensen, L.L.; Lang, F.R. Future Orientation Scale. Stanford University: Stanford, CA, USA, 1996; unpublished manuscript. [Google Scholar]
- Cattell, R. Theory of fluid and crystallized intelligence: A critical experiment. J. Educ. Psychol. 1963, 54, 1–22. [Google Scholar] [CrossRef]
- Chu, L.; Fung, H.H. Age differences in state curiosity: Examining the role of personal relevance. Gerontology 2022, 68, 321–329. [Google Scholar] [CrossRef]
- Chu, L.; Tsai, J.L.; Fung, H.H. Association between age and intellectual curiosity: The mediating roles of future time perspective and importance of curiosity. Eur. J. Ageing 2020, 18, 45–53. [Google Scholar] [CrossRef] [PubMed]
- Cutler, A.; Stevens, J.R.; Cutler, D. Random Forests. In Ensemble Machine Learning; Springer: New York, NY, USA, 2011. [Google Scholar] [CrossRef]
- Eschmann, K.C.J.; Pereira, D.F.M.M.; Valji, A.; Dehmelt, V.; Gruber, M.J. Curiosity and mesolimbic functional connectivity drive information seeking in real life. Soc. Cogn. Affect. Neurosci. 2022, 18, nsac050. [Google Scholar] [CrossRef]
- Executive Yuan, R.O.C.T. Public Pension Reform; Department of Information Services, Executive Yuan: Taipei City, Taiwan, 2018. Available online: http://english.ey.gov.tw/News3/9E5540D592A5FECD/7a2c60ea-f734-4be5-a467-968454226042 (accessed on 11 October 2025).
- Fjell, A.M.; Walhovd, K.B. Structural brain changes in aging: Courses, causes and cognitive consequences. Rev. Neurosci. 2010, 21, 187–221. [Google Scholar] [CrossRef]
- Fjell, A.M.; Westlye, L.T.; Amlien, I.; Espeseth, T.; Reinvang, I.; Raz, N.; Agartz, I.; Salat, D.H.; Greve, D.N.; Fischl, B.; et al. High consistency of regional cortical thinning in aging across multiple samples. Cereb. Cortex. 2009, 19, 2001–2012. [Google Scholar] [CrossRef]
- Glaesmer, H.; Hoyer, J.; Klotsche, J.; Herzberg, P.Y. Deutsche Version des Revision des Life-Orientation-Tests (LOT-R) zum dispositionellen Optimismus und Pessimismus. Z. Für Gesundheitspsychol. 2008, 16, 26–31. [Google Scholar] [CrossRef]
- Gruber, M.J.; Gelman, B.D.; Ranganath, C. States of curiosity modulate hippocampus-dependent learning via the dopaminergic circuit. Neuron 2014, 84, 486–496. [Google Scholar] [CrossRef]
- Gruber, M.J.; Ranganath, C. How curiosity enhances hippocampus-dependent memory: The prediction, appraisal, curiosity, and exploration (pace) framework. Trends Cogn Sci. 2019, 23, 1014–1025. [Google Scholar] [CrossRef]
- Gudykunst, W.B.; Lee, C.M. Assessing the validity of self construal scales. Hum. Commun. Res. 2003, 29, 253–274. [Google Scholar] [CrossRef]
- Hirose, J.; Kotani, K. How does inquisitiveness matter for generativity and happiness? PLoS ONE 2022, 17, e0264222. [Google Scholar] [CrossRef]
- Hughes, M.L.; Geraci, L.; De Forrest, R.L. Aging 5 years in 5 minutes: The effect of taking a memory test on older adults’ subjective age. Psychol. Sci. 2013, 24, 2481–2488. [Google Scholar] [CrossRef] [PubMed]
- John, O.P.; Donahue, E.M.; Kentle, R.L. The Big Five Inventory—Versions 4a and 5; University of California, Berkeley, Institute of Personality and Social Research: Berkeley, CA, USA, 1991. [Google Scholar]
- Kamin, S.T.; Lang, F.R. The Subjective Technology Adaptivity Inventory (STAI): A motivational measure of technology usage in old age. Gerontechnology 2013, 12, 16–25. [Google Scholar] [CrossRef]
- Kang, M.J.; Hsu, M.; Krajbich, I.M.; Loewenstein, G.; McClure, S.M.; Wang, J.T.-y.; Camerer, C.F. The wick in the candle of learning: Epistemic curiosity activates reward circuitry and enhances memory. Psychol. Sci. 2009, 20, 963–973. [Google Scholar] [CrossRef] [PubMed]
- Kashdan, T.B.; Gallagher, M.W.; Silvia, P.J.; Winterstein, B.P.; Breen, W.E.; Terhar, D.; Steger, M.F. The curiosity and exploration inventory-ii: Development, factor structure, and psychometrics. J. Res. Pers. 2010, 43, 987–998. [Google Scholar] [CrossRef] [PubMed]
- Kashdan, T.B.; Stiksma, M.C.; Disabato, D.J.; McKnight, P.E.; Bekier, J.; Kaji, J.; Lazarus, R. The five-dimensional curiosity scale: Capturing the bandwidth of curiosity and identifying four unique subgroups of curious people. J. Res. Personal. 2018, 73, 130–149. [Google Scholar] [CrossRef]
- Kim-Knauss, Y.; Lang, F.R. Late-life preparedness and its correlates: A behavioral perspective on preparation. J. Gerontol. Ser. B Psychol. Sci. Soc. Sci. 2020, 76, 1555–1564. [Google Scholar] [CrossRef]
- Kim-Knauss, Y.; Lang, F.R.; Rohr, M.K.; Fung, H.H. For a better me? Or for a better us? Perceived utilities of aging preparatory activities and positive future thinking in Germany, USA and Hong Kong. Eur. J. Ageing 2020, 17, 259–269. [Google Scholar] [CrossRef]
- Lang, F.R. Future action and ageing preparation. In Ageing as Future; Springer: Cham, Switzerland, 2024. [Google Scholar] [CrossRef]
- Lang, F.R.; Baltes, P.B.; Wagner, G.G. Desired lifetime and end-of-life desires across adulthood from 20 to 90: A dual-source. J. Gerontol. Ser. B 2007, 62, P268–P276. [Google Scholar] [CrossRef]
- Löckenhoff, C.E.; Carstensen, L.L. Socioemotional selectivity theory, aging, and health: The increasingly delicate balance between regulating emotions and making tough choices. Int. Encycl. Media Psychol. 2004, 72, 1395–1424. [Google Scholar] [CrossRef]
- Lang, F.R.; Lessenich, S.; Rothermund, K. Ageing as Future—A Study by the Volkswagen Foundation; Springer: Berlin/Heidelberg, Germany, 2024. [Google Scholar] [CrossRef]
- Lang, F.R.; Rupprecht, F.S. Perceived personal deadlines for late-life preparation across adulthood. Eur. J. Ageing 2020, 18, 227–238. [Google Scholar] [CrossRef]
- Ligneul, R.; Mermillod, M.; Morisseau, T. From relief to surprise: Dual control of epistemic curiosity in the human brain. Neuroimage 2018, 1, 490–500. [Google Scholar] [CrossRef]
- Lydon-Staley, D.M.; Zurn, P.; Bassett, D.S. Within-person variability in curiosity during daily life and associations with well-being. J. Pers. 2019, 88, 625–641. [Google Scholar] [CrossRef]
- McAdams, D.P.; De St Aubin, E. A theory of generativity and its assessment through self-report, behavioral acts, and narrative themes in autobiography. J. Personal. Soc. Psychol. 1992, 62, 1003–1015. [Google Scholar] [CrossRef]
- McElwee, R.O.; Haugh, J.A. Thinking clearly versus frequently about the future self: Exploring this distinction and its relation to possible selves. Self Identity 2010, 9, 198–321. [Google Scholar] [CrossRef]
- McGillivray, S.; Murayama, K.; Castel, A.D. Thirst for knowledge: The effects of curiosity and interest on memory in younger and older adults. Psychol. Aging 2016, 30, 835–841. [Google Scholar] [CrossRef]
- Mohanty, A.; Pradhan, R.K.; Jena, L.K. Curiosity and meaning of life leading towards personal growth: The role of emotional intelligence. J. Indian Acad. Appl. Psychol. 2015, 41, 226–235. [Google Scholar]
- Morita, S.; Sueyasu, T.; Tokuda, H.; Kaneda, Y.; Izumo, T.; Nishikawa, K.; Kusumi, T.; Nakao, Y. Diets and leisure activities are associated with curiosity. PLoS ONE 2024, 19, e0314384. [Google Scholar] [CrossRef]
- Reither, C. Relationship Between One’s Motive for Curiosity and Meaning in Life. Master’s Thesis, Eastern Illinois University, Charleston, IL, USA, 2020. [Google Scholar]
- Rutt, J.L.; Löckenhoff, C.E. From past to future: Temporal self-continuity across the life span. Psychol. Aging 2016, 31, 631–639. [Google Scholar] [CrossRef]
- Sakaki, M.; Yagi, A.; Murayama, K. Curiosity in old age: A possible key to achieving adaptive aging. Neurosci. Biobehav. Rev. 2018, 88, 106–116. [Google Scholar] [CrossRef]
- Schmitt, M.; Maes, J. Vorschlag zur vereinfachung des beck-depressions-inventars (bdi) [simplification of the beck depression inventory (bdi)]. Diagnostica 2000, 46, 38–46. [Google Scholar] [CrossRef]
- Steger, M.F.; Frazier, P.; Oishi, S.; Kaler, M. The meaning in life questionnaire: Assessing the presence of and search for meaning in life. J. Couns. Psychol. 2006, 53, 80–93. [Google Scholar] [CrossRef]
- Swan, G.E.; Carmelli, D. Curiosity and mortality in aging adults: A 5-year follow-up of the Western Collaborative Group Study. Psychol. Aging 1996, 11, 449–453. [Google Scholar] [CrossRef] [PubMed]
- Tan, C.-S.; Hashimah, I.; Hashim, M.; Pheh, K.-S.; Pratt, C.; Chung, M.-H.; Setyowat, A. The mediating role of openness to experience and curiosity in the relationship between mindfulness and meaning in life: Evidence from four countries. Curr. Psychol. 2023, 42, 327–337. [Google Scholar] [CrossRef]
- Watson, D.; Clark, L.A.; Tellegen, A. Development and validation of brief measures of positive and negative affect: The PANAS scales. J. Personal. Soc. Psychol. 1988, 54, 1063–1070. [Google Scholar] [CrossRef] [PubMed]
- Whatley, M.C.; Murayama, K.; Sakaki, M.; Castel, A.D. Curiosity across the adult lifespan: Age-related differences in state and trait curiosity. PLoS ONE 2025, 20, e0320600. [Google Scholar] [CrossRef]
- Zheng, C.; Liang, L.; Yuan, T.; Fei, J.; Zhao, X.; Wang, H.; Gao, J.; Liu, X.; Mei, S. Does childhood curiosity influence depression in adulthood? J. Psychiatr. Res. 2025, 183, 79–85. [Google Scholar] [CrossRef]
- Zimbardo, P.G.; Boyd, J.N. Putting time in perspective: A valid, reliable individual-differences metric. J. Personal. Soc. Psychol. 1999, 77, 1271. [Google Scholar] [CrossRef]


Disclaimer/Publisher’s Note: The statements, opinions and data contained in all publications are solely those of the individual author(s) and contributor(s) and not of MDPI and/or the editor(s). MDPI and/or the editor(s) disclaim responsibility for any injury to people or property resulting from any ideas, methods, instructions or products referred to in the content. |
© 2026 by the authors. Licensee MDPI, Basel, Switzerland. This article is an open access article distributed under the terms and conditions of the Creative Commons Attribution (CC BY) license.