Abstract
Condition monitoring of rolling bearings is essential for ensuring the reliability of mechanical systems operating under severe or insufficient lubrication conditions. This study proposes a fault diagnosis framework that integrates tribological interpretation of wear phenomena, acoustic emission (AE) signal analysis, and machine learning, based on bearing life tests conducted under dry conditions as an accelerated wear environment to capture damage progression within a practical experimental time. Unlike conventional studies relying on artificially introduced defects, this work focuses on AE signals obtained from bearings in which damage initiates and progresses through actual wear processes. Life tests were conducted using deep groove ball bearings under two radial load conditions. The temporal evolution of the coefficient of friction, AE signals, and surface damage was analyzed. Although the coefficient of friction was the most sensitive indicator of wear progression, its direct measurement is impractical for in-service applications. Frequency-domain analysis revealed that AE counts per second and band-specific AE energy exhibit early changes consistent with the evolution of the friction coefficient. Using these physically interpretable AE features, a fully connected neural network was developed to classify bearing conditions into normal, early-stage damage, and damage progression. The proposed model achieved an average classification accuracy of approximately 85%, demonstrating the effectiveness of AE-based machine learning for bearing fault diagnosis under real wear progression conditions rather than artificial defect scenarios.
1. Introduction
Rolling bearings are among the most widely used mechanical components in industrial machinery, automobiles, and power generation equipment, and their integrity directly affects the reliability and safety of mechanical systems. Consequently, condition monitoring and maintenance of rolling bearings are essential tasks for ensuring stable and safe operation of machinery [1,2,3]. However, in recent years, the number of skilled maintenance engineers has decreased due to aging and labor shortages, creating serious challenges in maintenance and inspection sites [4,5]. Under these circumstances, there is a strong demand for automated diagnostic systems capable of continuously monitoring bearing conditions and detecting abnormalities at an early stage without relying on human expertise.
To realize such systems, sensing technologies that can continuously monitor the condition of sliding and rolling contacts and diagnose subtle changes with high sensitivity and accuracy are required. Vibration-based methods using acceleration sensors have been widely applied for bearing condition monitoring. These methods enable the identification of damaged components (rolling elements, inner rings, outer rings) and evaluation of lubrication conditions through frequency-domain analysis, and recent studies have introduced deep neural networks (DNNs) for bearing damage classification [6,7,8,9]. However, vibration-based approaches have limitations, particularly under low rotational speed conditions, where early-stage damage cannot be reliably detected due to insufficient signal sensitivity [10,11].
To overcome these limitations, acoustic emission (AE)-based diagnostic methods have attracted increasing attention. AE refers to the phenomenon in which elastic waves are released when materials undergo irreversible processes such as plastic deformation, crack initiation and propagation, or wear. Compared with conventional vibration sensors, AE sensors can detect microscopic damage events with higher sensitivity, making them suitable for early damage detection in rolling bearings [12,13].
Numerous studies have combined AE signals with machine learning techniques to classify bearing conditions, reporting high classification accuracy between normal and damaged states [14,15]. However, many of these studies rely on artificially introduced defects, which do not necessarily represent the actual damage progression observed in operating bearings. In real machinery, a large proportion of bearing failures occur before the rated fatigue life and are mainly caused by lubrication starvation, contamination, or wear-related mechanisms rather than fatigue spalling [16,17,18,19]. In such cases, damage manifests as progressive wear at the contact surfaces.
Friction coefficient is a key parameter for evaluating wear severity, and previous studies have reported strong correlations between friction coefficient and surface roughness, wear volume, and wear width [20,21]. Because the friction coefficient directly reflects contact conditions at sliding interfaces, it is considered an effective indicator of bearing degradation. However, direct measurement of the friction coefficient in actual machines is generally impractical. Therefore, identifying AE-based parameters that exhibit behavior comparable to the friction coefficient is crucial for practical early damage diagnosis.
In this study, bearing life tests were conducted using deep groove ball bearings under dry conditions. AE signals, surface morphology, and friction coefficient were simultaneously measured to clarify the relationship between AE characteristics and wear phenomena. Furthermore, machine learning-based bearing condition diagnosis was investigated using AE features that correlate with friction coefficient changes. The novelty of this study lies in integrating friction-coefficient-based physical interpretation with AE signal analysis and machine learning, using bearing life test data obtained from actual wear progression rather than artificially introduced defects.
2. Experimental Method
2.1. Bearing Life Tests
2.1.1. Experimental Apparatus
Figure 1a,b present a schematic illustration of the experimental setup, while an actual photograph of the test rig has been added as Figure 1c to provide a clearer understanding of the practical implementation of the system. The test apparatus was designed to rotate a test bearing under a constant radial load, enabling the measurement and evaluation of frictional behavior and damage progression occurring during operation. The test bearing was a deep groove ball bearing, which is one of the most commonly used bearing types (bearing number: 6201; number of rolling elements: 7; outer diameter: 32 mm; inner diameter: 12 mm; width: 10 mm; material: AISI 52100 steel; manufacturer: MonotaRO Co., Ltd., Osaka, Japan). The bearing was installed inside a housing and fixed with bolts to ensure stable positioning during the tests. A radial load was applied from below, and the bearing was rotated at a constant speed using an electric motor.
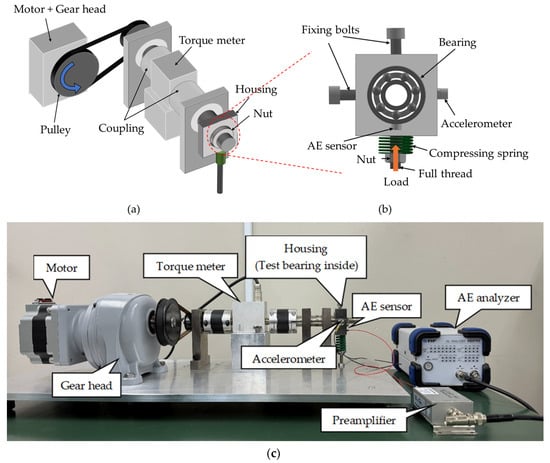
Figure 1.
Schematic diagram and photograph of experimental apparatus used for the bearing life test: (a) overall view; (b) enlarged view of the bearing section; (c) configuration appearance.
A motor equipped with a gear head was employed as the driving unit. This configuration prevented rotational stoppage even when the friction torque increased due to bearing damage progression. To compensate for the reduction in rotational speed caused by the gear head, a pulley system capable of high-speed rotation was incorporated. A torque meter was installed between the pulley and the housing to directly measure the friction torque generated by the bearing, enabling the calculation of the friction coefficient.
For AE signal measurement, an AE sensor was mounted in a groove provided beneath the bearing and placed in direct contact with the bearing outer ring. AE signals were measured using a broadband AE sensor with a frequency response range of 300 kHz to 2 MHz (model: AE-900M, NF Corporation, Yokohama, Japan). The sensor had a diameter of 5 mm and a height of 3.2 mm. After detection by the sensor, AE signals were amplified using a preamplifier (model: 9917, NF Corporation, Yokohama, Japan) and analyzed using an AE analyzer (model: AE-9702, NF Corporation, Yokohama, Japan) to extract various signal features. To reduce the influence of high-frequency noise, a high-pass filter (HPF) was set to 20 kHz. The low-pass filter (LPF) was set to THRU, and the amplifier gain was set to 20 dB. To reduce signal attenuation and ensure effective acoustic coupling, a thin layer of coupling grease was applied solely to ensure acoustic coupling between the sensor and the outer ring, without affecting the bearing contact conditions. In addition, an acceleration sensor was installed for comparison, allowing differences in signal characteristics between AE-based and conventional vibration-based methods to be evaluated. Acceleration signals were measured using an acceleration sensor with a maximum measurable acceleration of 2200 m/s2 (model: NP-3412, ONO SEIKI Co., Ltd., Ono, Japan), enabling comparative evaluation with AE signals.
The radial load was applied using a compression spring installed beneath the housing, with a spring constant of 131.64 N/mm. The compression spring was mounted on a threaded rod, and the applied radial load was adjusted by rotating a nut located beneath the spring, thereby compressing the spring to the desired level.
Friction torque was measured using a torque meter with a maximum measurable torque of 5 N·m (model: UTMIII-5Nm, Unipulse Corporation, Tokyo, Japan). The friction coefficient was calculated from the measured friction torque using the following relationships. A schematic diagram illustrating the generation of friction torque in the bearing is shown in Figure 2. During the experiments, the bearing rotated in the clockwise direction. The friction force acting on the bearing is denoted as F, and the mean bearing radius, defined as the midpoint between the inner and outer diameters, is denoted as rm. When the friction torque measured by the torque meter is denoted as T, the following relationship holds:
T = F × rm.
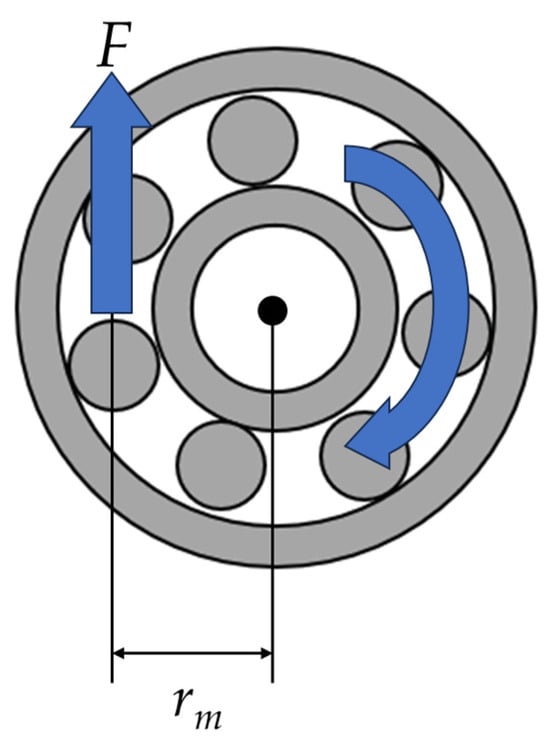
Figure 2.
Forces acting on the bearing during operation.
If the radial load applied to the bearing is denoted as N and the friction coefficient as μ, the friction coefficient μ can be expressed as
μ = T/(N × rm).
2.1.2. Experimental Procedure and Test Conditions
To eliminate the influence of lubrication and to clearly observe wear and damage progression, bearing life tests were conducted under dry conditions. Prior to testing, the bearings were immersed in a beaker containing 20 mL each of acetone and hexane and subjected to ultrasonic cleaning to remove residual lubricants and contaminants. After cleaning, the bearings were dried and mounted in the housing, and the test apparatus was assembled.
At the start of each test, the compression spring was compressed to apply the prescribed radial load, and the motor was activated to initiate bearing rotation. The rotational speed of the bearing was set to 1500 rpm. Two radial load conditions, 197.5 N and 395 N, were examined. During the tests, AE signals, friction torque (friction coefficient), and acceleration signals were measured simultaneously, and changes in these signals associated with bearing damage progression were evaluated.
The purpose of employing unlubricated conditions was not to reproduce realistic operating environments but to accelerate wear progression and induce measurable damage within a relatively short experimental time. Under the present load and rotational speed conditions, the bearing typically operated for approximately 1500–2000 s before a rapid increase in friction coefficient and severe surface damage were observed.
It is acknowledged that in practical industrial applications, bearings rarely operate under fully dry conditions, and the presence of lubricant significantly affects damping behavior, temperature rise, and wear mechanisms. Therefore, the present study should be regarded as an accelerated feasibility investigation aimed at clarifying the fundamental relationship between wear progression and AE signal characteristics under severe contact conditions.
2.2. Bearing Fault Diagnosis Using a Machine Learning Model
2.2.1. Construction of Learning Data Samples
In this study, data samples for the machine learning model were constructed based on time-series data obtained from bearing life tests. The bearing operating condition was classified into three stages: Normal, Early Stage of Damage, and Damage Progression. This classification focused on the friction coefficient as a parameter that directly reflects the progression of wear in rolling bearings and was performed based on its statistical distribution characteristics.
Because control limits based on normal distributions are widely used in anomaly detection and quality control, the classification in this study was conducted using the normal distribution of the friction coefficient in a stable operating interval. Specifically, data from a 300 s period starting from the point at which the friction coefficient became stable were extracted, and the mean value μ and standard deviation σ within this interval were calculated. To reduce the influence of short-term fluctuations, the friction coefficient was evaluated using a 5 s moving average.
The classification criteria for each operating state were defined as follows:
- Normal state: friction coefficient less than μ + 3σ;
- Early stage of damage: friction coefficient continuously equal to or greater than μ + 3σ;
- Damage progression: friction coefficient continuously equal to or greater than 1.25 μ.
Here, ‘continuously’ refers to a duration exceeding 5 s after moving-average processing.
These threshold settings enable stepwise detection of statistical deviations and pronounced increases in the friction coefficient associated with wear progression.
For AE signals, two indicators that were confirmed to be effective for abnormality detection based on bearing life test results were adopted: counts per second and AE energy. The counts per second were calculated by setting a threshold of 10 mV and counting the number of AE signal events exceeding this threshold in each 1 s interval.
AE energy was calculated by applying FFT processing to the acquired AE signals and summing the frequency components of the resulting power spectrum. Considering differences in AE generation mechanisms, the frequency range was divided into three bands: 0–0.1 MHz, 0.1–0.5 MHz, and 0.5–1 MHz, and the energy in each band was calculated separately.
As with the friction coefficient, each AE parameter was normalized by using the average value over the 300 s stable interval as a reference, and the change from this baseline was calculated as a variation value. Finally, for all parameters, the maximum value within each 5 s interval was extracted and used as one data sample for input to the machine learning model. The learning dataset consisted of bearing life test data obtained from seven tests under each of the two radial load conditions, 197.5 N and 395 N.
2.2.2. Learning Method and Model Configuration
Using the data samples constructed in the previous section, machine learning was performed with a fully connected neural network (FCNN), as shown in Figure 3. Model construction and training were implemented using the Python (version 3.9.18) programming language, with the scikit-learn and TensorFlow (version 2.6.0, Keras API) libraries.
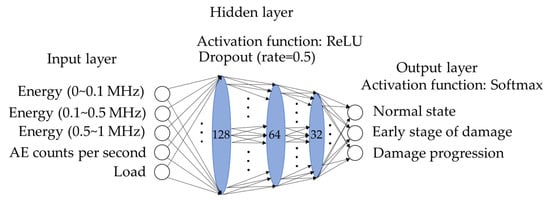
Figure 3.
Architecture of the machine learning model used for bearing state classification.
The model employed five input parameters and performed feature extraction and nonlinear transformation through three hidden layers with 128, 64, and 32 nodes, respectively. The Rectified Linear Unit (ReLU) function was used as the activation function for the hidden layers. A Softmax function was applied to the output layer to classify the bearing condition into three classes: Normal, Early Stage of Damage, and Damage Progression.
To suppress overfitting, a dropout layer was placed after each hidden layer, with a dropout rate of 0.5. The Adam optimizer was used for model optimization, and categorical cross-entropy, which is suitable for multi-class classification, was adopted as the loss function. Classification accuracy was used as the evaluation metric.
The dataset was divided into training and test sets at a ratio of 8:2. Stratified sampling was applied to preserve the sample ratios of each class. Model training was performed for 100 epochs with a batch size of 32, and generalization performance during training was evaluated using the 20% test dataset.
As shown in Table 1, the dataset used in this study exhibited class imbalance, with a larger number of samples in the Normal state and fewer samples in the Early Stage of Damage and Damage Progression states. If standard training is applied to such imbalanced data, the model tends to preferentially learn the majority class, resulting in reduced classification performance for minority classes.

Table 1.
Number of samples and class weights used for machine learning.
To address this issue, class weights were introduced to adjust the importance of each class during training. The weight wk for class k was calculated using the following equation:
where N is the total number of samples, K is the number of classes, and nk is the number of samples belonging to class k. By multiplying the loss function by these class weights, greater penalties were imposed on misclassification of minority classes, thereby reducing the influence of class imbalance on the learning results.
wk = N/(K × nk),
In addition, all input features were standardized to improve training stability and convergence. Standardization was performed using the StandardScaler (version 1.5.1), and the mean and standard deviation calculated from the training data were applied to both the training and test datasets.
Under these conditions, three independent training runs were conducted in this study, and the resulting classification performance was evaluated to assess the reproducibility and diagnostic capability of the proposed model.
3. Experimental Results and Discussion
3.1. Time Evolution of Signals During Bearing Life Tests
Figure 4 shows the time evolution of AE amplitude, acceleration, and friction coefficient during continuous operation until bearing failure under a radial load of 197.5 N. From the start of the test to approximately 1500 s, the friction coefficient remained stable at a low value (approximately 0.0085), and the AE amplitude fluctuated around a nearly constant baseline (approximately 0.4 V). During this period, the acceleration signal also exhibited no significant variation, indicating that the bearing operated in a quasi-steady state.
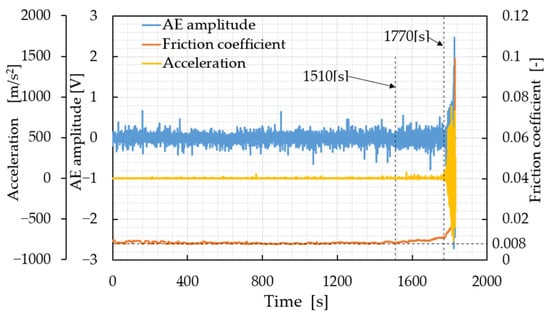
Figure 4.
Typical temporal variations in AE amplitude, acceleration, and friction coefficient during the bearing life test under a radial load of 197.5 N.
In contrast, the friction coefficient began to increase at around 1510 s and subsequently exhibited a gradual rise associated with damage progression, followed by a sharp increase in the final stage of the test (right axis in Figure 4). Notably, the onset of the friction coefficient increase was observed earlier than the pronounced increases in AE amplitude and acceleration. This result indicates that, under the present test conditions, the friction coefficient is the parameter that most sensitively and earliest reflects changes in the contact condition and wear progression at the sliding interfaces. Under dry conditions, metal-to-metal contact readily occurs between the rolling elements and raceways, and the initiation and progression of microscopic wear directly affect the friction torque, leading to the observed early increase in the friction coefficient.
For AE amplitude and acceleration, clear increases were observed for both signals at approximately 1770 s, followed by rapid growth toward the end of the test. The acceleration signal exhibited large peaks on the order of 103 m/s2 in the final stage, while the AE amplitude simultaneously increased to several volts. These results indicate that, once damage becomes macroscopically apparent (damage progression stage), AE and acceleration signals exhibit pronounced changes at approximately the same timing.
However, during the quasi-steady period prior to 1770 s, the acceleration signal remained nearly constant, whereas the AE amplitude exhibited sporadic transient increases. This behavior reflects the high sensitivity of AE to localized and high-speed damage events, such as plastic deformation and the initiation or propagation of microcracks. Therefore, although the friction coefficient captures the earliest change in bearing condition, its practical application to real machinery is limited. From a practical standpoint, identifying AE parameters that exhibit early changes consistent with friction coefficient evolution is essential. Similar trends—namely, a preceding increase in friction coefficient followed by pronounced increases in AE and acceleration in the final stage—were also observed under the 395 N load condition.
3.2. Surface Morphology and Frequency Characteristics of AE Signals
Figure 5 presents the bearing surface morphologies observed using a laser scanning microscope (OLS5000, Olympus, Tokyo, Japan). Because the bearings used in this study employed a pressed cage and disassembly was required for surface observation, the bearings stopped in the normal state and those that experienced damage were different specimens.
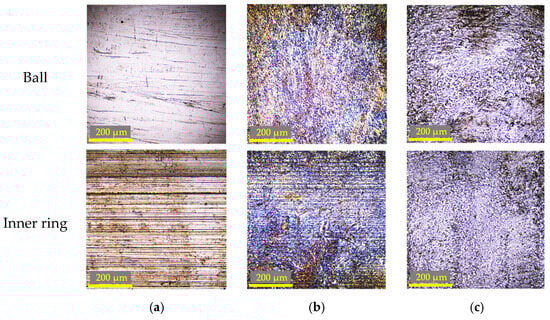
Figure 5.
Surface morphology of the bearing raceway and ball observed by laser microscopy: (a) normal stage; (b) damage progression at a radial load of 197.5 N; (c) damage progression at a radial load of 395 N.
In the normal stage (Figure 5a), distinct machining marks aligned parallel to the rolling direction were observed, and the overall surface exhibited a relatively uniform machining morphology. In contrast, in the damaged stage, the directional nature of the wear tracks became less pronounced, and non-uniform wear and surface roughening became dominant. Under the 197.5 N load condition (Figure 5b), locally glossy regions were observed on the surface, suggesting the contribution of severe wear accompanied by localized adhesion and shear. In addition, the presence of dark wear debris indicates that abrasive wear caused by entrapped wear particles may have begun to occur. Under the 395 N load condition (Figure 5c), surface roughening became more pronounced, suggesting that abrasive wear mediated by wear debris became more dominant. Furthermore, blackened regions were observed, indicating the occurrence of scuffing or seizure accompanied by localized temperature rise.
Figure 6 shows the FFT analysis results of AE signals in the normal stage (Figure 6a) and the damaged stage (197.5 N: Figure 6b; 395 N: Figure 6c). In the normal stage, a dominant peak was observed near 0.034 MHz, while high-frequency components were relatively small. In the damaged stage, the dominant peak near 0.034 MHz remained, whereas multiple new peaks appeared in the higher-frequency region. Under the 197.5 N condition, peaks were observed near 0.45 MHz, 0.6 MHz, 0.68 MHz, and 0.84 MHz, indicating diversification of frequency components associated with damage progression. Under the 395 N condition, peaks near 0.45 MHz and 0.84 MHz became particularly pronounced, demonstrating a marked increase in high-frequency components.
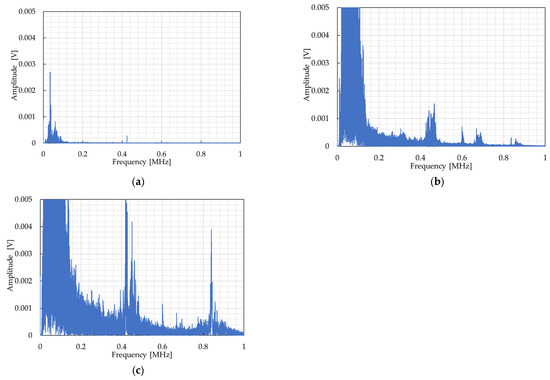
Figure 6.
Frequency-domain analysis of AE signals: (a) normal stage; (b) damage progression at a radial load of 197.5 N; (c) damage progression at a radial load of 395 N.
Unlike fatigue-induced defects that generate periodic excitation at characteristic frequencies, wear-driven damage progresses through stochastic contact events, including plastic deformation, asperity fracture, and debris interaction. These processes produce broadband AE signals with energy distributed over multiple frequency ranges. In this study, the diagnostic interpretation does not rely on the identification of specific characteristic frequencies. Instead, the energy distribution within defined frequency bands is used as an indicator of damage progression. The gradual increase in AE energy in low- and mid-frequency bands corresponds to increasing contact severity and wear activity, while the emergence of high-frequency components is associated with severe damage such as scuffing or seizure. This energy-based approach is more robust under real wear conditions, where excitation is inherently random and may not follow deterministic frequency patterns.
Considering the dry test conditions and the surface morphology shown in Figure 5, the low-frequency peak near 0.034 MHz is likely attributable to localized plastic deformation associated with repeated contact events between surface asperities. In contrast, the peak near 0.45 MHz may correspond to the progression of severe and abrasive wear, such as impacts and scratching caused by entrapped wear debris, while the peak near 0.84 MHz likely reflects abrupt damage events associated with severe damage, such as scuffing. These interpretations are consistent with the band-specific AE energy analysis discussed in the following section.
Although the frequency-domain AE signals were not extracted directly from specific surface features, the evolution of frequency components showed consistent correspondence with the observed surface damage states. The appearance of higher-frequency components in the damaged stage coincided with the transition from mild wear to severe adhesive and abrasive wear observed in the surface morphology. This suggests that the AE signal characteristics reflect the overall severity of contact interactions rather than localized deterministic defects.
It should be noted that the frequency components observed in this study are not associated with classical bearing defect frequencies such as ball pass frequency of outer race (BPFO) or ball pass frequency of inner race (BPFI), which are typically generated by localized fatigue defects. Instead, the present interpretation focuses on wear-driven stochastic contact events, and the observed components are regarded as broadband indicators of damage severity rather than signatures for defect localization.
3.3. Relationship Between AE Signal Parameters and Friction Coefficient
The results presented above indicate that the friction coefficient captures bearing condition changes at an early stage; however, its application to actual machinery is impractical. Therefore, this section focuses on extracting AE parameters that enable early damage detection with sensitivity comparable to that of the friction coefficient.
3.3.1. Counts per Second
The count parameter represents the number of AE events exceeding a predefined threshold. In this study, the threshold was set to 10 mV, considering that the white noise level of the AE sensor was approximately 5 mV, and the parameter was evaluated as counts per second.
Figure 7 shows the time evolution of counts per second and the friction coefficient under the 197.5 N load condition. During the early stage of the test, the counts per second remained within the range of approximately 2.5 × 10⁴ to 3.2 × 10⁴ s−1, with no clear trend. However, around 1510 s—corresponding to the onset of friction coefficient increase—the counts per second began to increase gradually. As damage progressed, the rate of increase accelerated, and in the final stage of the test, the counts per second rapidly increased to values exceeding 6.2 × 10⁴ s−1. Thus, the counts per second exhibited changes in the same time window as the initial rise in the friction coefficient, suggesting that this parameter is effective for early damage detection.
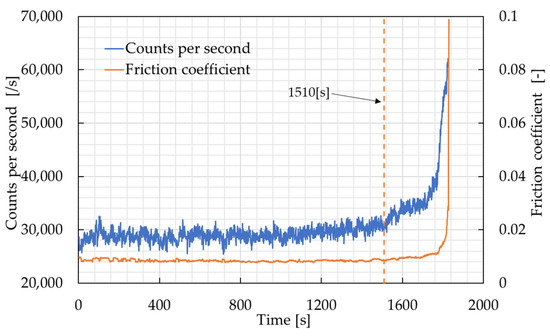
Figure 7.
Temporal variations in AE counts per second and friction coefficient during the bearing life test under a radial load of 197.5 N.
This increase can be attributed to two main factors: (i) an increase in AE amplitude due to damage progression, resulting in a higher number of threshold-exceeding events, and (ii) an increase in high-frequency components, leading to a higher rate of signal fluctuations. Similar trends were also observed under the 395 N load condition, confirming the robustness of this parameter.
3.3.2. AE Energy (Band-Specific Analysis)
Next, AE energy was examined as a diagnostic parameter. AE energy was calculated as the sum of frequency components of the power spectrum obtained after FFT processing. By limiting the analysis to specific frequency bands, damage-related components associated with different wear mechanisms can be extracted. In this study, AE energy was evaluated for the full frequency range (0–1 MHz) as well as for three sub-bands: 0–0.1 MHz, 0.1–0.5 MHz, and 0.5–1 MHz.
Figure 8 shows the time histories of the coefficient of friction and the band-specific AE energy under a radial load condition of 197.5 N. Figure 8a–d present the simultaneous variations in AE energy and the coefficient of friction in the total frequency band (0–1 MHz), the low-frequency band (0–0.1 MHz), the middle-frequency band (0.1–0.5 MHz), and the high-frequency band (0.5–1 MHz), respectively.
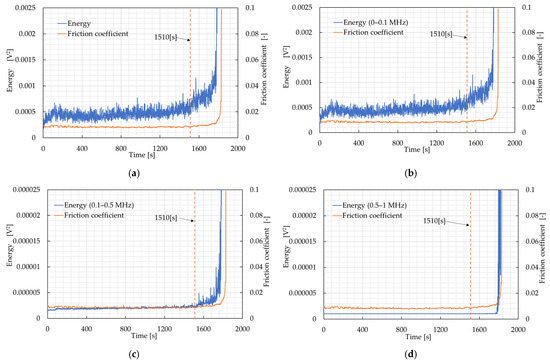
Figure 8.
Temporal variations in AE energy and friction coefficient during the bearing life test under a radial load of 197.5 N: (a) full frequency range (0–1 MHz); (b) low-frequency range (0–0.1 MHz); (c) middle-frequency range (0.1–0.5 MHz); (d) high-frequency range (0.5–1 MHz).
During the normal operation stage, from the start of the test up to approximately 1500 s, the AE energy in all frequency bands remains stable at low levels, while the coefficient of friction also exhibits an almost constant and low value. Around 1510 s, when the coefficient of friction begins to increase, the AE energy in the total band (0–1 MHz) (Figure 8a), the low-frequency band (0–0.1 MHz) (Figure 8b), and the middle-frequency band (0.1–0.5 MHz) (Figure 8c) is observed to shift almost simultaneously to a gradual increasing trend. In these frequency bands, the increase in AE energy is detected prior to the rapid rise in the coefficient of friction, indicating that these bands are effective indicators for reflecting changes in the surface contact state and the early stage of wear progression.
In particular, in the 0–0.1 MHz and 0.1–0.5 MHz bands, the AE energy increases continuously immediately after the coefficient of friction exceeds the control limit, suggesting a response to an increased frequency of plastic deformation, severe wear, and abrasive wear events. In contrast, in the high-frequency band of 0.5–1 MHz (Figure 8d), no pronounced change is observed around 1510 s; instead, the AE energy increases sharply during the final stage of the test, when the coefficient of friction rises rapidly. This frequency band includes high-frequency peaks that were previously identified by FFT analysis as being associated with scuffing or seizure (e.g., around 0.84 MHz), and therefore exhibits characteristics that become prominent at the stage of severe surface damage.
From these results, it is suggested that band-specific AE energy enables early damage detection from the initial stage of wear when low- to middle-frequency bands (0–0.5 MHz) are utilized, whereas the high-frequency band (0.5–1 MHz) is effective for detecting severe damage such as scuffing. In other words, by evaluating AE energy according to the frequency band, it is possible to employ a role-sharing diagnostic index that corresponds to different stages of damage progression.
Previous studies have also reported correlations between AE energy and tool wear or friction coefficient during friction tests [22,23], supporting the validity of AE energy as a parameter reflecting damage progression associated with surface morphology changes. Similar band-specific increases in AE energy corresponding to damage progression were confirmed under the 395 N load condition.
Overall, these results indicate that early bearing damage detection consistent with friction coefficient evolution can be achieved by analyzing AE signals using counts per second and band-specific AE energy. Furthermore, the appropriate selection of frequency bands suggests the potential for classifying damage modes, such as severe wear, abrasive wear, and scuffing, based on AE signal characteristics.
3.4. Bearing State Classification Results by Machine Learning
Table 2 summarizes the final classification accuracy obtained in the three independent training runs conducted in this study. The accuracies were 85.0%, 85.1%, and 86.3%, yielding an average classification accuracy of approximately 85.5%. These results indicate that the constructed FCNN model is capable of classifying the bearing condition into three stages based on AE signal parameters.
Table 2.
Summary of classification accuracy obtained from the machine learning model.
To evaluate the classification performance in greater detail, the confusion matrices corresponding to each training run are presented in Table 3, Table 4 and Table 5. Here, the discussion focuses on the recall for each class (i.e., the proportion of correctly predicted samples among the samples with the true label).
Table 3.
Confusion matrix for Experiment No.1.
Table 4.
Confusion matrix for Experiment No.2.
Table 5.
Confusion matrix for Experiment No.3.
For the Normal class, the recall ranged from 0.86 to 0.89 across the three training runs, indicating that nearly 90% of the normal samples were correctly classified. Although approximately 0.11–0.14 of the normal samples were misclassified as an early stage of damage, misclassification into damage progression was almost negligible (0–0.01). This suggests that the feature distributions of the normal and damage progression classes are substantially different in the feature space.
For the damage progression class, the recall was also high (0.86–0.89), and misclassification into the normal class was almost absent. While a fraction of samples (0.11–0.14) was misclassified as an early stage of damage, severe damage states appear to be clearly distinguishable from the other classes due to the marked increase in AE amplitude and the emergence of high-frequency components.
In contrast, the classification performance for the early stage of damage class was slightly lower than that for the other two classes. The recall ranged from 0.78 to 0.82, indicating that approximately 20% of early-stage samples were misclassified as normal. Misclassification from the early stage of damage to damage progression was extremely rare (0.01–0.03), implying that most classification errors occurred primarily at the boundary between normal and the early stage of damage.
This outcome can be attributed to the fact that, during the early damage stage, the change in friction coefficient remains small and the corresponding variations in the AE parameters used in this study (counts per second and AE energy) are also limited. Consequently, the feature distributions of the normal and early stages of damage classes partially overlap. In other words, while the AE parameters employed in this study are sufficiently effective for detecting damage progression, distinguishing the very early phase immediately before wear becomes macroscopically apparent remains challenging.
Nevertheless, in bearing condition monitoring, it is critical not only to detect severe damage reliably but also to discriminate between normal and the early stage of damage to enable early warning of abnormality. Therefore, in the next subsection, the samples misclassified between normal and the early stage of damage are extracted from the learning results, and their feature behavior and AE signal characteristics are examined in detail. At the same time, the classification performance should be interpreted in light of the intrinsic complexity of real wear processes, particularly in the early damage stage, where physical state transitions are gradual and non-uniform. Overall, the proposed approach demonstrates reliable detection of severe damage and also suggests the feasibility of AE-based early damage detection; further improvements are expected through advanced feature engineering and the incorporation of time-series information. The achieved classification accuracy of approximately 85% should be interpreted in the context of the present dataset, which is based on real wear progression rather than artificially introduced defects. Compared with controlled defect studies, real wear evolution is inherently irregular and varies between individual bearings, making classification significantly more challenging. From this perspective, the obtained accuracy indicates that AE-based features retain meaningful diagnostic capability even under complex and non-deterministic damage conditions.
3.5. Detailed Analysis of Misclassified Samples
Figure 9 presents, among the bearing life test results, a sample with no misclassification (Figure 9a) and two samples with frequent misclassification: (i) a sample in which early stage of damage was often misclassified as normal (Figure 9b), and (ii) a sample in which normal was often misclassified as early stage of damage (Figure 9c). For each sample, the time histories of the friction coefficient and the variation in AE energy (0.1–0.5 MHz) are shown together with the time points where misclassification occurred.
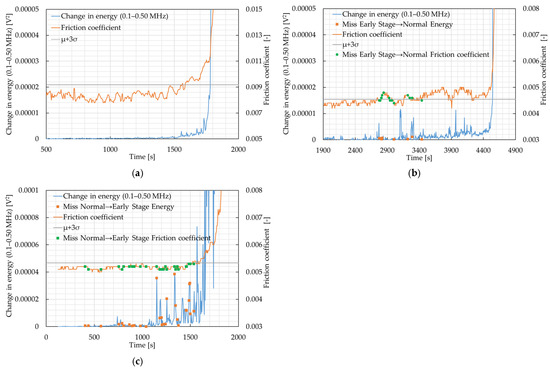
Figure 9.
Temporal variations in AE energy (0.1–0.5 MHz) and friction coefficient for samples associated with misclassification: (a) sample without misclassification; (b) sample with frequent misclassification from early-stage damage to normal; (c) sample with frequent misclassification from normal to early-stage damage.
Similarly, Figure 10 shows the results for the variation in AE counts per second for a sample without misclassification (Figure 10a) and samples with frequent misclassification (Figure 10b,c).
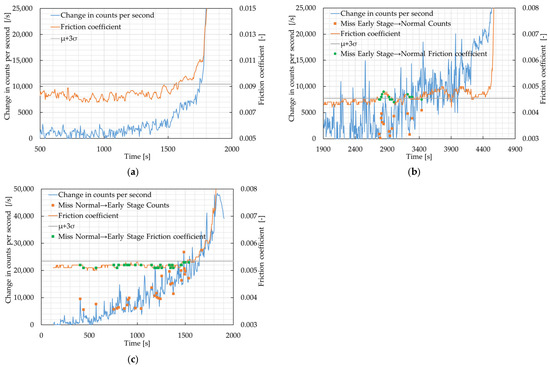
Figure 10.
Temporal variations in AE counts per second and friction coefficient for samples associated with misclassification: (a) sample without misclassification; (b) sample with frequent misclassification from early-stage damage to normal; (c) sample with frequent misclassification from normal to early-stage damage.
First, for the sample without misclassification (Figure 9a and Figure 10a), the friction coefficient, AE energy, and AE counts increased continuously at approximately the same time when the state transitioned from normal to the early stage of damage. All parameters exhibited a clear increasing trend after the friction coefficient exceeded the control limit (μ + 3σ), and neither pronounced oscillation nor temporary decreases near the boundary were observed. When these indicators show mutually consistent behavior, the class boundary in the feature space becomes clearer, enabling stable classification.
Next, for the sample in which the early stage of damage was frequently misclassified as Normal (Figure 9b and Figure 10b), a prolonged interval was observed in which the friction coefficient fluctuated up and down near the boundary even after exceeding μ + 3σ and entering the early stage of damage. During this interval, AE energy and AE counts also failed to exhibit monotonic increases and instead showed intermittent and unstable variations compared with the correctly classified sample. As a result, input features were distributed across a region spanning both classes near the normal/early stage boundary, leading to frequent misclassification of the early stage of damage as normal. This suggests that unstable behavior of the friction coefficient itself contributes to the difficulty in identifying the early-stage damage state.
In contrast, for the sample in which normal was frequently misclassified as an early stage of damage (Figure 9c and Figure 10c), AE energy and AE counts increased sharply and exhibited a relatively continuous increasing trend, even though the friction coefficient remained nearly constant and the bearing was labeled as normal. This implies that, although wear had not progressed to a level sufficient to cause a noticeable increase in friction coefficient, localized contact frequency and/or transient plastic deformation events occurred more frequently, leading to an early increase in AE parameters. Consequently, the model interpreted the AE parameter changes as an early sign of damage and misclassified the normal state as an early stage of damage.
A general tendency observed across the entire set of bearing life tests is that, even before a clear rise in friction coefficient occurs, transient and localized large contact/deformation events may take place, resulting in temporary increases in AE energy and AE counts. Such behavior can lead to the misclassification of normal conditions as an early stage of damage. On the other hand, near the early-stage boundary, the friction coefficient, AE energy, and AE counts often exhibit gradual increases accompanied by small oscillations. This oscillatory yet progressive behavior introduces ambiguity in the state transition and contributes to the misclassification of the early stage of damage as normal.
The overall classification accuracy obtained in this study was approximately 85%. Although previous studies using bearings with artificially introduced defects have reported accuracies in the high 90% range [14,15], the accuracy in this study is slightly lower. However, it should be emphasized that this study used data obtained from actual wear progression in bearing life tests rather than seeded defects, and the wear progression behavior varied significantly among specimens. Wear does not necessarily progress uniformly; instead, differences in contact conditions and the generation and removal of wear debris may cause the AE signals and friction coefficient trends to differ between tests. Therefore, some reduction in classification accuracy is considered unavoidable.
Indeed, a previous study that classified wear states based on AE signals during friction tests reported an average accuracy of 84.7% [24], which is comparable to the results obtained in this study. Accordingly, the proposed approach demonstrates a certain level of effectiveness as a fault diagnosis method for wear-induced damage in rolling bearings. Future work should focus on improving feature design to reduce specimen-to-specimen variability and adopting model architectures that explicitly incorporate time-series information, thereby enabling more accurate detection and classification of wear progression at sliding interfaces.
3.6. Discussion: Integrated Interpretation of Physical Phenomena, AE Signal Characteristics, and Machine Learning Results
In this study, bearing life tests of deep groove ball bearings under dry conditions were conducted to integrally investigate the relationships among wear-related physical phenomena, AE signal characteristics, and bearing state classification results obtained by machine learning. In practical machinery, continuous measurement of friction torque or friction coefficient is generally difficult to implement, whereas AE sensors can be installed non-invasively and are widely used for condition monitoring. Therefore, in the present study, the friction coefficient was used as a physically meaningful reference parameter to interpret AE signal variations and to define damage stages, rather than as a practical diagnostic signal. This approach enables the identification of AE-based indicators that can potentially replace friction-based monitoring in real industrial environments. In this section, the correspondence between physical phenomena occurring at the sliding interfaces and AE signal behavior is first summarized, followed by a discussion of how these relationships influence the classification performance of the machine learning model.
3.6.1. Relationship Between Wear Progression, Friction Coefficient, and AE Signals
Under dry conditions, direct metal-to-metal contact readily occurs between the rolling elements and raceways, and wear progression proceeds primarily through processes such as asperity contact, plastic deformation, adhesion, and the generation and entrapment of wear debris. In this study, the friction coefficient reflected these changes in sliding surface conditions, exhibiting a gradual increase during the early stage of damage and a rapid rise during the damage progression stage. This behavior indicates that the increase in real contact area and friction force is closely associated with wear progression.
In contrast, AE signals are generated by localized and high-speed events such as plastic deformation, initiation and propagation of microcracks, and impacts or scratching caused by wear debris. As a result, AE signals may change earlier in time than the friction coefficient. In this study, cases were observed in which AE amplitude, counts, and energy temporarily increased even before a clear rise in the friction coefficient was detected. This suggests that localized contact and deformation events occur frequently before wear progression becomes macroscopically apparent across the entire sliding surface.
3.6.2. Relationship Between AE Frequency Characteristics and Damage Modes
Frequency-domain analysis of AE signals revealed that the distribution of frequency components varies depending on the damage state. In the normal state and early damage stage, low-frequency components in the range of approximately 0.03–0.05 MHz were dominant. These components are considered to reflect AE generation associated with asperity contact and localized plastic deformation at the sliding interfaces.
In the damage progression stage, mid- to high-frequency components above approximately 0.45 MHz became pronounced, and peaks associated with severe wear, abrasive wear, and scuffing were observed. These higher-frequency components are likely related to high-energy damage events, such as impacts and scratching caused by entrapped wear debris, as well as abrupt adhesion and detachment processes. Accordingly, band-specific AE energy serves as an effective physical quantity that reflects wear mechanisms and damage severity, making it suitable for stepwise evaluation of bearing damage states.
3.6.3. Relationship Between AE Features and Classification Performance of Machine Learning
In the machine learning model employed in this study, AE counts per second and band-specific AE energy were used as input features to classify bearing conditions into three stages: normal, early stage of damage, and damage progression. As a result, an overall classification accuracy of approximately 85% was achieved, with particularly high discrimination performance for the normal and damage progression states.
In contrast, the classification accuracy for the early stage of damage was lower than that for the other two classes. Analysis of misclassified samples revealed that, during the early damage stage, the friction coefficient and AE parameters often fluctuated unstably near the classification boundary, leading to overlapping feature distributions between the normal and early stage of damage classes. This behavior reflects the fact that the early damage stage is physically transitional in nature, during which wear progression is non-uniform and highly sensitive to local contact conditions.
Furthermore, in some tests, AE parameters increased prior to any noticeable change in the friction coefficient while the bearing was still labeled as normal, resulting in misclassification of the normal state as an early stage of damage. This outcome reflects the high sensitivity of AE signals to localized and transient damage events and indicates that the same sensitivity that enables early detection can also induce misclassification when such events do not immediately lead to sustained wear progression.
3.6.4. Implications for Practical Application and Future Challenges
Although the friction coefficient is the parameter that most directly reflects sliding surface conditions, continuous measurement in actual machinery is generally impractical. In this regard, AE signals offer a significant advantage as a non-invasive and externally mountable sensing technique suitable for practical condition monitoring. The results of this study demonstrate that, when appropriately analyzed and combined with machine learning, AE signals can achieve early damage detection performance comparable to that of the friction coefficient.
It should be emphasized that the absence of lubrication significantly alters the contact mechanics, damping behavior, and tribofilm formation, which in turn affect AE signal generation and propagation. Therefore, the present results represent a severe contact condition designed to accelerate wear and highlight fundamental signal–damage relationships. Future studies under lubricated conditions will be necessary to extend the applicability of the proposed diagnostic approach to realistic operating environments.
However, improving discrimination accuracy in the early damage stage requires distinguishing between transient AE fluctuations and sustained wear progression. Future challenges include: (i) introducing models that explicitly consider time-series information, such as recurrent neural networks (RNNs) or long short-term memory (LSTM) networks; (ii) incorporating features that capture temporal gradients and fluctuation ranges of AE parameters; and (iii) constructing hybrid indicators that embed physical models of wear progression. By more tightly integrating physical understanding with data-driven approaches, further improvements in the accuracy and robustness of rolling bearing condition diagnosis can be expected.
4. Conclusions
In this study, bearing life tests of rolling bearings under dry conditions were conducted to systematically link wear-related physical phenomena occurring at sliding interfaces with AE signal characteristics and bearing state classification results obtained by machine learning. The novelty of this work lies in the development of a bearing fault diagnosis approach grounded in actual wear progression rather than artificially introduced defects.
While many previous studies have focused on classifying AE or vibration signals obtained from bearings with seeded defects, this study analyzed data obtained from bearing life tests in which damage was initiated and progressed through real wear processes. This approach enabled clarification of how AE signals evolve under operating conditions closer to actual machinery, where wear progression is non-uniform, and at which stages AE signals become effective for damage detection.
By comparing AE amplitude, acceleration, and friction coefficient, it was demonstrated that the friction coefficient is the parameter that most sensitively reflects wear-induced damage at an early stage. A key feature of this study is that the friction coefficient was used as a physical reference (teacher information) to evaluate the effectiveness of AE signals. Frequency-domain analysis of AE signals revealed low-frequency components around approximately 0.034 MHz, which are considered to originate from plastic deformation, as well as mid- to high-frequency components that become prominent with wear progression. These frequency components were shown to correspond to different wear modes and damage stages. Unlike classical defect diagnostics based on characteristic fault frequencies, the present AE responses reflect broadband energy changes associated with stochastic wear-driven contact events. Furthermore, AE counts per second and band-specific AE energy exhibited early changes consistent with increases in the friction coefficient, demonstrating their potential as diagnostic indicators applicable even in practical environments where direct measurement of the friction coefficient is not feasible.
Based on these physical insights, a fully connected neural network (FCNN) model was constructed to classify bearing conditions into three stages: normal, early stage of damage, and damage progression. The model achieved an overall classification accuracy of approximately 85%. In particular, high discrimination performance was confirmed for the normal and damage progression states, demonstrating the effectiveness of AE-based machine learning for diagnosing rolling bearings undergoing actual wear. In contrast, the reduced classification accuracy observed for the early stage of damage was shown, through detailed analysis of misclassified samples, to reflect the transitional and unstable nature of wear progression itself rather than a simple limitation of the learning performance.
It should be noted that the experiments were conducted under dry conditions to accelerate wear progression and clarify fundamental relationships between contact phenomena and AE signals. Although this represents a severe contact condition, the results provide a physically interpretable basis for identifying AE-based indicators applicable to practical condition monitoring.
Overall, this study clearly distinguishes itself from previous research by integrating a physically grounded interpretation of AE signals with machine learning and by performing bearing fault diagnosis using real wear data instead of artificial defects. Future work is expected to advance this approach toward more reliable early fault diagnosis through the development of more sophisticated feature representations and the introduction of learning algorithms that explicitly account for time-series information, thereby reducing ambiguity in the early damage stage.
Author Contributions
Conceptualization, R.L.; methodology, T.N. and R.L.; validation, T.N. and R.L.; formal analysis, T.N. and R.L.; investigation, T.N., R.L., H.T., S.K. and J.W.; writing—original draft preparation, T.N. and R.L.; writing—review and editing, T.N., R.L., H.T., S.K. and J.W.; supervision, R.L.; project administration, R.L., H.T. and S.K.; funding acquisition, R.L. All authors have read and agreed to the published version of the manuscript.
Funding
This research was funded by the JKA Foundation, grant number 2024M-568.
Data Availability Statement
The data presented in this study are available upon request from the corresponding author.
Conflicts of Interest
The authors declare no conflicts of interest.
References
- Malla, C.; Panigrahi, I. Review of condition monitoring of rolling element bearing using vibration analysis and other techniques. J. Vib. Eng. Technol. 2019, 7, 407–414. [Google Scholar] [CrossRef]
- Hotait, H.; Chiementin, X.; Rasolofondraibe, L. Intelligent online monitoring of rolling bearing: Diagnosis and prognosis. Entropy 2021, 23, 791. [Google Scholar] [CrossRef] [PubMed]
- Kannan, V.; Zhang, T.; Li, H. A review of the intelligent condition monitoring of rolling element bearings. Machines 2024, 12, 484. [Google Scholar] [CrossRef]
- Sing, C.P.; Chan, H.C.; Love, P.E.D.; Leung, A.Y.T. Building maintenance and repair: Determining the workforce demand and supply for a mandatory building-inspection scheme. J. Perform. Constr. Facil. 2016, 30, 04015053. [Google Scholar] [CrossRef]
- Nyemba, W.R.; Mashamba, A.; Mbohwa, C. Equipment maintenance challenges and solutions for capacity building and sustainability in the training of engineers: The case for the University of Zimbabwe. Procedia Manuf. 2017, 7, 303–308. [Google Scholar] [CrossRef]
- Zhao, D.; Wang, T.; Chu, F. Deep convolutional neural network-based planetary bearing fault classification. Comput. Ind. 2019, 107, 59–66. [Google Scholar] [CrossRef]
- Zhang, W.; Li, C.; Peng, G.; Chen, Y.; Zhang, Z. A deep convolutional neutral network with new training methods for bearing fault diagnosis under noisy environment and different working load. Mech. Syst. Signal Process. 2018, 100, 439–453. [Google Scholar] [CrossRef]
- Chen, Z.; Deng, S.; Chen, X.; Li, C.; Sanchez, R.; Qin, H. Deep neural networks-based rolling bearing fault diagnosis. Microelectron. Reliab. 2017, 75, 327–333. [Google Scholar] [CrossRef]
- Nguyen, V.-C.; Kang, H.-J. A bearing fault diagnosis method using multi-branch deep neural network. Machines 2021, 9, 345. [Google Scholar] [CrossRef]
- Saufi, S.R.; Ahmad, Z.A.; Leong, M.S.; Lim, M.H. Challenges and opportunities of deep learning models for machinery fault detection and diagnosis: A review. IEEE Access 2019, 7, 122644–122662. [Google Scholar] [CrossRef]
- Hase, A. Early detection and identification of fatigue damage in thrust ball bearings by an acoustic emission technique. Lubricants 2020, 8, 37. [Google Scholar] [CrossRef]
- Amini, A.; Huang, Z.; Entezami, M.; Papaelias, M. Evaluation of the effect of speed and defect size on high-frequency acoustic emission and vibration condition monitoring of railway axle bearings. Insight—Non-Destr. Test. Cond. Monit. 2017, 59, 184–188. [Google Scholar] [CrossRef]
- Cornel, D.; Gutiérrez Guzmán, F.; Jacobs, G.; Neumann, S. Condition monitoring of roller bearings using acoustic emission. Wind Energy Sci. 2021, 6, 367–376. [Google Scholar] [CrossRef]
- Zhang, Y.; Yu, Y.; Yang, Z.; Liu, Q. Rolling bearing fault identification with acoustic emission signals based on variable-pooling multiscale convolutional neural networks. Sci. Rep. 2025, 15, 15644. [Google Scholar] [CrossRef]
- Pham, M.T.; Kim, J.-M.; Kim, C.H. Intelligent fault diagnosis method using acoustic emission signals for bearings under complex working conditions. Appl. Sci. 2020, 10, 7068. [Google Scholar] [CrossRef]
- Kumar, N.; Satapathy, R. Bearings in aerospace: Application, distress, and life—A review. J. Fail. Anal. Prev. 2023, 23, 915–947. [Google Scholar] [CrossRef]
- Miller, B.A.; Shipley, R.J.; Parrington, R.J. Failure analysis and prevention. In ASM Handbook, 2021 ed.; ASM International: Materials Park, OH, USA, 2021; Volume 11, pp. 649–664. [Google Scholar] [CrossRef]
- Marko, M.D. The impact of lubricant film thickness and ball bearing failures. Lubricants 2019, 7, 48. [Google Scholar] [CrossRef]
- Morales-Espejel, G.E.; Zhou, Y. Rolling bearing damage from particle contamination – diagnosis via inspection. Tribol. Online 2024, 19, 95–104. [Google Scholar] [CrossRef]
- Prajapati, D.K.; Tiwari, M. The correlation between friction coefficient and areal topography parameters for AISI 304 steel sliding against AISI 52100 steel. Friction 2021, 9, 41–60. [Google Scholar] [CrossRef]
- Magazov, N.; Satbaeva, Z.; Rakhadilov, B.; Amanov, A. A study on surface hardening and wear resistance of AISI 52100 steel by ultrasonic nanocrystal surface modification and electrolytic plasma surface modification technologies. Materials 2023, 16, 6824. [Google Scholar] [CrossRef]
- Khripunov, N.V.; Vaskin, K.Y. Tool life estimation using acoustic emission signals. In Proceedings of the IOP Conference Series: Materials Science and Engineering; IOP Publishing: Bristol, UK, 2020; Volume 709, p. 033088. [Google Scholar] [CrossRef]
- Savchenko, N.L.; Filippov, A.V.; Tarasov, S.Y.; Dmitriev, A.I.; Shilko, E.V.; Grigoriev, A.S. Acoustic emission characterization of sliding wear under conditions of direct and inverse transformations in low-temperature degradation-aged Y-TZP and Y-TZP–Al2O3. Friction 2018, 6, 323–340. [Google Scholar] [CrossRef]
- Deshpande, P.; Pandiyan, V.; Meylan, B.; Wasmer, K. Acoustic emission and machine learning-based classification of wear generated using a pin-on-disc tribometer equipped with a digital holographic microscope. Wear 2021, 476, 203622. [Google Scholar] [CrossRef]


Disclaimer/Publisher’s Note: The statements, opinions and data contained in all publications are solely those of the individual author(s) and contributor(s) and not of MDPI and/or the editor(s). MDPI and/or the editor(s) disclaim responsibility for any injury to people or property resulting from any ideas, methods, instructions or products referred to in the content. |
© 2026 by the authors. Licensee MDPI, Basel, Switzerland. This article is an open access article distributed under the terms and conditions of the Creative Commons Attribution (CC BY) license.