Abstract
During catheter interventional procedures, the catheter inevitably encounters the vessel wall. When the push–pull force at the catheter–vessel wall interface exceeds a certain threshold, it may cause vascular damage. The mechanical feedback at the catheter–blood interface are still areas that urgently need to be addressed. This study provides essential experimental data and mechanical feedback to inform and validate such simulations. Therefore, this article first analyzed the movement form and mechanical state of the catheter and blood vessel during vascular interventional surgery. Based on this, this paper analyzes the movement forms and mechanical states of the catheter and blood vessels during intervention, focusing on the contact force between the catheter and blood vessels. The results of the three-point bending test indicate that the bending deformation force of the tube increases as the radius decreases, and the overall deformation progresses from elastic deformation to the yield limit. The normal force of the tube on the lumen and the average push–pull force at the end of the tube are all positively correlated with the moving speed and bending degree of the tube. Statistical analysis revealed that the degree of lumen curvature had a significantly greater influence on the push–pull force than catheter motion speed. The above research provides guidance for friction at the medical device–vessel interface and coating design.
1. Introduction
Cardiovascular diseases commonly affect health and quality of life. Common types in clinical practice include hypertension, hyperlipidemia, thrombosis, atherosclerosis, and coronary heart disease [1,2,3,4,5,6]. Vascular interventional surgery is an emerging treatment that primarily involves vascular puncture, wire insertion, catheter insertion, and related diagnostic and management steps [7,8,9]. This approach offers minimal trauma, high precision, straightforward operation, and rapid recovery, making it the mainstream method for vascular disease treatment. Common procedures include percutaneous coronary intervention, transcatheter aortic valve replacement, radiofrequency ablation, structural heart disease intervention, and endovascular aneurysm repair [10].
During vascular interventional surgery, after the catheter enters a blood vessel, the doctor must control its movement due to the complexity of the vessel. The push–pull force, applied to advance or retract the catheter, is monitored to assess its real-time state. Contact between the catheter and vessel wall causes a push–pull force, acting as resistance [11,12,13,14,15,16]. Excessive force may cause mechanical injury, including damage to the inner membrane (intima) or middle layer (media), or rupture of the vessel wall. Such injuries can impact surgical safety and have attracted close attention from medical staff and researchers [17,18].
The push–pull force of the interventional catheter can be divided into contact force and collision force. The contact force between the catheter and the blood vessel is mainly caused by the compression and deformation of each part of the catheter when it touches the blood vessel [12,19]. As the catheter moves within the blood vessel, its shape changes according to the vessel’s curvature. The catheter’s elasticity means that when it is in a curved blood vessel, it is forced to remain bent, causing compression deformation of the vessel at the point of contact [20]. The inner diameter of a narrow blood vessel will increase the degree of compression deformation. As the doctor advances the catheter, the contact area between the flexed catheter and the vessel wall undergoes compression deformation and frictional action. This friction hinders the catheter’s movement [13,21,22]. The degree of vessel curvature and the inner diameter are important factors affecting the contact force between the catheter and the vessel wall.
The collision force between the catheter and the blood vessel wall mainly originates from the contact between the catheter end-tip and the blood vessel wall [23,24]. When the catheter enters a blood vessel bifurcation, the end-tip of the catheter collides with the vessel wall. Additionally, the impact on blood flow may also affect the catheter tip. Because of the catheter head’s small area, even a slight collision can generate a large pressure on the vessel wall, potentially causing damage. By controlling the movement speed of the catheter, the collision force can be reduced, and the possibility of vessel injury can be lowered. Most catheters are currently designed with optimized ends and use softer tip materials [25,26], or the interface friction can be improved through the treatment of the surface coating [27,28,29].
From the above literature, the vascular intervention research between the catheter and the vascular tissue mainly focused on in vitro friction experiments, finite element simulations, and the lubricating coatings. However, the simulation of the actual contact process between the catheter and the vascular lumen and the collection of corresponding mechanical feedback are still areas that urgently need to be addressed. Therefore, this article first analyzed the movement form and mechanical state of the catheter and blood vessel during vascular interventional surgery. Static and dynamic contact analyses were then conducted on the contact force between the catheter and the blood vessel. Static contact analysis utilized three-point bending tests and catheter/blood vessel contact simulation experiments. Dynamic contact mainly examined changes in the push–pull force and normal force under varying degrees of curvature and speeds in a moving state. In contrast to traditional bulk friction tests, the experimental platform developed here enables the dynamic, spatially resolved measurement of normal force at the catheter–lumen interface during controlled motion, providing a more nuanced mechanical analysis of the intervention process.
2. Experiment Design
2.1. Static Mechanics Experiment
To investigate the impact of vascular channel curvature on catheter deformation force, a classical three-point bending test was employed in the current experiment. This test examines the relationship between the catheter bending radius and the deformation force (Fw) under static conditions, as illustrated in Figure 1. The interventional catheter used in this study is a guiding catheter (Cordis AL1, Johnson & Johnson, Miami, FL, USA). It is primarily used to introduce interventional or diagnostic devices into the coronary arteries or peripheral vascular system; therefore, it was selected for analyzing contact with blood vessels in this study. The relevant parameters of the interventional catheter are shown in Table 1.
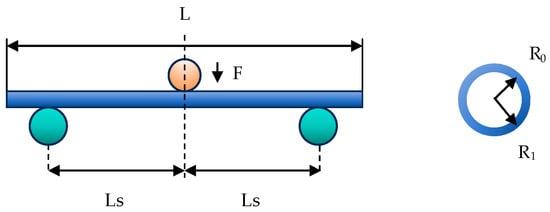
Figure 1.
The schematic diagram of the three-point bending test on the catheter.

Table 1.
Parameters of the three-point bending test.
2.2. Catheter–Vessel Contact Experiment Platform
An experimental platform was independently designed to simulate catheter–vessel contact, replicating the movement of interventional catheters within a blood vessel (vascular lumen). Regarding the interaction between the catheter and the lumen, namely the contact force and the collision force, we are currently only focusing on the analysis of the contact force. The overall platform structure is illustrated in Figure 2. The platform comprises five main components: (1) the push–pull control section, which manipulates the catheter’s forward and backward movement; (2) the pressure detection section, which measures the forces involved; (3) the lumen fixation section, which holds the simulated vessel in place; (4) the catheter lumen, which represents the vessel pathway; (5) the interventional catheter, which is the device being tested. Using this experimental platform, both the force required to advance or retract the interventional catheter (push–pull force) and the force perpendicular to vessel bends (normal force) can be measured.
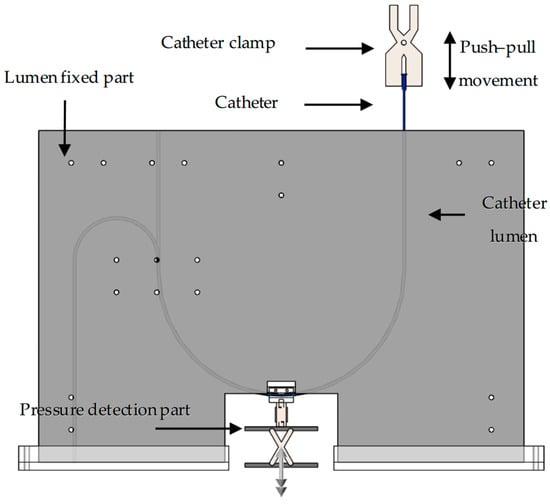
Figure 2.
Three-dimensional schematic diagram of catheter/vessel contact experiment platform.
Push–pull control section: The push–pull control section utilizes a universal testing machine (34SC, Instron, Norwood, MA, USA) to precisely control the catheter’s push–pull speed, frequency, and displacement, while also collecting mechanical signals in real time. In this paper, a universal testing machine was used to perform three-point bending tests on interventional catheters and to collect push–pull force at the catheter end during catheter–vascular simulation experiments.
Pressure detection section: The pressure detection section consists of a digital display push–pull force gauge, a tension/compression sensor, and its fixed structure. The tension/compression sensor is the DYLY-106 S type produced by Dayang Sensing (Dayang, Shanghai, China). The main parameters and physical image of the tension and compression sensor are presented in Table 2. The lumen fixation plate was mounted on a tension/compression sensor (DYLY-106 S) to measure the normal force (Fn) reaction at the curve interface. The fixed structure comprises two parts: the catheter connection structure (Figure 3) and the bottom lifting platform (Figure 4).
Table 2.
The main parameters of the pressure sensor.
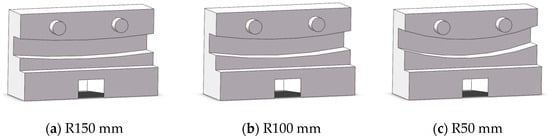
Figure 3.
Schematic diagram of catheter connection structure.
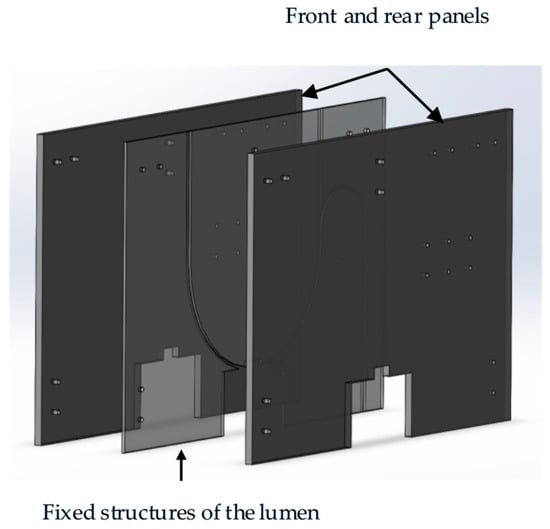
Figure 4.
Schematic diagram of the three-dimensional structure of the lumen fixing mechanism.
Lumen fixation section: The lumen fixation section is a custom-made structure designed to secure the vascular model in place. This ensures the accuracy and reliability of the experiment. The fixed structure includes the front and rear panels and a replaceable lumen fixed plate in the middle, as shown in Figure 4. The single-curve structure’s semi-circular bend has radii of 50 mm, 100 mm, and 150 mm. The double-curve structure features a semi-circular bend with a 50 mm radius, complementing the single-curve design (Figure 5).
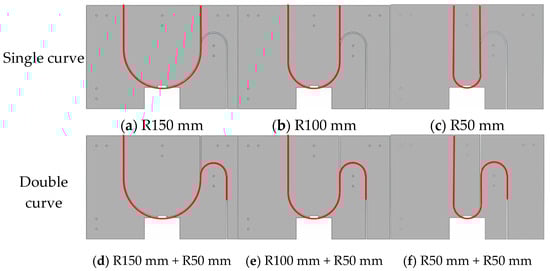
Figure 5.
Schematic diagram of lumen fixation structure: single curve (a–c) and double curve (d–f).
2.3. Catheter/Vessel Contact Experiment Protocol
To make the catheter–vessel contact experimental scheme more in line with the human vascular interventional process, it is first necessary to find a material suitable for simulating the vascular lumen. Contact experiments were conducted using common pipe materials available on the market, namely PTFE, TPU, PVC, and silicone rubber. Compared to the actual blood environment, the current cavity environment lacks glycocalyx, endothelial compliance, and the lubricating effects of blood [30]. All pipe materials have uniform specifications (inner diameter: 3 mm, 4 mm, and length: 1000 mm). The experimental parameters for selecting materials for lumen channels are single-curve structures with a diameter of 100 mm and a speed of 5 mm/s.
Considering the complexity of human blood vessels, this paper primarily focuses on the influence of the radius of curvature of blood vessels and the number of curves on the frictional effect in the contact experiment scheme for simulating vascular interventions. Based on this, three different curve radii of curvature and single- and double-curve structures were designed in Table 3 and Table 4.
Table 3.
Experimental scheme for single-curve structure.
Table 4.
Experimental scheme for double-curve structure.
2.4. Data Statistics
All experiments were repeated at least three times to ensure the accuracy of the data, which were expressed as means ± SD. A two-way ANOVA was used to analyze the influencing factors of the different results, including normal force variation and push–pull forces. p < 0.05 is significant, indicated by the symbol *; p < 0.01 is highly significant, indicated by the symbol **. The same applies to subsequent tables.
3. Results and Discussion
3.1. The Influence of Static Bending of Catheters on Contact
During cardiovascular interventional procedures, when the catheter moves within the complex and curved blood vessels, it is inevitable that changes and deformations occur. Due to the rigidity of the catheter, the curved vascular lumen hinders catheter recovery, thereby creating stress concentration areas. The deformation radius of the catheter can be obtained through a high-speed camera, whose specific method can be referred to in our previously published literature [30]. The relationship between the upper head displacement and the catheter deformation force in the three-point bending test is shown in Figure 6a. At the beginning of the test, the catheter is in the elastic stage, and the deformation force increases linearly with the increase in displacement. As the displacement continuously increases, the catheter bending reaches the yield point, Py, at which the displacement is 3.80 mm and the bending deformation force reaches 0.80 N; thereafter, the deformation force begins to change more slowly. When the displacement reaches 9.37 mm, it reaches the critical point Pc of the bending test, with the maximum bending force being 1.36 N.
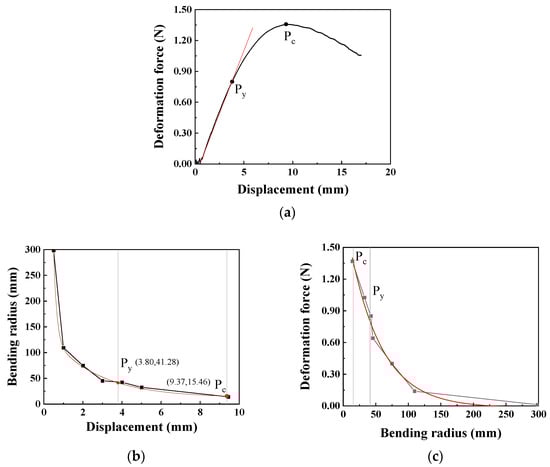
Figure 6.
The relationship between the deformation force, displacement, and bending radius of the catheter (the moving speed is 0.1 mm/s): (a) Displacement–deformation force curve (Py: yield point, Pc: critical point), (b) Displacement–bending radius curve, (c) Bending radius–deformation force curve.
To accurately obtain the bending radius of the catheter, images are captured at appropriate positions between the displacements of 0 mm and 9.37 mm. Through image processing, the bending radius of the catheter at this time is obtained and then fitted using the Origin software 2025 to obtain the relationship between the bending radius and displacement, as shown in Figure 6b. The bending radius at the yield point Py is 41.28 mm, and at the critical point Pc is 15.46 mm. Furthermore, based on the relationship between the bending radius and displacement, the relationship between the bending radius and deformation force can be obtained as shown in Figure 6c. Using the Origin software for regression model fitting, the regression model expression of the bending force is obtained as shown in Equation (1). When the bending radius is greater than the bending radius at the critical point, this model can be used to calculate the corresponding bending force.
Therefore, during the process of catheter intervention in blood vessels, when the bending radius exceeds 41.28 mm, the catheter is in the elastic deformation stage. In the application scenarios of the catheter, the limitation of the blood vessel radius needs to be considered. Additionally, the maximum deformation force generated by the catheter’s own deformation can reach 1.36 N, meaning that the normal force exerted by the catheter on the inner wall of the blood vessel can reach 1.36 N. According to the regression model of the bending force, when the bending radius exceeds 200 mm, the force exerted by the catheter on the blood vessel is relatively small (<0.015 N), and this will not be further analyzed in this paper.
In the formula, Fw represents the deformation force, and R is the bending radius measured at the selected position; r2 represents fit reliability. The constants in the model (e.g., the pre-exponential factor 1.892 N and the characteristic radius 49.122 mm) are fitting parameters that collectively describe the catheter’s bending stiffness and nonlinear mechanical response, relating the deformation force to the imposed geometric curvature.
3.2. The Influence of Lumen Material on Contact
The catheter lumen used to simulate the vascular lumen needs to meet the following three requirements: (1) the lumen material should be relatively soft and capable of modifying a large range of bending radii; (2) the inner diameter of the lumen should be close to that of human blood vessels; (3) the friction between it and the catheter should not be too large and should be close to that of human blood vessels. Based on literature, the inner diameters of the radial artery and coronary artery in coronary interventions performed through the radial artery range from 2 mm to 4 mm. Therefore, the inner diameter of the catheter used to simulate the vascular lumen is set to 3 mm [31]. According to the requirements, four types of catheters with different materials were purchased from the market in this article to simulate the vascular lumen, namely a relatively soft silicone tube and a PVC tube, as well as tubes with excellent lubrication performance, including a PTFE tube and a TPU tube.
The push–pull force of these catheters was tested through push–pull experiments, and the material most closely resembling human blood vessels was ultimately selected as the material for the vascular simulation lumen. As shown in Figure 7, the average push–pull forces of the relatively soft PVC and silicone materials are relatively high, reaching 10.18 N and 4.21 N, respectively. The average push–pull forces of PTFE and TPU materials are relatively low, at 0.22 N and 0.35 N, respectively. The softness of PVC and silicone makes it easy for them to change from line contact to surface contact with the catheter, greatly increasing the push–pull resistance. Therefore, PVC and silicone without surface treatment or lubricating liquid are not suitable as materials for simulating vascular lumens. Additionally, according to simulation experiments in the relevant literature [32], the push force of interventional catheters is approximately 0.5 N. Based on the above results, PTFE material is a relatively ideal material for simulating vascular lumens, and it will be used as the material for the vascular simulation lumen in subsequent experiments.
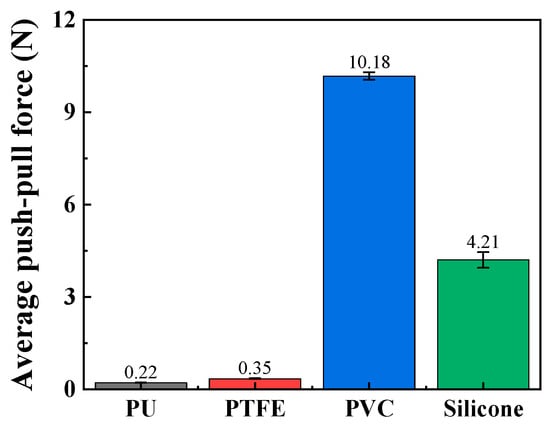
Figure 7.
The average push–pull force of different channel materials (push–pull speed is 5 mm/s; curve radius is 100 mm).
3.3. The Influence of the Lumen Curvature Degree on Contact
Further analysis of the contact relationship between the interventional catheter and the simulated vascular lumen was conducted based on the degree of curvature of the lumen. According to the experimental schemes presented in Section 2, the degree of lumen curvature was divided into two components, namely curve radius and curve number, for the purpose of the experiment. The smaller the curve radius and the greater the number of curves, the greater the degree of curvature. By changing the curve radius and the number of curves of the catheter lumen, the changes in the push–pull force of the catheter and the normal force applied to the curves at different degrees of curvature were determined.
In the static state, the normal force applied by the catheter to the bottom of the lumen is shown in Figure 8. The smaller the curve radius, the greater the normal force applied by the catheter to the lumen, which is consistent with the results of the three-point bending experiment; that is, the smaller the lumen radius, the greater the normal force applied by the catheter to the lumen. When the degree of lumen curvature is greatest, specifically the double-bend lumen with a radius of 50 mm, the maximum normal force that the catheter can apply to the lumen is 0.42 N. When the catheter moves cyclically within the lumen at a given speed, it exerts a periodically changing normal force on the lumen, as shown in Figure 9. The amplitude of the normal force variation increases with a decrease in the radius of the lumen. The change in the number of curves in the lumen will also affect the normal force exerted by the catheter on the lumen, and this change in normal force is reflected in the push–pull force of the catheter. The cyclic variation in normal force during catheter motion indicates a hysteresis loop in the loading–unloading of the catheter–lumen system. This hysteresis represents energy dissipation, which is a direct contributor to the measured friction (push–pull force). Figure 10 shows the relationship curve between the average push–pull force of the catheter and the different curve radius. It can be observed that the average push–pull force decreases with an increase in the curve radius, while the number of bends increases significantly, resulting in a higher average push–pull force for the catheter.
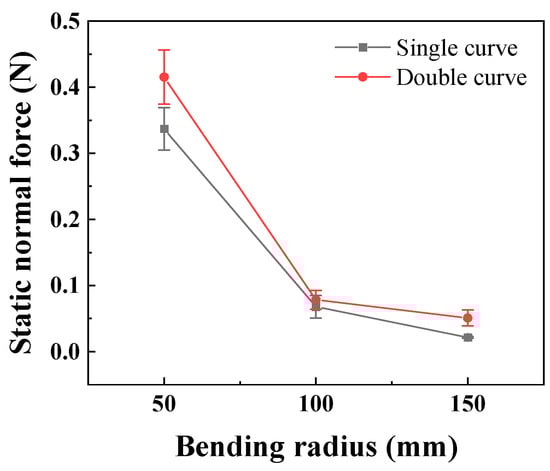
Figure 8.
The relationship between the curve radius of the catheter and the normal force in the static state (PTFE channel).
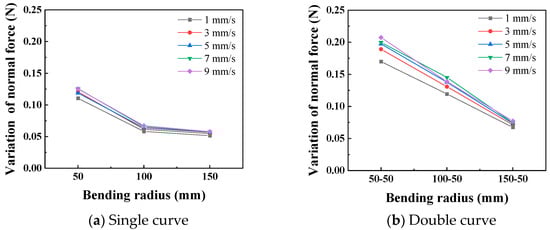
Figure 9.
Curve of relationship between curve radius and the normal force (PTFE channel).
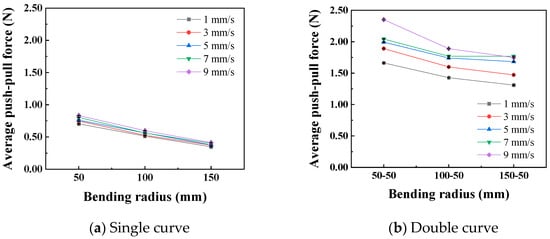
Figure 10.
Relationship curve between curve radius and catheter push–pull force.
3.4. The Influence of the Push–Pull Speed on Contact
Figure 11 shows the relationship curves between different push–pull speeds and the amplitude of the normal force variation. It is observed that the smaller the curve radius, the greater the influence of the push–pull speed on the normal force on the curve. Additionally, the normal force on a double curve is greater than that on a single curve, and this difference is magnified in the changes in the push–pull force of the catheter. Figure 12 shows the relationship curves between different push–pull speeds of the catheter and the changes in the average push–pull force. It can be observed that the average push–pull force increases with the increase in speed, and the increase in the number of curves significantly amplifies this difference.
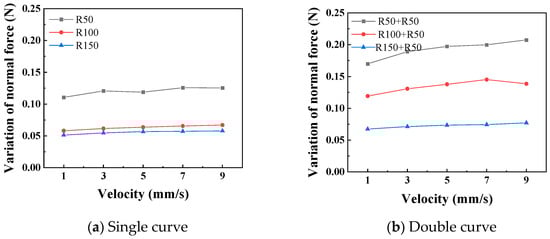
Figure 11.
The relationship curve between the push–pull speed and the normal force (PTFE channel).
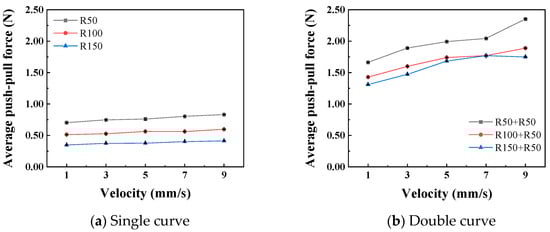
Figure 12.
The relationship curve between push–pull speed and push–pull force (PTFE channel).
Further analysis was conducted to investigate the influence of the curve radius and push–pull speed on the amplitude of variation in the normal force along the curve and the push–pull force. First, variance analysis was performed on the normal force changes and push–pull forces for different curve radii and numbers of curves (Table 5 and Table 6). The influence of both on the normal force changes is basically the same, with no significant difference; however, in terms of the push–pull force, the influence of the number of curves is greater than that of the curve radius. Both the curve radius and the number of curves can be used to represent the degree of curvature of the lumen. The smaller the radius and the greater the number of curves, the higher the degree of curvature of the lumen, and the greater the normal force and push–pull force. For normal force variation, the influence of curve radius and number showed a strong trend (high F0) but did not reach the conventional significance threshold (p > 0.05), possibly due to higher measurement variability in this specific metric or limited sample size.
Table 5.
Two-way ANOVA result of normal force variation (push–pull speed is 5 mm/s).
Table 6.
Two-way ANOVA result of push–pull force (push–pull speed is 5 mm/s).
A variance analysis was conducted on the changes in the normal force of the curve, as shown in Table 7 and Table 8. Whether it is a single curve or a double curve, the p values of the curve radius and the push–pull speed are both less than 0.01, indicating significant differences. At the same time, the larger the F0 value, the greater the degree of influence. The influence of the curve radius on the normal force of the curve is much greater than that of the push–pull speed. It can be seen that the F0 for curve radius (1405) is ~130 times greater than for velocity (10.84). A variance analysis was also conducted on the push–pull force of the catheter, and the analysis results are shown in Table 9 and Table 10. Similarly, whether it is a single curve or a double curve, the p values of the curve radius and the push–pull speed are both less than 0.01, indicating significant differences. The influence of the curve radius on the push–pull force is greater than that of the push–pull speed, and the difference in influence between the two is smaller under the double curve.
Table 7.
Two-way ANOVA result of normal force variation in a single curve.
Table 8.
Two-way ANOVA result of normal force variation in a double curve.
Table 9.
Two-way ANOVA result of push–pull force in a single curve.
Table 10.
Two-way ANOVA result of push–pull force in a double curve.
4. Discussion
In summary, the operation of catheters in interventional surgeries is influenced by the cavity material, degree of curvature of the lumen, and the push–pull speed. The type of cavity material directly affects the mechanical properties and surface roughness of the interface where the catheter contacts the cavity, thereby influencing the tribological properties of the catheter/cavity interface, including parameters such as friction force, friction coefficient, and energy dissipation during friction [33]. In our experimental setup, the materials of silicone and PVC tubes are relatively soft. Under the same external loading conditions, their contact areas increase, and in the classic binary friction theory, their plastic deformation also increases accordingly, resulting in greater friction resistance [34,35]. For PTFE and TPU pipes, not only do they have better basic friction performance, but the mechanical properties of the two materials are also better, with less deformation resistance, and the influence of surface roughness is smaller. Therefore, their overall performance, including the average push–pull force, is much smaller than that of the first two materials [36].
As seen from Figure 8, the smaller the bending radius, the more the number of bends, and the greater the degree of bending, the greater the normal force in the static state, and the corresponding average push–pull force is also greater. Overall, there is a linear corresponding relationship. Combined with the three-point bending experiment curve, the degree of bending of the tube corresponds to its bending mechanical properties. The corresponding positive pressure applied by the tube to the lumen also increases, and the combined area also increases [30,37]. On this basis, when the tube is moved in the lumen by dragging, the difficulty of the tube’s deformation further increases, and it is subjected to greater friction resistance [38], that is, the push–pull force defined in our paper. This is of great clinical significance for actual surgical procedures. For cases where the vascular pipeline is relatively complex, that is, with a more severe degree of curvature, the corresponding frictional resistance will increase accordingly. Therefore, we can appropriately reduce the moving speed and give priority to using the catheters with lubricated coatings to reduce the mechanical damage to the vascular lumen.
In the current experimental design, the average push–pull force and the speed of the catheter showed a typical positive correlation (Figure 12), which was consistent with the frictional laws we previously studied for the inner cavities of the human body and gastroscopes [39]. Unlike the frictional wear between hard materials, when soft materials encountered hard materials, due to their own nonlinear, elastic and lagging characteristics, there was a significant deformation and recovery. Therefore, the mechanical properties of soft tissues to some extent affected their frictional properties [40]. At lower speeds, since the dissipated energy due to lagging friction was limited, most of the energy can be recovered through deformation. As the speed gradually increased, the tissue tensile stress also increased. At this time, the stress relaxation effect was not obvious, and the esophageal tissue had difficulty responding in time, resulting in an increase in lagging friction, that is, an increase in energy dissipation, and ultimately a correlation between frictional resistance and speed presented [41].
Certainly, although the current experimental platform design has achieved certain results, it still has certain limitations. The main constraints include the following: 1. The study utilized a single catheter type and size. Future work should investigate catheters with varying stiffness (e.g., shore hardness) to develop generalized design guidelines. 2. The surface roughness of the lumen materials, a key tribological parameter, was not characterized and should be controlled in future studies. 3. The design of the entire experimental platform lacks the simulation of blood, that is, it fails to take into account the influence of the liquid medium. 4. The experiment ignored vascular compliance or physiological movement, etc.
5. Conclusions
During the movements of catheters, such as pushing, withdrawing, rotating, and advancing, they are affected by the structural characteristics of blood vessels, including curvature, narrowness, and bifurcation, thereby generating resistance to movement. Current vascular interventional research mainly focuses on in vitro friction experiments between the catheter and vascular tissue, finite element simulations, and lubrication coatings. However, the simulation of the actual contact process between the catheter and the vascular lumen, as well as the collection of corresponding mechanical feedback data, remain areas that need to be urgently addressed. Therefore, this paper first analyzes the motion forms and mechanical states of the catheter and the vessel during vascular interventional surgeries. The conclusions are as follows:
- In the three-point bending test, the bending deformation force of the catheter increased as the radius decreased. It first reached the yield point at a bending radius of 41.28 mm, with a bending deformation force of 0.8 N; it reached the critical point at a bending radius of 15.46 mm, with a maximum bending deformation force of 1.36 N.
- PVC and silicone materials are not suitable for simulating the vascular lumen due to their excessive push–pull resistance. TPU and PTFE materials have relatively small and similar push–pull resistance.
- The normal force exerted by the catheter on the lumen in a static state increased as the curve radius decreased and increased with the increase in the number of curves. The curve radius and the curve number of the catheter lumen can be regarded as the degree of lumen curvature. The smaller the curve radius and the greater the curve number, the higher the degree of lumen curvature.
- When moving at a given speed within the lumen, the normal force exerted by the catheter on the lumen and the push–pull force at the catheter tip increased as the curve radius decreased and increased with the increase in the curve number. When the catheter moves in a lumen with a given curve radius, both the normal force exerted on the lumen and the average push–pull force at the catheter tip increase with increasing speed.
- When the catheter performed push–pull movements in the lumen, the degree of lumen curvature had a more significant impact on the push–pull force at the catheter tip and the push–pull force on the lumen compared to the push–pull speed. Therefore, in vascular interventional procedures, it is necessary to comprehensively consider the limitations of vascular curvature and the control of push–pull speed to select appropriate interventional devices for the operation.
Author Contributions
Conceptualization, J.H. and X.C.; methodology, J.H.; software, Z.Z.; validation, X.J., Z.Z.; formal analysis, J.H.; investigation, X.C.; resources, C.L.; data curation, C.L.; writing—original draft preparation, J.H.; writing—review and editing, C.L., Y.F.; visualization, Y.F.; supervision, C.L.; project administration, C.L.; funding acquisition, C.L. All authors have read and agreed to the published version of the manuscript.
Funding
This research was funded by the National Natural Science Foundation of China [52205186].
Data Availability Statement
The raw data supporting the conclusions of this article will be made available by the authors on request.
Conflicts of Interest
Author Zhaoxian Zheng was employed by Zhejiang Institute of Medical Device Testing and Xianfeng Jiang was employed by CRRC Zhuzhou Electric Locomotive Institute Co., Ltd. The remaining authors declare that there are no conflicts of interest.
References
- Rincón, I.D.; Williams, K.; Stern, M.P.; Freeman, G.L.; Escalante, A. High incidence of cardiovascular events in a rheumatoid arthritis cohort not explained by traditional cardiac risk factors. Arthritis Rheum. 2001, 44, 2737–2745. [Google Scholar] [CrossRef] [PubMed]
- Lagiou, P.; Sandin, S.; Lof, M.; Trichopoulos, D.; Adami, H.O.; Weiderpass, E. Low carbohydrate-high protein diet and incidence of cardiovascular diseases in Swedish women: Prospective cohort study. Bmj Br. Med. J. 2012, 345, 1759–2151. [Google Scholar] [CrossRef] [PubMed]
- Bulow, B. Hypopituitary females have a high incidence of cardiovascular morbidity and an increased prevalence of cardiovascular risk factors. J. Clin. Endocrinol. Metab. 2000, 85, 574–584. [Google Scholar] [CrossRef]
- Cheung, A.K.; Wu, L.L.; Kablitz, C.; Leypoldt, J.K. Atherogenic lipids and lipoproteins in hemodialysis patients. Am. J. Kidney Dis. 1993, 22, 271–276. [Google Scholar] [CrossRef]
- Avina-Zubieta, J.A.; Thomas, J.; Sadatsafavi, M.; Lehman, A.J.; Lacaille, D. Risk of incident cardiovascular events in patients with rheumatoid arthritis: A meta-analysis of observational studies. Ann. Rheum. Dis. 2012, 71, 1524–1529. [Google Scholar] [CrossRef]
- Ungprasert, P.; Charoenpong, P.; Ratanasrimetha, P.; Thongprayoon, C.; Suksaranjit, P. Risk of coronary artery disease in patients with systemic sclerosis: A systematic review and meta-analysis. Clin. Rheumatol. 2014, 33, 1099–1104. [Google Scholar] [CrossRef]
- Rat, N.; Muntean, I.; Opincariu, D.; Gozar, L.; Tognel, R.; Chiu, M. Cardiovascular Imaging for Guiding Interventional Therapy in Structural Heart Diseases. Curr. Med. Imaging 2020, 16, 111–122. [Google Scholar] [CrossRef]
- Shen, H.; Feng, X.X.; Guo, Q.Y.; Zhou, Y.J. Updates of developments in interventional therapy for elderly patients with cardiovascular diseases. J. Geriatr. Cardiol. 2024, 21, 1–3. [Google Scholar] [CrossRef]
- Guo, B.; Shi, S.; Guo, Y.; Xiong, J.; Wang, B.; Dong, Z.; Gao, D.; Tu, Y. Interventional therapies for chronic heart failure: An overview of recent developments. ESC Heart Fail. 2025, 12, 1081–1094. [Google Scholar] [CrossRef]
- Conradi, L.; Seiffert, M.; Franzen, O.; Baldus, S.; Schirmer, J.; Meinertz, T.; Reichenspurner, H.; Treede, H. First experience with transcatheter aortic valve implantation and concomitant percutaneous coronary intervention. Clin. Res. Cardiol. 2011, 100, 311–316. [Google Scholar] [CrossRef] [PubMed]
- Yuan, H.; Lin, C.; Wang, C. Research progress of the interaction between blood vessels and intervention catheters and its surface modification. Friction 2025, 13, 9441003. [Google Scholar] [CrossRef]
- Takashima, K.; Shimomura, R.; Kitou, T.; Terada, H.; Ikeuchi, K. Contact and friction between catheter and blood vessel. Tribol. Int. 2007, 40, 319–328. [Google Scholar] [CrossRef]
- Prokopovich, P.; Perni, S. Contact interactions of aorta against PVC catheters. Tribol. Int. 2013, 66, 157–164. [Google Scholar] [CrossRef]
- Wagner, R.M.F.; Maiti, R.; Carré, M.J.; Perrault, C.M.; Lewis, R. Bio-tribology of Vascular Devices: A Review of Tissue/Device Friction Research. Biotribology 2021, 25, 100169. [Google Scholar] [CrossRef]
- Song, W.; Liu, Z.; Li, Q.; Zhang, Y.; Lyu, Y.; Gao, Z.; Zhuang, J.; Lin, C. Research on the friction-damage mechanism between magnetic guide strip and tracheal tissue for magnetic navigation. Tribol. Int. 2025, 215, 111487. [Google Scholar] [CrossRef]
- Lin, C.; Yuan, H.; Wang, C. The study of quantitative friction-damage models at the interventional catheter-vascular tissues interface. Friction 2025. [Google Scholar] [CrossRef]
- Sobolewski, P.; El Fray, M. Cardiac catheterization: Consequences for the endothelium and potential for nanomedicine. Wiley Interdiscip. Rev. Nanomed. Nanobiotechnology 2015, 7, 458–473. [Google Scholar] [CrossRef]
- Dellimore, K.H.; Franklin, S.E.; Helyer, A.R. A Review of Catheter Related Complications During Minimally Invasive Transcatheter Cardiovascular Intervention with Implications for Catheter Design. Cardiovasc. Eng. Technol. 2014, 5, 217–232. [Google Scholar] [CrossRef]
- Eklund, A.; Bergh, A.; Lindahl, O.A. A catheter tactile sensor for measuring hardness of soft tissue: Measurement in a silicone model and in an in vitro human prostate model. Med. Biol. Eng. Comput. 1999, 37, 618. [Google Scholar] [CrossRef]
- Wang, Y.; Guo, S.; Tamiya, T.; Hirata, H.; Ishihara, H. A Blood Vessel Deformation Model Based Virtual-reality Simulator for the Robotic Catheter Operating System. Neurosci. Biomed. Eng. 2014, 2, 126–131. [Google Scholar] [CrossRef]
- Chen, Z.; Zheng, Q.; Tong, Z.; Huang, X.; Yu, A. Numerical modelling of the interaction between dialysis catheter, vascular vessel and blood considering elastic structural deformation. Int. J. Numer. Methods Biomed. Eng. 2024, 40, e3811. [Google Scholar] [CrossRef]
- Bostan, L.E.; Noble, C.; Smulders, N.; Lewis, R.; Carré, M.J.; Franklin, S.; Green, N.H.; Macneil, S. Measurement of friction-induced changes in pig aorta fibre organization by non-invasive imaging as a model for detecting the tissue response to endovascular catheters. Biotribology 2017, 12, 24–32. [Google Scholar] [CrossRef]
- Gao, B.; Hu, K.; Guo, S.; Guo, P. Analysis of the haptic collision and deformation of the blood vessel model for the microsurgery training system. In Proceedings of the IEEE International Conference on Robotics & Biomimetics, Shenzhen, China, 12–14 December 2013. [Google Scholar] [CrossRef]
- Takagi, R.; Osada, K.; Hanafusa, A.; Takagi, M.; Mohamaddan, S.B.; Mitsui, K.; Anzai, H. Development of a remote-control system for catheterization capable of high-speed force feedback. Int. J. Comput. Assist. Radiol. Surg. 2023, 18, 763–773. [Google Scholar] [CrossRef]
- Lynn, S.; O’Malley, P.; Tanner, D.; Moore, S. Refining early stage interventional composite catheter design. Procedia Manuf. 2019, 38, 282–290. [Google Scholar] [CrossRef]
- White, E.; Bienemann, A.; Malone, J.; Megraw, L.; Bunnun, C.; Wyatt, M.; Gill, S. An evaluation of the relationships between catheter design and tissue mechanics in achieving high-flow convection-enhanced delivery. J. Neurosci. Methods 2011, 199, 87–97. [Google Scholar] [CrossRef]
- Kazmierska, K.; Szwast, M.; Ciach, T. Determination of urethral catheter surface lubricity. J. Mater. Sci. Mater. Med. 2008, 19, 2301–2306. [Google Scholar] [CrossRef]
- Shi, W.; Whittington, A.R.; Grant, D.C.; Boreyko, J.B. Reduced Sliding Friction of Lubricant-Impregnated Catheters. ACS Omega 2024, 10, 3635–3641. [Google Scholar] [CrossRef] [PubMed]
- Lin, C.; Yuan, H.; Wang, C. Study on Lubricating Nano-coatings for Cardiovascular Catheters Based on Molecular Self-Assembly and Schiff Base Reaction. Friction 2025. [Google Scholar] [CrossRef]
- Lin, C.; Kaper, H.J.; Li, W.; Splinter, R.; Sharma, P.K. Role of endothelial glycocalyx in sliding friction at the catheter-blood vessel interface. Sci. Rep. 2020, 10, 11855. [Google Scholar] [CrossRef]
- Waseem, W.; Sherief, G.; Abdulaziz, A.-A.; David, F.K. Radial artery diameter: A comprehensive systematic review of anatomy. J. NeuroInterventional Surg. 2022, 14, 1274–1278. [Google Scholar] [CrossRef] [PubMed]
- Li, H.; Zhou, H.; Zhao, Y.; Zhang, J.; Zhang, T. Research on real-time detection system of catheter delivering force in vascular interventional robots. J. Biomed. Eng. 2022, 39, 359–369. [Google Scholar] [CrossRef]
- Adams, M.J.; Briscoe, B.J.; Johnson, S.A. Friction and lubrication of human skin. Tribol. Lett. 2007, 26, 239–253. [Google Scholar] [CrossRef]
- Tang, W.; Ge, S.R.; Zhu, H.; Cao, X.C.; Li, N. The Influence of Normal Load and Sliding Speed on Frictional Properties of Skin. J. Bionic Eng. 2008, 5, 33–38. [Google Scholar] [CrossRef]
- Hendriks, C.P.; Franklin, S.E. Influence of Surface Roughness, Material and Climate Conditions on the Friction of Human Skin. Tribol. Lett. 2010, 37, 361–373. [Google Scholar] [CrossRef]
- Ger, M.D.; Hou, K.H.; Wang, L.M.; Hwang, B.J. The friction and wear of Ni–P–PTFE composite deposits under water lubrication. Mater. Chem. Phys. 2003, 77, 755–764. [Google Scholar] [CrossRef]
- Greenwood, J.A.; Tabor, D. The Friction of Hard Sliders on Lubricated Rubber: The Importance of Deformation Losses. Proc. Phys. Soc. 2002, 71, 989. [Google Scholar] [CrossRef]
- Lincoln, B. Elastic Deformation and the Laws of Friction. Nature 1953, 172, 169–170. [Google Scholar] [CrossRef]
- Lin, C.; Ren, P.; Li, W.; Deng, H.; Zhou, Z. Finite-element modelling of frictional behaviour between oesophagus and endoscope. Biosurface Biotribology 2020, 6, 34. [Google Scholar] [CrossRef]
- Spilker, R.L.; Suh, J.K.; Mow, V.C. A finite element analysis of the indentation stress-relaxation response of linear biphasic articular cartilage. J. Biomech. Eng. 1992, 114, 191–201. [Google Scholar] [CrossRef]
- Mow, V.C.; Ateshian, G.A.; Lai, W.M.; Gu, W.Y. Effects of fixed charges on the stress-relaxation behavior of hydrated soft tissues in a confined compression problem. Int. J. Solids Struct. 1998, 35, 4945–4962. [Google Scholar] [CrossRef]


Disclaimer/Publisher’s Note: The statements, opinions and data contained in all publications are solely those of the individual author(s) and contributor(s) and not of MDPI and/or the editor(s). MDPI and/or the editor(s) disclaim responsibility for any injury to people or property resulting from any ideas, methods, instructions or products referred to in the content. |
© 2025 by the authors. Licensee MDPI, Basel, Switzerland. This article is an open access article distributed under the terms and conditions of the Creative Commons Attribution (CC BY) license (https://creativecommons.org/licenses/by/4.0/).