Abstract
In a previous experimental study, a high-frequency reciprocating rig tribotester was used to test several base oils, including a mineral oil and a vegetable oil, as well as a blend of the two, with and without the addition of carbon-based nanoparticles. The results showed synergy between certain nanoparticles and the oil blend. As such, in this study, molecular dynamics simulations are conducted on three systems to find the model that most accurately represents the experimental setup. These systems consist of lubricant molecules sandwiched between two iron oxide surfaces. The lubricant molecules represent the three types of lubricant used in the experimental study: hexadecane for the mineral base oil, a mixture of fatty acids for the rapeseed oil, and a mixture of both hexadecane and fatty acids for the oil blend. Three system sizes were considered: the first with 100 molecules, the second with 200 molecules, and the third with 300 molecules. The density, velocity, and temperature profiles, as well as the shear rate and coefficient of friction, are analyzed. The results show that the 300-molecule systems show a similar trend to that observed in the experimental study, with the vegetable oil model having the lowest coefficient of friction, followed by the blend model and finally the hexadecane model. The different analyzed profiles provide valuable insights into the interactions within the lubricant film.
1. Introduction
Understanding the molecular-level interactions between the different components of a tribological system is crucial for understanding the mechanisms underlying the friction- and wear-reducing properties of certain lubricants and additives compared to others. Several alternatives to traditionally used mineral-based lubricants and additives have been proposed and studied over the years. From synthetic oils to vegetable oils and blends as lubricants to oxides and carbon-based nanoparticles, several studies have explored their usage in tribological studies. Experimental studies have been the standard for evaluating the performance of lubricants and additives; however, the proposed mechanisms of their actions, while supported by the experimental data, are not yet fully understood. This is where a numerical approach can bridge the gap and help researchers understand what exactly is happening on scales that are currently beyond humanity’s technological prowess. One of these approaches is using molecular dynamics (MD) simulations to model and observe the interactions on a molecular level.
Molecular dynamics simulations were first developed and used in the 1970s and have progressed considerably in the years since. While initially used for medical implementations, applications of MD simulations have branched out into other fields, with the field of tribology being one of them. Certain studies have explored using MD simulations to design and assess new lubricants, such as ionic-liquid-based lubricants [1,2,3] and new anti-friction additives [4], and to test the performance of certain coatings [5,6,7]. However, to validate the models built using MD simulations, they must be correlated with experimental data to verify their viability. In this regard, several published studies have shown the possibility of correlating experimentally obtained results with results obtained from MD simulations [8,9,10]. As such, MD simulations have been proven to be a valuable asset for researchers in the field of tribology.
As noted, researchers have experimentally studied mineral-oil-based lubricant alternatives and have shown their efficacy and potential. In a previously published experimental work [11] conducted by the authors of this paper, the use of such an alternative was explored. In the aforementioned paper, an experimental study using a high-frequency reciprocating rig (HFRR) was conducted on two base oils, SN150 and rapeseed oil, and a 50/50 by volume blend of the two, as well as with the addition of different types of carbon-based nanoparticles. That study, as observed in other studies, showed that the vegetable oil and vegetable-oil-containing blend had better coefficient of friction (COF) performance compared to the pure mineral oil. Additionally, the results indicated that the addition of certain nanoparticles noticeably improved the performance of the blend specifically. In the literature, researchers have studied the performance of vegetable oils and blends and have proposed and validated their mechanisms. Their mechanisms are described as follows: the polar nature of fatty acids influences their attraction to the metallic surfaces, with the polar heads of their molecules, i.e., where the oxygen atoms are clustered, orienting the molecules towards the surfaces. This attraction and subsequent adsorption of the molecules create a protective layer on the surfaces that reduces friction [12,13]. However, what has not been explored in the literature is the synergistic effect that was observed in the previously published paper between certain carbon-based nanoparticles and the oil blend. Experimentally, it is quite difficult to explore and validate the mechanisms of action for such a system. As such, a numerical approach, namely MD simulations, can help in this regard.
This study aims to develop a working model that simulates the behavior of a vegetable oil and an oil blend in a tribological system and correlates the simulation results with previously obtained experimental results from a previously published paper. As such, to understand how this improvement came to be, especially for the blend, the interactions taking place on a molecular level should be explored. Therefore, for now, only the base oils and the blend are modeled using molecular dynamics, without the inclusion of carbon-based nanoparticles, as they will be included in a later study. Simulations of three systems of varying size are presented in this paper, as the HFRR tribotester allows the measurement of the lubricant film using percentages and cannot give exact values for the size of the film. As such, the different system sizes are considered to identify that which is the closest to replicating the experimental setup. Additionally, the results for the density profile, the temperature profile, the velocity profile, the shear rate, and the coefficient of friction for each system are presented. The aim of simulating differing system sizes is to find out which system better reflects the experimental setup in the previous study. Our decision to use MD simulations for this work, over other computational methods such as the finite element method and the smoothed particle method, was based on several factors. The first of these factors is that the mechanisms of action for the different nanoparticles are in the nanoscale, and so can only be studied using MD simulations. Secondly, it is important to understand the interactions between the different components of the system, especially between the molecules and the surfaces and between themselves, and when the nanoparticles are factored in, the layering effect becomes more important to explore in a heterogeneous system. Compared to other numerical methods, only MD simulations can capture this.
Finally, in this paper, the simulation setup is first presented, with the chosen models for each base oil, as well as the model for the contacting surfaces. Simplified models for each base oil are considered due to the high computational cost that comes with modeling complex systems. Following the simulation setup, the simulation procedure and its different steps are presented. Finally, the results are presented and discussed, with the relevant conclusions finally being put forth.
2. Methodology
2.1. Simulation Setup
2.1.1. Surfaces
In all MD simulations performed in this study, α-iron (III) oxide, hematite [14], was used as a representative of the contacting surfaces of the ball and plate setup in the HFRR tribotester. The choice to use iron oxide as the substrate was based on several considerations:
- •
- In typical tribological systems, iron oxides often form on the surfaces of steel or iron substrates due to oxidation. As such, using hematite represents real-world applications.
- •
- It has a well-defined structure that is relatively easy to model. It can be leveraged to either have an iron or oxygen surface termination, depending on the use case. Its crystalline structure, which is hexagonal in nature, is stable, having iron atoms in octahedral sites with each iron atom being surrounded by six oxygen atoms. This allows it to be accurately represented with adequate force fields.
- •
- It has sufficient hardness, making it ideal for simulations where high-pressure and high-shear regimes are present.
- •
- Its chemical nature allows the simulation to accurately represent the lubricant–surface interactions. This is extremely relevant for heterogeneous systems where both chemisorption and physisorption are present.
- •
- Iron (III) oxide has been modeled and used in non-equilibrium molecular dynamics (NEMD) simulations, with the models having been validated in several research papers, with the force field parameters being available and easily accessible [15].
As shown in Figure 1, using Vesta [16], a (0001) α-iron (III) oxide supercell was generated and cleaved to preserve the 2:3 ratio of iron to oxygen, ensuring that the surfaces had an overall neutral charge. It was then duplicated to be used in the simulation as the upper and lower surfaces. Each surface had approximately 3400 atoms and dimensions of 50 × 49 × 13 Å and was Fe-terminated. This type of termination allows for better chemisorption of the fatty acid molecules and can better showcase the contrast between the interactions with the surface of the polar and non-polar molecules in the system. The surfaces are held together by harmonic bonds, where each atom is connected to other atoms within a 3 Å cutoff, and the force constant of the bonds or stiffness parameter k is equal to 130 Kcal mol−1Å−2. Concerning the force constant of these bonds, this value ensures that the surfaces are sufficiently rigid while allowing the system to be adequately thermostatted [15].
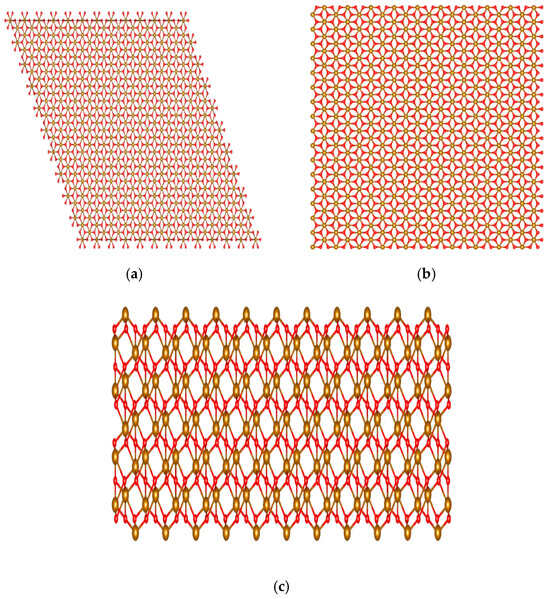
Figure 1.
Visualized using VESTA. (a) Full hematite supercell before cleaving; (b) hematite supercell after cleaving as seen from the top; (c) hematite supercell after cleaving as seen from the side.
2.1.2. Lubricant Molecules
As previously mentioned, the lubricants used in the previous study conducted with the HFRR were simplified and represented as hexadecane for the mineral-oil-based lubricant and as a mixture of fatty acids for the rapeseed oil lubricant. We adopted this approach due to the complexity of modeling a full molecular profile for a lubricant and the high computational costs that come with it. In addition, studies have shown that simple models such as this one can be correlated with experimental studies. The choice of fatty acid molecules was based on the typical fatty acid composition of rapeseed oil, which is mainly composed of oleic, linoleic, linolenic, and palmitic acids.
The optimized potentials for liquid simulations all-atom (OPLS-AA) force field [17] and its updated parameters were used to represent the different lubricant molecules. The parameters were obtained from the LigParGen server [18,19,20]. The usage of the all-atom parameters compared to the united atom parameters of the OPLS force field is more relevant to this system, as they have been shown to more accurately model the behavior of long-chain hydrocarbons [21]. The choice to use the updated OPLS-AA force field was based on several considerations, the first being that studies have shown that the OPLS-AA force field, with its updated parameters, most accurately reproduces densities, viscosities, and friction data for long-chain molecules [22]. Secondly, the parameters developed by Berro et al. [15] for iron oxide surfaces have been validated across several studies that used similar tribological systems to this one [23,24,25] and are compatible with the OPLS-AA force field for lubricant molecules. Finally, a recent study by Gravelle et al. [26] used the OPLS-AA force field to model a carbon nanotube. This is relevant because, as specified in an earlier section, the goal of this study was to model neat lubricants before introducing and simulating carbon-based nanoparticles as well, and as a compromise, the OPLS-AA force field allows the inclusion of all of these elements together with relative accuracy. Comparatively, using the reactive force field (ReaxFF), for example, which is able to model all of these elements in the simulation, would be computationally expensive, as well as outside of the scope of this study.
Presented in Table 1 are the parameters for the different atom types present in the simulation, with the non-bonded force field parameters of the surface being taken from [15].

Table 1.
Non-bonded force field parameters, including partial charges [15,23].
The hydrogen bonds in the lubricant molecules, which are fast-moving bonds, are constrained with the SHAKE algorithm [27]. This algorithm ensures that the specified bonds and angles are kept at their equilibrium lengths. Using this algorithm mostly ensures smoother MD runs and allows for the usage of longer timesteps without interference from any results or energy calculations.
The 12-6 Lennard-Jones potential and long-range Coulomb potential are used to represent the non-bonded interactions between the surfaces and the lubricant molecules. In all of the simulations performed here, the 12-6 potential was cut off at 12 Å. While the Coulomb interactions were not cut off, instead they were evaluated using the slab implementation of the particle–particle particle–mesh algorithm (pppm) [28]. The x and y boundaries were periodic.
The systems used in this study are presented in Table 2. As previously mentioned, three system sizes were simulated, having 100, 200, and 300 lubricant molecules. The systems are denoted as H for pure hexadecane systems, V for pure fatty acid systems, and B for the blend systems. To achieve a similar ratio of 50/50 by volume for the blend similar to that used in the experimental study, based on the ratio of fatty acids present in rapeseed oil, the average fatty acid volume was calculated and used to determine the ratio of hexadecane to fatty acid molecules. The reason why three system sizes were considered is that, as noted in a previous section, while a lubricant film was present during the friction tests in the experimental study (98–100%), its exact size was unknown. The HFRR tribotester measures the lubricant film percentage by monitoring the electrical resistance, with a percentage closer to 100% indicating separation between the surfaces. As such, in an attempt to model the size of the film, varying system sizes were considered, with the only way to increase the size of the film in this application being to increase the number of lubricant molecules. By doing so, the separation between the surfaces increased, with the film in these simulations varying between 20 Å and 55 Å.
Table 2.
The composition of the simulated systems is based on the type of molecule.
2.2. Simulation Procedure
The timestep considered for these simulations was 1 fs, while the equations of motion were integrated using the velocity-Verlet algorithm.
The Large-scale Atomic/Molecular Massively Parallel Simulator (Lammps) [29] was used for the simulations, and the process was as follows:
For each case, the lubricant molecules were randomly placed between the two hematite surfaces, and the whole system was energy-minimized using the conjugate gradient algorithm. Energy minimization involves shifting the coordinates of the atoms in the system in order to find the lowest energy configuration. This is performed to relax the system and is crucial for its stability before any MD run. After the system was energy-minimized, the outer layer atoms of the bottom surface were fixed in position in the z direction.
Following energy minimization, the upper surface was moved down at a constant velocity of 0.001 Å/fs until a density similar to the density of each lubricant was achieved. A short relaxation step followed to allow the system to reach the desired temperature. For the blend systems, the relaxation step was extended and run for 300 ps. This is because the system was heterogeneous, and a longer relaxation step can allow the interactions between the different molecules and the surfaces to play out. After this, a constant force in the z direction was added to each atom of the outer layer of atoms in the top surface to pressurize the system so that the system was under 0.55 GPa of pressure. The temperature of the system was controlled using the Langevin thermostat [30] acting on the middle portion of both the upper and lower surfaces in the x and y directions, perpendicular to the compression. The temperature was held at 298 K and the system was allowed to equilibrate under these conditions for 300 ps. At the beginning of the compression phase, some oscillations were visible and they gradually decreased until they became negligible, at which point the system reached equilibrium. Figure 2 shows the system after the compression stage.

Figure 2.
The M3 blend system with 300 molecules is visualized using OVITO [31]. The red balls are the oxygen atoms, the orange ones are the iron atoms, and the gray and white ones are the carbon and hydrogen atoms, respectively.
Figure 2.
The M3 blend system with 300 molecules is visualized using OVITO [31]. The red balls are the oxygen atoms, the orange ones are the iron atoms, and the gray and white ones are the carbon and hydrogen atoms, respectively.

Finally, after equilibrium was reached, a velocity of vx equal to 10 m/s was added to the outer layer of atoms of the top surface to initiate the sliding simulations. Figure 3 shows how the system evolves after the onset of sliding. The temperature of the system during this step was controlled using the Langevin thermostat acting on the middle portion of both the upper and lower surfaces only in the y direction, which is perpendicular to both the sliding and compression directions. This was done so that the temperature control did not influence the dynamics of the confined lubricant molecules, as studies have shown that directly thermostatting them alters their behavior [32]. The simulations were run until the sliding distance was equal to 10 nm, meaning that the simulations were run for 1 ns each. The choice of velocity was based on from several considerations: the HFRR tests performed in the previous study were conducted with the ball oscillating at a frequency of 50 Hz with a stroke length of 1 mm. Using the basic harmonic motion equation, the maximum velocity of the ball can be determined with the following equation:
where f is the frequency of the oscillation, being 50 Hz in this case, and A is the amplitude of the oscillation, being half of the stroke length, so 0.0005 m vmax would then be equal to 0.157 m/s. Unfortunately, NEMD simulations at velocities lower than 1 m/s cannot yet be performed with systems of this configuration [24]. In addition, using smaller velocity values would be computationally expensive, as the simulations would need to run for up to 10 ns to reach a total sliding distance of 10 nm. As such, the choice of a 10 m/s sliding velocity was a compromise between the simulation and computational restrictions.
vmax = 2πfA,

Figure 3.
The M3 blend system at the end of the sliding simulation.
Figure 3.
The M3 blend system at the end of the sliding simulation.

During the sliding simulations, several data points were recorded and post-processed, with the data obtained after steady state sliding was achieved, after 250 ps, being taken into consideration. These data points include the mass density, temperature, and velocity profiles of the lubricant molecules, as well as the friction forces with the average friction coefficient. Each of these profiles was recorded by splitting the system into bins that span its full length in the x and y direction, with the bins being 1 Å thick for the mass density profile data and 5 Å for the rest. This allows for clearer data to be recorded with less simulation noise affecting it. The data for all the atoms that are present in these bins were averaged over 1000 timesteps and outputted for post-processing. During post-processing, the data of each bin was then averaged over the duration of the simulation. The friction coefficient was calculated by block averaging both the lateral and normal forces acting on the atoms directly interacting with the lubricant molecules for both the top and bottom surfaces. Each system was simulated three times, each time with a random starting molecular configuration.
3. Results
In this section, the results from the different analyses that were performed on the simulations are presented below. These analyses include the mass density profile, the temperature profile, the velocity profile and the shear rate, and finally the coefficient of friction.
3.1. Mass Density Profile
The mass density profile is a metric that permits the tracking of the lubricant molecules and characterization of the lubricant film. It shows how the molecules are arranged inside the film and where the lubricant molecules are most concentrated.
The density profiles of the different hexadecane systems from Figure 4 show a clear trend. It can be observed that the hexadecane molecules are most concentrated in the layers closest to the surfaces. This becomes even clearer as the system size grows, where the inner molecular layers are gradually depleted and layering increases near the surfaces. This behavior is expected as surface–hexadecane interactions are primarily governed by 12-6 Lennard-Jones forces and less so by electrostatic interactions due to their weak partial charges. The physisorption that occurs leads to the layering effect, where the hexadecane molecules are more densely packed closer to the surfaces but are still present in significant numbers outside of the surface–lubricant interface.
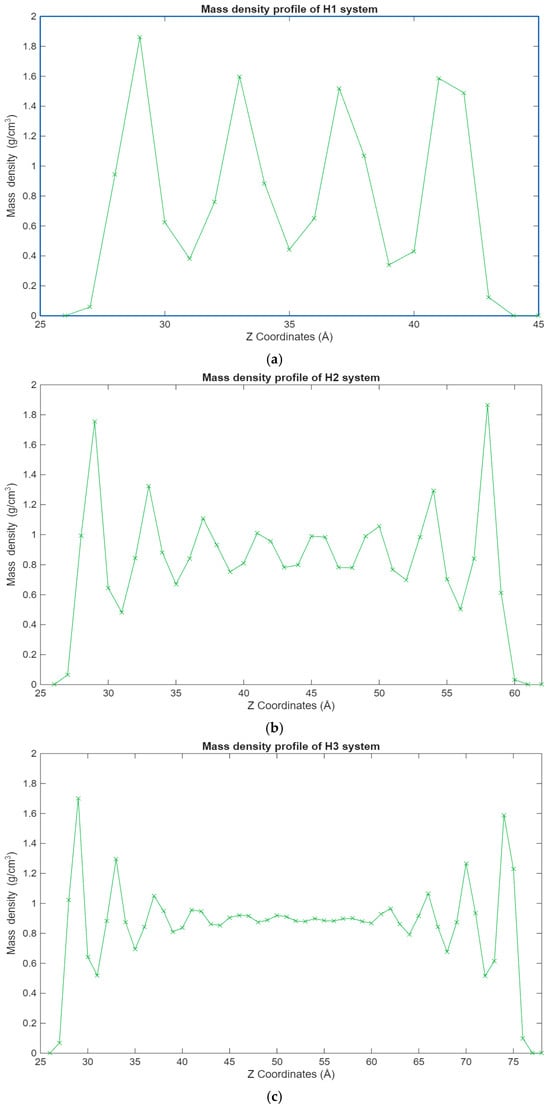
Figure 4.
Graphs showing the different mass density profiles for the hexadecane systems inside the lubricant film, with the mass density in g/cm3 plotted vs. the Z coordinates in Å. (a) Density profile of the H1 system; (b) density profile of the H2 system; (c) density profile of the H3 system.
A similar trend can be observed in Figure 5, where the density profiles of the fatty acid systems are presented. While in the case of the hexadecane systems, the 12-6 Lennard-Jones forces dominate the interactions, in the case of the fatty acid systems, the electrostatic forces are the largest contributors to this behavior. Interestingly, in the 100-molecule systems, it can be observed that a more even distribution of hexadecane molecules is present across the lubricant film for the hexadecane system, while for the fatty acid system, the fatty acid molecules are more concentrated near the surfaces.
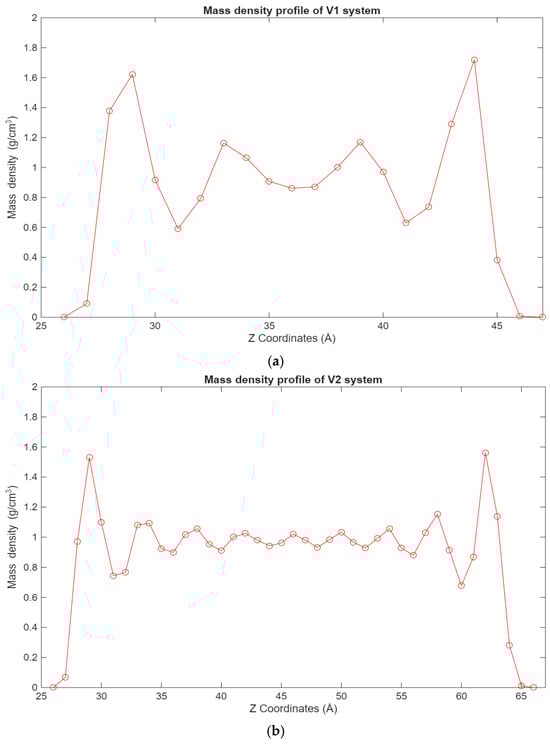
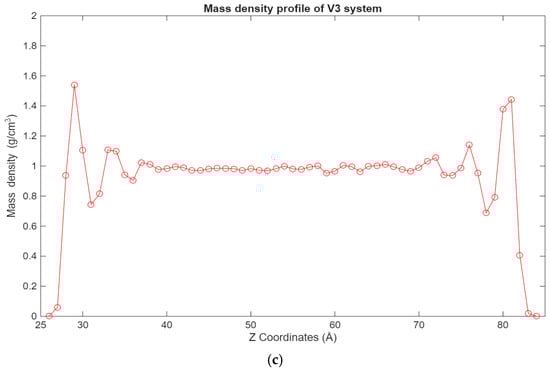
Figure 5.
Graphs showing the different mass density profiles for the fatty acid systems inside the lubricant film, with the mass density in g/cm3 plotted vs. the Z coordinates in Å. (a) Density profile of the V1 system; (b) density profile of the V2 system; (c) density profile of the V3 system.
The most interesting results can be observed in Figure 6, which shows the mass density distribution for both the hexadecane and fatty acid molecules in the blend systems. What can be seen is that the fatty acid molecules are more present in the layers closest to the surfaces, while the hexadecane molecules are more scattered, in some cases being at the interface with the surfaces, while in other cases being more present in the inner layers. This is again expected behavior, as the interactions between the surfaces and the fatty acids benefit from both the Coulomb and Lennard-Jones forces, compared to only the Lennard-Jones forces for the hexadecane molecules. It is interesting to note that for some of the blend systems, the surface interface layers have an equal concentration of both hexadecane and fatty acid molecules. During energy minimization and equilibration, the fatty acid molecules could have trapped some hexadecane molecules in the layers closest to the surfaces, hence why a good concentration of hexadecane molecules can be found there. Regardless, the general trend is the same, with it becoming clearer that even with larger systems, fatty acid molecules can be found in the layers closest to the surfaces, while the hexadecane molecules are more evenly distributed in the lubricant film.
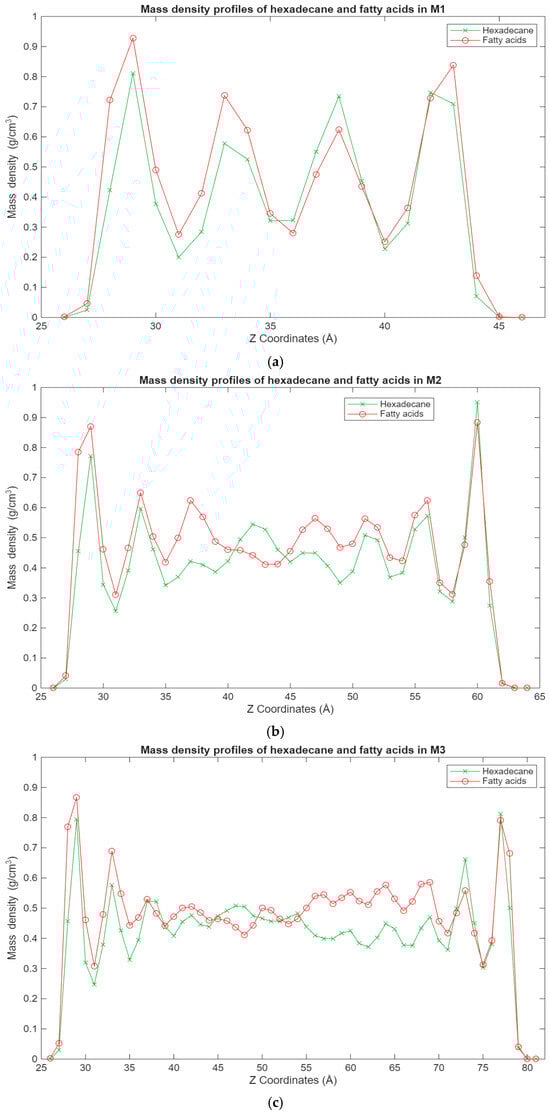
Figure 6.
Graphs showing the different superimposed mass density profiles for the hexadecane (green) and fatty acid (red) molecules in the blend systems inside the lubricant film, with the mass density in g/cm3 plotted vs. the Z coordinates in Å. (a) Density profile of the M1 system; (b) density profile of the M2 system; (c) density profile of the M3 system.
3.2. Temperature Profile
The temperature profile allows the monitoring of the temperature of the different regions of the lubricant film. The temperature of each layer is calculated by excluding the kinetic force input from the shearing motion in the x direction. It allows for monitoring the temperature of the lubricant film by factoring out the kinetic force from the induced motion on the top surface from the temperature calculations. The temperature profile is presented to show that the system is adequately thermostatted and kept within the temperature range of the experiment study.
As can be seen from Figure 7, the temperature profiles of the different systems show, on average, similar trends, albeit with some variations. The temperature of each layer varies with the temperature of the system, which is indirectly thermostatted and kept at 298 K. However, some layers exhibit slightly higher temperatures, most notably the lubricant–bottom surface interface layers, where in some cases the temperature reaches 306 K. This could be due to the stacking of the molecules near the bottom surface, which is stationary, leading to less efficient heat dissipation. This is also reinforced by layer 7 being the layer with the lowest temperature for all of the systems. It is possible that due to the layering near the stationary surface, the heat exchange with the subsequent layer is muted and diminished, leading to it exhibiting the lowest temperature across the whole film.
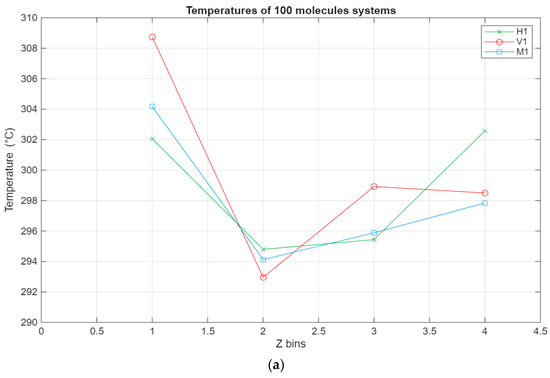
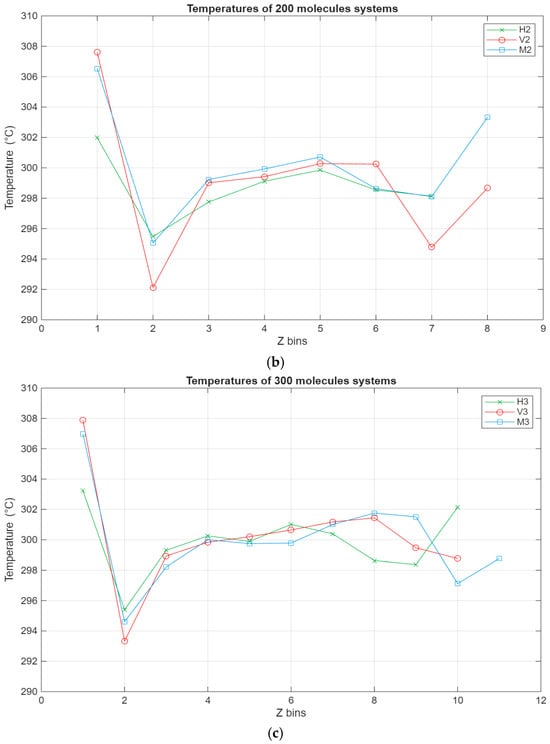
Figure 7.
Temperature profile for the different systems, with the green line representing the hexadecane systems, the red line representing the fatty acid systems, and the blue line representing the blend systems. The temperature in °C is plotted in relation to the Z bins, which represent the different segments (width of 5 Å) of the lubricant film for which the temperature was recorded throughout the simulations. (a) Temperature profile of the 100-molecule systems; (b) temperature profile of the 200-molecule systems; (c) temperature profile of the 300-molecule systems.
3.3. Velocity Profile and Shear Rate
The velocity profile represents the velocity of the different layers of the lubricant film. It is used to show how the velocity of the different layers evolved with the onset of sliding of the top surface.
As can be seen in Figure 8, all systems exhibit the same linear trend, with the highest velocities being in the layer closest to the top surface and the velocity gradually decreasing to reach a minimum near the bottom surface. Interestingly, for the larger systems, a stagnation can be observed where the velocity does not vary too much between the layers closest to the surfaces, further indicating the occurrence of molecular layering in these regions. Further reinforcing this observation are the shear rates for the different systems present in Figure 9. For the smaller systems, the shear rate variations are somewhat negligible, with the highest shear occurring around the middle layers of the systems. However, what is not apparent in the smaller systems becomes much more obvious as the systems grow in size. A clear trend can be observed within these systems, where the shear rates are at their minimum in the layers closest to the surface and gradually increase until they reach their peak in the middle layers of the lubricant film. Additionally, the values for the shear rate gradually decrease as the lubricant film size increases, indicating an inversely proportional relationship between the two metrics.
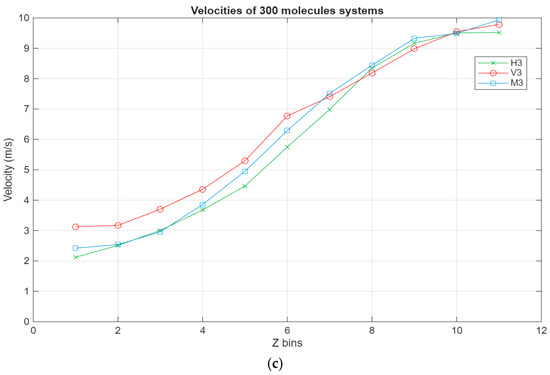
Figure 8.
Velocity profiles for the different systems, with the green line representing the hexadecane systems, the red line representing the fatty acid systems, and the blue line representing the blend systems. The velocity in m/s is plotted in relation to the Z bins, which represent the different segments (width of 5 Å) of the lubricant film for which the velocity was recorded throughout the simulations. (a) Velocity profile of the 100-molecule systems; (b) velocity profile of the 200-molecule systems; (c) velocity profile of the 300-molecule systems.
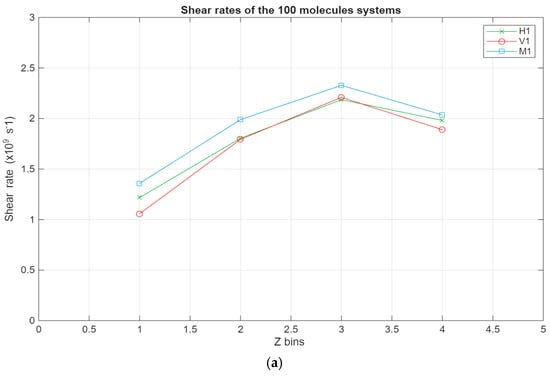
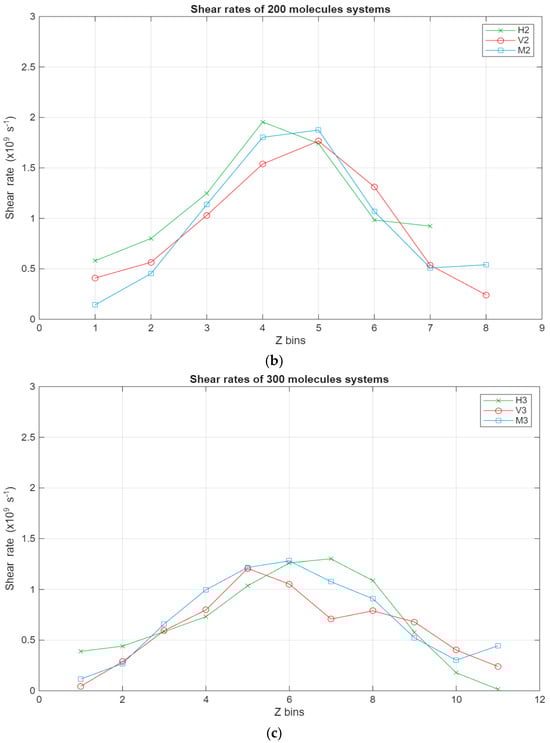
Figure 9.
Shear rates across the lubricant film for the different systems, with the green line representing the hexadecane systems, the red line representing the fatty acid systems, and the blue line representing the blend systems. The shear rate in s−1 is plotted in relation to the Z bins, which represent the different segments (width of 5 Å) of the lubricant film. (a) Shear rates of the 100-molecule systems; (b) shear rates of the 200-molecule systems; (c) shear rates of the 300-molecule systems.
3.4. Coefficient of Friction
As previously noted, the coefficient of friction was calculated by block averaging the total lateral and normal forces acting on the surface atoms that are at the lubricant-surface interface. The values presented in Table 3 are the average coefficient of friction obtained after three runs for the 100- and 200-molecule systems and five runs for the 300-molecule systems. The runs were extended to two additional runs for the 300-molecule systems to further verify the results obtained which showed a similar trend to the experimental results.
Table 3.
The mean coefficient of friction values for the simulated systems with the standard deviation and standard error of the mean.
As can be seen from Figure 10 and Table 3, the coefficient of friction widely varies from system to system. For the smaller systems, the pure fatty acid system displayed the lowest coefficient of friction, while the blend displayed the highest. For the systems with 200 molecules, the hexadecane system displayed the lowest coefficient of friction, while the fatty acid system displayed the highest. As for the largest simulated system, it showed a similar trend to the experimental results obtained in the previous study, with the coefficient of friction of the blend being between that of the fatty acid system and the hexadecane system, with the fatty acid system’s coefficient being the lowest. This indicates that the system with 300 molecules is the closest to replicating the experimental setup, with the simulation results following a similar trend to the experimental results. Additionally, it can be observed that the standard deviation for the fatty acid systems across all system sizes is the highest, meaning that the COF values vary the most between each run. Among the three systems, the blend system across all system sizes recorded the most consistent COF results with the lowest amount of variability.
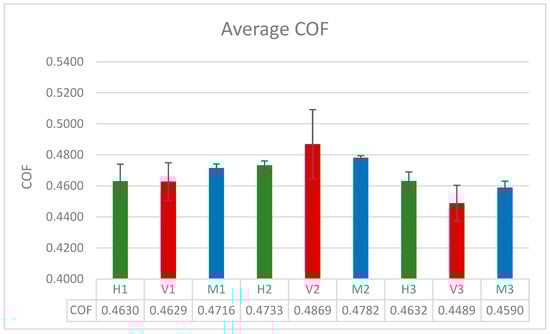
Figure 10.
The block averaged coefficient of friction for all of the systems with standard error bars.
4. Discussion
The results obtained from the different simulations conducted to find the most suitable model for the vegetable oil and oil blend show that the system with 300 molecules is the closest to replicating the experimental results among the three considered systems.
In all simulated systems, significant molecular layering near the surfaces was observed in the density profile. This behavior is also present in other studies; the results from the Ewen et al. [33] study showed that even with squalane as the lubricant of choice, strong layering was observed near the surfaces, while weaker layering was prevalent in the center of the film. Noticeably, in their study, the lubricants showed shear localization near the center of the film, which was also observed in this work, especially in the larger systems. In this work, we also observed low variability in the velocity of the molecular layers closest to the surfaces, indicating the formation of solid-like layers that move as one with similar velocities. Comparatively, the inner layers showed the most significant differences in velocities, indicating fluid-like behavior. This indicates that the surface interactions with the lubricant molecules dominate the zones closest to the surfaces, within the 12 Å cutoff of the 12-6 Lennard-Jones force. However, outside of that range, the lubricant–lubricant interactions are the dominant ones, hence why the variability in the velocities and shear rates is the highest near the middle of the lubricant film. Notably, for the density profile of the blend systems, the fatty acids mostly dominated these solid-like layers. This is also in agreement with experimental results [12,13] and further supports the viability of this model. Additionally, the observed inverse proportional relationship between system size and shear rate values in the lubricant film, where when the system grows in size, the shear rate peak decreases, can be connected to the existence of slip planes inside the lubricant film. Slip planes are defined as regions in the lubricant film where the resistance to shear is lower, allowing one layer to move relative to the other. These slip planes have been observed in other MD studies, especially in those where a defined surface adsorbed monolayer is present, and where the slip planes are present in the transitional regions of the lubricant film between the adsorbed monolayers and the other lubricant molecules [34]. Smaller systems that exhibit confinement often develop solid-like molecular layers across the lubricant film, meaning that shear is localized to fewer interlayer regions, hence why the results show higher shear rate peaks compared to the larger systems. The relative motion between the confined solid-like molecular layers becomes stick-slip, which in turn increases the local shear peaks.
Concerning the temperature profile, in all cases, the layer closest to the stationary bottom surface had an elevated temperature compared to the other layers, while the layer just after it had the lowest recorded temperature. Comparatively, the layer closest to the top surface did not record such high temperatures. This is due to the bottom layer being stationary, making the molecular layer closest to it act almost like an insulator, as there is no direct induced movement on it, which inadvertently decreases the temperature of the subsequent layer. Other studies had both surfaces moving in opposite directions; however, as the aim of this study is to model and simulate systems that, to a degree, represent the experimental work, the bottom surface had to remain stationary. Additionally, as previously noted, the temperature profile was recorded during the simulations in order to make sure that the thermostatting was performed correctly. However, the approach used in this work to calculate the temperatures across the lubricant film could potentially underestimate the temperatures of the layers inside the film, as it completely excludes the kinetic force input from the shearing motion in the x direction (sliding direction) from the temperature calculations. A better approach would possibly be to instead subtract the local streaming velocity in the x direction from the temperature calculations.
Concerning the coefficient of friction, as seen in the Section 3, the most consistent results obtained from the simulations were those from the 300-molecule systems. However, the COF values obtained through these simulations cannot be directly compared to experimental results, only the trends. As previously noted, the COF trends in the simulations are the same as the trends from the experimental study. Meanwhile, regarding the coefficient of friction values for the fatty acid systems and the large standard deviation, this can be caused by the random configuration adopted for each system in each run. When the initial configuration varies, the types of fatty acids that end up being at the interface with the surfaces also vary. This could explain why the largest variation in COF values was observed in the fatty acid systems. The smaller systems exhibited a variability in the COF results; several factors may determine why this is the case. Firstly, for smaller systems, due to the confinement of the molecules, the surface–surface and molecule–surface interactions are dominant compared to the molecule–molecule interactions. The result of this is the solid-like layering that not only occurs near the surfaces but also across the thin lubricant film as well. This is reinforced by the mass density profile and shear rate graphs, which show that high localized shear is present in these systems compared to the larger one. Additionally, for smaller systems, sampling becomes an issue, as in NEMD simulations, shear stresses strongly fluctuate due to the noisy nature of the friction forces in these types of simulations, further amplifying the finite size effect.
Finally, it is important to discuss the limitations of this study and the proposed model. Two important aspects of this model could severely influence the simulation results, the first of which is the initial configuration of the system. The molecules were randomly distributed inside of the vacuum between the iron oxide surfaces and allowed to equilibrate before and after the compression step, which was then followed by the sliding simulation. It is important to bring attention to this because it directly influences what the final configuration of the lubricant molecules inside the film is before the sliding simulations. Similar studies which used similar lubricant molecules and surface and force field parameters have all considered a predefined surface-adsorbed monolayer, as their work focused on the study of organic friction modifiers (OFMs) [23,24,25,34]. As such, the results of this work and cannot be directly compared with those of these studies. Additionally, it is possible that the approach adopted in this work does not completely capture the proper molecular orientation and packing behavior of the different molecules in the system. However, this approach was adopted because as previously stated, the goal of this study was to build a model that will be used in later works with the inclusion of carbon-based nanoparticles. It is as yet unknown what their mechanism is as it relates to the improvement of the performance of the lubricant blend specifically. In addition, considering a predefined surface-adsorbed fatty acid layer, as is the convention, would possibly limit what mechanism can be inferred from the MD simulations. As such, a more suitable approach would be to, in addition to this work, model systems with predefined surface-adsorbed fatty acid layers and include carbon-based nanoparticles in both kinds of systems. A comparison could then be performed between the systems from this work and the proposed systems.
The second aspect is the choice of sliding velocity. As previously noted, the sliding velocity from the experimental study was 0.157 m/s, compared to the 10 m/s used for the simulations. The main issue is that such a high sliding velocity could potentially disrupt the molecular layers and lead to higher COF values. However, the trends seem to be preserved, especially for the larger system. Other studies have shown that even at high sliding velocities, the coefficient of friction is not significantly affected [23]. In addition, working with lower sliding velocities is computationally expensive and is not currently feasible.
Finally, in our previous experimental study, a possible mechanism was proposed for the role of carbon-based nanoparticles in the improvement of the performance of the lubricants used. As this study has shown, along with others, the inner layers of the lubricant film can play a crucial role in the overall dynamics of the film. Introducing carbon-based nanoparticles into such a system can potentially increase the size of the solid-like molecular layers near the surfaces and extend them further into the lubricant film. This potentially creates better-ordered molecular layers and more sheer localization that is closer to the middle of the film and less spread out between the fluid-like layers. However, this is not within the scope of this study, and so will be addressed in a follow-up study.
5. Conclusions
The simulations performed here provide valuable insights into the molecular-level dynamics of lubricant films and how they behave under specific conditions. They also help with the determination of which model is most suitable for representing the previously conducted experimental work. The conclusions are as follows:
- •
- Concerning the mass density profile, solid-like molecular layers form near the surfaces, while fluid-like layers dominate the middle zones of the film. The lubricant–surface interactions are the main driving force behind these solid-like molecular layering near the surfaces, while lubricant–lubricant interactions dominate the inner layers. The blend systems demonstrate the contrast between the hexadecane and fatty acid molecules and where they pack, with the fatty acid molecules mostly dominating the solid-like molecular layers.
- •
- Concerning the temperature profile, the molecular layer closest to the bottom surface acts like an insulator, leading to an increase in the temperature of that layer and a decrease in the temperature of the subsequent layer. This was true for all cases.
- •
- Concerning the velocity profile, all systems have a similar, somewhat linear velocity profile. Likewise, especially in the larger systems, a localized shear regime is observed in the middle layers of the film. Comparatively, the velocity stagnates in the layers closest to the surfaces, and this is reflected in the shear rate, as its lowest values are recorded in these layers. This further proves that solid-like molecular layers that move as one form near the surfaces.
- •
- The shear rates peak around the middle of the lubricant film across all studied systems, presenting an inversely proportional relationship with system size.
- •
- The coefficient of friction of the largest system, with 300 molecules, displays a trend similar to the experimental results. Moving forward, in future studies, this model will be adopted.
The authors propose taking into consideration the points raised here, namely those related to the initial configuration and sliding velocity. A comparative study should be performed where a predefined initial configuration is used instead of a randomized one, as was the case in this study. After this, carbon-based nanoparticles could be introduced for both kinds of systems, and the results can be compared to better understand the mechanisms of action when accounting for all variables.
Author Contributions
Conceptualization, J.N. and D.-L.C.; methodology, J.N.; software, J.N.; validation, J.N. and D.-L.C.; formal analysis, J.N.; investigation, J.N.; resources, J.N.; data curation, J.N.; writing—original draft preparation, J.N.; writing—review and editing, D.-L.C.; visualization, J.N.; supervision, D.-L.C.; project administration, D.-L.C. All authors have read and agreed to the published version of the manuscript.
Funding
This research received no external funding.
Data Availability Statement
The original contributions presented in the study are included in the article, further inquiries can be directed to the corresponding author.
Conflicts of Interest
The authors declare no conflicts of interest.
References
- Mendonça, A.C.F.; Fomin, Y.D.; Malfreyt, P.; Pádua Aa, H. Novel ionic lubricants for amorphous carbon surfaces: Molecular modeling of the structure and friction. Soft Matter 2013, 9, 10606. [Google Scholar] [CrossRef]
- Gkagkas, K.; Ponnuchamy, V.; Dašić, M.; Stanković, I. Molecular dynamics investigation of a model ionic liquid lubricant for automotive applications. Tribol. Int. 2016, 113, 83–91. [Google Scholar] [CrossRef]
- Valencia-Marquez, D.; Flores-Tlacuahuac, A.; García-Cuéllar, A.J.; Ricardez-Sandoval, L. Computer-aided molecular design coupled with molecular dynamics as a novel approach to design new lubricants. Comput. Chem. Eng. 2021, 156, 107523. [Google Scholar] [CrossRef]
- Abdulfatai, U.; Uzairu, A.; Shallangwa, G.A.; Uba, S. Computational modelling of some anti-friction lubricant additives. S. Afr. J. Chem. Eng. 2020, 32, 27–31. [Google Scholar] [CrossRef]
- Dašić, M.; Ponomarev, I.; Polcar, T.; Nicolini, P. Tribological properties of vanadium oxides investigated with reactive molecular dynamics. Tribol. Int. 2022, 175, 107795. [Google Scholar] [CrossRef]
- Wu, Z.; Dong, B.; Peng, G.; Luo, W.; Shan, X.; Nie, L.; Chen, J.; Zeng, L.; Jie, J.; Li, T. Novel insight into the self-lubricating mechanism of Cu–Pb bearing alloy during sliding friction with the guidance of molecular dynamics. J. Mater. Res. Technol. 2023, 24, 3157–3163. [Google Scholar] [CrossRef]
- Xiong, S.; Zhang, X.; Liang, D. Molecular dynamics simulation of friction coefficient of Fe-Al during lubrication. Comput. Mater. Sci. 2022, 217, 111895. [Google Scholar] [CrossRef]
- Li, X.; Xu, X.; Zhou, Y.; Lee, K.; Wang, A. Insights into friction dependence of carbon nanoparticles as oil-based lubricant additive at amorphous carbon interface. Carbon 2019, 150, 465–474. [Google Scholar] [CrossRef]
- Han, Y.; Pan, L.; Zhang, H.; Zeng, Y.; Yin, Z. Effect of lubricant additives of Cu, Fe and bimetallic CuFe nanoparticles on tribological properties. Wear 2022, 508–509, 204485. [Google Scholar] [CrossRef]
- Mehrnia, S.; Pelz, P.F. Slip length of branched hydrocarbon oils confined between iron surfaces. J. Mol. Liq. 2021, 336, 116589. [Google Scholar] [CrossRef]
- Nasr, J.; Cursaru, D. The performance of Carbon-Based nanomaterials in different base oils and an oil blend. Lubricants 2024, 12, 90. [Google Scholar] [CrossRef]
- Fox, N.; Tyrer, B.; Stachowiak, G. Boundary lubrication performance of free fatty acids in sunflower oil. Tribol. Lett. 2004, 16, 275–281. [Google Scholar] [CrossRef]
- Reeves, C.J.; Menezes, P.L.; Jen, T.; Lovell, M.R. The influence of fatty acids on tribological and thermal properties of natural oils as sustainable biolubricants. Tribol. Int. 2015, 90, 123–134. [Google Scholar] [CrossRef]
- Blake, R.L.; Hessevick, R.E.; Zoltai, T.; Finger, L.W. Refinement of the hematite structure. Am. Mineral. 1996, 51, 123–129. [Google Scholar]
- Berro, H.; Fillot, N.; Vergne, P. Molecular dynamics simulation of surface energy and ZDDP effects on friction in nano-scale lubricated contacts. Tribol. Int. 2010, 43, 1811–1822. [Google Scholar] [CrossRef]
- Momma, K.; Izumi, F. VESTA: A three-dimensional visualization system for electronic and structural analysis. J. Appl. Crystallogr. 2008, 41, 653–658. [Google Scholar] [CrossRef]
- Jorgensen, W.L.; Maxwell, D.S.; Tirado-Rives, J. Development and testing of the OPLS All-Atom Force Field on conformational energetics and properties of organic liquids. J. Am. Chem. Soc. 1996, 118, 11225–11236. [Google Scholar] [CrossRef]
- Jorgensen, W.L.; Tirado-Rives, J. Potential energy functions for atomic-level simulations of water and organic and biomolecular systems. Proc. Natl. Acad. Sci. USA 2005, 102, 6665–6670. [Google Scholar] [CrossRef]
- Dodda, L.S.; Vilseck, J.Z.; Tirado-Rives, J.; Jorgensen, W.L. 1.14*CM1A-LBCC: Localized Bond-Charge corrected CM1A charges for Condensed-Phase simulations. J. Phys. Chem. B 2017, 121, 3864–3870. [Google Scholar] [CrossRef]
- Dodda, L.S.; De Vaca, I.C.; Tirado-Rives, J.; Jorgensen, W.L. LigParGen web server: An automatic OPLS-AA parameter generator for organic ligands. Nucleic Acids Res. 2017, 45, W331–W336. [Google Scholar] [CrossRef]
- Siu, S.W.I.; Pluhackova, K.; Böckmann, R.A. Optimization of the OPLS-AA force field for long hydrocarbons. J. Chem. Theory Comput. 2012, 8, 1459–1470. [Google Scholar] [CrossRef]
- Ewen, J.; Gattinoni, C.; Thakkar, F.; Morgan, N.; Spikes, H.; Dini, D. A comparison of classical Force-Fields for molecular dynamics simulations of lubricants. Materials 2016, 9, 651. [Google Scholar] [CrossRef]
- Ewen, J.P.; Gattinoni, C.; Morgan, N.; Spikes, H.A.; Dini, D. Nonequilibrium molecular dynamics simulations of organic friction modifiers adsorbed on iron oxide surfaces. Langmuir 2016, 32, 4450–4463. [Google Scholar] [CrossRef]
- Doig, M.; Warrens, C.P.; Camp, P.J. Structure and friction of stearic acid and oleic acid films adsorbed on iron oxide surfaces in squalane. Langmuir 2013, 30, 186–195. [Google Scholar] [CrossRef]
- Jaishankar, A.; Jusufi, A.; Vreeland, J.L.; Deighton, S.; Pellettiere, J.; Schilowitz, A.M. Adsorption of stearic acid at the Iron Oxide/Oil Interface: Theory, experiments, and modeling. Langmuir 2019, 35, 2033–2046. [Google Scholar] [CrossRef]
- Gravelle, S.; Alvares, C.M.S.; Gissinger, J.R.; Kohlmeyer, A. A set of tutorials for the LAMMPS Simulation Package [Article v1.0]. Living J. Comput. Mol. Sci. 2025, 6, 3027. [Google Scholar] [CrossRef]
- Ryckaert, J.; Ciccotti, G.; Berendsen, H.J. Numerical integration of the cartesian equations of motion of a system with constraints: Molecular dynamics of n-alkanes. J. Comput. Phys. 1977, 23, 327–341. [Google Scholar] [CrossRef]
- Yeh, I.; Berkowitz, M.L. Ewald summation for systems with slab geometry. J. Chem. Phys. 1999, 111, 3155–3162. [Google Scholar] [CrossRef]
- Thompson, A.P.; Aktulga, H.M.; Berger, R.; Bolintineanu, D.S.; Brown, W.M.; Crozier, P.S.; Veld, P.J.I.; Kohlmeyer, A.; Moore, S.G.; Nguyen, T.D.; et al. LAMMPS—A flexible simulation tool for particle-based materials modeling at the atomic, meso, and continuum scales. Comput. Phys. Commun. 2021, 271, 108171. [Google Scholar] [CrossRef]
- Schneider, T.; Stoll, E. Molecular-dynamics study of a three-dimensional one-component model for distortive phase transitions. Phys. Rev. B Condens. Matter 1978, 17, 1302–1322. [Google Scholar] [CrossRef]
- Bernardi, S.; Todd, B.D.; Searles, D.J. Thermostating highly confined fluids. J. Chem. Phys. 2010, 132, 244706. [Google Scholar] [CrossRef] [PubMed]
- Stukowski, A. Visualization and analysis of atomistic simulation data with OVITO–the Open Visualization Tool. Model. Simul. Mater. Sci. Eng. 2009, 18, 015012. [Google Scholar] [CrossRef]
- Ewen, J.P.; Gattinoni, C.; Zhang, J.; Heyes, D.M.; Spikes, H.A.; Dini, D. On the effect of confined fluid molecular structure on nonequilibrium phase behavior and friction. Phys. Chem. Chem. Phys. 2017, 19, 17883–17894. [Google Scholar] [CrossRef] [PubMed]
- Ewen, J.P.; Kannam, S.K.; Todd, B.D.; Dini, D. Slip of Alkanes Confined between Surfactant Monolayers Adsorbed on Solid Surfaces. Langmuir 2018, 34, 3864–3873. [Google Scholar] [CrossRef] [PubMed]


Disclaimer/Publisher’s Note: The statements, opinions and data contained in all publications are solely those of the individual author(s) and contributor(s) and not of MDPI and/or the editor(s). MDPI and/or the editor(s) disclaim responsibility for any injury to people or property resulting from any ideas, methods, instructions or products referred to in the content. |
© 2025 by the authors. Licensee MDPI, Basel, Switzerland. This article is an open access article distributed under the terms and conditions of the Creative Commons Attribution (CC BY) license (https://creativecommons.org/licenses/by/4.0/).