Abstract
Oils with low-friction performance are essential to meet the evolving requirements of the modern industry. Except for the viscosity, there is still a lack of a high-pressure rheological parameter that can quantitatively compare the friction performance of base oils. This study investigated the frictional behavior of six types of base oils with identical viscosity at 40 °C—paraffinic mineral oil 500N, naphthenic mineral oil, polyalphaolefin (PAO), oil-soluble polyether, ester oil, and alkyl naphthalene. Stribeck and traction curves were measured. The limiting shear stress (LSS) has been proposed and modeled for the quantitative comparison of the friction behavior of the base oils at high pressures (1.2–1.7 GPa). Results indicate that the PAO exhibits the lowest friction coefficient. Additionally, the LSS of all tested oils has a linear relation with the average contact pressure (R2 > 99%), suggesting that the LSS at different mean contact pressures can be predicted using a linear LSS-pressure fitting model. This work contributes to providing fluid rheological models for the quantitative EHL friction prediction and provides guidance for choosing low-friction base oils for EHL-lubricated rolling/sliding contacts.
1. Introduction
Friction, as an inevitable phenomenon in mechanical motion, consumes about one-third of the world’s primary energy [1]. Lubrication is one of the most effective ways to reduce friction and minimize wear, playing a crucial role in the low-carbon development of modern industry. As the main component of lubricants, base oil accounts for 70% to 99% of the composition of greases and lubricating oils, and its performance directly affects the overall performance of the lubricant [2,3]. From mineral oils and PAO synthetic oils to the increasingly valued ester oils, the advancement in types and quality of base oils has always been the core driver for the development of lubrication technology. Currently, electric vehicles and humanoid robots that use rechargeable batteries have imposed extremely high requirements for reducing friction in moving parts and improving transmission efficiency [4]. It is essential to understand the differences in the frictional performances among different types of base oils for the formulation of low-friction lubricants.
Elastohydrodynamic lubrication (EHL) is the typical lubrication regime for components such as rolling bearings and gears under high contact pressures (in the order of GPa). The friction in the rolling/sliding EHL contact primarily originates from the shear resistance between lubricant molecules in the high-pressure contact zone. It is mainly determined by the high-pressure rheological properties of the base oil and usually has a negligible relation to the type and content of additives [5,6]. In the early stages of EHL research, researchers have already observed that the type of base oil has a significant impact on the friction performance of oil lubrication. Round [7] used a thrust ball bearing device to compare the friction performance of several base oils and indicated that under the same conditions, the friction coefficient of naphthenic mineral oil was higher than that of paraffinic mineral oil. Subsequently, Hammann et al. [8] pointed out that molecules with cyclohexyl rings gave high EHL friction. This is consistent with the observation of Round [7], as naphthenic mineral oils contain higher saturated ring content. Wang et al. [9] conducted tests on a mini traction machine (MTM) and found that, compared to paraffinic mineral oils with more branched chains, PAO and polyol ester oils with linear chains and flexible groups have lower friction coefficients and stronger adaptability to changes in temperature and pressure. This preliminarily explains the reason why Group III and IV oils generally give lower friction. Zhang et al. [10] measured the EHL traction curves of a series of base oils (including mineral oils, PAO, ester oils, polyethers, etc.) and confirmed the key role of base oil molecular structure. They found that base oils with linear-shaped molecular structures containing flexible bonds exhibit lower friction than those with bulky side groups or rings.
In EHL contacts upon relative sliding/rolling motion, the lubricant exhibits non-Newtonian characteristics under high-pressure and high-shear conditions. Both experiments and numerical models have suggested that the Newtonian fluid model does not hold for the EHL friction prediction [11]. For this reason, non-Newtonian rheological studies under high-pressure conditions are extremely important for investigating the EHL friction. The flow curve of lubricants (shear stress against shear rate) under high pressure can be divided into four distinct regimes [12,13,14,15], as shown in Figure 1, namely the linearly increasing Newtonian stage, the shear thinning stage, the possible limiting shear stress (LSS) stage, and the declining stage dominated by thermal effects. As a high-pressure rheological parameter of the lubricant, the concept and definition of LSS was first proposed by Smith [15]. It represents the maximum shear stress that the lubricant can transfer under specific pressure, shear, and temperature conditions [16]. It reflects the limit state of lubricants under high-pressure and high-shear conditions [15]. The maximum friction in highly loaded EHL contacts is typically determined by the LSS of the lubricant [17]. Therefore, through LSS measurement, a quantitative assessment of the influences of base oils on the EHL friction can be performed.
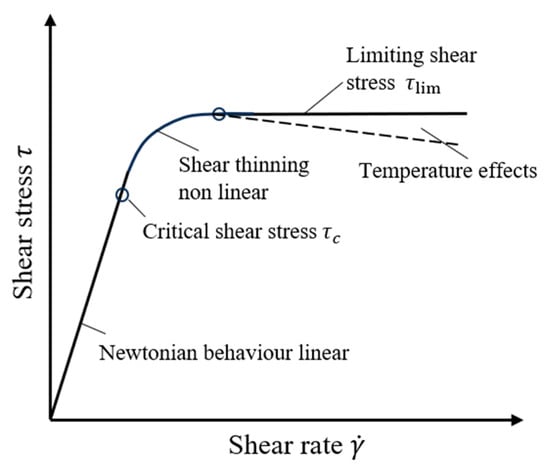
Figure 1.
Schematic of the rheological flow curve of oils.
The most widely used method for characterizing the LSS of lubricants is through measuring the traction curve of EHL at high pressures [13,18,19,20]. Ndiaye et al. [19] pointed out that traction measurement requires selecting an appropriate entrainment speed to reduce the effects of both shear heating and mixed lubrication and to ensure that the measured LSS is produced by the internal friction of the lubricant itself at a relatively constant temperature. They suggested selecting the entrainment speed corresponding to the lambda ratio (the ratio of minimum film thickness to composite surface roughness) being 3. However, some studies indicate that when the lambda ratio is 1, the lubrication state of the studied engineering surfaces might already be in the full-film EHL state. Recently, our group [13] proposed a new method for the selection of the critical entrainment speed for LSS measurements. This is fulfilled by measuring a set of traction curves at different entrainment speeds, selecting the curve with a plateau feature where the friction coefficient does not change with increasing slide–roll ratio as for the critical speed. This method avoids the effects of shear heating and mixed lubrication as much as possible. The specific methodology is described in detail in Section 2.3 and in Ref. [13].
In summary, the current research on different types of base oils under elastohydrodynamic lubrication conditions has been quite extensive. However, there is still a lack of comparison under the condition of equivalent viscosity. Except for the viscosity, a characteristic high-pressure rheological parameter that can quantitatively compare the friction performance of base oils, remains unclear. Therefore, this paper adopts LSS as the characteristic high-pressure rheological parameter of base oils and measures and compares their LSS at equivalent viscosity at 40 °C, thereby achieving a quantitative comparison of the elastohydrodynamic friction. At the same time, combining the LSS-pressure fitting curve enables the prediction of the LSS for base oils under different operating conditions.
2. Materials and Methods
2.1. Experimental Materials
Six types of base oils with the same viscosity at 40 °C, including Poly Alpha Olefin (PAO), Mineral Oil 500N, Naphthenic Base Oil (NBO), Synthetic Ester Oils, Oil Soluble Polyether (OSP), and Alkyl Naphthalene (AN), were used in this study. The dynamic viscosity of 86 mPa·s of 500N at 40 °C was used as the target viscosity. Base oils of the same type but with different viscosities were mixed to achieve this target viscosity. This resulted in six base oil samples with similar viscosities but different types, named PAO-M, 500N, NBO-M, Ester, OSP-M, and AN-M, respectively. Among them, 500N was provided by Zhongke Runmei Lubrication Material Technology Co., Ltd. (Qingdao, China) PAO-M was obtained by mixing PAO10 and PAO40 at a mass fraction ratio of 4:1, provided by ExxonMobil Corporation (Shanghai, China). NBO-M was obtained by mixing NBO-4006 and NBO-4010 at a mass fraction ratio of 2:3, provided by Luying Chemical Co., Ltd. (Jinan, China). RM-1360 and RM-1450, provided by Zhongke Runmei Lubrication Material Technology Co., Ltd. (Qingdao, China), were mixed at mass proportions of 88.5% and 11.5% to obtain the ester base oil. OSP-M was obtained by mixing OSP-68 and OSP-100 at a mass fraction ratio of 3:2, provided by Nanjing Kailian Chemical New Materials Co., Ltd. (Nanjing, China). AN-M was obtained by mixing AN-5 and AN-15 at mass proportions of 26% and 74%, provided by Huameite Lubrication Technology Co., Ltd. (Shenzhen, China). To ensure thorough mixing, the stirring time for blending is controlled at 25 min at a temperature of 75 °C. The mixed lubricant is then subjected to viscosity testing using a rheometer. The basic physical and chemical properties of the prepared six base oils are shown in Table 1.

Table 1.
Physical-chemical properties of the six types of base oils.
2.2. Test Rig
The MTM2 mini traction machine (PCS Instruments, London, UK) is used to measure the frictional behavior of different types of base oils. A schematic diagram of its working principle is shown in Figure 2. The ball specimen forms a point contact with the disk under the application of an external load. The ball and the disk are driven by two motors, allowing free adjustment of the SRR and the entrainment speed ue, which is defined as follows:
where u1 is the speed of the disk, and u2 is the speed of the ball. The SRR is defined as follows:
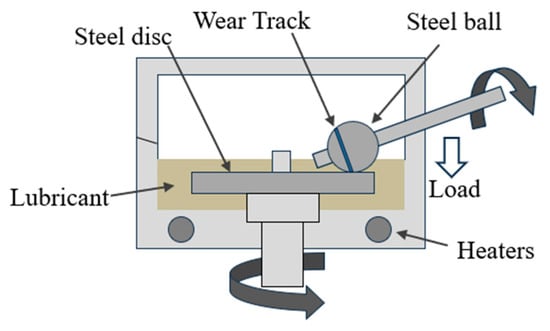
Figure 2.
Schematic of the measurement principle of the MTM2 mini traction machine.
The shaft holding the ball specimen is tilted toward the center of the disk to eliminate the influence of spin on friction measurements. The friction is measured by a traction transducer connected to the ball specimen shaft. Each data point is obtained by averaging the absolute values of friction measured at positive and negative SRRs. The temperature is controlled by a closed-loop system, which allows it to be adjusted from room temperature to 150 °C. Before the experiment, the ball and disk samples are separately immersed in petroleum ether for ultrasonic cleaning for ten minutes. After wiping, this cleaning procedure is repeated twice. Similarly, the oil pool is cleaned multiple times with petroleum ether to eliminate any influence of residuals from previous experiments.
In this study, the ball and disk specimens are made of tungsten carbide (WC, ISO international grade K20). The elastic modulus and Poisson’s ratio are 610 GPa and 0.258, respectively. It has a higher elastic modulus than bearing steel, thereby achieving higher contact pressures under the same load. This would facilitate the measurement of LSS under a broad range of pressures. The diameters of the WC balls and disks used in the experiment are 19.05 mm and 46 mm, respectively, and the surface roughness Ra is less than 20 nm for both.
2.3. Calculation of Limiting Shear Stress
Limiting shear stress (LSS), one of the characteristic rheological parameters of lubricants under high-pressure and high-shear conditions, is used for the quantitative comparison of their EHL friction. The relation between the LSS and the maximum friction coefficient in the traction curve is shown by Equation (3) [15]:
where FN is the applied load, A is the contact area, pm is the mean contact pressure, and fmax is the maximum friction coefficient in the “plateau region” of the traction curve at a specific entrainment speed.
It can be known from Equation (3) that the key to determining the LSS of a lubricant under specific contact pressure and temperature is the determination of the maximum friction coefficient fmax. The prerequisite for determining fmax is to select an appropriate entrainment speed so that the measured traction curve exhibits the “plateau region”. This study determines fmax and LSS based on the method for the selection of the critical entrainment speed proposed by Ma et al. [13] in our research group. Under specific experimental conditions, we measure traction curves under a series of entrainment speeds. The measured traction curves can be in three forms, as shown in Figure 3. The first form is the so-called thermal form in EHL, where the friction coefficient decreases with increasing SRR after reaching the maximum value, indicating the thermal shear heating effect in the full-film EHL regime. The second one is the LSS form, where the friction coefficient does not change with the slide-to-roll ratio, i.e., the “plateau region”. The third one is the mixed lubrication form in which the friction coefficient increases with increasing SRR because of increased asperity contacts. The measured traction curves are shown in the Appendix A, Figure A1. The critical entrainment speed corresponds to the second form, and interested readers can refer to the work by Ma et al. [13].
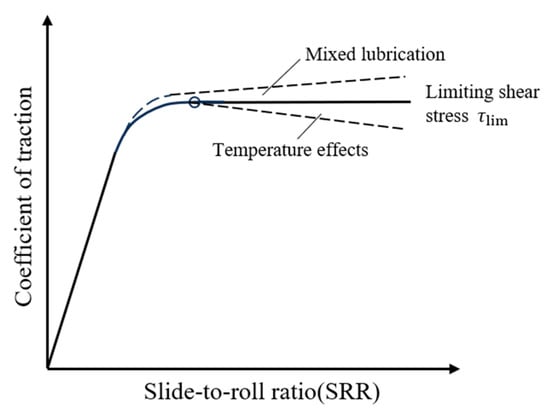
Figure 3.
Schematic of friction curves at different lubrication regimes.
2.4. Experimental Conditions
The study on the frictional behavior of different types of base oils includes two parts: the measurement of friction coefficients under different lubrication regimes at varying entrainment velocities (Stribeck curve) and the measurement of friction coefficients in the EHL regime at different SRRs (traction curve).
The operating conditions used for the Stribeck curve measurement are at entrainment speed from 0.01 m/s to 1.0 m/s, SRR of 10%, mean contact pressure pm = 1.4 GPa, and test temperatures of 40 °C, 60 °C, and 80 °C. The test conditions for the traction curve measurement are at loads of 25 N, 32 N, 40 N, 49 N, 60 N, and 72 N, respectively, with corresponding mean Hertzian contact pressures pm of 1.2 GPa, 1.3 GPa, 1.4 GPa, 1.5 GPa, 1.6 GPa, and 1.7 GPa calculated by the Hertzian contact theory [21], entrainment speed of 0.4–2.0 m/s, test temperatures of 40 °C, 60 °C, and 80 °C, respectively, and SRR till 50%. The operating parameters are summarized in Table 2.

Table 2.
Experimental conditions.
3. Results and Discussion
3.1. Viscosity-Temperature Properties
The viscosity-temperature properties refer to the variation in the oil viscosity with temperature, which is a key indicator for measuring the performance stability of base oils over a wide temperature range. It was measured by an Anton Paar MCR302 rotational rheometer (Graz, Austria). Figure 4 shows the variation in dynamic viscosity with temperature for the six types of base oils used in the experiment within the range of 20–100 °C. Combined with the viscosity indices in Table 1, it can be seen that the naphthenic mineral oil NBO-M with the smallest viscosity index gives the largest viscosity change with temperature and the worst viscosity-temperature performance, whereas the oil-soluble polyether OSP-M with the largest viscosity index demonstrates the smallest viscosity change with temperature and the best viscosity-temperature performance. Additionally, the six types of base oils exhibit opposite viscosity rankings under low-temperature and high-temperature conditions.
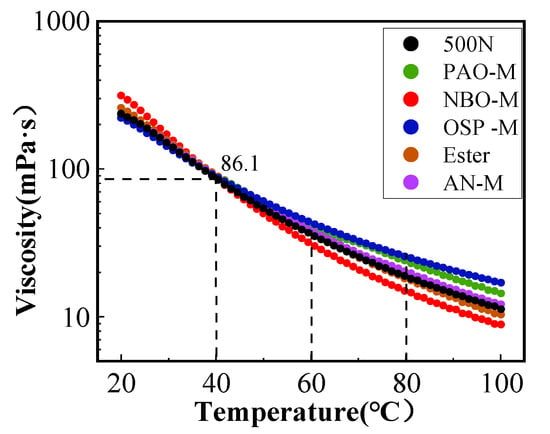
Figure 4.
Variation in dynamic viscosity with temperature of the six base oils.
Note that the viscosity-pressure coefficient was derived from measured film thickness using optical interferometry at 20 °C. The values are shown in Table 1.
3.2. Comparison of Stribeck Curves for Different Types of Base Oils
Figure 5a–c show the Stribeck curves for the six types of base oils at test temperatures of 40 °C, 60 °C, and 80 °C, respectively. To ensure the accuracy of the experimental data, each Stribeck curve was measured four times and presented as an average.
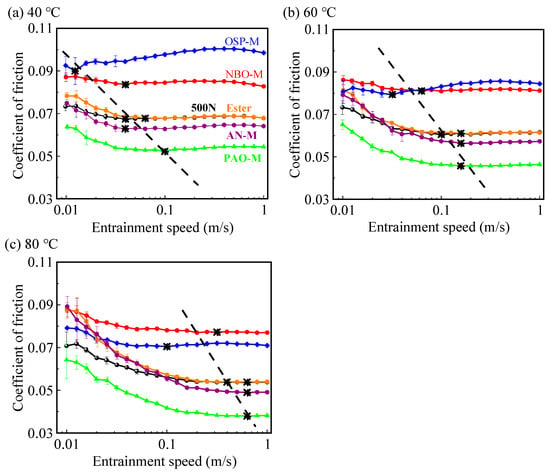
Figure 5.
Stribeck curves of the six base oils at (a) 40 °C, (b) 60 °C, and (c) 80 °C, respectively (mean contact pressure of pm = 1.4 GPa, entrainment speed of ue = 0.01–1 m/s, and SRR = 10%). (“*” is the transition point between EHL and mixed lubrication).
As can be seen from the figures, except for the OSP-M, the measured curves of the other five base oils at different temperatures exhibit typical Stribeck curve characteristics. As the entrainment speed increases, the enhancement of the (elasto-)hydrodynamic lubrication effect leads to an increase in the formed oil film thickness. This leads to a transition from mixed lubrication to the EHL regime, thereby resulting in a gradually decreasing friction coefficient. For the OSP-M, at test temperatures of 40 °C and 60 °C, its friction coefficient shows a trend of first decreasing and then increasing with the increase in the entrainment speed. Because the oil-soluble polyether ether bond (-O-) molecular chain has strong polarity, enabling it to adsorb onto metal surfaces and more easily form a thin film, thereby reducing boundary friction during the low-speed stage [22]. However, as speed increases, the film thickness in the contact area further enlarges, reaching full-film lubrication, at which point molecular accumulation and strong polarity may lead to higher frictional forces. When the test temperature rises to 80 °C, the measured curve exhibits typical Stribeck curve characteristics.
It is noteworthy that in Figure 5a, at a temperature of 40 °C, the six types of base oils with approximately the same viscosities give different friction coefficients in both low-speed mixed lubrication and high-speed EHL conditions. This indicates that differences in the chemical structure, composition, and polarity of the base oils would lead to different adsorption behavior at the contact interface, different pressure-viscosity characteristics, and different film-forming properties, thereby resulting in different mixed/EHL friction coefficients. At 40 °C, the order of EHL friction coefficients for the six types of base oils is OSP-M > NBO-M > 500N = Ester > AN-M > PAO-M. However, as the test temperature rises to 80 °C, the EHL friction coefficient of the NBO-M (with the smallest viscosity) exceeds that of the OSP-M (with the largest viscosity), resulting in the largest EHL friction coefficient among the six types of base oils. The molecular structure of NBO-M is mostly cyclic or polycyclic, with multiple rings connected. The complex ring structure makes the molecules resistant to easy deformation and rotation, thereby giving them a higher pressure-viscosity coefficient and internal friction [6]. In contrast, the ether bonds in the OSP-M impart partial rigidity to the molecular chain, but this rigidity is lower than that of the ring structures in naphthenic hydrocarbons, typically resulting in a lower pressure-viscosity coefficient compared to naphthenic mineral oils [23]. According to the Hamrock-Dowson equation [24,25], under the condition of the same initial viscosity at 40 °C, the NBO-M with a larger pressure-viscosity coefficient provides a greater inlet viscosity and thus EHL film thickness compared to the OSP-M. However, under the high-pressure and high-shear conditions in the EHL contact zone, the non-Newtonian shear-thinning behavior, limiting shear stress, and thermal effects of the base oil (the thicker EHL oil film is not good for heat dissipation) further reduce the effective viscosity and local shear force of the NBO-M in the contact zone, thereby resulting in smaller EHL friction compared to the OSP-M.
Within the experimental temperature range, the ester and the 500N give the same EHL friction coefficients. Whereas in the mixed lubrication regime, the base oil ester shows a higher friction coefficient than the 500N. This may be due to the high branched-chain content in the ester base oil. The greater the degree of branching, the larger the friction coefficients in mixed and EHL regimes [26]. In the low-speed mixed lubrication regime, the Ester provides a larger friction coefficient than the AN-M at 40 °C. The difference mainly stems from the internal molecular structure and chemical composition of the base oils, rather than low-shear viscosity itself. As the test temperature rises to 60 °C and 80 °C, the low-speed friction coefficients of both the ester and the AN-M increase accordingly (as shown in Figure 6e,f). This means that these two base oils have better friction-reducing capabilities under low-temperature and low-speed conditions. However, as the temperature increases, their friction-reducing performance deteriorates. The PAO-M provides the lowest friction coefficients under different test temperatures and different entrainment speeds, which may benefit from its regular chain-like molecular structure. Its flexible groups and linear molecules allow for freer movement, making it easier to be sheared during friction and thus yielding lower friction coefficients [10].
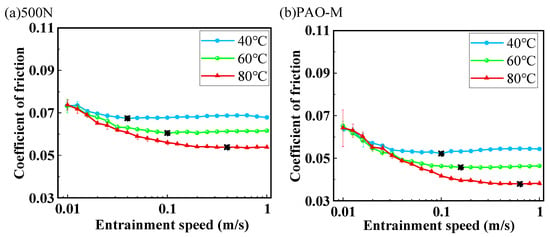
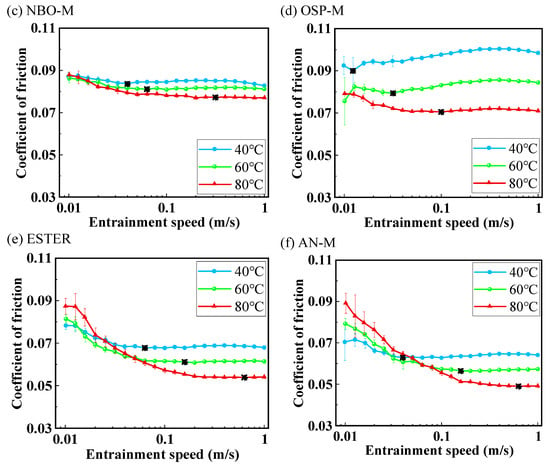
Figure 6.
The influence of temperature on the Stribeck curves of the six types of base oils: (a) 500N, (b) PAO-M, (c) NBO-M, (d) OSP-M, (e) Ester, (f) AN-M (pm = 1.4 GPa, ue = 0.01–1 m/s, SRR = 10%). (“*” is the transition point between EHL and mixed lubrication).
Combining Figure 4 with Figure 6c,d, the naphthenic oil NBO-M has the worst viscosity-temperature performance, yet its friction coefficient in the EHL regime shows the smallest change with temperature. For the naphthenic mineral oil NBO-M, the saturated cyclic structure results in irregular molecular shapes and large volumes, leading to enhanced intermolecular interlocking and hindering shear sliding. Even if the temperature rise causes a decrease in viscosity, the molecular rigidity still maintains a high shear stress (τ), thereby keeping the friction coefficient at a relatively high level with minimal changes. The oil-soluble polyether OSP-M has the best viscosity-temperature performance, but its friction coefficient in the EHL regime exhibits the largest difference with changes in temperature. This phenomenon has been reported recently in the lubrication study of engine oils with OSP and PAGs. However, due to the variation in the molecular structure of the OSPs, it should be studied further. This phenomenon indicates that (Newtonian low-shear) viscosity under low-pressure and low-shear conditions is not necessarily the primary factor affecting EHL friction. The molecular structure and rheological properties of the base oil under high pressures play key roles.
Figure 6a–f compare the Stribeck curves measured for the six types of base oils under different temperatures. As can be seen from the figures, the friction coefficients in the low-speed mixed lubrication state exhibit different temperature response characteristics. The friction coefficient of the non-polar oils, i.e., 500N, PAO-M, and NBO-M, is less affected by temperature, providing essentially consistent mixed friction coefficients at different temperatures, while the friction coefficient of OSP-M decreases with increasing temperature in the mixed lubrication regime. In contrast, the friction coefficient of the polar Ester and AN-M increases with rising test temperature in the low-speed mixed lubrication regime, which may be related to the conformational changes and desorption of polar base oil molecules at the interface caused by the temperature increase.
As the test temperature increases, the friction coefficients of the six types of base oils in the high-speed EHL regime all exhibit varying degrees of decline. The reason is that the EHL friction primarily originates from shear within the oil film. The rise in temperature reduces the equivalent viscosity and the limiting shear stress of the base oil, thereby leading to a decrease in the EHL friction and the friction coefficient [13,27]. Referring to the friction coefficients of different base oils at an entrainment speed of 0.5 m/s in Figure 7, it can be observed that the magnitude of the decrease in the friction coefficient with increasing temperature for each base oil does not correspond well with the viscosity index in Table 1. Theoretically, the higher the viscosity index of the base oil, the smaller the amplitude of viscosity decrease with temperature, and thus the smaller the decrease in the EHL friction coefficient would be expected. However, in the experiment, the OSP-M has the highest viscosity index, yet its friction coefficient shows the most pronounced change with temperature. This phenomenon indicates that under high-pressure and high-shear conditions, the lubricant exhibits strong non-Newtonian fluid characteristics, where low-shear Newtonian viscosity is no longer the dominant factor determining the EHL friction.
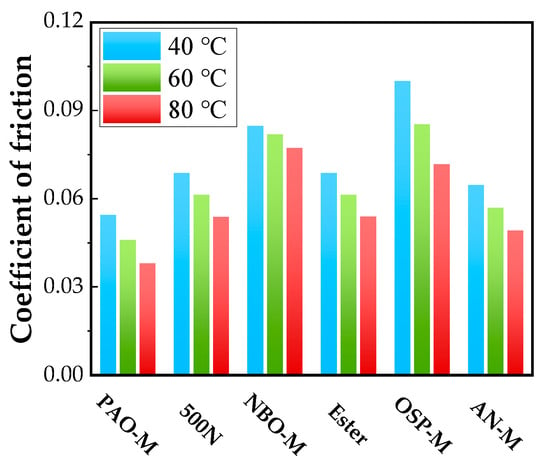
Figure 7.
The influence of temperature on the coefficient of friction of the six base oils at the entrainment velocity of 0.5 m/s (mainly in the EHL regime).
Additionally, the transition entrainment speed of the base oils from mixed lubrication to EHL increases with the increase in experimental temperature, as shown by the star marker in Figure 6. This is attributed to the fact that the decrease in base oil viscosity caused by the increase in temperature weakens the (elasto-)hydrodynamic effect, thus requiring a higher entrainment speed to form a continuous oil film to completely separate the two interacting surfaces and enter the EHL (full-film) regime.
3.3. Comparison of Traction Curves for Different Types of Base Oils
The comparative analysis of the Stribeck curves of the base oils in Section 3.2 indicates that, even under conditions where the viscosities at 40 °C are almost the same, the six types of base oils give different EHL friction coefficients. This difference can potentially be attributed to two reasons. Firstly, the differences in the chemical composition of the base oils lead to varying pressure-viscosity characteristics, which in turn result in different viscosity responses and frictional behaviors in the high-pressure EHL contact zone. Secondly, and more importantly, the high shear stresses within the EHL contact zone induce the base oils to undergo non-Newtonian shear thinning, may exhibit limiting shear stress, and experience thermal effects. This leads to significant differences in the equivalent high-shear viscosities of different base oils within the contact zone and consequently different local shear forces and thus EHL friction coefficients. To investigate the differences in the EHL friction among different types of base oils, this section systematically measures the traction curves of the base oils under varying contact pressures, entrainment velocities, and temperatures. This can be used to analyze the frictional characteristics of different types of base oils under high-pressure and high-shear conditions.
Figure 8a–f present the traction curves measured for the six types of base oils under mean contact pressures of 1.2 GPa, 1.4 GPa, and 1.7 GPa. The measurements were conducted at a temperature of 40 °C, an entrainment velocity of ue = 0.9 m/s, and an SRR range of 0–50%. It can be seen from the figures that the traction curves measured for the six base oils under different contact pressures all show the same trend. At lower SRRs, the friction coefficient increases approximately linearly and rapidly with increasing SRR and then remains roughly constant (with a slower rate of change) in the high SRR region. Moreover, the friction coefficients of the six base oils all increase to varying degrees as the contact pressure increases. Differences in the pressure-viscosity coefficients of the base oils cause their viscosities to increase to different extents with rising contact pressure [27], and oils with different molecular structures exhibit varying limiting shear stresses under high pressure (see detailed analysis in the next section). The combined effect of these factors leads to varying degrees of increase in the EHL friction coefficients. Specifically, under a contact pressure of 1.7 GPa, as the SRR increases, the friction coefficient of the mineral oil 500N reaches a maximum and then shows a decreasing trend, indicating the transition into the thermal region. This is attributed to the fact that shear heating effects in the oil film within the contact zone cause a decrease in both the equivalent viscosity and limiting shear stress of the lubricant [13]. Consequently, the area within the contact zone that reaches the LSS diminishes, leading to a reduction in the friction coefficient.
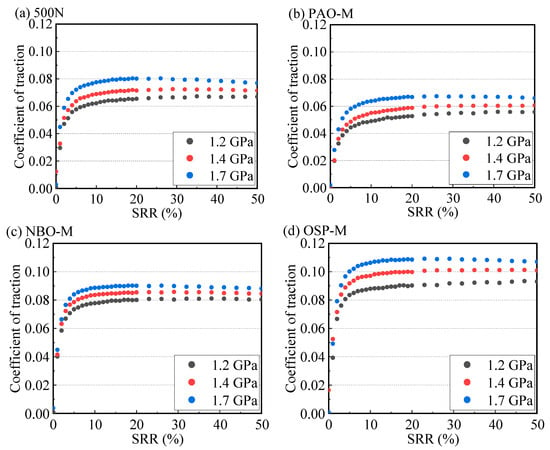
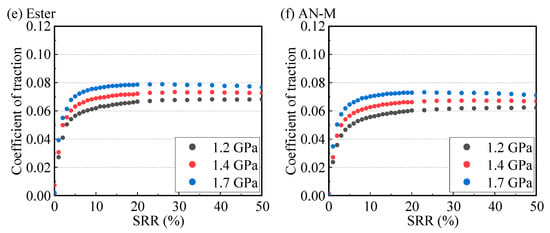
Figure 8.
Traction curves of the six base oils measured under the conditions of a temperature of 40 °C, an entrainment speed of 0.9 m/s, and contact pressures of 1.2 GPa, 1.4 GPa, and 1.7 GPa; (a) 500N, (b) PAO-M, (c) NBO-M, (d) OSP-M, (e) Ester, (f) AN-M.
Figure 9a–f provide further insight into the effect of temperature on the friction coefficients of the six types of base oils. The experiments were carried out under conditions of a contact pressure of pm = 1.4 GPa, an entrainment speed is ue = 0.9 m/s, and an SRR range of 0–50%. As can be seen from the figures, as the temperature increases from 40 °C to 80 °C, the friction coefficients of the six base oils within the high SRR region all decrease. This trend indicates that the lubrication state within the contact remains in the EHL regime as the temperature increases. Conversely, if the lubrication state enters the mixed lubrication regime, an increase in the friction coefficient would be shown due to the occurrence of more asperity contacts [28].
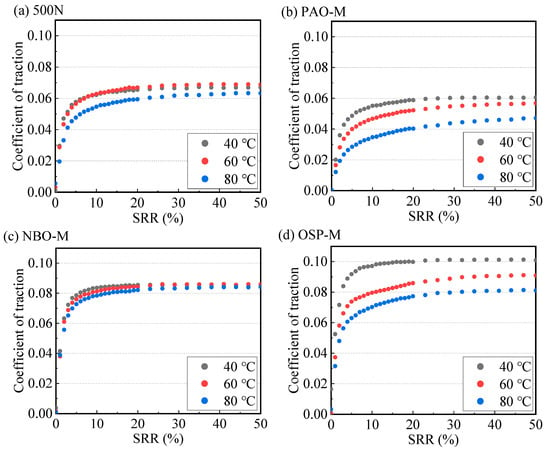
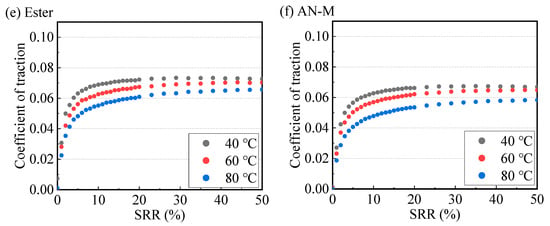
Figure 9.
The influence of temperature on the traction curves of the six base oils used at a contact pressure of 1.4 GPa and an entrainment speed of 0.9 m/s; (a) 500N, (b) PAO-M, (c) NBO-M, (d) OSP-M, (e) Ester, and (f) AN-M.
Nevertheless, when the temperature increases to 80 °C, the decrease in base oil viscosity may weaken the (elasto-)hydrodynamic effect of the base oil. This results in a decrease in the formed oil film thickness, subsequently leading to a transition into the mixed lubrication state and causing the friction coefficient in a traction curve to exhibit a slight increasing trend as the SRR increases [13]. This typical phenomenon is shown by the traction curves of 500N in Figure 9a and AN-M in Figure 9f, measured at 80 °C, where the friction coefficient continues to increase slowly as the SRR increases.
Combining Figure 8a–f and Figure 9a–f, it can be seen that the measured traction curves of different base oils display different trends under various pressure and temperature conditions. As the SRR increases, the friction coefficient shows trends of continuous increase, then relative stability, and finally gradual decrease. High contact pressure and high shear within the EHL contact induce the non-Newtonian effects that cause the base oil to undergo shear thinning and even reach its LSS. This results in a reduction in its equivalent non-Newtonian viscosity. Concurrently, the thermal effects caused by shear heating within the oil film in the contact also lead to a decrease in the base oil viscosity. The decrease in base oil viscosity, on one hand, can weaken its (elasto-)hydrodynamic effect, reduce the oil film thickness, and lead to the transition into the mixed lubrication state, thereby causing the friction coefficient to increase as the SRR increases. On the other hand, if the lubrication state remains in the EHL regime, it will reduce the shear stress within the oil film, thereby causing the friction coefficient to reach a maximum as the SRR increases and then gradually decrease due to thermal thinning effects. The value where the base oil friction coefficient remains basically constant after reaching the maximum as the SRR increases can be used to calculate the LSS [13], thereby avoiding the influence of EHL thermal effects and the occurrence of mixed lubrication. Based on the measured LSS, the influences of base oil type, temperature, and contact pressure on the EHL friction coefficient can be quantitatively described, which will be detailed in the next section.
3.4. Comparative Analysis of Traction Curves Based on Limiting Shear Stress
This section, based on LSS measurements, quantitatively compares the EHL friction coefficients of the six types of base oils under different temperatures and contact pressures. The traction curves measured for the base oils under different temperatures, contact pressures, and entrainment speeds are provided in Appendix A, and interested readers can refer to Figure A1, Figure A2, Figure A3, Figure A4, Figure A5, Figure A6, Figure A7, Figure A8, Figure A9, Figure A10, Figure A11, Figure A12, Figure A13, Figure A14, Figure A15, Figure A16, Figure A17 and Figure A18. The calculation method for the LSS is as described in Section 2.3. At an experimental temperature of 40 °C, the critical entrainment speeds and the maximum friction coefficients selected for calculating the LSS and the calculated LSS of the six base oils under various contact pressures are summarized in Table 3. It is worth noting that the critical entrainment speeds, corresponding to the traction curves where the base oil friction coefficient reaches the “plateau region”, may vary under different contact pressures. From Table 3, it can be seen that as the contact pressure increases, the critical entrainment speeds used to calculate the LSS for different types of base oils all decrease slightly. This could be attributed to the increased viscosity of the base oil at the inlet, resulting in a decrease in the corresponding entrainment speed entering the EHL regime. However, this explanation conflicts with the classical Hamrock-Dowson film thickness formula. Nevertheless, this unknown reason would not affect the accuracy of the measured LSS for different lubricants.

Table 3.
The entrainment speed ue and maximum coefficient of friction fmax used for calculating the LSS of the six types of base oil under different contact pressures at a temperature of 40 °C.
Equation (4) is used to linearly fit the limiting shear stress and the mean contact pressure of different types of base oils shown in Table 3:
where is the measured mean LSS, λ the LSS coefficient, the mean contact pressure, and the fitting constant. Taking the mineral oil 500N in Table 3 as an example, the fitting results are shown in Figure 10 and Equation (5), where λ = 0.11593 ± 0.00289 and = 0.0553 ± 0.00422 (GPa), with a coefficient of determination, R2 = 0.997. The units in the formula are in GPa.
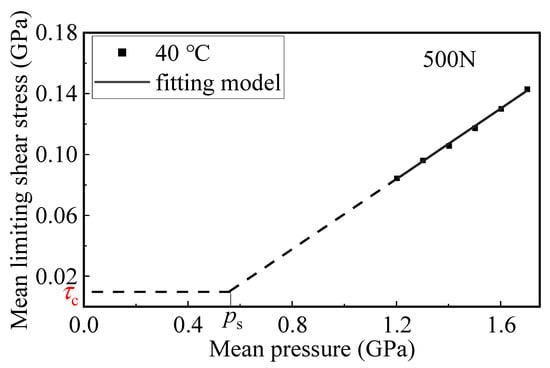
Figure 10.
Variation in the mean LSS with the mean contact pressure for 500N at a temperature of 40 °C. (τc: critical shear stress, : critical pressure).
It can be seen from Figure 10 that there is a negative intercept with the y-axis (−0.0553 GPa) for the 500N in the LSS-pressure fitting curve. A similar trend has been reported by Poll et al. [29], Ndiaye et al. [19], Ma et al. [13] for other kinds of base oils, being different from the positive intercept with the y-axis by Johnson et al. [20] in the 1970s. The negative intercept may be physically sound because a certain pressure is needed for the shear stress of the fluid to enter the limiting shear state. This means under low-pressure and low-shear conditions, the lubricating oil may still behave as a Newtonian fluid or be in the shear-thinning stage. In response to the possible negative limiting shear stress in Equation (5), Poll et al. [29] proposed using the critical shear stress τc to characterize the shear stress threshold under low-pressure and low-shear conditions. The critical shear stress τc represents the critical shear stress at which the lubricant transitions from a Newtonian fluid to a non-Newtonian shear thinning [14].
Based on Table 3, the mean contact pressure and the LSS for the other five base oils can be fitted using Equation (4) according to the above method, and the results are shown in Figure 11a. The fitting results at temperatures of 60 °C and 80 °C are shown in Figure 11b and Figure 11c, respectively. The corresponding data are provided in Appendix B, and interested readers can refer to Table A1 and Table A2.
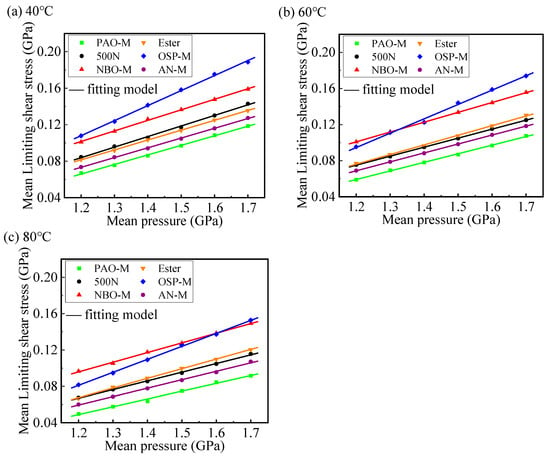
Figure 11.
Variation in the mean LSS with the mean contact pressure of the six base oils at different temperatures and pressures (a) 40 °C, (b) 60 °C and (c) 80 °C, respectively.
From Figure 11a–c, it can be seen that the LSS of the six base oils is linearly related to the mean contact pressure at different temperatures, and the fitting results are in good agreement with the measured results. At a temperature of 40 °C, the order of LSS for the six base oils within the experimental contact pressure range is OSP-M > NBO-M > 500N > Ester > AN-M > PAO-M. However, as the experimental temperature rises to 80 °C, the NBO-M gives a larger EHL friction coefficient than the OSP-M at a contact pressure of 1.4 GPa, which is basically consistent with the EHL friction coefficient results at a contact pressure of 1.4 GPa in Figure 7. Note that the EHL friction coefficient in Figure 7 may be the result of the lubricant undergoing both non-Newtonian shear thinning and thermal thinning. Therefore, the limiting shear stress, as a strictly measured characteristic high-pressure rheological parameter, can more accurately and quantitatively analyze the EHL friction for different types of base oils under conditions that exclude effects such as shear heating. In addition, the fitting model of LSS and contact pressure based on Equation (4) can be used to predict the EHL friction coefficients of lubricants over a larger range of contact pressure.
Figure 12a–f compare the measured and fitted results of the LSS for the six base oils at different temperatures. It can be seen that the LSS of the base oils exhibits a linear relation with the mean contact pressure at different temperatures, and the slopes of the fitted curves at different temperatures remain basically consistent. The limiting shear stress of the six base oils used in the experiment all showed a linear relationship with contact pressure, and the slopes of the fitted curves at different temperatures remained basically consistent. This means that their limiting shear stress coefficient λ essentially did not change, indicating that is minimally affected by temperature. Pressure primarily drives the increase in through the limiting shear stress coefficient , while temperature independently regulates the overall shear response level (mainly manifested as affecting the intercept ), rather than coupling with pressure to interfere jointly. This independence was verified across all six base oils involved in the experiment.
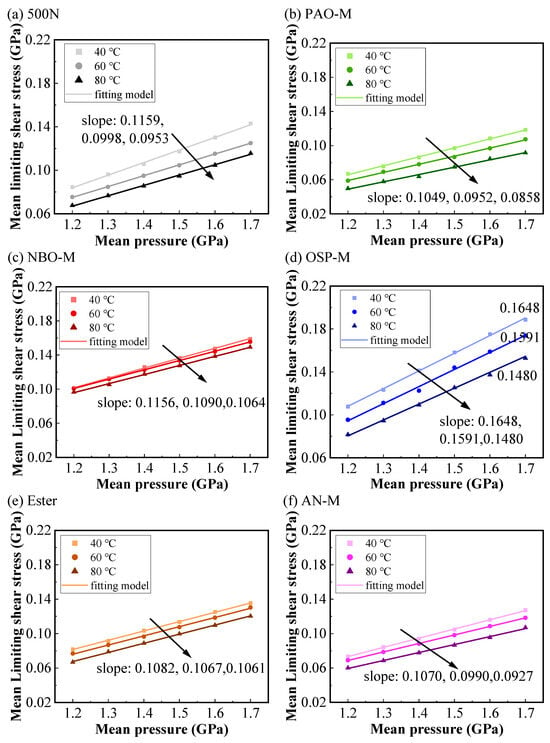
Figure 12.
Influence of temperature on the variation in the mean LSS with the mean contact pressure for the six base oils: (a) 500N, (b) PAO-M, (c) NBO-M, (d) OSP-M, (e) Ester, and (f) AN-M.
The results in Figure 12 indicate that the effects of contact pressure and temperature on the LSS of base oils are relatively independent, which is consistent with the results reported by Ndiaye et al. [19] based on measurements of two reference fluids. According to this pattern, quantitative representation and prediction of the LSS of lubricants over different temperature ranges can be achieved. For example, in engineering applications, by measuring the limiting shear stress coefficient () at room temperature and combining it with a temperature correction function, one can estimate friction performance in high-temperature or low-temperature environments, thereby optimizing the design of lubricants in components such as gears and bearings to reduce energy losses. At the same time, it provides a certain direction for the formulation or selection of lubricating oils in low-friction applications. Specifically, by leveraging the temperature independence of , engineers can prioritize selecting base oils with lower values as the foundation (where the LSS changes minimally with pressure), and add specific additives (such as viscosity index improvers and other polymers) targeted at the temperature-sensitive , thereby designing formulations that can maintain low shear stress in variable-temperature environments, significantly reducing frictional power consumption.
4. Conclusions
The Stribeck curves of six types of base oils under different temperatures have been compared regarding the friction coefficients under mixed and EHL regimes. In addition, the traction curves of the six types of base oils under different load and entrainment speed conditions have also been measured and compared. Based on the high-pressure rheological parameter of LSS, a quantitative comparison of the EHL friction of lubricants under high-pressure and high-shear conditions was proposed. The main conclusions are as follows:
- (a)
- At an experimental temperature of 40 °C, the six types of base oils with basically consistent viscosities exhibit different friction coefficients in both low-speed mixed lubrication and high-speed EHL regimes. In addition to viscosity, differences in the chemical structure, composition, and polarity of the base oils lead to variations in their adsorption at the contact interface, high-pressure rheological properties, and film-forming characteristics, thereby resulting in different mixed/EHL friction coefficients.
- (b)
- Influenced by the combination of non-Newtonian effects and thermal effects caused by high pressure and high shear in EHL contacts, the EHL friction coefficients of different types of base oils show a rapid linear increase, then remain basically constant, and finally gradually decrease with the increase in SRR. The LSS can quantitatively analyze the influences of base oil type, temperature, and contact pressure on the EHL friction in highly loaded rolling/sliding contacts, avoiding the influence of thermal effects and non-Newtonian shear thinning on viscosity changes. At a temperature of 40 °C, the LSS order for the six base oils within the experimental contact pressure range is OSP-M > NBO-M > 500N > Ester > AN-M > PAO-M. However, as the experimental temperature rises to 80 °C, the NBO-M gives a larger EHL friction coefficient than the OSP-M at contact pressures smaller than 1.6 GPa. This is attributed to the difference in the LSS coefficients of base oils.
- (c)
- Under the experimental temperatures of 40 °C, 60 °C, and 80 °C, the LSS of the six types of base oils are all linearly related to the mean contact pressure. In addition, as the temperature rises, the LSS decreases, and the temperature does not affect the LSS coefficient, i.e., the fitting slope between LSS and pressure, for a specific base oil. The effects of contact pressure and temperature on the LSS are relatively independent of each other. Moreover, if the fitting curves of the LSS-mean contact pressure at different temperatures are known, the LSS of the base oil at other temperatures can be obtained by interpolation of the known data. This method contributes to providing a rheological fluid model for the quantitative friction prediction in highly loaded lubricated rolling/sliding contacts.
This study can contribute to the understanding of the high-pressure rheology of lubricants and provide a quantitative way to quantify the friction reduction performance of base oils for bearing and gear applications. It should be noted that this study only explores the friction characteristics of different types of base oils (without additives). To enhance the practicality and universality of the research, extending this method to lubricating oils containing polymer additives or more complex tribological systems in future work is equally important.
Author Contributions
Conceptualization, F.G., H.L. and X.G.; writing—original draft preparation, X.G.; writing—review and editing, Y.Z., H.L., B.Z. and X.G.; validation, X.G., B.Z. and H.L.; data curation, X.G.; methodology, X.G., H.L. and F.G.; funding acquisition, W.L. and X.W.; resources, W.L. and X.W. supervision, Y.Z., W.L., H.L. and F.G.; project administration, H.L.; investigation, X.G.; formal analysis, X.G. All authors have read and agreed to the published version of the manuscript.
Funding
This research was funded by the Strategic Priority Research Program of the Chinese Academy of Sciences (XDC0180401); the Chief Scientist Project of Gansu Province (23ZDKA012); the National Natural Science Foundation of China (52305227); the Joint Research Fund of Disciplines of LICP-CAS (LHJJ-20240102); and the Major Scientific and Technological Innovation Project of Shandong Province (2022CXGC020309).
Data Availability Statement
Available upon enquiry. The data are not publicly available due to privacy concerns.
Conflicts of Interest
Author Binbin Zhang was employed by the company Schaeffler Trading (Shanghai) Co., Ltd. The remaining authors declare that the research was conducted in the absence of any commercial or financial relationships that could be construed as a potential conflict of interest.
Abbreviations
The following abbreviations are used in this manuscript:
| EHL | Elastohydrodynamic lubrication |
| LSS | Limiting shear stress |
| SRR | Slide-to-roll ratio |
Appendix A
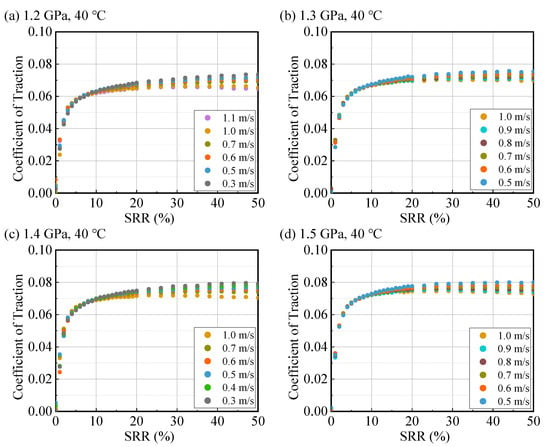
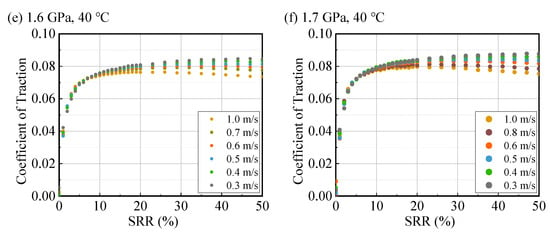
Figure A1.
Traction curves for 500N at 40 °C under different pressures and speeds.
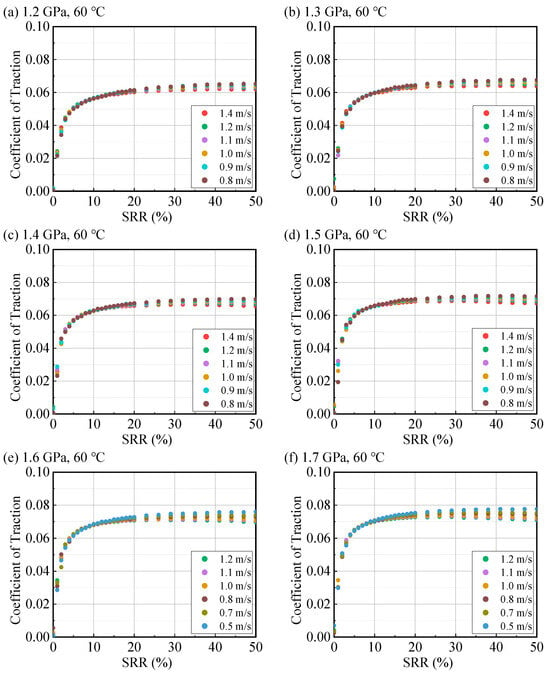
Figure A2.
Traction curves for 500N at 60 °C under different pressures and speeds.
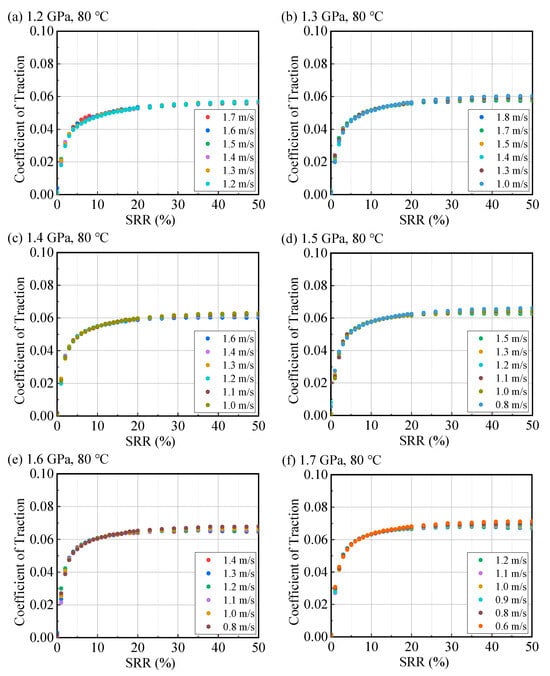
Figure A3.
Traction curves for 500N at 80 °C under different pressures and speeds.
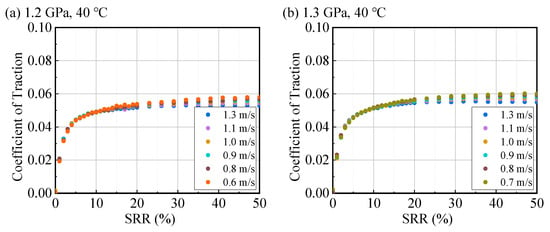
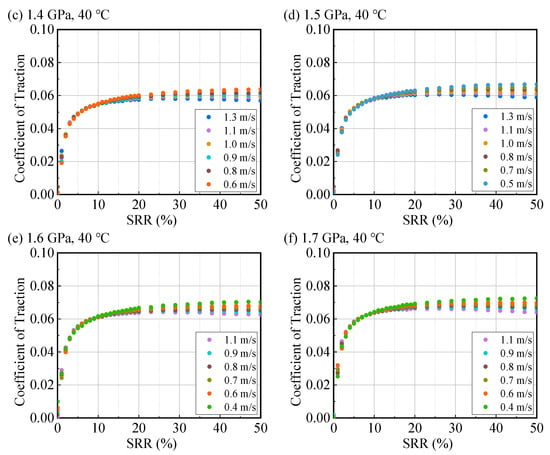
Figure A4.
Traction curves for PAO-M at 40 °C under different pressures and speeds.
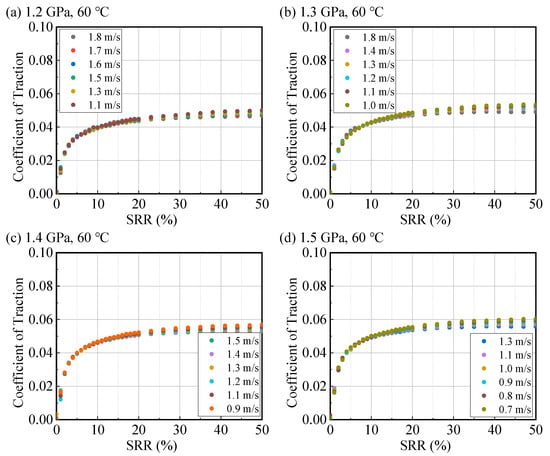
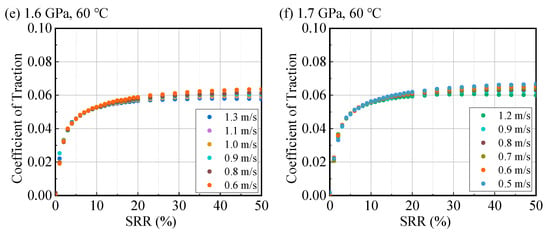
Figure A5.
Traction curves for PAO-M at 60 °C under different pressures and speeds.
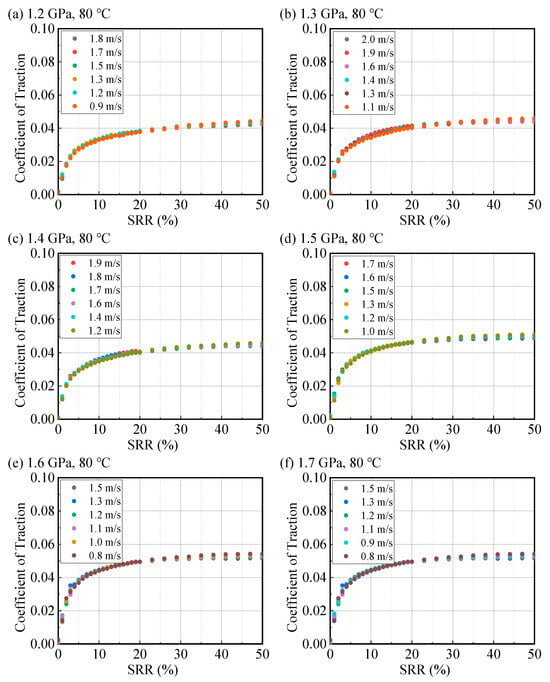
Figure A6.
Traction curves for PAO-M at 80 °C under different pressures and speeds.
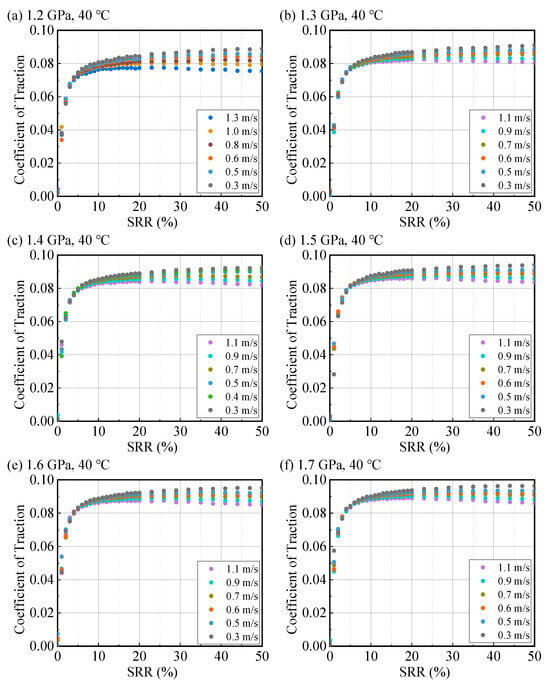
Figure A7.
Traction curves for NBO-M at 40 °C under different pressures and speeds.
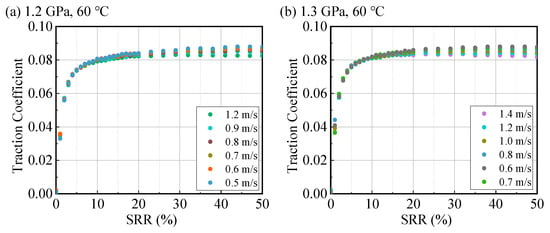
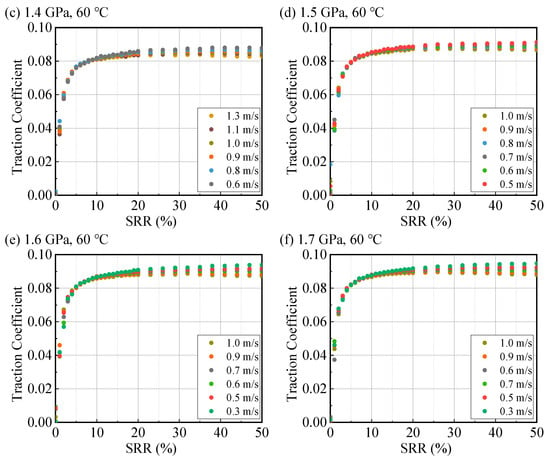
Figure A8.
Traction curves for NBO-M at 60 °C under different pressures and speeds.
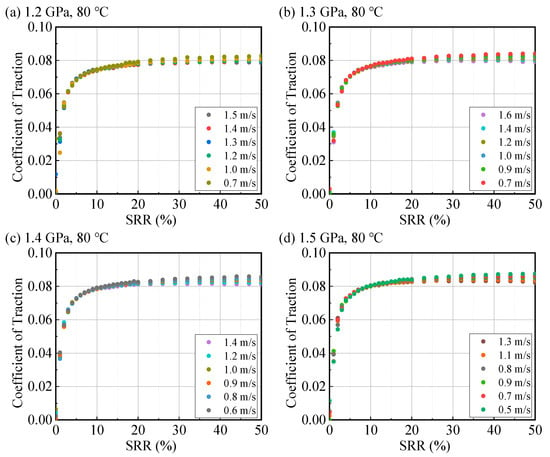
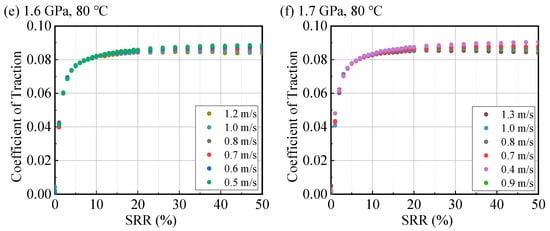
Figure A9.
Traction curves for NBO-M at 80 °C under different pressures and speeds.
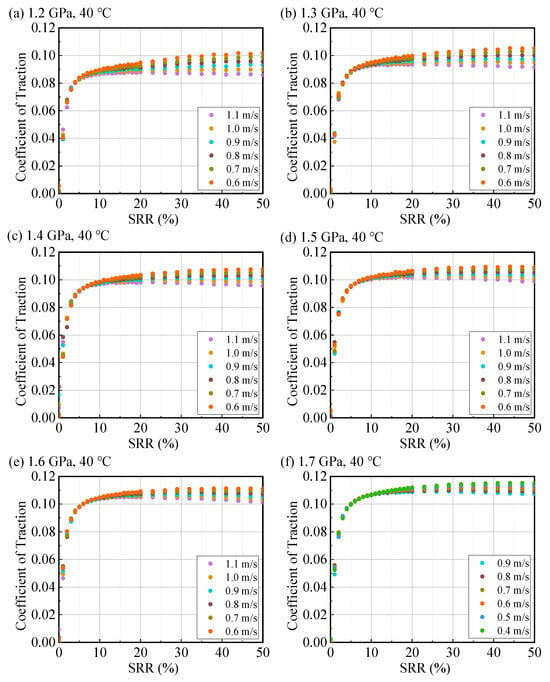
Figure A10.
Traction curves for OSP-M at 40 °C under different pressures and speeds.
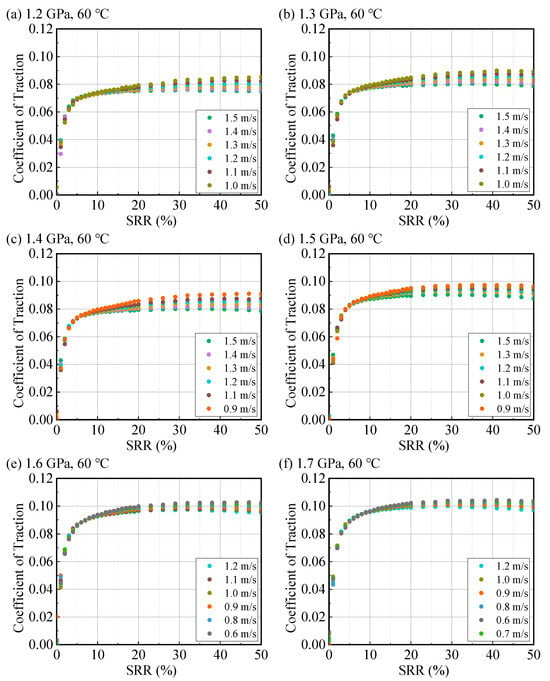
Figure A11.
Traction curves for OSP-M at 60 °C under different pressures and speeds.
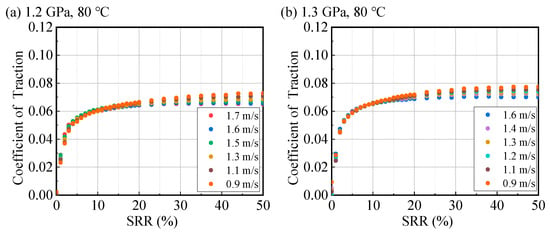
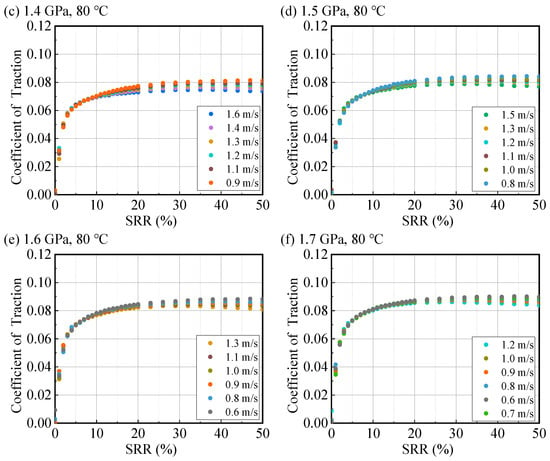
Figure A12.
Traction curves for OSP-M at 80 °C under different pressures and speeds.
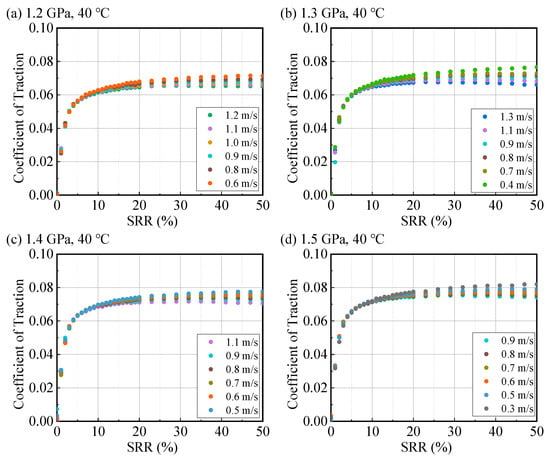
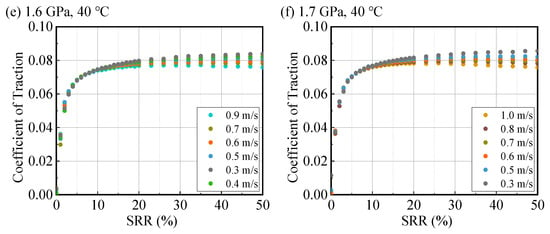
Figure A13.
Traction curves for Ester at 40 °C under different pressures and speeds.
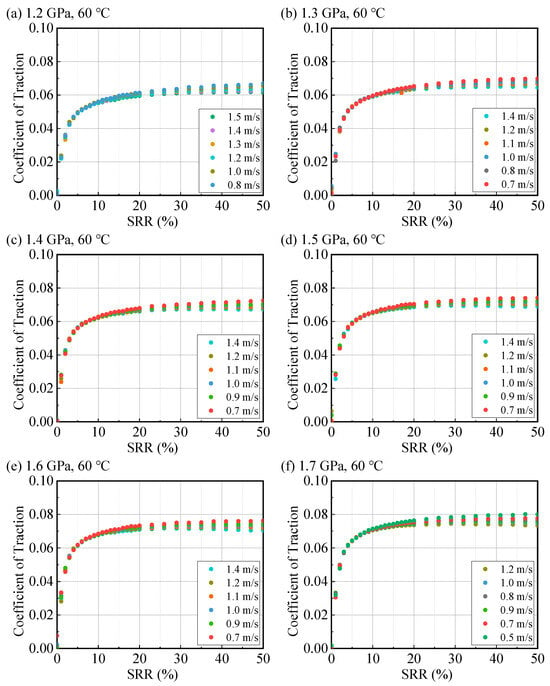
Figure A14.
Traction curves for Ester at 60 °C under different pressures and speeds.
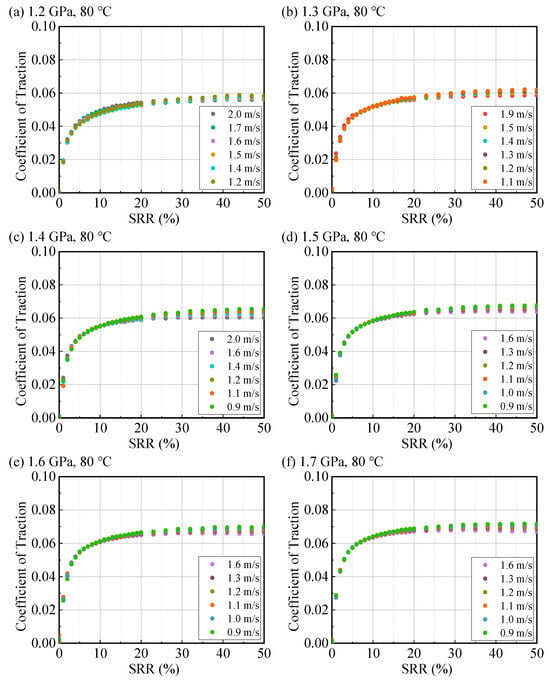
Figure A15.
Traction curves for Ester at 80 °C under different pressures and speeds.
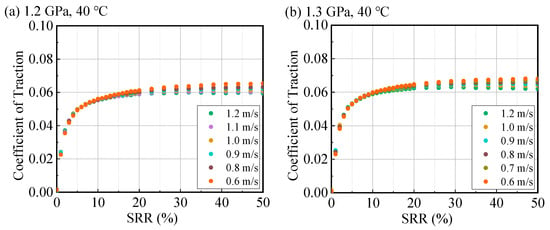
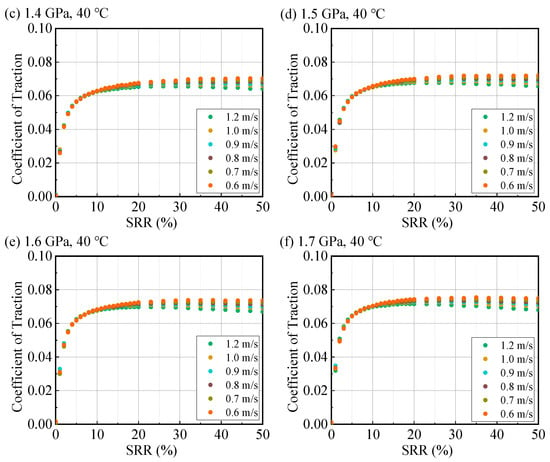
Figure A16.
Traction curves for AN-M at 40 °C under different pressures and speeds.
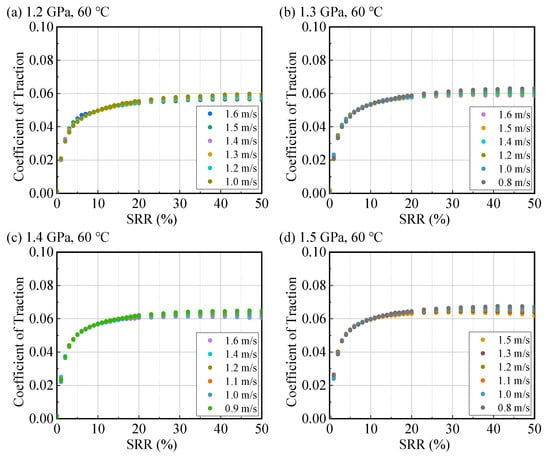
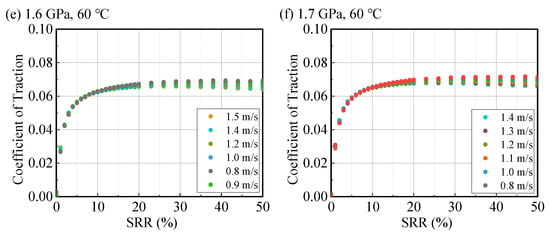
Figure A17.
Traction curves for AN-M at 60 °C under different pressures and speeds.
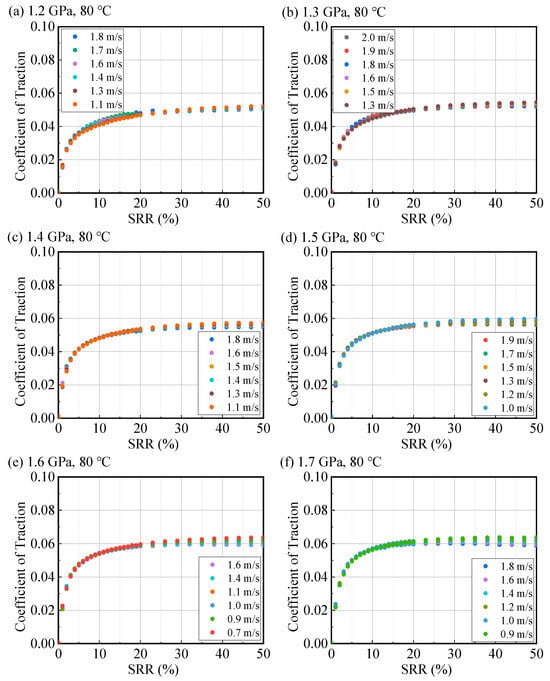
Figure A18.
Traction curves for AN-M at 80 °C under different pressures and speeds.
Appendix B

Table A1.
The entrainment speed ue and maximum coefficient of friction fmax used for calculating the LSS of the six types of base oil under different contact pressures at a temperature of 60 °C.
Table A1.
The entrainment speed ue and maximum coefficient of friction fmax used for calculating the LSS of the six types of base oil under different contact pressures at a temperature of 60 °C.
| /GPa | 500N | PAO-M | NBO-M | ||||||
| ue, m/s | fmax | LSS, GPa | ue, m/s | fmax | LSS, GPa | ue, m/s | fmax | LSS, GPa | |
| 1.2 | 1.2 | 0.0628 | 0.07536 | 0.9 | 0.0831 | 0.1008 | |||
| 1.3 | 1.2 | 0.0651 | 0.08463 | 0.1 | 0.0533 | 0.06929 | 0.8 | 0.086 | 0.1118 |
| 1.4 | 1.1 | 0.0678 | 0.09492 | 0.1 | 0.0558 | 0.07812 | 0.7 | 0.0876 | 0.12264 |
| 1.5 | 1.1 | 0.0697 | 0.1045 | 0.1 | 0.0578 | 0.0867 | 0.7 | 0.0890 | 0.1335 |
| 1.6 | 1.0 | 0.0720 | 0.1152 | 0.9 | 0.0605 | 0.0968 | 0.7 | 0.0901 | 0.14416 |
| 1.7 | 1.0 | 0.0735 | 0.1250 | 0.8 | 0.0632 | 0.10744 | 0.6 | 0.0915 | 0.1556 |
| /GPa | Ester | OSP-M | AN-M | ||||||
| ue, m/s | fmax | LSS, GPa | ue, m/s | fmax | LSS, GPa | ue, m/s | fmax | LSS, GPa | |
| 1.2 | 1.1 | 0.0641 | 0.07692 | 1.2 | 0.0798 | 0.0954 | 1.3 | 0.0575 | 0.0690 |
| 1.3 | 1.1 | 0.0668 | 0.08684 | 1.2 | 0.0855 | 0.1111 | 1.3 | 0.0605 | 0.0786 |
| 1.4 | 1.1 | 0.0689 | 0.09646 | 1.2 | 0.0875 | 0.1225 | 1.2 | 0.0630 | 0.0882 |
| 1.5 | 1.0 | 0.0717 | 0.10755 | 1.1 | 0.096 | 0.1440 | 1.1 | 0.0655 | 0.0982 |
| 1.6 | 0.9 | 0.0741 | 0.11856 | 0.9 | 0.0988 | 0.1580 | 1.0 | 0.0679 | 0.1086 |
| 1.7 | 0.8 | 0.0767 | 0.13039 | 0.8 | 0.1023 | 0.1739 | 1.0 | 0.0696 | 0.1183 |

Table A2.
The entrainment speed ue and maximum coefficient of friction fmax used for calculating the LSS of the six types of base oil under different contact pressures at a temperature of 80 °C.
Table A2.
The entrainment speed ue and maximum coefficient of friction fmax used for calculating the LSS of the six types of base oil under different contact pressures at a temperature of 80 °C.
| /GPa | 500N | PAO-M | NBO-M | ||||||
| ue, m/s | fmax | LSS, GPa | ue, m/s | fmax | LSS, GPa | ue, m/s | fmax | LSS, GPa | |
| 1.2 | 1.0 | 0.0805 | 0.0966 | ||||||
| 1.3 | 1.4 | 0.0589 | 0.0765 | 1.2 | 0.0445 | 0.0578 | 1.0 | 0.0821 | 0.1053 |
| 1.4 | 1.4 | 0.0611 | 0.0855 | 1.2 | 0.0455 | 0.0637 | 0.9 | 0.0840 | 0.1176 |
| 1.5 | 1.3 | 0.0632 | 0.0947 | 1.2 | 0.050 | 0.075 | 0.9 | 0.0850 | 0.1275 |
| 1.6 | 1.2 | 0.0654 | 0.1046 | 1.1 | 0.0528 | 0.0845 | 0.8 | 0.0865 | 0.1384 |
| 1.7 | 1.2 | 0.0680 | 0.1156 | 1.0 | 0.0539 | 0.0926 | 0.7 | 0.0878 | 0.1493 |
| /GPa | Ester | OSP-M | AN-M | ||||||
| ue, m/s | fmax | LSS, GPa | ue, m/s | fmax | LSS, GPa | ue, m/s | fmax | LSS, GPa | |
| 1.2 | 0.0789 | 1.3 | 0.0680 | 0.0816 | 1.8 | 0.0501 | 0.0601 | ||
| 1.3 | 1.4 | 0.0607 | 0.0789 | 1.3 | 0.0728 | 0.09464 | 1.8 | 0.0528 | 0.0686 |
| 1.4 | 1.3 | 0.0635 | 0.0889 | 1.2 | 0.0780 | 0.1092 | 1.7 | 0.0555 | 0.0777 |
| 1.5 | 1.1 | 0.0665 | 0.0997 | 1.1 | 0.0815 | 0.1223 | 1.6 | 0.0578 | 0.0867 |
| 1.6 | 1.1 | 0.0686 | 0.1097 | 0.9 | 0.0858 | 0.1373 | 1.6 | 0.0597 | 0.0955 |
| 1.7 | 1.0 | 0.0708 | 0.1203 | 0.9 | 0.0899 | 0.1520 | 1.5 | 0.0630 | 0.1071 |

Table A3.
The fitting parameters ( and ) for different types of base oils under various temperature conditions.
Table A3.
The fitting parameters ( and ) for different types of base oils under various temperature conditions.
| Temperature | 40 °C | 60 °C | 80 °C | ||||||
|---|---|---|---|---|---|---|---|---|---|
| λ | (GPa) | R2 | λ | (GPa) | R2 | λ | R2 | ||
| 500N | 0.11593 ±0.00289 | 0.0553 ±0.00422 | 0.997 | 0.09980 ±0.000832 | 0.0447 ±0.00121 | 0.999 | 0.09532 ±0.00188 | 0.0474 ±0.00274 | 0.998 |
| PAO-M | 0.10487 ±0.00199 | 0.0599 ±0.00289 | 0.998 | 0.0952 ±0.00172 | 0.0551 ±0.00251 | 0.998 | 0.0858 ±0.00343 | 0.0540 ±0.00500 | 0.993 |
| NBO-M | 0.1156 ±0.00183 | 0.0371 ±0.00266 | 0.998 | 0.10905 ±0.000426 | 0.0300 ±0.000622 | 0.999 | 0.10643 ±0.00182 | 0.0318 ±0.00265 | 0.998 |
| Ester | 0.10822 ±0.00118 | 0.0483 ±0.00171 | 0.999 | 0.10674 ±0.00203 | 0.0519 ±0.00296 | 0.998 | 0.10606 ±0.00141 | 0.0597 ±0.00141 | 0.999 |
| OSP-M | 0.16476 ±0.00302 | 0.0897 ±0.00404 | 0.998 | 0.15914 ±0.00528 | 0.0964 ±0.00771 | 0.995 | 0.14803 ±0.00301 | 0.0971 ±0.00439 | 0.998 |
| AN-M | 0.10696 ±0.00139 | 0.05508 ±0.0020 | 0.999 | 0.09903 ±0.000669 | 0.05008 ±0.00097 | 0.999 | 0.09273 ±0.00226 | 0.05182 ±0.00329 | 0.997 |
References
- Holmberg, K.; Andersson, P.; Erdemir, A. Global energy consumption due to friction in passenger cars. Tribol. Int. 2012, 47, 221–234. [Google Scholar] [CrossRef]
- Liu, W.; Xu, J.; Feng, D.; Wang, X. The Research status and prospect of synthetic lubricating Oils. Tribology 2013, 33, 91–104. [Google Scholar]
- Shah, R.; Das, M.; Kabir, M.H.; Liang, H.; Salvi, L.; Bunting, T.L. Additive and base oil trends in electric vehicle applications. J. Tribol. 2025, 147, 051106. [Google Scholar] [CrossRef]
- Zou, S.; Xie, G.; Yang, R.; Hou, J.; Sun, F. Rehabilitation robot joint performance evaluation of a zero-spin traction drive with non-Newtonian fluid considered. Adv. Mech. Eng. 2024, 16, 16878132241266751. [Google Scholar]
- Bair, S.; Habchi, W. EHL Traction Coefficient Is Not a Property of the Liquid Alone. J. Tribol. 2025, 1–12. [Google Scholar] [CrossRef]
- Tsubouchi, T.; Hata, H.; Yoshida, Y. Optimisation of molecular structure for traction fluids. Lubr. Sci. 2004, 16, 393–403. [Google Scholar] [CrossRef]
- Rounds, F. Effects of Lubricant Composition on Friction as Measured with Thrust Ball Bearings. J. Chem. Eng. Data 1960, 5, 499–507. [Google Scholar] [CrossRef]
- Hammann, W.; Schisla, R.; Groenweghe, L.; Gash, V. Synthetic fluids for high capacity traction drives. ASLE Trans. 1970, 13, 105–116. [Google Scholar] [CrossRef]
- Wang, Y.; Qiu, Q.; Zhang, P.; Gao, X.; Zhang, Z.; Huang, P. Correlation between lubricating oil characteristic parameters and friction characteristics. Coatings 2023, 13, 881. [Google Scholar] [CrossRef]
- Zhang, J.; Tan, A.; Spikes, H. Effect of base oil structure on elastohydrodynamic friction. Tribol. Lett. 2017, 65, 13. [Google Scholar] [CrossRef]
- Hamrock, B.J.; Dowson, D. Isothermal elastohydrodynamic lubrication of point contacts: Part 1—Theoretical formulation. J. Lubr. Tech. 1976, 98, 223–228. [Google Scholar] [CrossRef]
- Martinie, L.; Vergne, P. Lubrication at extreme conditions: A discussion about the limiting shear stress concept. Tribol. Lett. 2016, 63, 21. [Google Scholar] [CrossRef]
- Ma, Z.; Zhao, Y.; Han, Y.; Lou, W.; Li, S.; Wang, X.; Guo, F.; Liu, H. Approach to Determine the Limiting Shear Stress of Lubricants at High Pressures Based on Traction Mapping. Lubricants 2024, 12, 128. [Google Scholar] [CrossRef]
- Bair, S.S. High Pressure Rheology for Quantitative Elastohydrodynamics; Elsevier: Amsterdam, The Netherlands, 2019. [Google Scholar]
- Smith, F. Lubricant behavior in concentrated contact—Some rheological problems. ASLE Trans. 1960, 3, 18–25. [Google Scholar] [CrossRef]
- Bair, S. A traction (friction) curve is not a flow curve. Lubricants 2022, 10, 221. [Google Scholar] [CrossRef]
- Liu, H.; Zhang, B.; Bader, N.; Venner, C.; Poll, G. Simplified traction prediction for highly loaded rolling/sliding EHL contacts. Tribol. Int. 2020, 148, 106335. [Google Scholar] [CrossRef]
- Fang, N.; Chang, L.; Webster, M.; Jackson, A. A non-averaging method of determining the rheological properties of traction fluids. Tribol. Int. 2000, 33, 751–760. [Google Scholar] [CrossRef]
- Ndiaye, S.-N.; Martinie, L.; Philippon, D.; Devaux, N.; Vergne, P. A quantitative friction-based approach of the limiting shear stress pressure and temperature dependence. Tribol. Lett. 2017, 65, 149. [Google Scholar] [CrossRef]
- Johnson, K.L.; Tevaarwerk, J. Shear behaviour of elastohydrodynamic oil films. Proc. R. Soc. Lond. A Math. Phys. Sci. 1977, 356, 215–236. [Google Scholar]
- Johnson, K.L. Contact Mechanics; Cambridge University Press: Cambridge, UK, 1987. [Google Scholar]
- Gangopadhyay, A.; Liu, Z.; Simko, S.; Peczonczyk, S.; Cuthbert, J.; Hock, E.; Erdemir, A.; Ramirez, G. Friction and wear reduction mechanism of polyalkylene glycol-based engine oils. Tribol. Trans. 2018, 61, 621–631. [Google Scholar] [CrossRef]
- Hirst, W.; Moore, A. Elastohydrodynamic lubrication at high pressures II. Non-Newtonian behaviour. Proc. R. Soc. Lond. A Math. Phys. Sci. 1979, 365, 537–565. [Google Scholar]
- Hamrock, B.J.; Dowson, D. Isothermal elastohydrodynamic lubrication of point contacts: Part II—Ellipticity parameter results. J. Lubr. Technol. 1976, 98, 375–381. [Google Scholar] [CrossRef]
- Hamrock, B.J.; Dowson, D. Isothermal elastohydrodynamic lubrication of point contacts: Part III—Fully flooded results. J. Lubr. Technol. 1977, 99, 264–275. [Google Scholar] [CrossRef]
- Airey, J.; Spencer, M.; Greenwood, R.; Simmons, M. The effect of gas turbine lubricant base oil molecular structure on friction. Tribol. Int. 2020, 146, 106052. [Google Scholar] [CrossRef]
- Wen, S.; Huang, P. Principle of Tribological; Tsinghua University Press Limited: Beijing, China, 2002. [Google Scholar]
- Liu, H.; Zhang, B.; Bader, N.; Venner, C.H.; Poll, G. Scale and contact geometry effects on friction in thermal EHL: Twin-disc versus ball-on-disc. Tribol. Int. 2021, 154, 106694. [Google Scholar] [CrossRef]
- Poll, G.; Wang, D. Fluid rheology, traction/creep relationships and friction in machine elements with rolling contacts. Proc. Inst. Mech. Eng. Part J J. Eng. Tribol. 2012, 226, 481–500. [Google Scholar] [CrossRef]
Disclaimer/Publisher’s Note: The statements, opinions and data contained in all publications are solely those of the individual author(s) and contributor(s) and not of MDPI and/or the editor(s). MDPI and/or the editor(s) disclaim responsibility for any injury to people or property resulting from any ideas, methods, instructions or products referred to in the content. |
© 2025 by the authors. Licensee MDPI, Basel, Switzerland. This article is an open access article distributed under the terms and conditions of the Creative Commons Attribution (CC BY) license (https://creativecommons.org/licenses/by/4.0/).