Abstract
Loss of lubrication in aeronautic drivetrains can lead to catastrophic gearbox failure, and drivetrains must be tested to prove their resistance to loss of lubrication. Research led to a better understanding of the modes of action, interdependencies, and effective measures to optimize drivetrains for a loss of lubrication event. However, there are currently no calculation methods available, so gear design against loss of lubrication is mainly based on experience. This study proposes a novel calculation method that builds upon the scuffing load calculation from ISO/TS 6336-21 to allow for scuffing safety calculation for cylindrical gears facing loss of lubrication. The proposed method synthesizes existing knowledge in the context of loss of lubrication and incorporates further research results concerning the friction, temperature, and scuffing of gears. The calculation method considers relevant gear design aspects and enables estimation of the time-to-failure. A calculation study is used to compare different measures for cylindrical gears facing loss of lubrication. The results demonstrate the remarkable potential for enhancing loss of lubrication performance through increased oil share in the fluid flow, the application of coatings, the adoption of low-loss gear designs, the use of low-friction lubricants, and the incorporation of additives that increase the scuffing temperature.
Keywords:
loss of lubrication; transmission; gearbox; gears; scuffing; friction; power loss; time-to-failure calculation 1. Introduction
Loss of Lubrication (LOL) in aeronautic drivetrains can be caused by failures in the lubricant supply system [1] or damage to the gearbox [2]. LOL occurs when the designed lubricant supply is no longer present. Insufficient heat removal can cause the temperature to rise [3,4], which can result in lubricant and tribofilm collapse, causing scuffing and surface degradation. Ultimately, the mechanical strength decreases to the point where components are unable to transmit the required load [5], resulting in catastrophic gearbox failure.
Even though remarkable progress has been made in improving the LOL performance, gear design for LOL is still largely based on experience, as there is currently no calculation method available for gears facing LOL.
This work is based on previous findings from Morhard et al. on LOL [6,7,8] and synthesizes them to enable scuffing safety calculations for LOL based on ISO/TS 6336-21 [9]. The proposed calculation method considers the progression of bulk temperature, gear friction, and heat transfer during LOL in order to calculate a scuffing safety factor. This scuffing safety factor can then be used to estimate the time-to-failure during LOL. A calculation study is performed using the developed method to compare and analyze optimization measures for gears facing LOL. The proposed calculation method and results enable gear designers to evaluate various LOL optimization measures at an early design stage, without the need for costly testing.
2. Loss of Lubrication and Scuffing Safety Calculation
When designing a gearbox that potentially faces LOL, various influences must be considered. These can be separated into the operating conditions, such as the load, the speed, and the lubricant temperature, as well as gear design parameters, such as the gear geometry, the surface, the gear material, and the lubricant. Several studies [6,7,8,10,11,12] have found that an increased load results in decreased LOL performance and reduced time-to-failure. Morhard et al. [8] analyzed the influence of speed. They concluded that increasing the circumferential speed up to approx. vt,C = 30 m/s increases the torque loss and risk of scuffing. This is explained by oil centrifugation and the consequently reduced amount of lubricant available for lubrication of the gear flanks. Further increasing the circumferential speed to above approx. vt,C > 40 m/s mitigates or prevents torque loss increase and scuffing. This is explained by reduced contact time and the associated scuffing temperature increase and the oil share in the gearbox fluid flow that improves lubricant film formation and increases heat transfer of the gears to the fluid at high speeds. The LOL performance and time-to-failure can be significantly increased by coatings [5,7,13,14,15], the lubricant, and the additives [13,16], whereas the influence of superfinishing on gears did not show benefits [7,14]. Increased temperature stability of the gear material can improve the LOL performance [7,13,14], but the impact is subordinate. For more detailed insights into the influence of lubricants, coatings, and technical surfaces on the LOL performance, the reader is referred to the literature review on tribology technologies for gears in LOL conditions by Braumann et al. [17]. This comprehensive review reveals that a suitable lubricant, when combined with coatings or superfinishing, can significantly enhance the LOL performance of gears. Yet gear testing is necessary to demonstrate the synergistic effects of the interaction between lubricants, additives, and surfaces.
Isaacson et al. [12] stated that the ability to generate oil mist and the heat transfer properties are crucial for the time-to-failure of a gearbox facing LOL. Hudgins and Schuetz [2] proposed that even small amounts of residual oil in the gearbox can influence LOL behavior. They indicated that the evaporation rate affects the gearbox’s life during LOL. Handschuh and Morales [18] stated that the operation under LOL can be extended when enough oil impinges on the gear surfaces. This oil can originate from windage of residual oil in the gearbox or from lubrication via a misting jet. The source of the oil can be windage of the residual oil in the gearbox or lubrication via a misting jet. Handschuh et al. [19] implemented an air-oil mist system as an emergency lubrication system during LOL. With a flow rate of misted lubricant of 0.167 mL/min, the gears failed after only 6 min. With an increased flow rate of 0.67 mL/min, however, no failure occurred, and the temperature leveled out. Kozachyn et al. [14] stated that minor misting may have increased the time-to-failure of the test gears during LOL.
Scuffing is the primary failure mode during LOL that must be avoided to enable a high time-to-failure. Scuffing occurs at high sliding speeds and loads due to lubricant and tribofilm breakdown, which is caused by high contact temperature [9,20,21]. The tribofilms form through chemical reactions between the lubricant additive system and metal surfaces [22], providing protection of the surfaces. However, exceeding a certain temperature limit can lead to tribofilm breakdown, generation of metal compounds, and welding of the surfaces [23,24]. According to ISO/TS 6336-20/21 [9,25], scuffing may occur when the temperature of the acting tooth flank exceeds a specific limit. A scuffing safety factor, which compares the limit of the tooth flank temperature to the actual temperature, can be derived. A high scuffing safety factor indicates that the acting tooth flank temperature is significantly lower than the limit, and vice versa. The temperature limit can be determined using a scuffing test, such as the FZG scuffing tests [3,26]. The acting tooth flank temperature is understood as a bulk temperature increased by an overtemperature resulting from local load-dependent gear power loss.
In ISO/TS 6336-20 [25], the overtemperature is proposed as a maximum gear contact temperature. This flash temperature is the increase in temperature of the gear tooth surface at a given point along the path of gear contact. In ISO/TS 6336-21 [9], the overtemperature is proposed as the mean value of the gear contact temperature, namely the integral temperature.
Both calculation methods take into account the relevant parameters that influence the scuffing load. These include the operating conditions (e.g., load, speed, and temperature), the gear parameters (e.g., gear geometry, surface, and material), and the lubricant [9,25]. The speed and gear geometry determine the sliding speeds across the tooth flank contact area. High sliding speed results in high frictional power and high temperatures. Increased surface roughness increases gear friction and, consequently, temperature. DLC coatings have shown the potential to drastically increase scuffing safety [27]. Different gear materials and heat treatments also influence scuffing; for example, nitrided steel has a higher scuffing temperature than carbon carburized steel with a high austenite content [25]. Using different oils can significantly increase the scuffing safety [28]. High scuffing loads can be achieved by additives that form sacrificial tribofilms [29]. Several approaches are available to calculate the gear bulk temperature [9,24,25,30,31]. They all determine the bulk temperature by adding a temperature increase dependent on power loss to the oil temperature. Experimental results from Morhard et al. [6,7], Bartilotta et al. [11], Handschuh and Gargano [32], and Handschuh [33] have shown that bulk temperatures increase significantly during LOL.
The underlying load-dependent gear power loss results from the gear coefficient of friction, the load, and the sliding speed. The gear coefficient of friction can be assumed as a constant mean gear coefficient of friction μmZ that can be derived from power loss measurement at gear test rigs [34,35] and is integrated into calculation approaches, e.g., [34]. Experimental results from Alberti and Lemanski [10], Isaacson and Wagner [12], and Morhard et al. [6,7,8] have shown that friction during LOL rises depending on the transmitted power.
The acting gear contact temperatures, and therefore the scuffing safety factor, depend on gear power loss and heat removal. For heat removal from gears, particularly at high speeds, convective heat transfer between the flowing fluid and the gear surface is crucial. The heat transfer coefficient can be derived for gear applications via the Nusselt correlation [36,37,38,39,40], via computational fluid dynamics (CFD) simulations [41,42,43,44], or experimentally [45]. The literature emphasizes the significant dependence of heat transfer from gears on the surrounding atmosphere, whether it is oil, air, or an oil–air mixture. Morhard et al. [8] stated that during LOL, the oil share is influenced by the previous lubrication under design conditions, the gear and housing geometry, and the LOL time.
Literature results have shown that LOL significantly influences gear friction, gear bulk temperature, and heat transfer. Scuffing safety can be assessed under lubricated conditions. However, there are currently no calculation methods available for determining gear bulk temperature and scuffing safety during LOL. Based on the available research results, this study proposes an adapted calculation method based on ISO/TS 6336-21 [9], which enables the calculation of scuffing safety during LOL.
3. Scuffing Safety Calculation
Scuffing under LOL is a complex phenomenon influenced by various variables. This section proposes a calculation method that employs LOL-related factors that can be integrated into the scuffing calculation method according to ISO/TS 6336/21 [9] to derive scuffing safety factors related to time-to-failure during LOL.
The main cause for gear temperature rise and thus scuffing risk is the load-dependent gear power loss PLGP. Acc. to Ohlendorf [46], it can be described by the input power, the mean gear coefficient of friction μmZ, and the geometric tooth power loss factor HV, which represents the influences of the gear geometry. During LOL, μmZ rises dependently of vt,C and the transmitted torque, as shown by Morhard et al. [8]. This friction increase during LOL is considered in Section 3.1.
Beneath the load-dependent gear power loss PLGP, the heat transfer coefficient h influences the gear contact temperature and thus scuffing. For designed lubrication conditions, e.g., dip or injection lubrication, the lubricant reaches the gear teeth and cools the gears. During LOL, only the residual oil–air mixture cools the gears. Here, the heat transfer coefficient h of the gears to the surrounding oil–air mixture is crucial for the temperature development. The heat transfer coefficient h and the impact on the bulk temperature during LOL ϑM,LOL are considered in Section 3.2.
Gear materials and surfaces influence the scuffing load capacity during LOL [7,8,13,14,15]. Coatings can lead to very high scuffing loads [47], and superfinishing can slightly reduce the scuffing load [7]. The influence of superfinishing, coatings, and nitriding is considered in Section 3.3.
In Section 3.4, the integral temperature method according to ISO/TS 6336-21 [9] is introduced, and the developed LOL-related factors from Section 3.1, Section 3.2 and Section 3.3 are integrated to derive a scuffing safety calculation method for LOL.
Section 3.5 validates the scuffing safety calculation method for LOL by a comparison to existing LOL test results.
3.1. Load-Dependent Gear Power Loss
The load-dependent gear power loss PLGP can be calculated from the input power Pin, the mean gear coefficient of friction μmZ, and the tooth power loss factor HV according to Ohlendorf [46], respectively the local geometric tooth power loss factor HVL according to Wimmer [48]:
The mean gear coefficient of friction μmZ can be calculated based on various empirical equations, e.g., [24,49,50,51]. For the proposed calculation method, the equation acc. to Schlenk [49] was selected. Schlenk [49] adapted an existing calculation approach based on own test results and validated the approach for mineral and synthetic oils. The calculation approach acc. to Schlenk [49] combines good accuracy, a comparably wide validated speed range of 4 ≤ vt,C ≤ 50 m/s, and easy implementation, as the needed input data is known in early development stages. The mean gear coefficient of friction μmZ according to Schlenk [49] writes as:
It considers the tangential force at the base circle Fbt, the face width b, the sum speed at the pitch point v∑C, the relative curvature at the pitch point ρredC, the dynamic oil viscosity at the operating temperature ηOil, the arithmetic mean flank roughness Ra, and the lubricant factor XL.
LOL tests from Morhard et al. [6,7,8] have shown a dependency of friction increase during LOL on the acting speed, load, surface, material, and LOL time. Based on Equation (2), these dependencies are considered by the factor XLOL. The resulting mean gear coefficient of friction during LOL μmZ,LOL results as follows (if:
with
XLOL considers the influence of speed via the speed factor av, the influence of load via the load factor ap, the influence of the surface material via the material factor aMat (cf. Section 3.3), and the LOL time tLOL. The speed factor av pictures the found dependency of torque loss and acting speed during LOL [6,7,8]. If the calculated mean gear coefficient of friction falls within the range of 0.1 ≤ μmZ,LOL ≤ 0.2, it indicates a damage-critical event and suggests that the mean gear coefficient of friction does not represent a lubricated contact under design conditions
In [8], it was found that increasing the circumferential speed up to approx. vt,C = 30 m/s increases the torque loss during LOL and the risk of scuffing. This is explained by oil centrifugation and reduction in the available amount of lubricant on the gear flanks for lubrication. Further increasing the circumferential speed to above approx. vt,C > 40 m/s mitigates or prevents torque loss increase and scuffing. This is explained by reduced contact time and the consequently increased scuffing temperature. Additionally, the oil share in the oil–air fluid flow improves oil film formation and the heat transfer from the gears to the fluid flow. These findings are described by the speed factor av with the following:
The load factor ap depicts the found influence of increased load on μmZ,LOL via the following:
It is based on experimental results from Morhard et al. [6,7,8] and considers the accelerated torque loss increase with increasing load.
Figure 1 shows the progression of the speed factor av and the load factor ap.

Figure 1.
Progression of (a) speed factor av; (b) load factor ap for calculation of the mean gear coefficient of friction during LOL.
Figure 2a shows the resulting factor XLOL and Figure 2b shows the corresponding mean gear coefficient of friction during LOL μmZ,LOL for an exemplary operating condition with the reference Ref (cf. Table 2). The considered load stage (LS) 7 refers to the FZG scuffing test A/8.3/90 [52] (cf. Table A3) and was experimentally investigated in [6,7,8].

Figure 2.
Exemplary progression of (a) LOL factor XLOL; (b) resulting mean gear coefficient of friction during LOL μmZ,LOL for the reference Ref (cf. Table 2) at LS7.
The factor XLOL, according to Equation (4), shows a strong dependency of LOL time and circumferential speed vt,C. For a speed range of 1 ≤ vt,C ≤ 52 m/s, XLOL strongly increases from 1 to values > 10. The resulting mean gear coefficient of friction during LOL μmZ,LOL follows the trend of XLOL, leading to a significant friction increase for the speed range of 1 < vt,C < 52 m/s to the defined maximum value of 0.2.
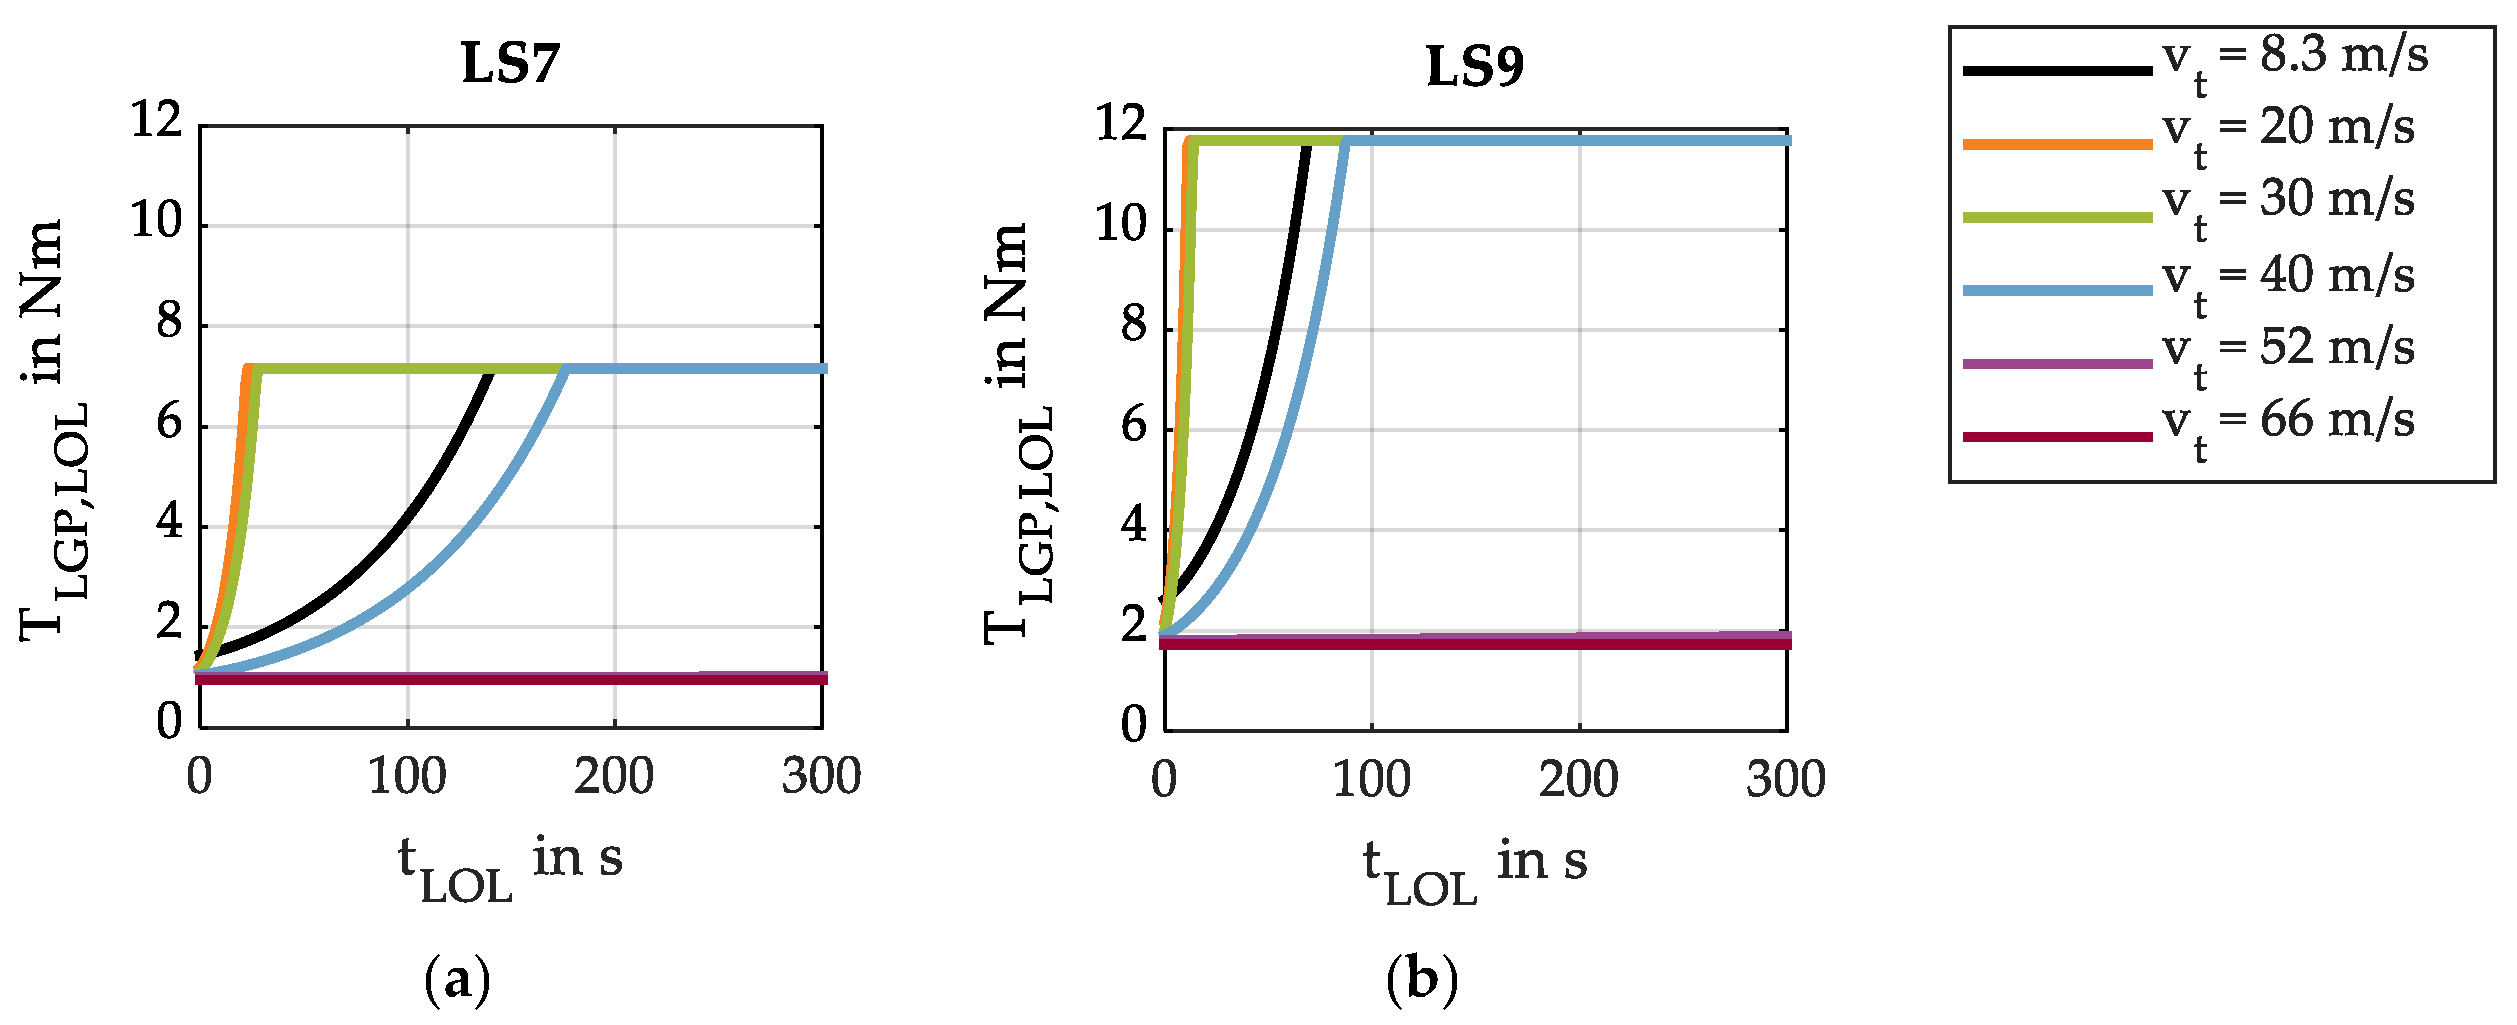
Figure 3 presents the calculated torque loss increase during LOL based on Equation (1) with the corresponding mean gear coefficient of friction during LOL μmZ,LOL for an exemplary operating condition with the reference Ref (cf. Table 2). The geometric tooth power loss factor HV was set according to the FZG test gear geometry of type Cmod,LOL (cf. Table A1). The loads considered are LS7 and LS9.
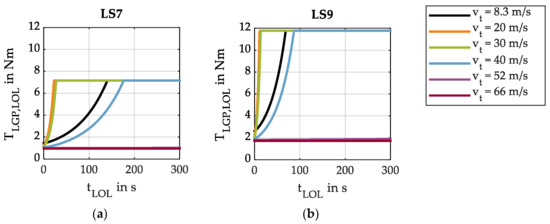
Figure 3.
Calculated torque loss increase during LOL for (a) LS7; (b) LS9 with the reference Ref (cf. Table 2).
The calculated torque loss TLGP,LOL shows the expected dependency on the LOL factor XLOL and the acting load. As the LOL time increases, the torque loss increases significantly for speeds vt,C ≤ 40 m/s. For higher speeds, however, the increase in torque loss is greatly reduced and only shows a slight increase for vt,C = 52 m/s. This behavior is consistent with torque loss measurements during LOL by Morhard et al. [8]. The torque loss TLGP,LOL reaches constant maximum values when the mean gear coefficient of friction during LOL μmZ,LOL reaches the limit of 0.2.
Note that, for continuously lubricated gears, interaction with the surrounding oil–air mixture, the injected oil, or the oil sump also leads to load-independent power loss due to windage, churning, squeezing, and impulse. At high speeds in particular, the load-independent power loss can dominate the overall power loss of a gearbox. During LOL and the sudden absence of external lubrication, the load-independent power loss decreases. However, this depends on the lubricant distribution prior to LOL and the operating speeds.
3.2. Heat Transfer Coefficient and Bulk Temperature
The heat transfer between the gears and the oil–air fluid flow determines the resulting bulk temperature. Based on the results presented in Morhard et al. [8] and Hildebrand et al. [41], the heat transfer coefficient h can be estimated by the following equation:
This equation is based on a Nusselt correlation that was proposed by Becker [36]. To consider the physical properties of an oil–air mixture, Hildebrand et al. [41] proposed averaging the physical properties φavr for the density
, the dynamic viscosity
, and the thermal conductivity
by the following:
leading to the heat transfer between the gear flank surface and the oil–air fluid flow:
Seitzinger [31] used the heat transfer coefficient hc to estimate the mean surface temperature ϑMS via the oil temperature ϑOil and an over temperature ϑOver. Besides hc, ϑOver results from the load-dependent gear power loss PLGP, the factor for heat transfer of the gears to the oil q, and the tooth flank surface related to heat input FW. The mean surface temperature ϑMS results as follows:
For the calculation method developed within this study, this approach was adapted to allow bulk temperature calculations ϑM under consideration of the heat transfer coefficient of the gear flank surface to the oil–air mixture havr from Equation (9). The resulting bulk temperature ϑM reads as follows:
Note, that the constant 4.1868 results from unit transformation from cal/s [31] to W. The fling-off theory of DeWinter and Blok [53,54] was not used for bulk temperature calculation, since during LOL no external oil supply lubricates the gears via an oil jet or oil sump.
The heat transfer coefficient between the gear flank surface and the oil–air fluid flow havr depends on the relative oil share αOil of the surrounding oil–air mixture. Bulk temperature measurements from Collenberg [20] were used to parametrize the oil share to the following:
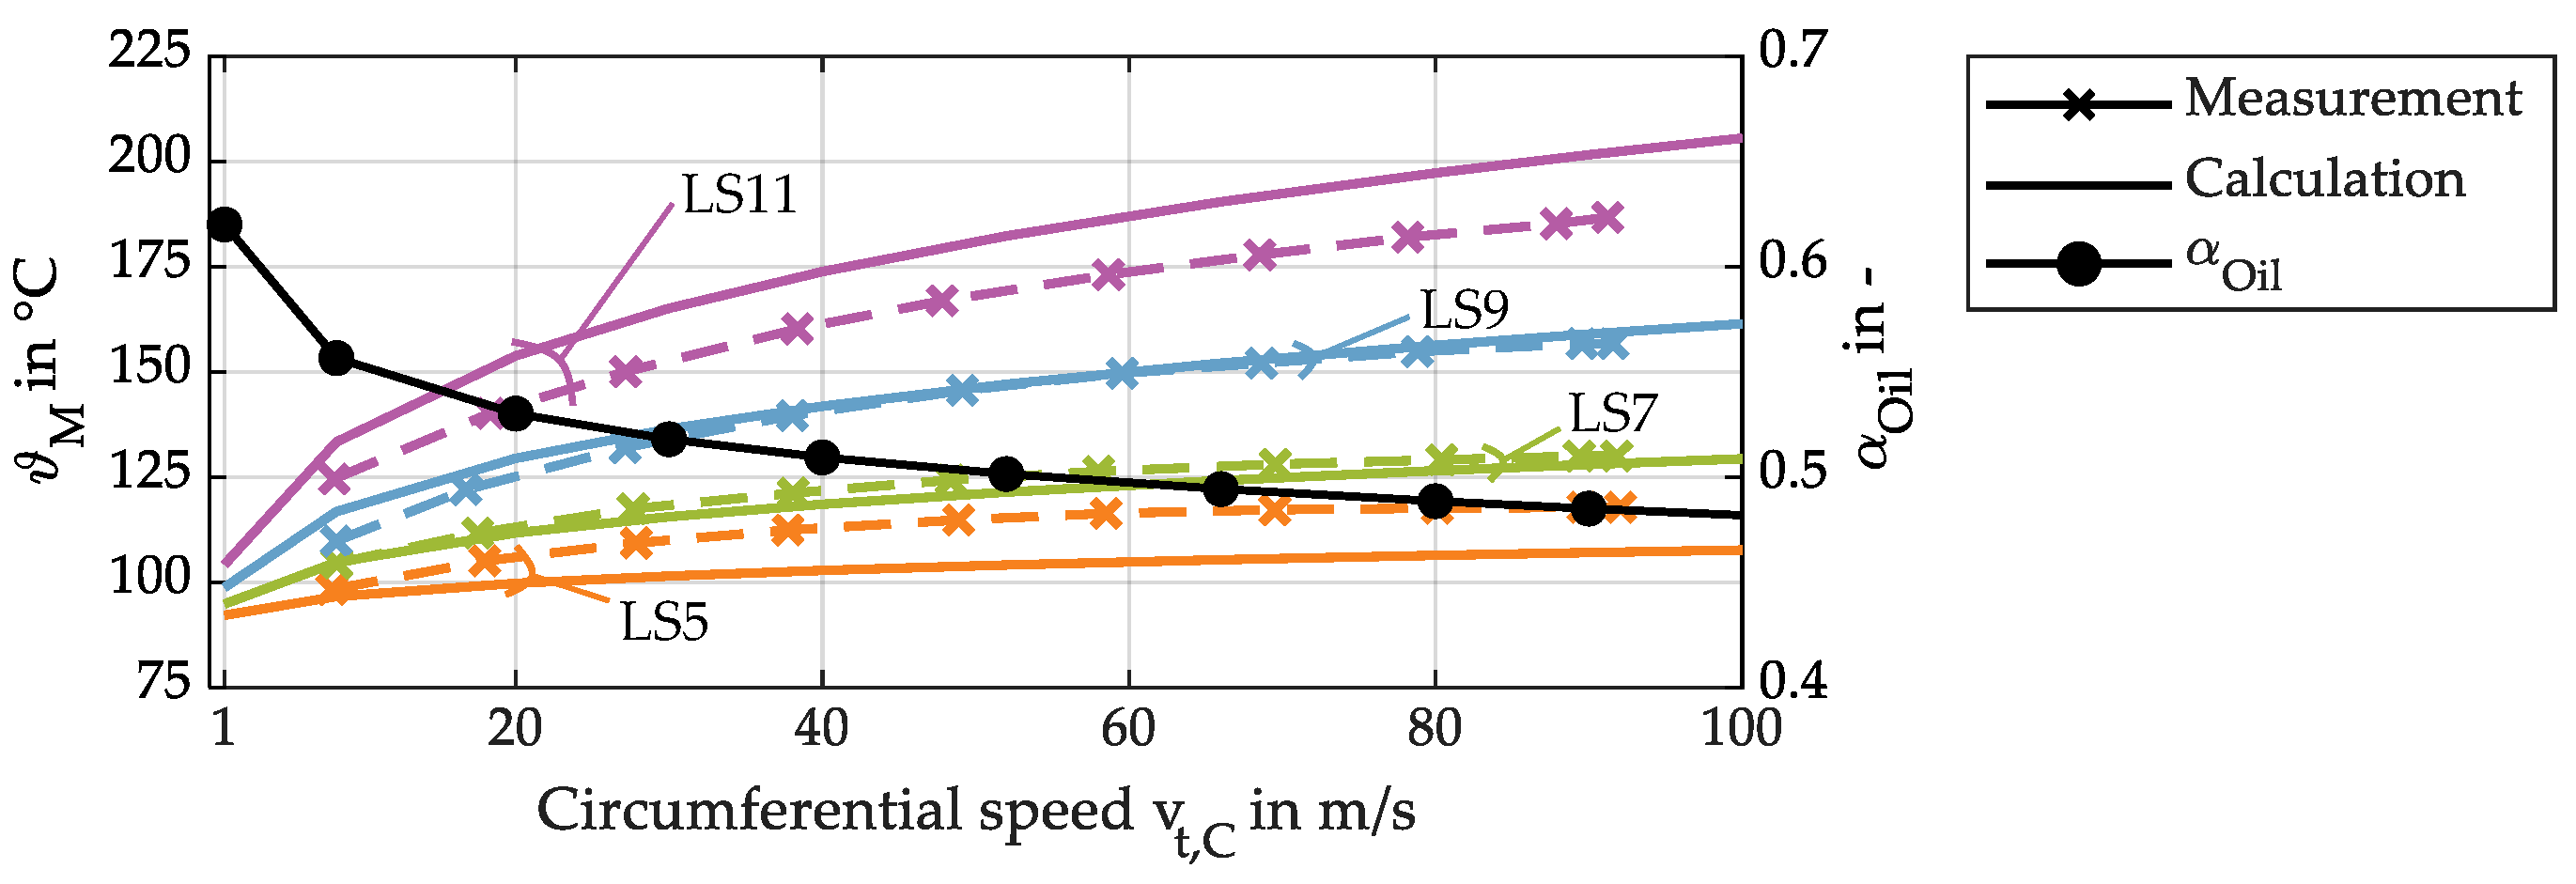
The resulting calculated bulk temperatures ϑM are presented in Figure 4 and compared to the measurements of Collenberg [20] for injection-lubricated FZG test gears of type A (cf. Table A1), oil ISO VG 46 (cf. Table A2), and ϑOil = 90 °C.
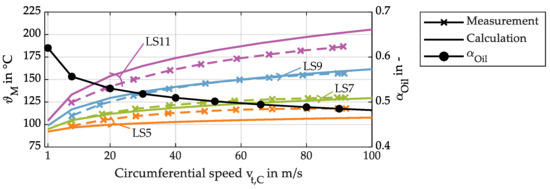
Figure 4.
Comparison of calculated bulk temperature ϑM to regression curves of measured bulk temperatures from Collenberg [20] and progression of the relative oil share αOil for injection lubrication with the FZG test gear of type A, oil ISO VG 46, and ϑOil = 90 °C.
Based on the parametrization, the calculated bulk temperature ϑM follows the trend of the measured bulk temperature from Collenberg [20] and shows good agreement. For LS11, ϑM is higher and for LS5, ϑM is lower than the measurements. A possible explanation could be an influence of the load on the heat transfer coefficient, as it was found by Seitzinger [31]. This is not considered in Equation (9) due to simplicity. The corresponding oil share αOil decreases with circumferential speed vt,C from 0.62 to 0.48. This decrease considers increased windage and thus a decreased amount of injected oil reaching the gear flank surfaces with increasing speeds. A relative oil share in the magnitude of ~0.5 seems plausible when compared to simulation results from Hildebrand et al. [41], who found oil shares for dip lubricated gears in the range of approx. αOil = 0.9 to 0.15 for a speed range of vt,C = 2.1 to 20 m/s.
Introducing an oil share-dependent heat transfer coefficient havr into bulk temperature calculation allows to consider the progression of the oil share during LOL, which decreases with ongoing LOL time. Based on Equation (11), the resulting bulk temperature during LOL ϑM,LOL depends on the load-dependent gear power loss during LOL PLGP,LOL and on the heat transfer coefficient during LOL havr,LOL:
The heat transfer coefficient during LOL havr,LOL is a function of the oil share during LOL αoil(tLOL) and results, based on Equation (9), as follows:
Based on Equation (8), the physical properties of the oil–air mixture φavr,LOL are dependent on the oil share during LOL αoil(tLOL):
Based on Morhard et al. [6], the oil share progression during LOL αoil(tLOL) was parametrized using measured bulk temperatures for speeds of vt,C ≤ 20 m/s as follows:
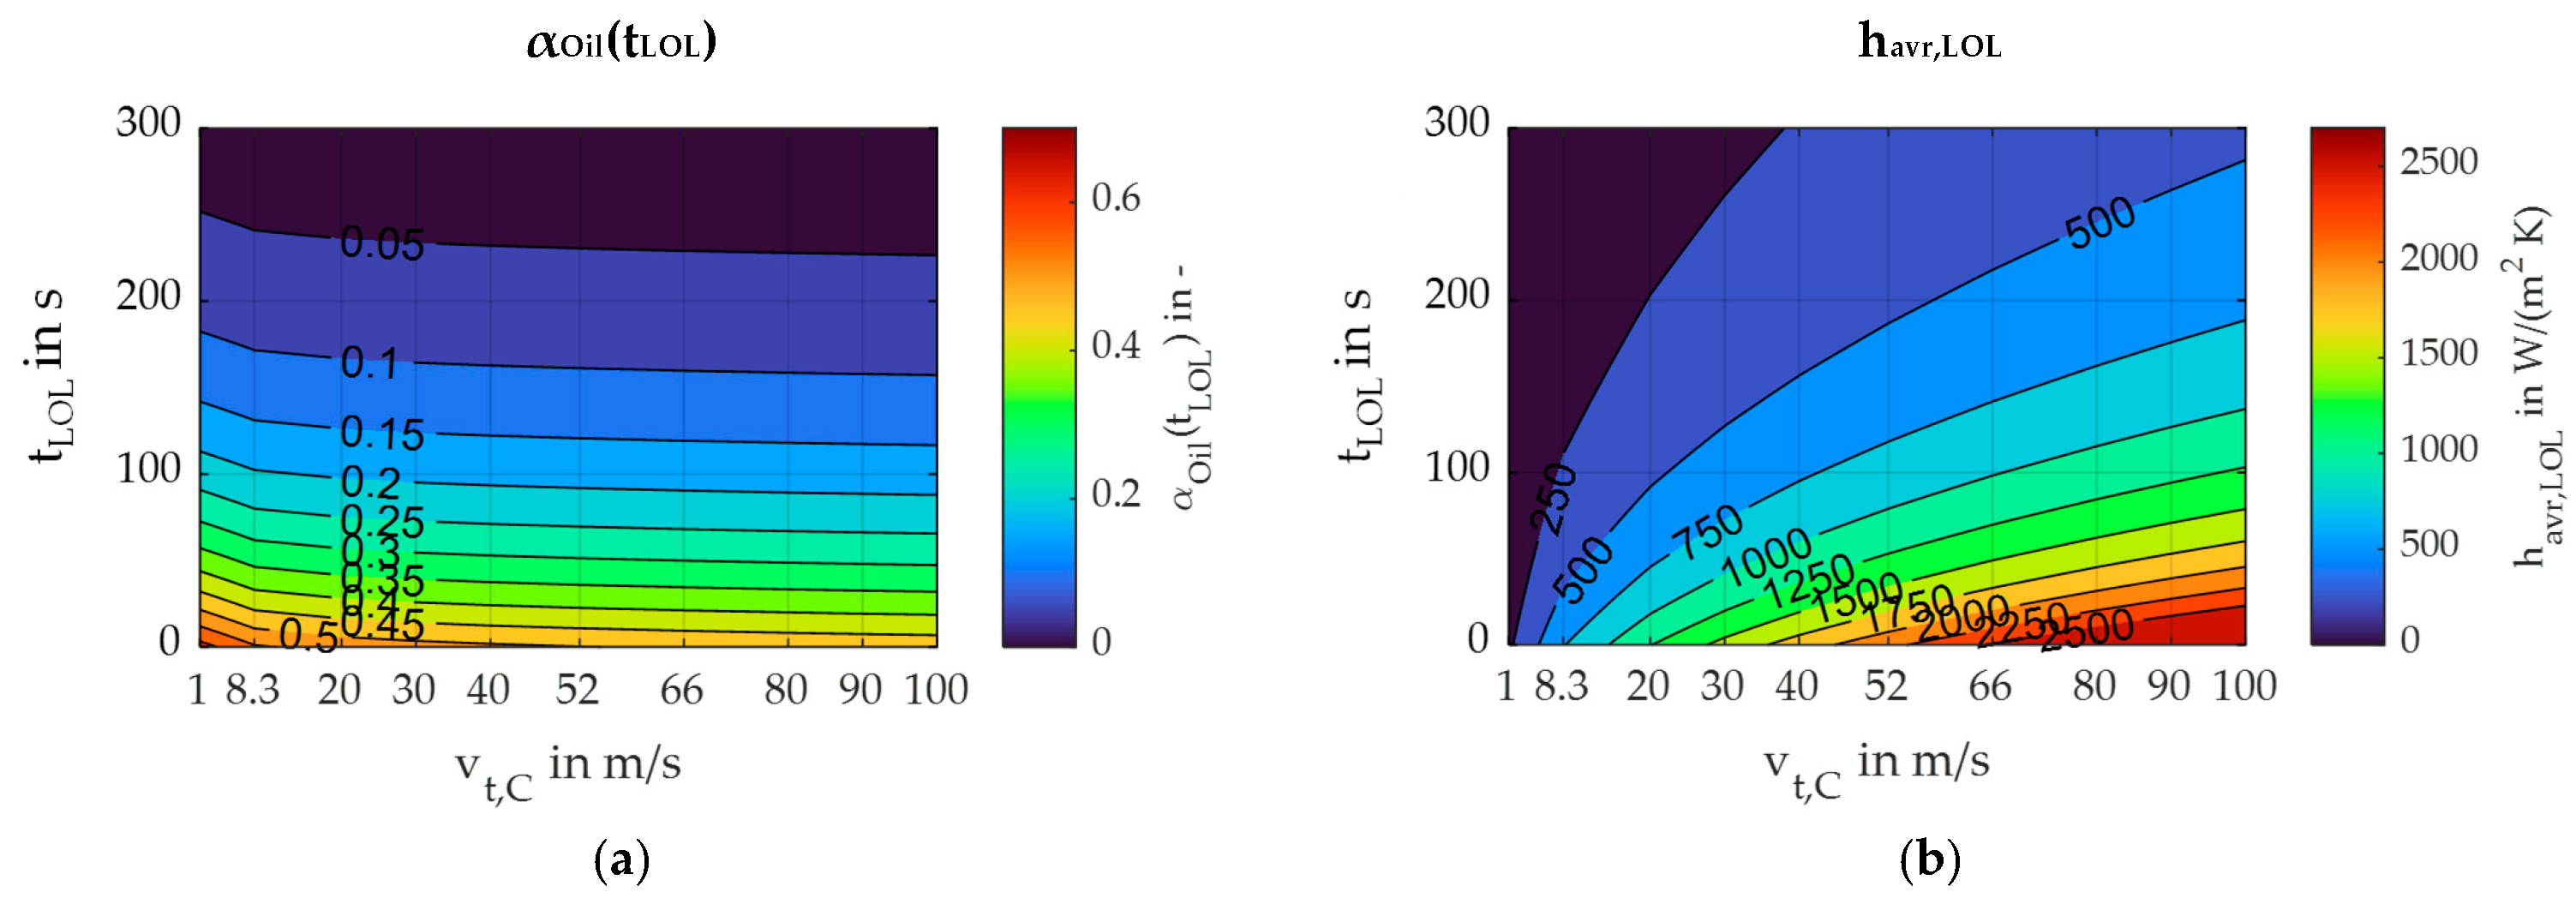
αOil|IL refers to the oil share during injection lubrication (IL) and the factor bOil describes the decrease in oil share αOil(tLOL) with increasing LOL time tLOL and is set to bOil = −0.01. Figure 5 shows the oil share progression during LOL αOil(tLOL) and the resulting heat transfer coefficient havr,LOL for an exemplary operating condition with the reference Ref (cf. Table 2).
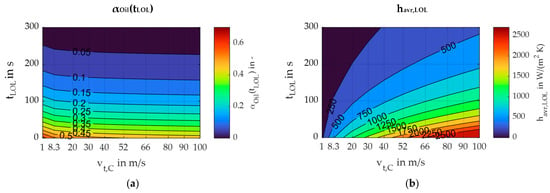
Figure 5.
(a) Oil share progression αoil(tLOL); (b) resulting heat transfer coefficient during LOL havr,LOL for the reference REF (cf. Table 2).
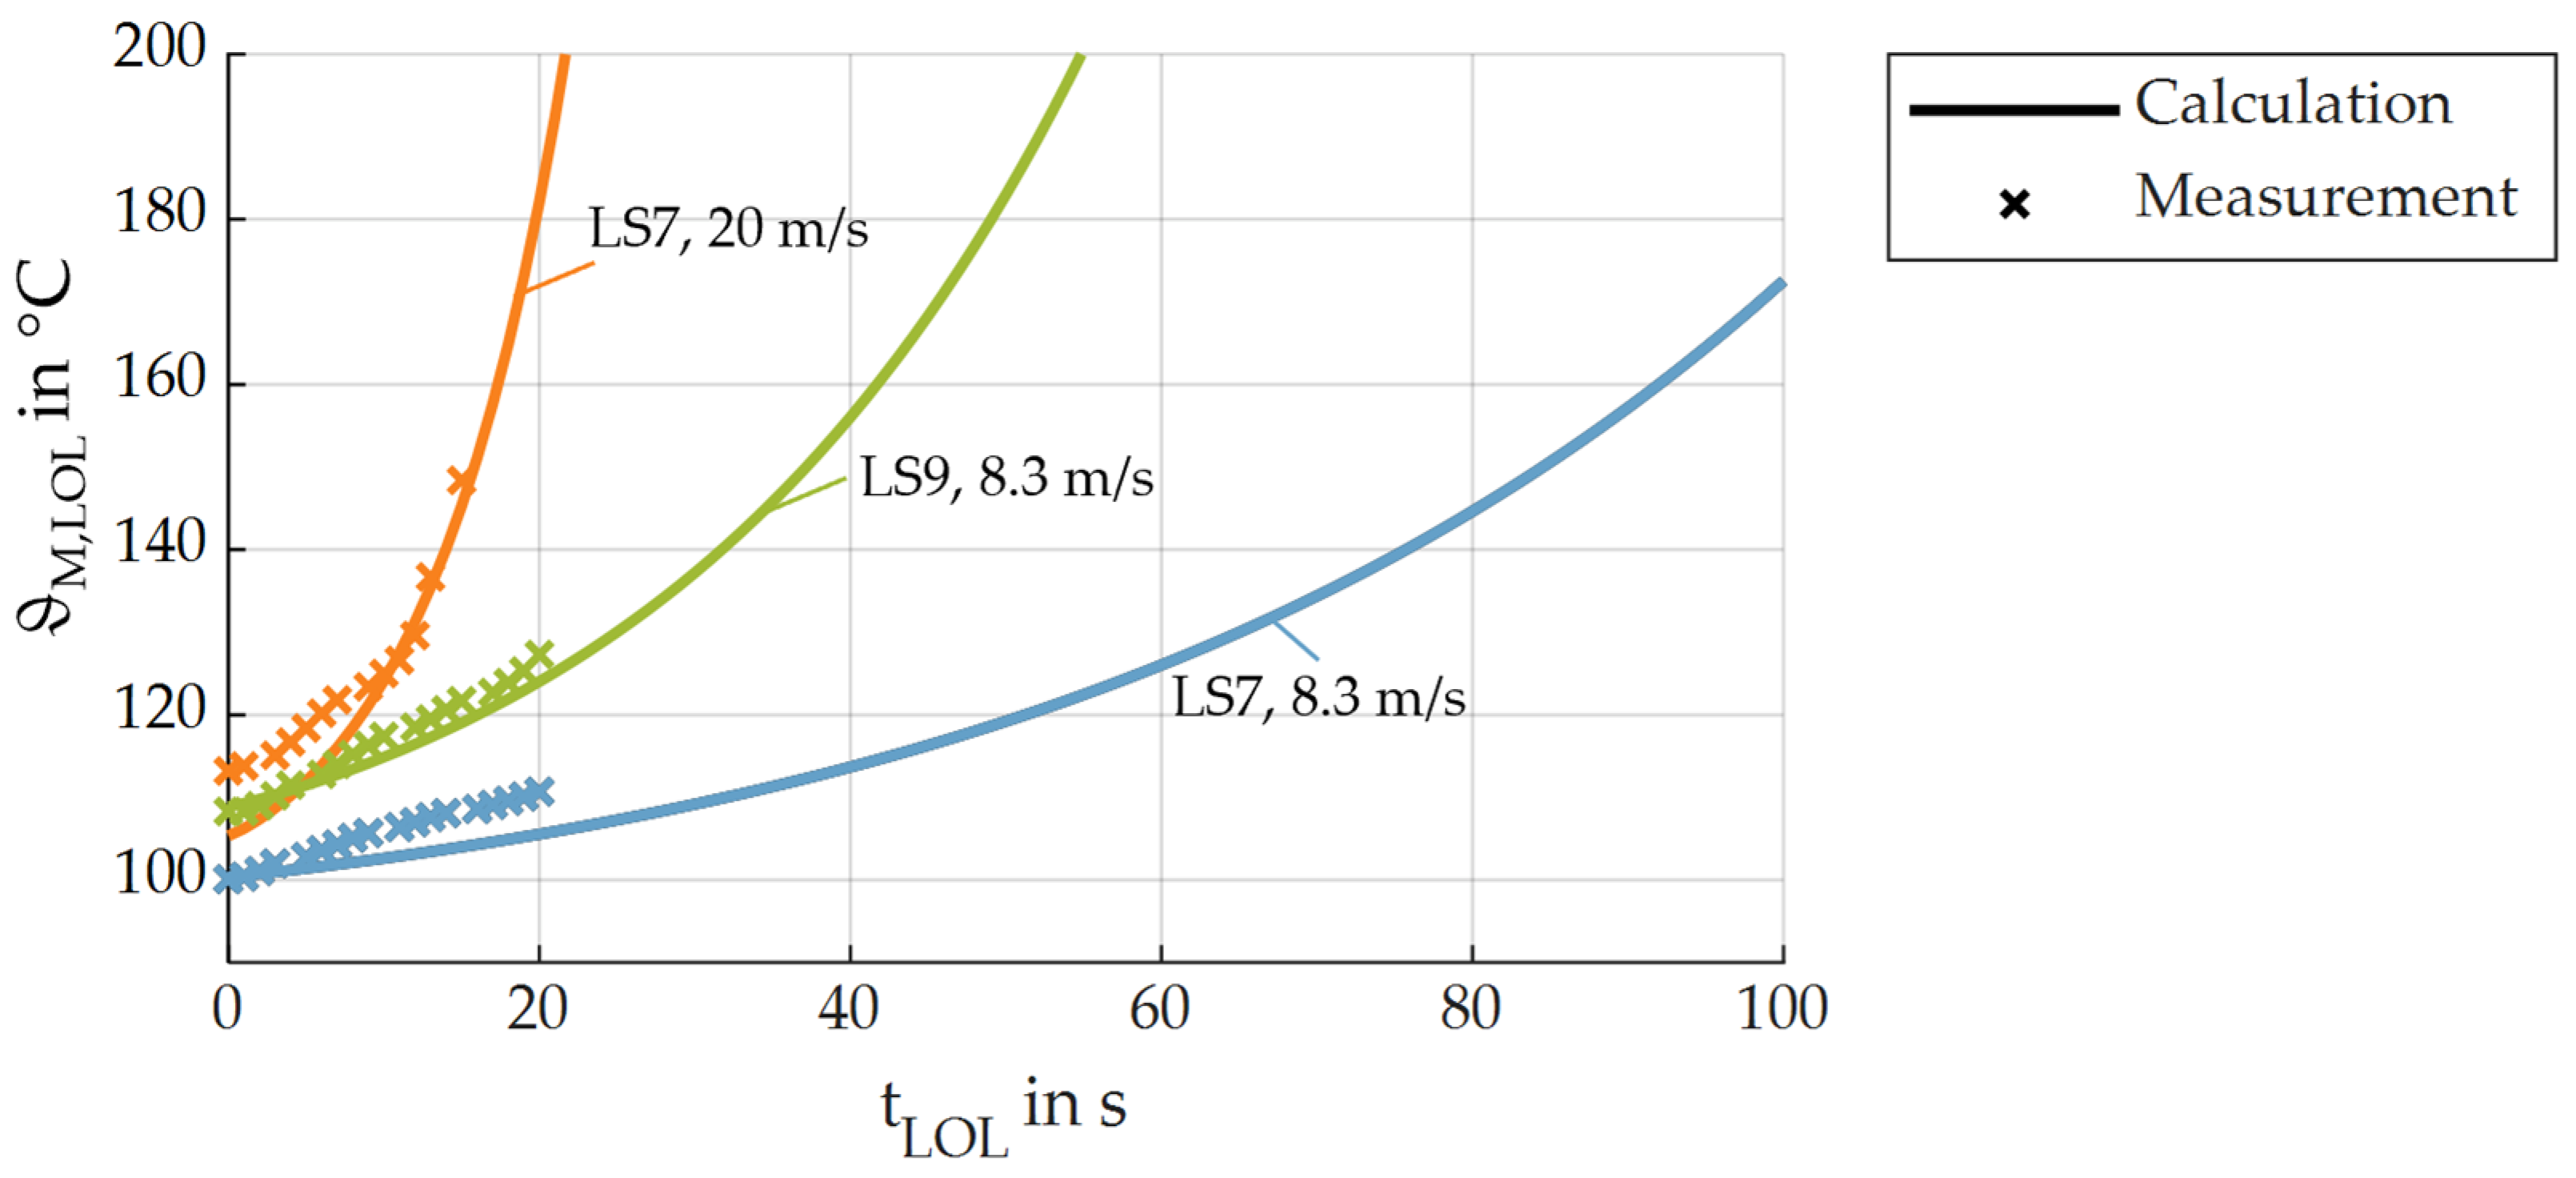
The oil share αoil(tLOL) decreases significantly with LOL time tLOL and reaches values of approx. 0.02 for the LOL time considered of tLOL = 300 s. Whereas αoil(tLOL) shows a weak dependency on the circumferential speed vt,C, the heat transfer coefficient havr,LOL significantly increases with vt,C, and decreases with tLOL and reaches values of approx. 24 W/(m2 K) at vt,C = 1 m/s and 470 W/(m2 K) at vt,C = 100 m/s after the LOL time considered of tLOL = 300 s. Note that the factor q, which considers the heat transfer at the tooth flank surface and the face side (cf. Equation (A2)), was determined for simplicity according to lubricated conditions before LOL. Figure 6 shows the resulting bulk temperatures under consideration of the load-dependent gear power loss PLGP,LOL compared to bulk temperature measurements during LOL from [6].
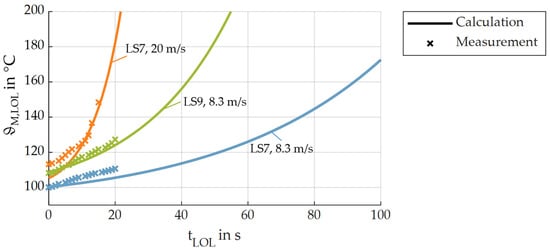
Figure 6.
Calculated bulk temperature during LOL ϑM,LOL compared to the measured bulk temperatures from [6] for the reference Ref (cf. Table 2).
The calculated bulk temperatures during LOL ϑM,LOL follow the measurement trend, whereas the calculated bulk temperature increases less for LS7 and vt = 8.3 m/s and steeper for LS7 and vt = 20 m/s. For LS9 and vt = 8.3 m/s, the calculated bulk temperature aligns well with the measurements of Morhard et al. [6]. Note that no bulk temperature measurements during LOL are available for speeds of vt,C > 20 m/s.
3.3. Surface and Material Properties
Morhard et al. [7,8] investigated superfinished, coated and nitrided gears compared to ground gears during LOL. The characteristics of the considered surfaces and materials are documented in Morhard et al. [7]. This section summarizes the knowledge gained and proposes a material factor, aMat, that can be integrated into the LOL factor XLOL (Equation (4)).
For case-hardened ground gears, the following material factor aMat|REF is defined as reference:
Superfinished gears showed a slightly increased torque loss during LOL at LS7 and vt,C = 8.3 and 20 m/s. At LS9 and vt,C = 8.3 m/s, the torque loss increase was more pronounced than with ground gears [7]. This leads to the following material factor aMat|SUF:
DLC coatings significantly improved the LOL behavior. The coatings reduced the torque loss increase during LOL. The best-performing coated variant in [7] (CO3) avoided scuffing for all investigated operating conditions. Therefore, the following material factor aMat|CO3 is proposed.
Nitrided gears exhibited comparable behavior to ground gears at low speeds and loads of LS7 and LS9. With increasing speeds at LS7, the torque loss progression during LOL was significantly decreased, potentially due to the increased hot hardness of the nitrided steel. This behavior can be estimated using discrete values for aMat|NIT, which depend on the circumferential speed vt,C. The resulting material factors aMat are presented in Table 1.

Table 1.
Material factor aMat for the case-hardened ground reference gears (REF), superfinished gears (SUF), DLC coated gears (CO3), and nitrided gears (NIT) in dependency of the circumferential speed vt,C.
Figure 7 illustrates the material factors aMat for LOL as a function of circumferential speed vt,C.

Figure 7.
Material factors aMat derived from LOL tests [7,8] for the case-hardened ground reference gears (REF), superfinished gears (SUF), DLC-coated gears (CO3), and nitrided gears (NIT).
3.4. Suggested Calculation Method
To depict the risk of scuffing for an operating condition during LOL, the flash temperature method according to ISO/TS 6336-20 [25] and the integral temperature method according to ISO/TS 6336-21 [9] can be adapted. Due to better agreement to performed scuffing tests (cf. Appendix E), and LOL tests, the integral temperature method based on ISO/TS 6336-21 [9] is suggested for integrating LOL. The adapted flash temperature method based on ISO/TS 6336-20 [25] and a comparison of both adapted calculation methods are described in Appendix E.
The integral temperature method according to ISO/TS 6336-21 [9] is based on the scuffing safety factor SintS (cf. Equation (21)). A scuffing safety of SintS < 1 correlates to a high scuffing risk, and a scuffing safety in the range of 1 ≤ SintS ≤ 2 correlates to a critical range with moderate scuffing risk that is influenced by the operating conditions [9].
The following calculation equations summarize the calculation of the adapted scuffing safety factor for LOL SintS,LOL.
according to Collenberg [20] (cf. Equation (26))
The scuffing safety factor SintS,LOL is derived by the scuffing integral temperature ϑintS, being the allowable integral temperature, compared to the acting integral temperature ϑint,LOL for an operating condition during LOL.
The scuffing integral temperature ϑintS is calculated based on the contact-time-dependent scuffing temperature from Collenberg [20], respectively. ISO/TS 6336-21 [9]. The contact time influences the scuffing safety, as higher scuffing temperatures result when contact times are low. This is explained by the higher temperatures needed for tribofilm breakdown at low contact times [20]. Investigations from Winter et al. [29] have shown that this effect is present for non-EP turbine oils and that the effect can be enhanced by additives. Based on Collenberg [20] and ISO/TS 6336-20/21 [9,25], the scuffing temperature increase for high speeds and short contact times tC can be calculated with the following expression:
The scuffing temperature ϑS equals the scuffing temperature at long contact times ϑSC if the contact time tC is longer than the contact time at the minimum of the scuffing speed curve tK. For contact times tC shorter than the contact time at the minimum of the scuffing speed curve tK, ϑSC is increased by the product of the gradient of the scuffing temperature CS, the relative welding factor XWrelT, and the delta between tK and tC. When no test results are available for the scuffing load at high speeds, the contact time at the minimum of the scuffing speed curve tK can be set to 18 µs and the gradient of scuffing temperature CS can be set to 18 K/µs for oils with extreme pressure (EP) additives. The scuffing temperature at long contact times ϑSC can be calculated based on the scuffing load stage of a scuffing test like the FZG scuffing test A/8.3/90 [52].
The acting integral temperature during LOL
results from the bulk temperature during LOL
(cf. Equation (13)) and the mean flash temperature during LOL
under consideration of the weighting factor
. ϑflaint,LOL consists of the flash temperature during LOL at the pinion tooth tip when load sharing is neglected ϑflaE,LOL and the contact ratio factor Xε. ϑflaE,LOL consists of the mean gear coefficient of friction during LOL μmZ,LOL (cf. Equation (3)), the thermal flash factor XM, the geometry factor at pinion tooth tip XBE, the pressure angle factor Xαβ, the helical load factor KBγ, the specific tooth load wBt, the reference line velocity v, the center distance a, the run-in factor XE, the approach factor XQ, and the tip relief factor XCa.
3.5. Validation
This section compares the results of the calculation method with LOL test results from Morhard et al. [6,7,8]. The parameters according to Table 2 are selected as reference (Ref). The reference refers to the gear geometry of type Cmod,LOL (cf. Table A1) with a ground surface (cf. Section 3.3). The considered oil temperature ϑOil is 90 °C and the oil is AeroShell 500 (cf. Table A2), with a lubricant factor XL of 0.8 (cf. Section 3.1) and a scuffing load stage of SLS = 7 [6]. The oil share progression during LOL bOil|Ref is set to −0.01 (cf. Section 3.2) and the gradient of scuffing temperature is set to 18 K/µs in accordance with ISO 6336/20 [25] (cf. Section 3.4).

Table 2.
Gear and oil related calculation parameters defined as reference Ref.
Table 2.
Gear and oil related calculation parameters defined as reference Ref.
| Gear Geometry | Surface and Material Variant | ϑOil | Oil | Lubricant Factor XL | Scuffing Load Stage SLS | Oil Share Progression During LOL bOil|Ref | Gradient of Scuffing Temperature CS|Ref |
|---|---|---|---|---|---|---|---|
| Type Cmod,LOL | REF (ground) | 90 °C | AeroShell 500 | 0.8 | 7 ([6]) | −0.01 | 18 K/µs |
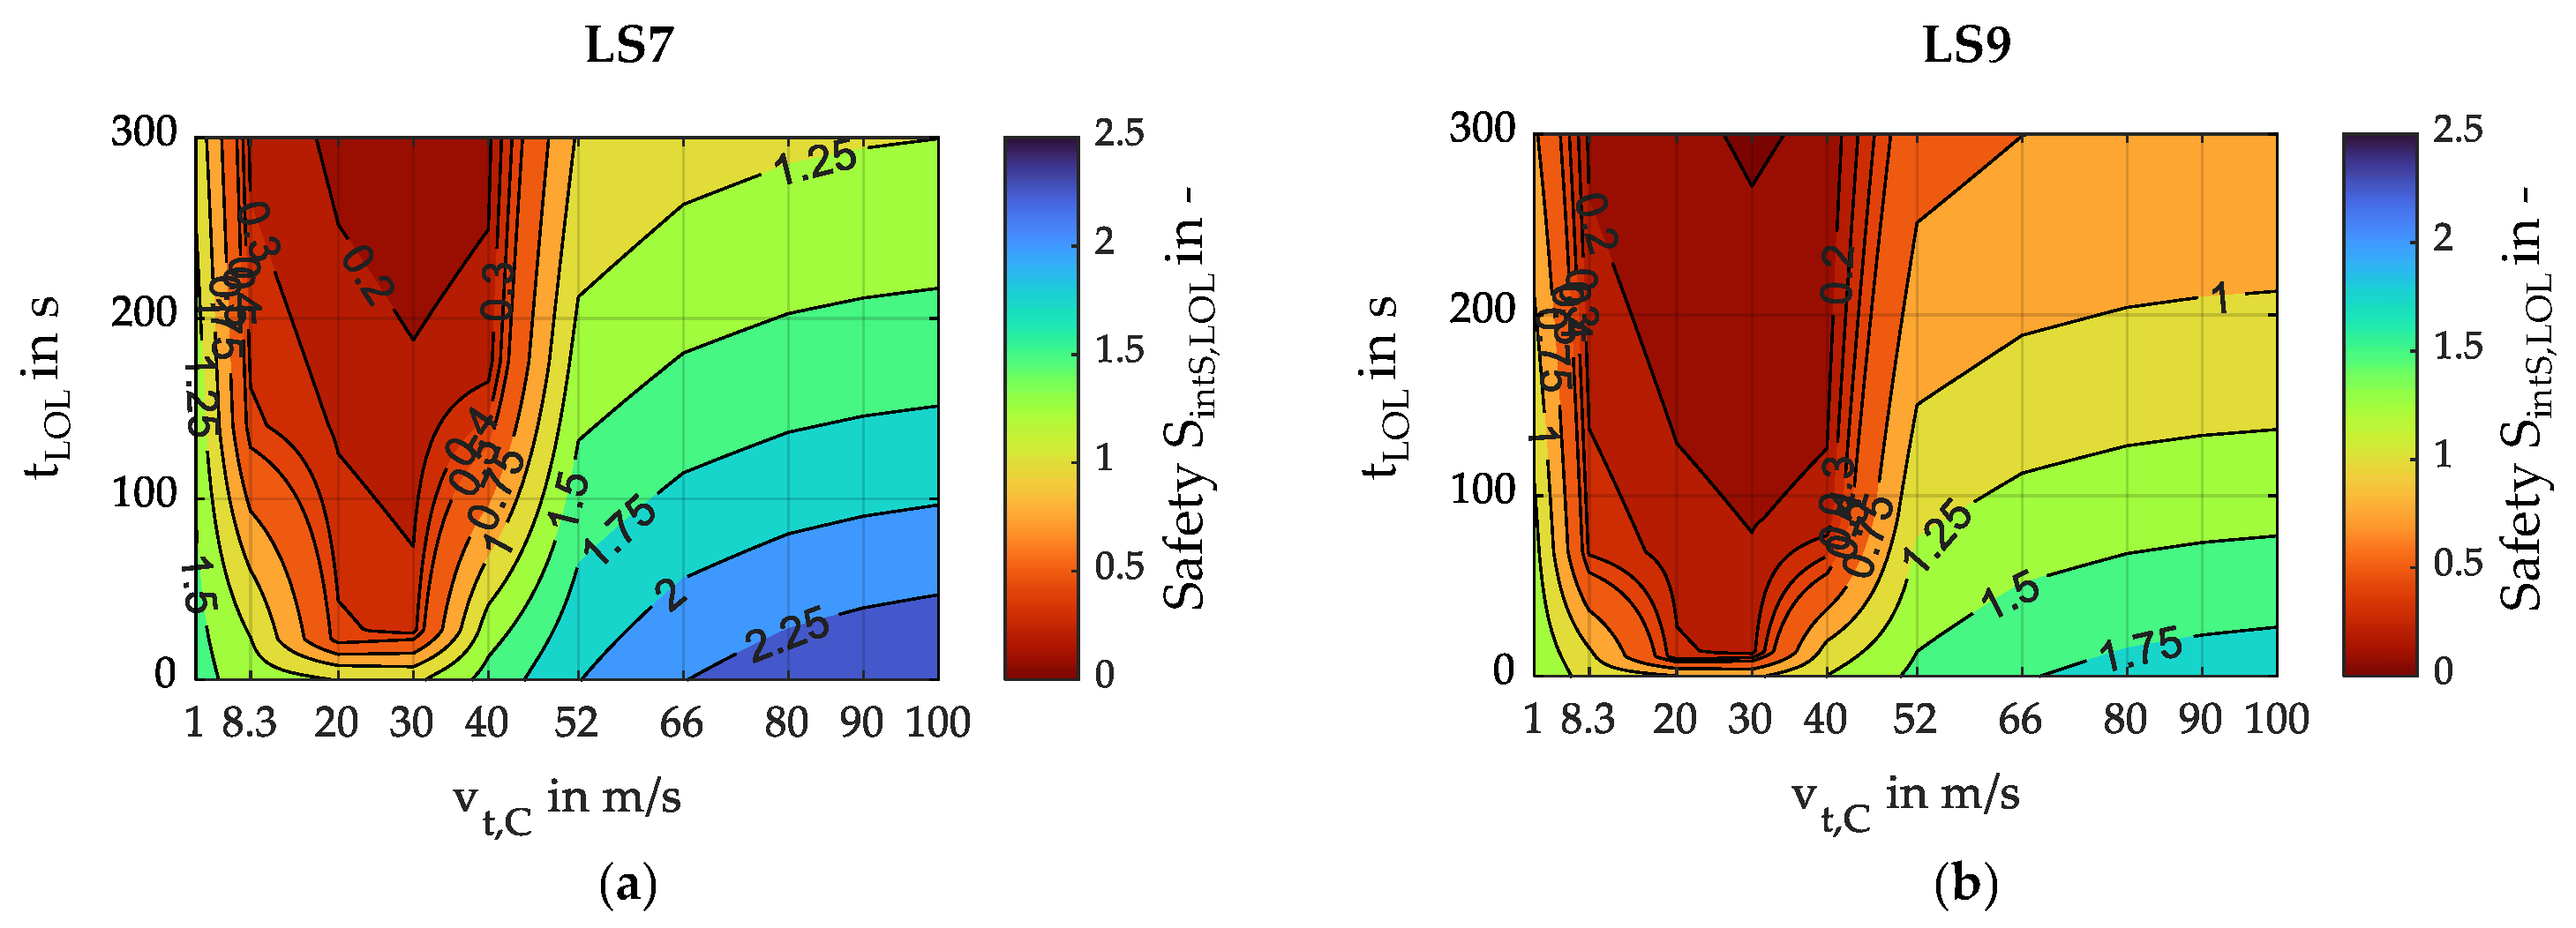
Figure 8 shows the calculated scuffing safety SintS,LOL based on Section 3.4 for LS7 and LS9, considering a speed range of 1 ≤ vt,C ≤ 100 m/s, and a LOL time of 300 s for the reference (Ref).
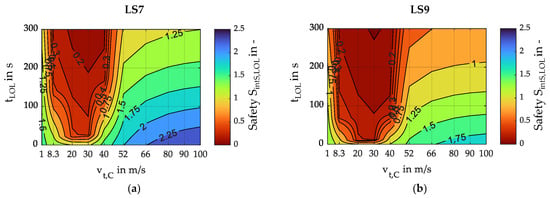
Figure 8.
Scuffing safety SintS,LOL for (a) LS7; (b) LS9 with the reference Ref (cf. Table 2).
The scuffing safety factor SintS,LOL shows a strong dependency of tLOL, and for 1 ≤ vt,C < 52 m/s, a strong dependency of the circumferential speed vt,C. Circumferential speeds vt,C > 52 m/s lead to increased scuffing safety factors SintS,LOL.
For LS7, the scuffing safety factor SintS,LOL decreases for 1 ≤ vt,C < 35 m/s significantly and reaches SintS,LOL < 1.0 within the margin of seconds. For speeds 52 ≤ vt,C ≤ 100 m/s, the scuffing safety factor SintS,LOL is generally higher and does not reach SintS,LOL < 1.0. For LS9, the scuffing safety factors are generally lower compared to LS7 and show for vt,C = 30 m/s a scuffing safety SintS,LOL < 1.0 immediately at the beginning of LOL. The scuffing safety during LOL decreases rapidly for 1 ≤ vt,C < 52 m/s. For higher speeds in a range of 52 ≤ vt,C ≤ 100 m/s, a scuffing safety SintS,LOL < 1.0 is reached after tLOL approx. 210 s at the latest.
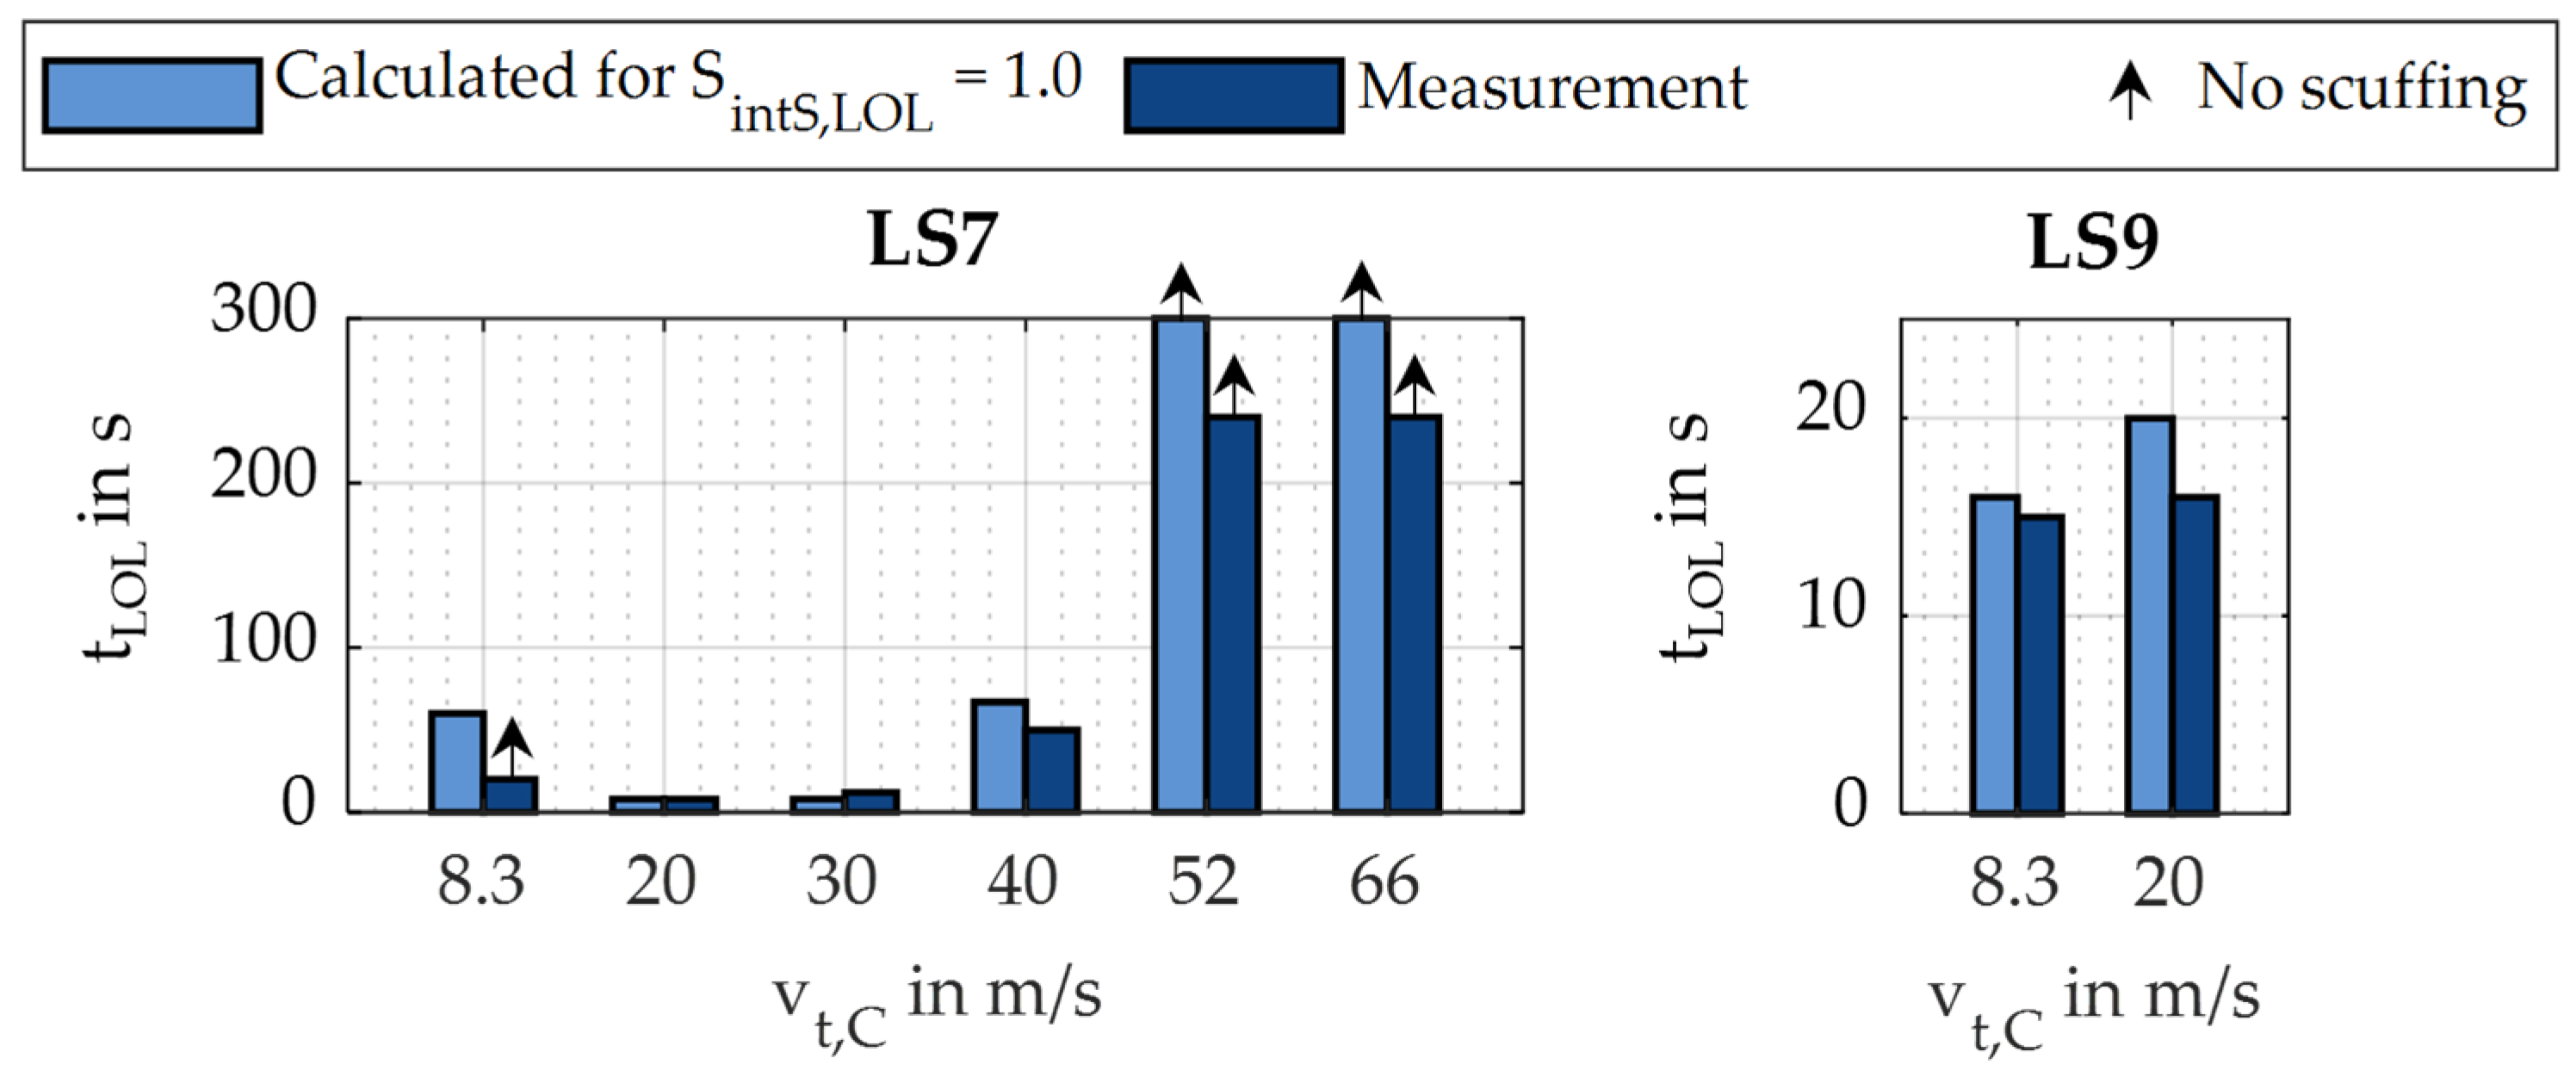
Figure 9 compares the LOL time tLOL until a scuffing safety SintS,LOL = 1.0 is reached for the reference Ref (cf. Table 2) to the scuffing initiation during LOL for operating conditions tested in Morhard et al. [6,8].
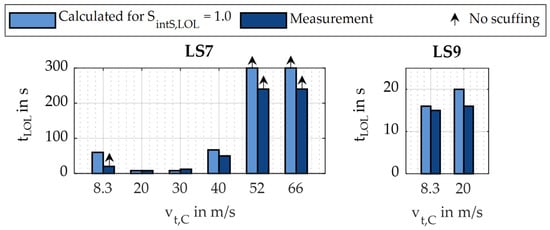
Figure 9.
Comparison of calculated LOL times tLOL until a scuffing safety SintS,LOL = 1.0 is reached to scuffing initiation during LOL tests from Morhard et al. [6,8] for LS7 and LS9 with the reference Ref (cf. Table 2).
For LS7 and vt,C = 8.3 m/s, the calculation method proposes a scuffing safety of SintS,LOL = 1.0 after approx. 60 s LOL. In the LOL tests from Morhard et al. [6], the test was stopped after 20 s LOL without scuffing. For vt,C = 20 m/s, a calculated scuffing safety of SintS,LOL = 1.0 is predicted after approx. 8 s LOL. The LOL test in Morhard et al. [6] showed scuffing after approx. 8 s and in Morhard et al. [8] after approx. 10 s. For vt,C = 30 m/s, a scuffing safety of SintS,LOL = 1.0 is predicted after approx. 14 s LOL. The LOL test in Morhard et al. [8] showed scuffing after approx. 12 s. For vt,C = 40 m/s, a scuffing safety of SintS,LOL = 1.0 is predicted after approx. 67 s LOL. The LOL test in Morhard et al. [8] showed scuffing after approx. 50 s. For vt,C = 52 and 66 m/s, a scuffing safety of SintS,LOL = 1.0 is not reached for tLOL < 300 s. The corresponding LOL tests in Morhard et al. [8] showed no scuffing until the test was stopped after 280 s LOL.
For LS9 and vt,C = 8.3 m/s, the calculation method proposes a scuffing safety SintS,LOL = 1.0 after approx. 16 s LOL. In the LOL test from Morhard et al. [6], scuffing occurred after 15 s LOL. For vt,C = 40 m/s, a scuffing safety SintS,LOL = 1.0 is reached after approx. 20 s LOL. The LOL test in Morhard et al. [6] showed scuffing after approx. 16 s LOL.
For the operating conditions considered, the calculation method depicts the influence of speed and load on scuffing during LOL and predicts the scuffing initiation with sufficient accuracy.
4. Results of Calculation Study
The developed calculation method from Section 3 was used to depict the influence of gear-related design parameters. Section 4.1 shows the influence of different oil share progressions during LOL on the scuffing safety. Section 4.2 shows the impact of the different surfaces and materials. Section 4.3 shows the influence of different gear geometries. Section 4.4 shows the influence of different oil types and Section 4.5 shows the influence of oil viscosity. Section 4.6 shows the impact of oil additives. The scuffing safeties during LOL SintS,LOL were calculated for maximum LOL times of 300 s and speeds of 1 < vt,C < 100 m/s.
4.1. Influence of Oil Share Progression During LOL
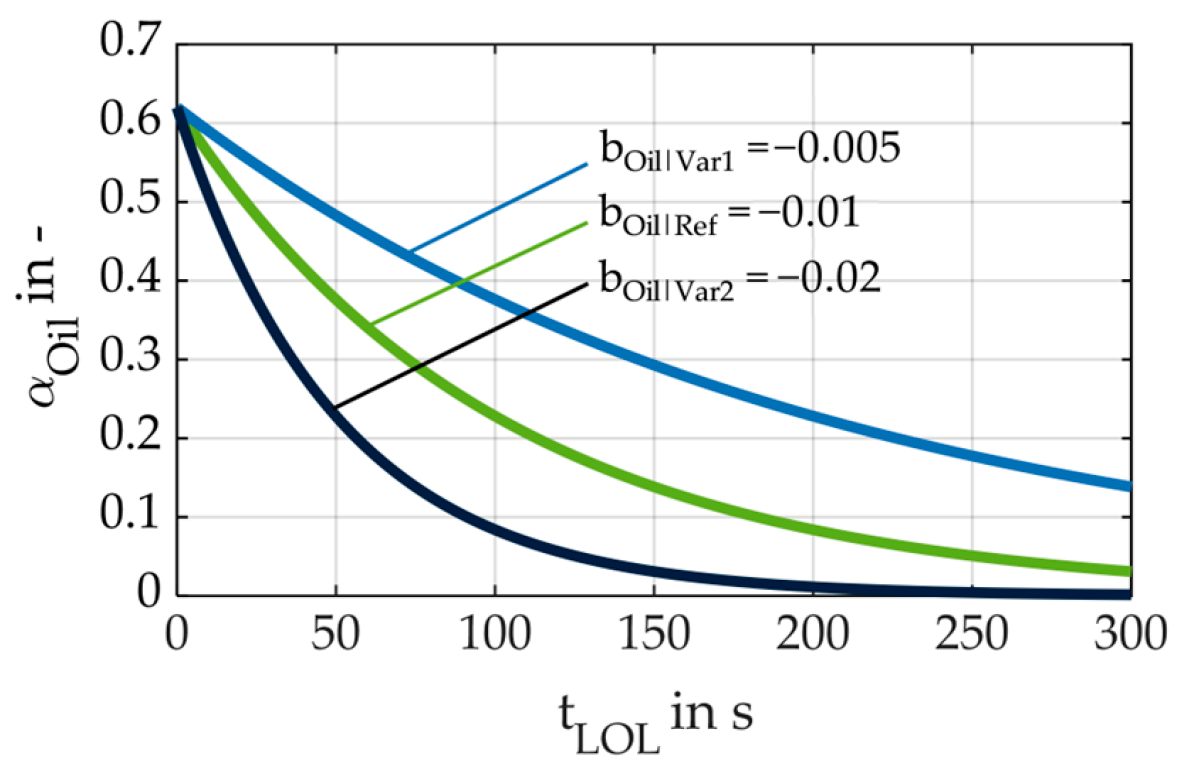
To depict the influence of the oil share progression during LOL (cf. Section 3.2), this section shows a variation of the assumed reference oil share progression αoil,Ref based on Equation (16). To estimate the influence of improved lubrication during LOL by passive lubrication from, e.g., oil baffles or guide plates, the factor bOil is decreased from bOil|Ref = −0.01 to bOil|Var1 = −0.005. To estimate the influence of a stronger decrease in oil share during LOL, as it could be the case in a wide-spaced housing, bOil|Var2 = −0.02 is applied.
Figure 10 shows the corresponding oil share progressions during LOL. The factor XLOL (cf. Equation (4)) is kept constant for the varied oil share progressions to exclude further influences in the analysis.
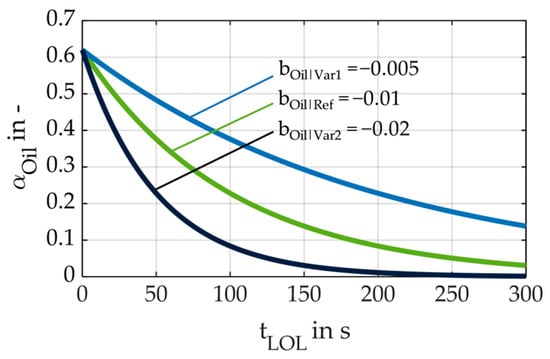
Figure 10.
Different oil share progressions during LOL (reference oil share progression with bOil|Ref, improved lubrication during LOL with bOil|Var1, wide-spaced housing with decreased oil share progression with bOil|Var2).
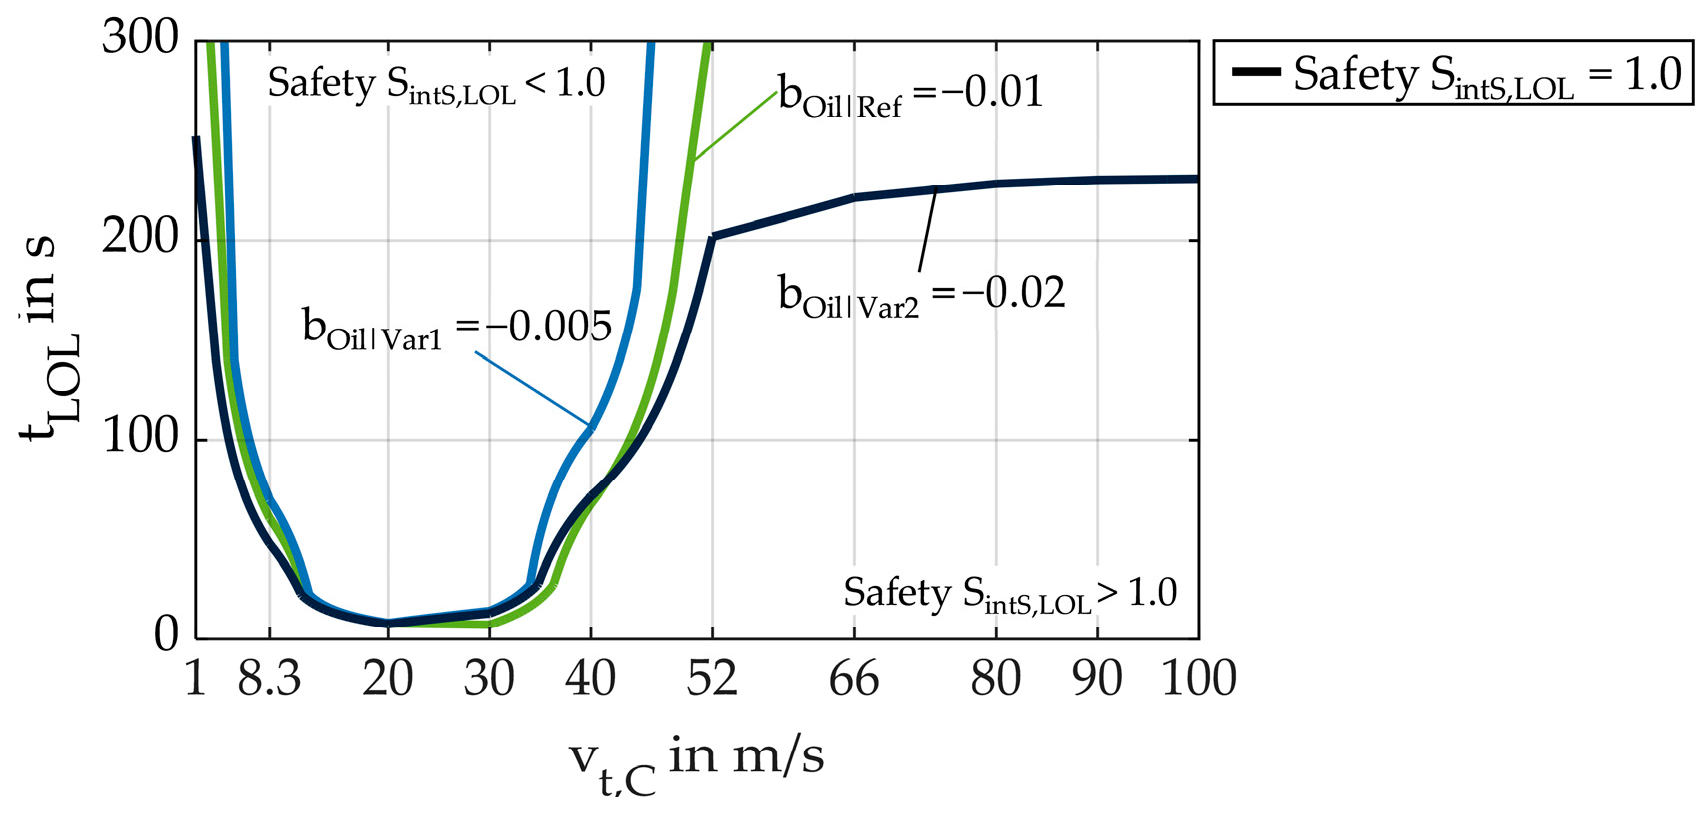
Figure 11 shows the influence of the different oil share progressions on the calculated scuffing safety SintS,LOL = 1 according to Section 3.4.
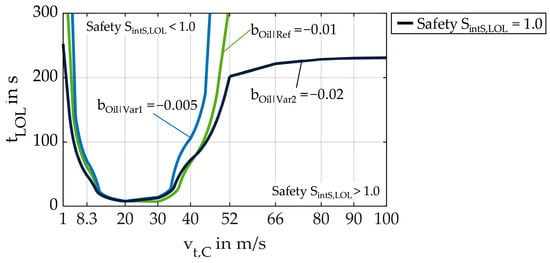
Figure 11.
Scuffing safeties SintS,LOL = 1.0 based on the reference Ref (cf. Table 2) at LS7 for different oil share progressions.
The increased oil share with ongoing LOL time tLOL for αoil,Var1 decreases bulk temperatures and increases scuffing safety during LOL. A scuffing safety SintS,LOL < 1.0 is proposed in a smaller speed range of approx. 4 ≤ vt,C ≤ 46 m/s. In that speed range, scuffing during LOL is predicted to behave comparable to the reference oil share progression αoil,Ref. The decreased oil share with ongoing LOL time tLOL for αoil,Var2 increases gear bulk temperatures and reduces scuffing safety. This leads to shorter LOL times until a scuffing safety of SintS,LOL = 1.0 is reached. For speeds vt,C > 52 m/s, a scuffing safety Sints,LOL = 1.0 is reached after approx. 230 s as latest.
4.2. Influence of Gear Surface and Material
LOL tests from Morhard et al. [7,8] have shown a strong dependency of LOL performance from the gear material and surface. This section shows the calculated scuffing safety progression during LOL for the developed material factors aMat from Section 3.3 that are introduced into the LOL factor XLOL (cf. Equation (4)).
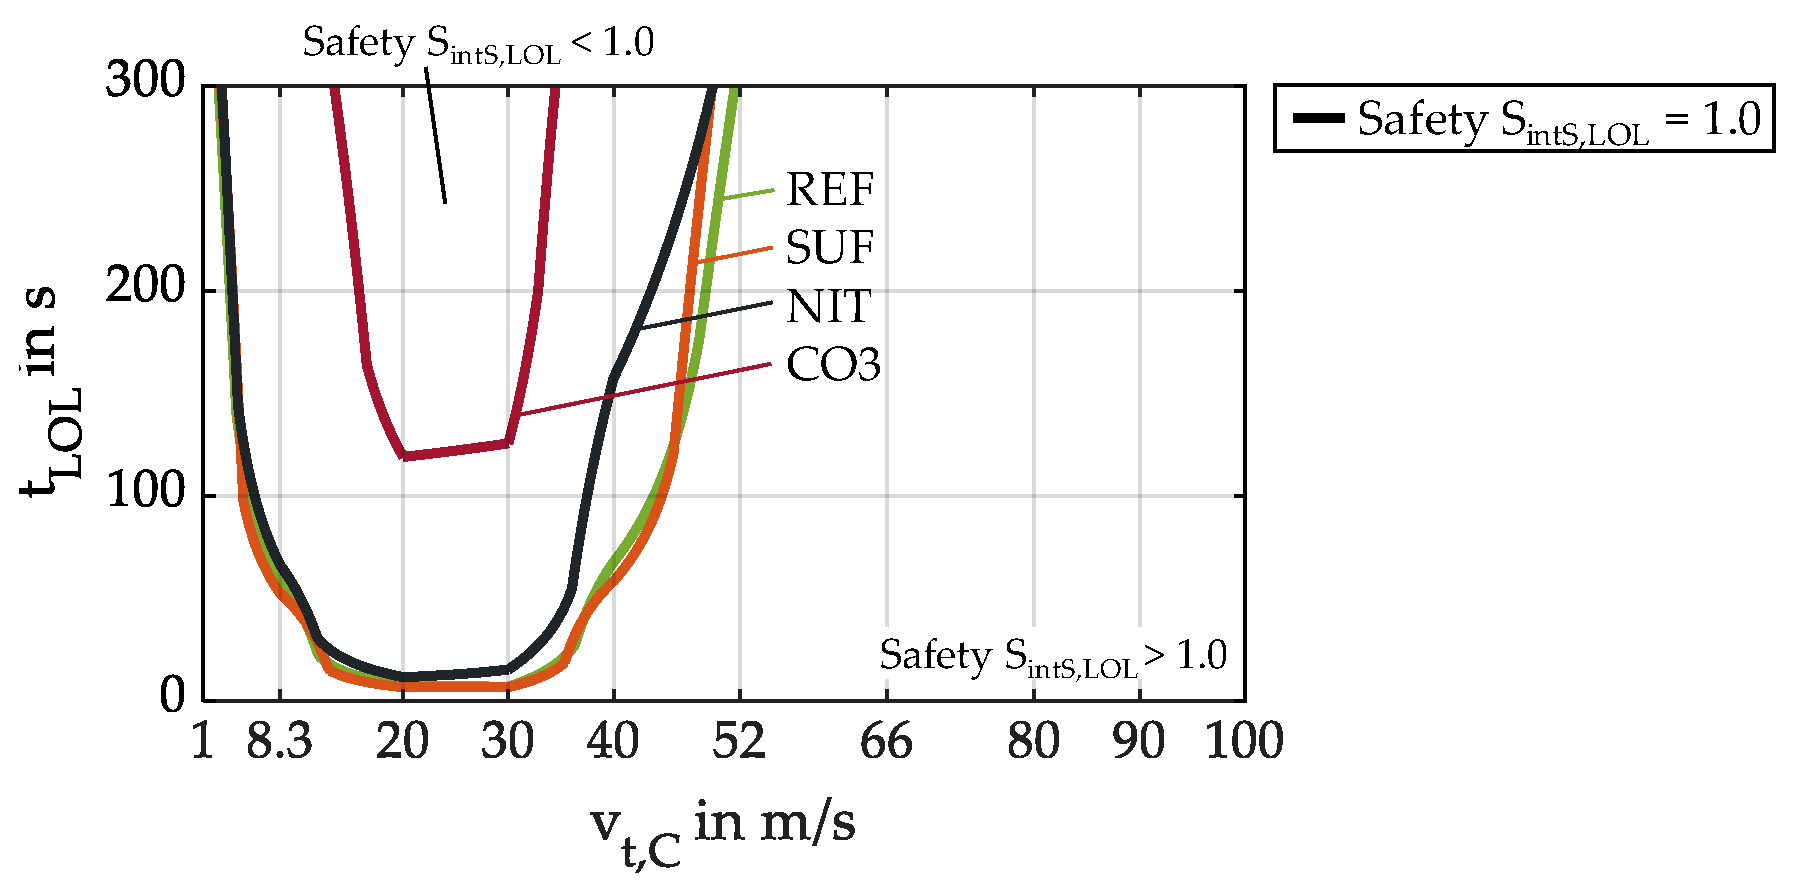
Figure 12 shows the calculated scuffing safeties during LOL for the gear surface and material variants REF, SUF, CO3, and NIT. The detailed characteristics of the surfaces and materials are presented in Morhard et al. [7].
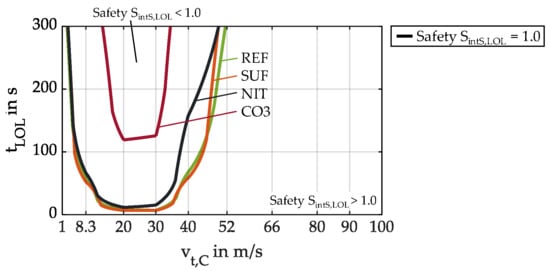
Figure 12.
Scuffing safeties SintS,LOL = 1.0 based on the reference Ref (cf. Table 2) at LS7 with surface and material variants REF, SUF, CO3, and NIT.
The variants REF and SUF show a very similar behavior. The variant SUF reaches a scuffing safety SintS,LOL = 1.0 only marginally earlier than the variant REF. The variant NIT shows a comparable trend, whereas a scuffing safety of SintS,LOL = 1.0 at vt,C ≈ 40 m/s is reached at later LOL times than for the variants REF and SUF. This corresponds to the torque loss measurements of Morhard et al. [8], where a steep torque loss increase was found for LS7 and vt,C = 40 m/s after approx. 175 s LOL. For speeds vt,C > 52 m/s, the factor XLOL has a reduced influence (cf. Figure 2a). The variant NIT leads to a slightly higher scuffing safety in that speed range, as the LOL factor XLOL is smaller compared to the variant REF. For speeds vt,C > 52 m/s, the variant SUF shows reduced load-dependent gear torque loss due to decreased friction, leading to increased scuffing safeties. The coated variant CO3 shows a significantly increased scuffing safety over the whole speed range. A scuffing safety SintS,LOL < 1.0 is only reached within a speed range of 10 < vt,C < 36 m/s for the LOL time considered of tLOL = 300 s. This corresponds to the LOL tests from Morhard et al. [7,8], but it should be noted that, even though scuffing did not occur, coating wear was observed, which could potentially limit the service life of these coated gears.
4.3. Influence of Gear Geometry
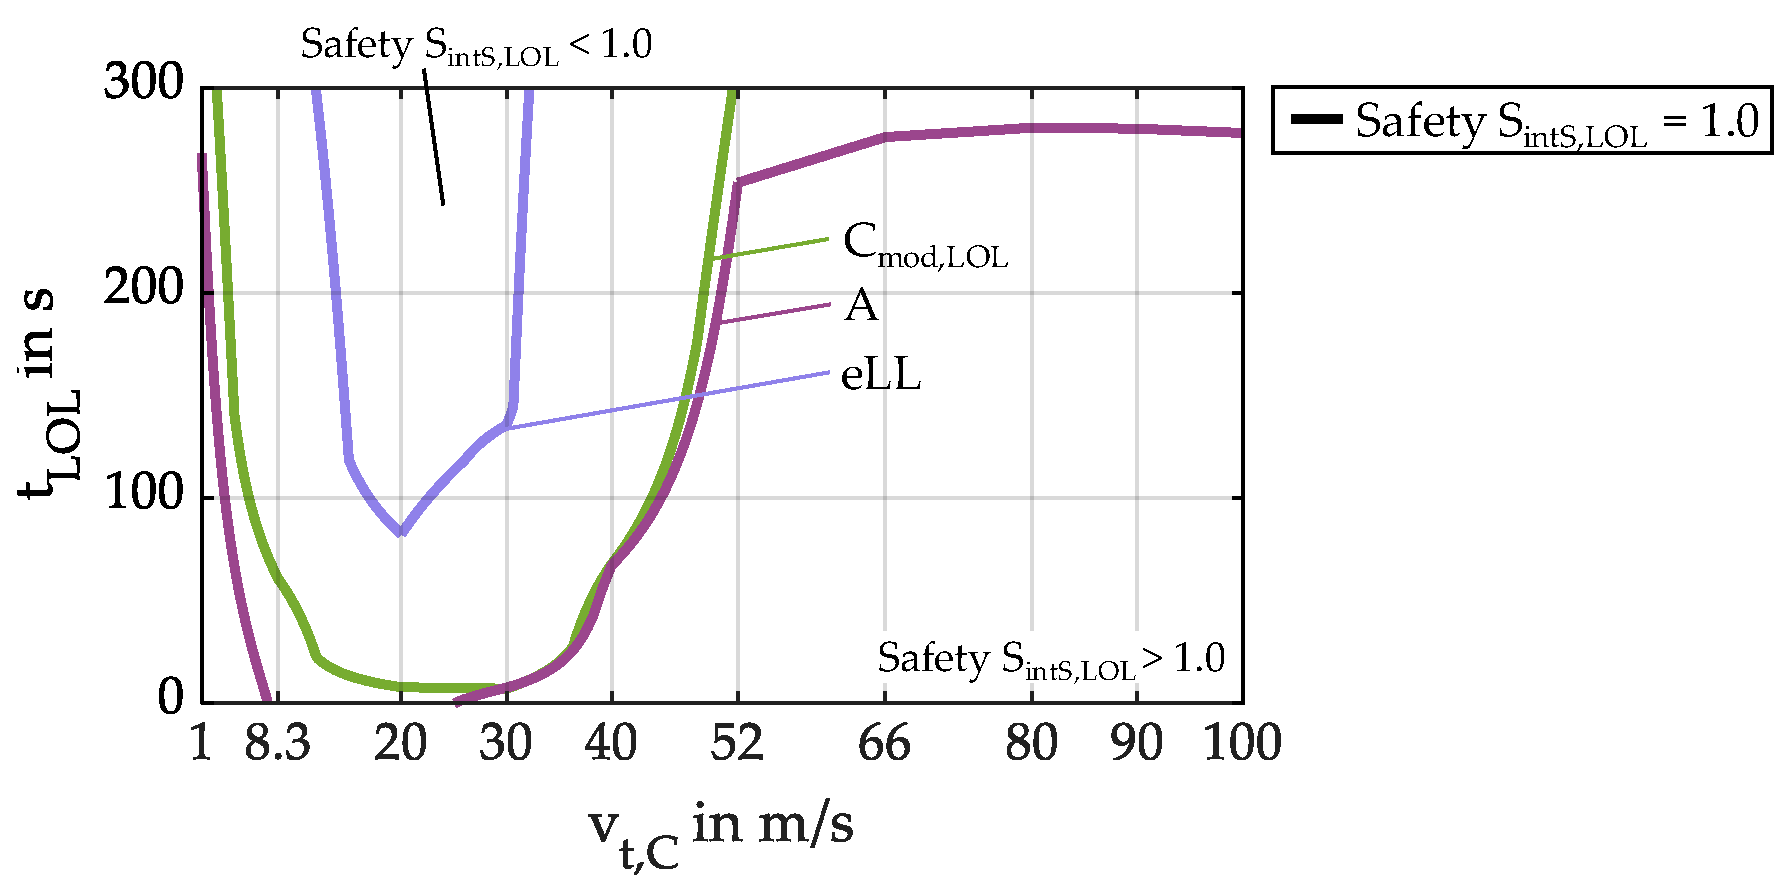
The gear geometry influences the load-dependent gear power loss (cf. Section 3.1) and the scuffing safety. This section presents the influence of the gear geometry exemplarily for the FZG test gears of type Cmod,LOL, A, and eLL. The FZG test gear of type Cmod,LOL features a well-balanced gear geometry, leading to an equally distributed sliding speed along the path of contact. The FZG test gear of type A features a pronounced profile shift, leading to a low sliding speed at the mesh point A and a high sliding speed at the mesh point E. The FZG test gear of type eLL features a low-loss geometry with small teeth and low sliding speeds. In lubricated conditions, the FZG test gear geometry of type eLL has shown strongly reduced load-dependent gear power loss PLGP [55]. Table A1 lists the main gear geometry parameters, and Figure A1 shows the geometry plots of the FZG test gear geometries of type Cmod,LOL, A, and eLL.
Figure 13 shows the calculated scuffing safeties during LOL for the test gear geometries of type Cmod,LOL, A, and eLL.
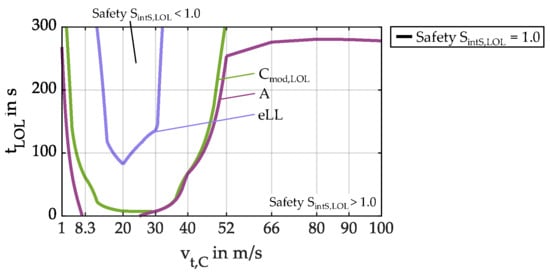
Figure 13.
Scuffing safeties SintS,LOL = 1.0 based on the reference Ref (cf. Table 2) at LS7 with the FZG test gear of type Cmod,LOL, A, and eLL.
The higher sliding speeds of the FZG test gear of type A lead to lower scuffing safety during LOL compared to the FZG test gear of type Cmod,LOL. The FZG test gear of type eLL significantly increases the scuffing safety. For a speed range of 1 < vt,C < 52 m/s, a scuffing safety of SintS,LOL = 1.0 is reached at significantly later LOL times. The found scuffing safeties during LOL show a strong correlation to the geometric tooth power loss factor HV (cf. Section 3.1) of the gear geometries, which are HV = 0.195 for type Cmod,LOL, HV = 0.302 for type A, and HV = 0.066 for type eLL.
4.4. Influence of Oil Type
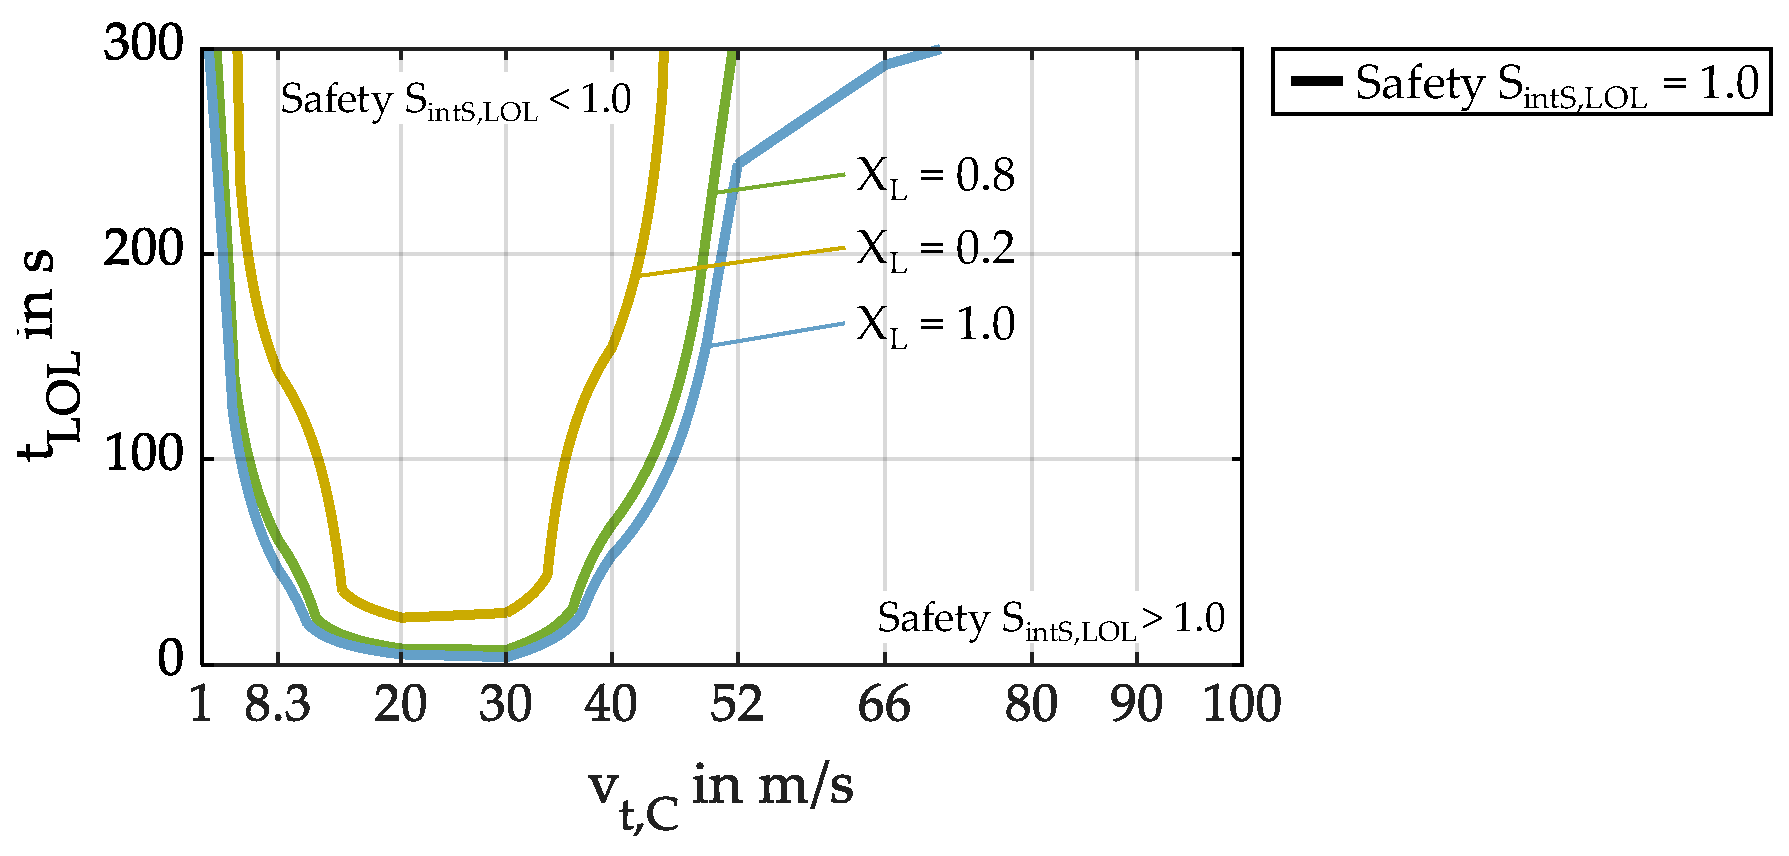
The oil type significantly influences gear friction and is considered for calculating the mean gear coefficient of friction µmZ via the lubricant factor XL (cf. Section 3.1, Equation (2)). In this section, the oil type is varied with XL = {0.2; 0.8; 1;0}. XL = 0.2 could refer to a polyalkylene glycol with functional water content [55], which could be used for a secondary oil supply system as it combines strongly reduced friction and improved cooling capacity. XL = 0.8 refers to the generally in turbines and aviation gears used synthetic ester. XL = 1.0 refers to mineral oil, as it can also be used within turbines [56].
Figure 14 shows the resulting scuffing safeties during LOL for the different lubricant factors. To allow for a comparison of the lubricant factor XL only, the oil properties and the scuffing load stage (LS7) were set accordingly to AeroShell 500 [6].
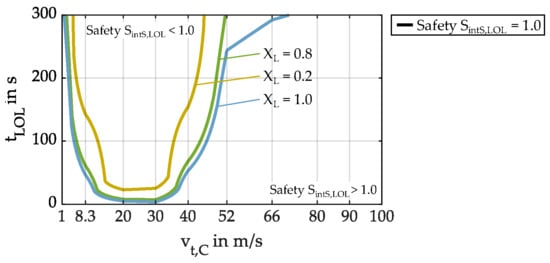
Figure 14.
Scuffing safeties SintS,LOL = 1.0 based on the reference Ref (cf. Table 2) at LS7 with different lubricant factors XL.
The influence of the oil type on the scuffing safety during LOL can be significant. For a lubricant factor, XL = 0.2, friction during LOL is drastically decreased. This leads to a scuffing safety of SintS,LOL = 1.0, that is reached at later LOL times. For a lubricant factor XL = 1.0, the scuffing safety SintS,LOL decreases, leading to slightly shorter LOL times needed until SintS,LOL =1.0 is reached, especially at circumferential speeds ≥ 52 m/s.
4.5. Influence of Oil Viscosity
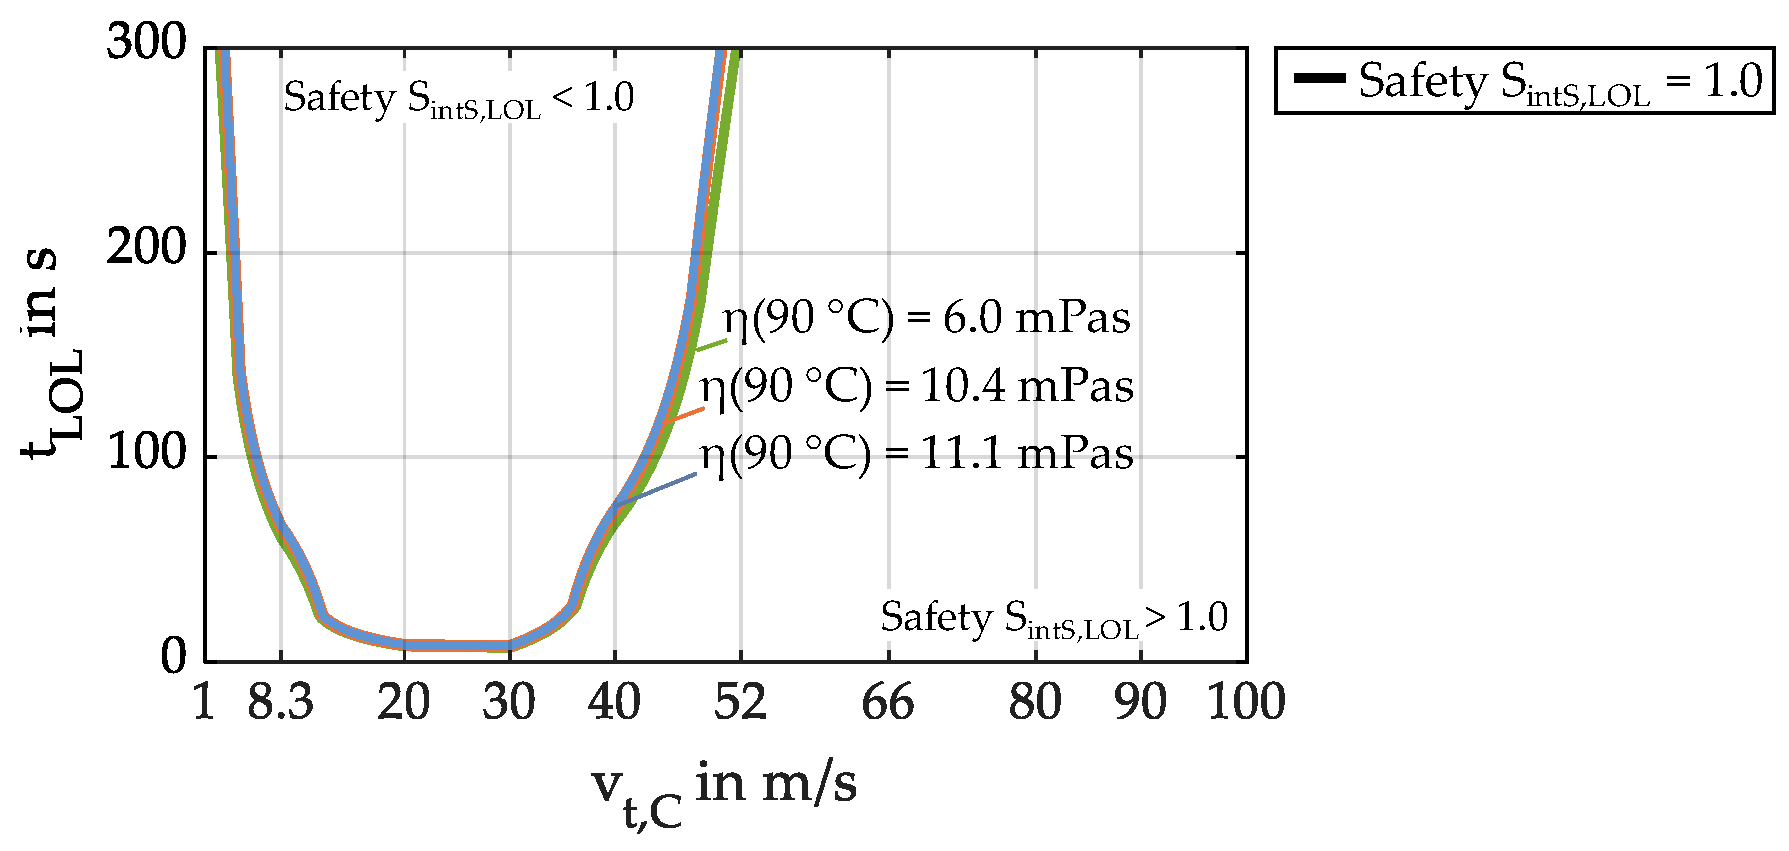
Beneath the oil type, the oil viscosity, respectively, the dynamic oil viscosity η influences the mean gear coefficient of friction µmZ (cf. Section 3.1, Equation (2)). Therefore, the dynamic viscosity is varied in this section with η(90 °C) = {6.0; 10.4; 11.1} mPas based on the tested oil AeroShell 500 with η(90 °C) = 6 mPas [6,7,8], the aviation turbine Oil HALO157 from EASTMAN with η(90 °C) = 10.4 mPas, and the synthetic aviation gear lubricant Mobil AGL from Exxon with η(90 °C) = 11.1 mPas.
Figure 15 shows the resulting scuffing safeties during LOL for the different oil viscosities. The scuffing load stage (LS7) was set accordingly to AeroShell 500 [6].
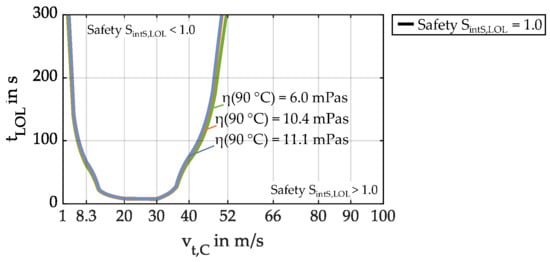
Figure 15.
Scuffing safeties SintS,LOL = 1.0 based on the reference Ref (cf. Table 2) at LS7 with different oil viscosities.
The influence of the oil viscosity is marginal on the scuffing safety during LOL. Generally, a lower viscosity leads to lower friction and increased scuffing safety. On the contrary, the heat transfer of the gear flank surface to the oil–air mixture is slightly increased for a higher viscosity (cf. Equation (9)). This leads to a subordinate influence of oil viscosity on scuffing safety during LOL.
4.6. Influence of Oil Additives
Based on Winter et al. [29], additives greatly influence the scuffing safety. To depict the impact of additives, this section presents the scuffing safeties during LOL for different gradients of the scuffing temperature CS and different scuffing load stages SLS as they could result from adjusted oil additives and their concentration.
Based on Section 3.4, the reference gradient of scuffing temperature is CS|Ref = 18 K/µs. The influence of a weakened scuffing temperature increase is investigated with CS|Var1 = 9 K/µs. The influence of an accelerated scuffing temperature increase is investigated with CS|Var2 = 25 K/µs.
As additives can influence the scuffing load of an oil significantly, an increased scuffing load resulting from an increased scuffing temperature is investigated. Based on scuffing tests of synthetic ester turbine oils from Faruck et al. [3] that had a comparable viscosity to AeroShell500, scuffing load stages SLS7, SLS10, and SLS12 are investigated.
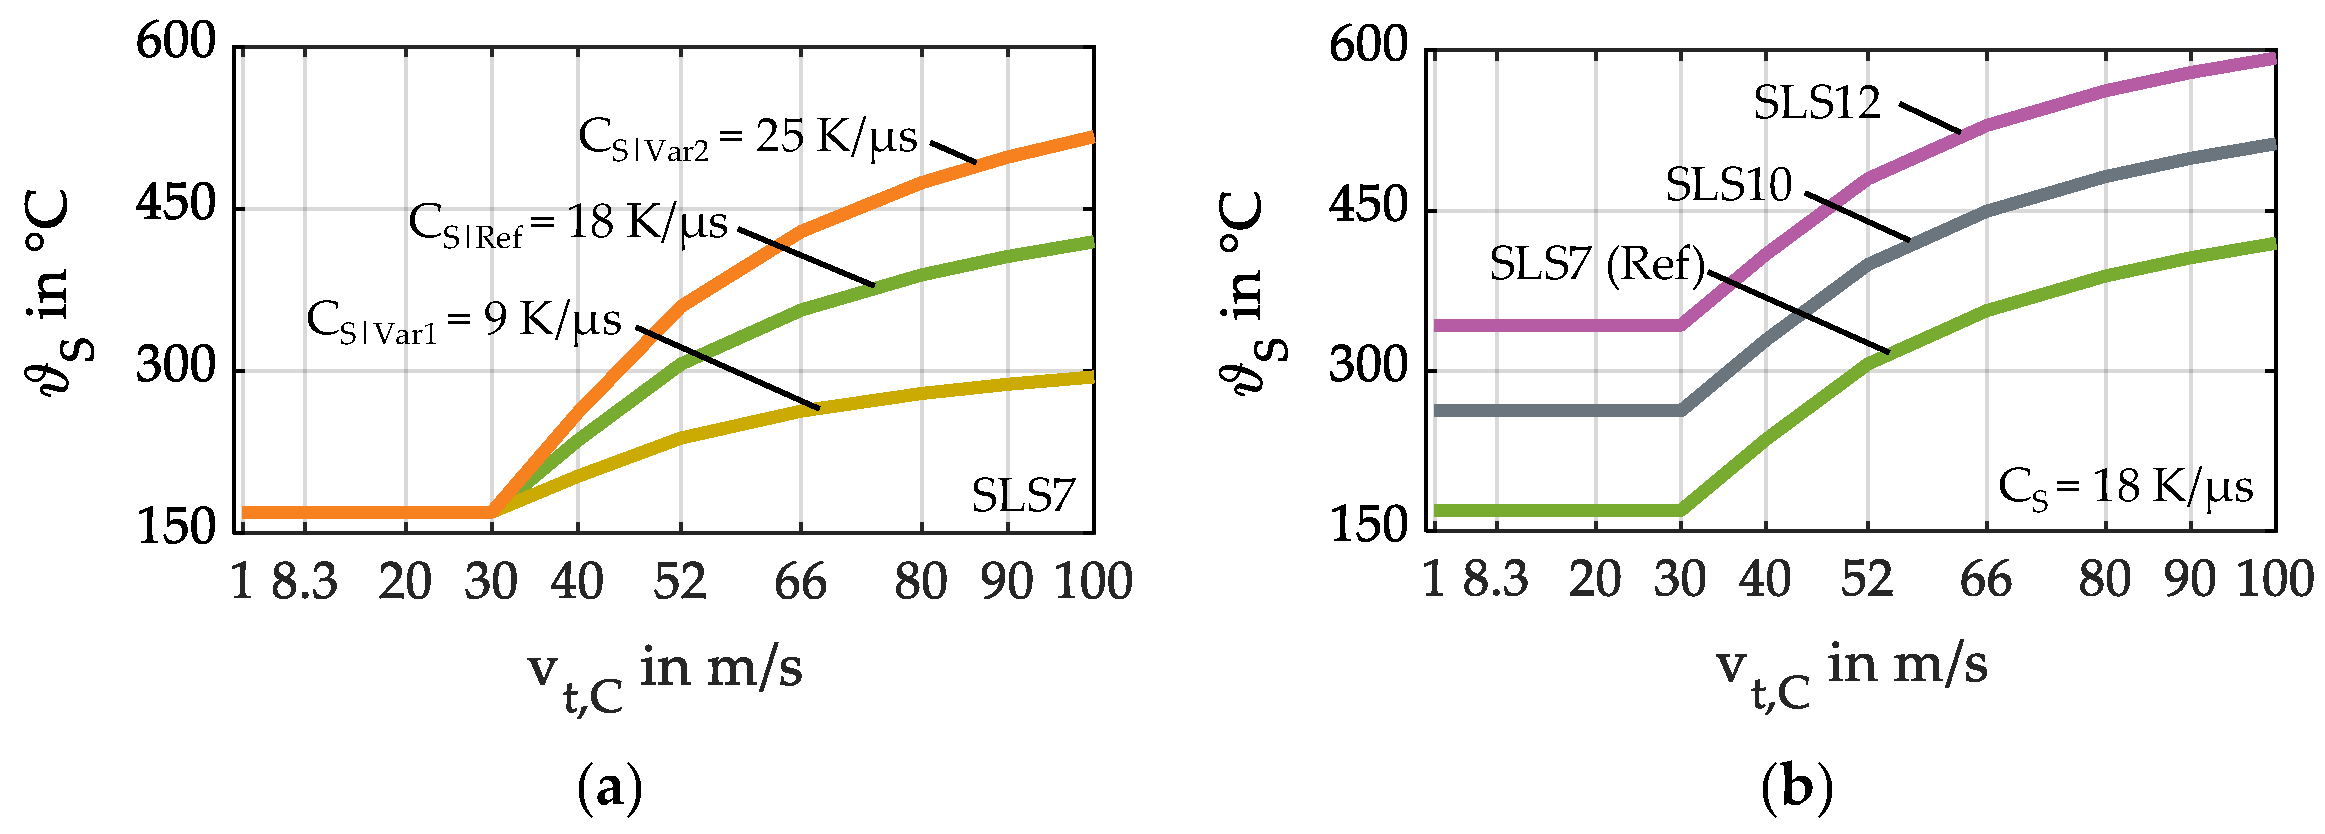
Figure 16a shows the increase in scuffing temperature ϑS for varied gradients of scuffing temperature CS. Figure 16b shows the increase in scuffing temperature ϑS for varied scuffing load stages. Thereby, the gradient of scuffing temperature is set to CS|Ref = 18 K/µs. The physical properties of the oil refer to AeroShell 500.
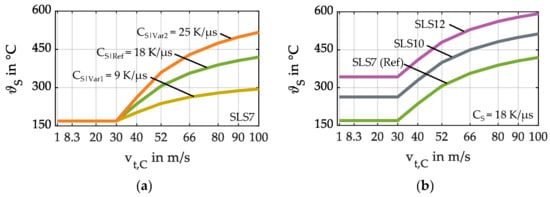
Figure 16.
Scuffing temperature ϑS increases for (a) different gradients of scuffing temperature CS; (b) increased scuffing load stages SLS for oil properties based on AeroShell 500.
As discussed in Morhard et al. [8], the reduced contact time increases scuffing temperatures for circumferential speeds vt,C > 30 m/s, when the contact time at the minimum of the scuffing speed curve is set to 18 µs. For CS = 18 K/µs, the calculated scuffing temperature ϑS increases to approx. 400 °C for vt,C = 100 m/s. With the decreased gradient of scuffing temperature CS to 9 K/µs, the scuffing temperature ϑS increases less and reaches approx. 300 °C for vt,C = 100 m/s. With the increased gradient of the scuffing temperature CS = 25 K/µs, the scuffing temperature ϑS reaches approx. 500 °C for vt,C = 100 m/s.
The increase in scuffing load stage from SLS7 to SLS10 leads to a scuffing temperature increase from 169 °C to 263 °C for low circumferential speeds and to a scuffing temperature increase from 420 °C to 513 °C at vt,C = 100 m/s. A scuffing load stage of SLS12 leads to a scuffing temperature of 343 °C for low circumferential speeds and 593 °C at vt,C = 100 m/s.
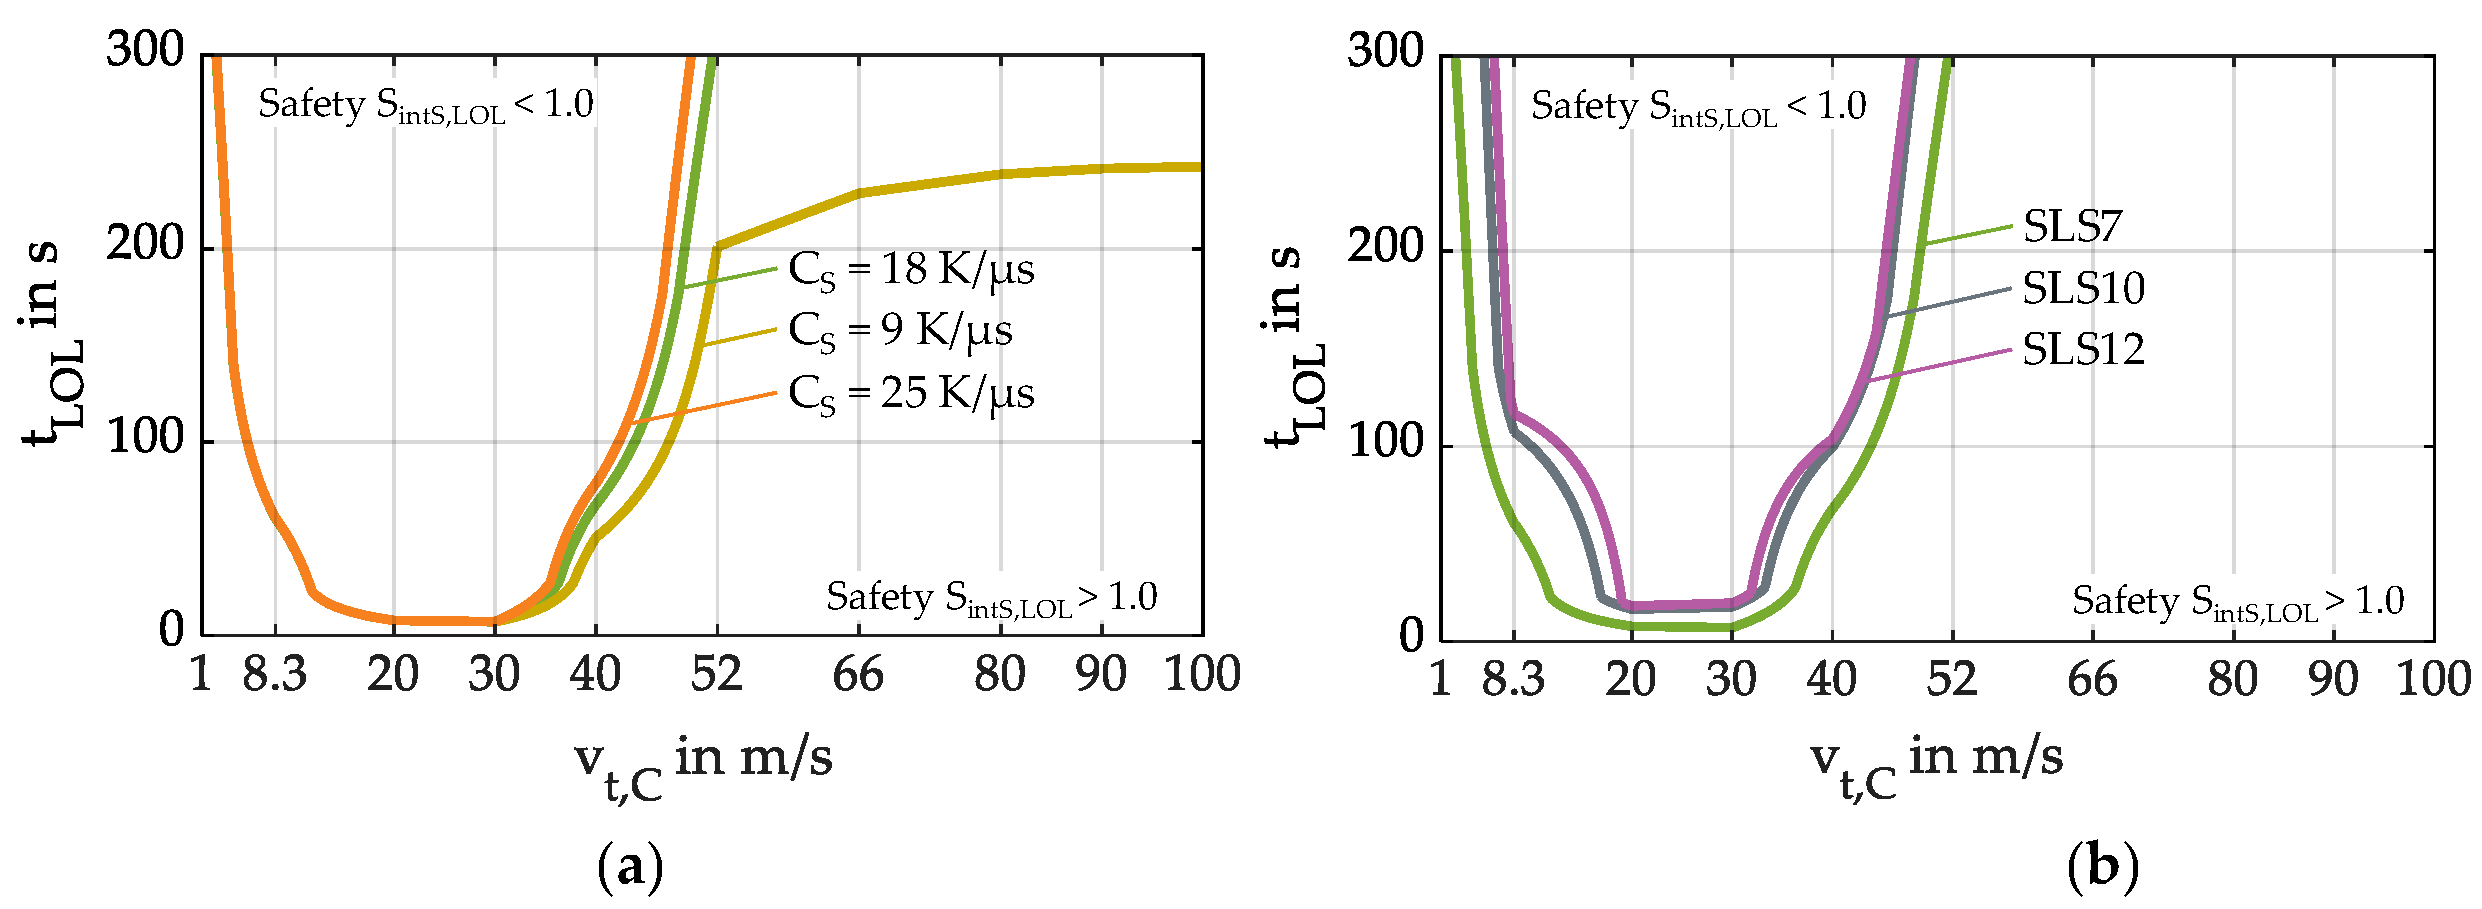
Figure 17a shows the resulting scuffing safeties during LOL for the different gradients of the scuffing temperature CS, and Figure 17b shows the resulting scuffing safeties during LOL for the different scuffing load stages SLS.
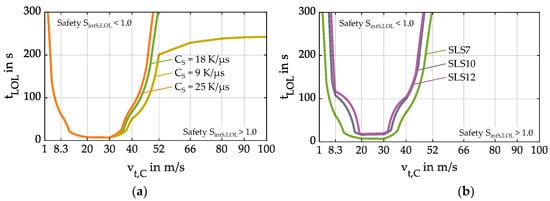
Figure 17.
Scuffing safety SintS,LOL = 1.0 based on the reference Ref (cf. Table 2) at LS7 or (a) different gradients of scuffing temperature CS; (b) different scuffing load stages SLS.
The gradient of scuffing temperature CS significantly influences the scuffing safety during LOL for speeds vt,C > 35 m/s. With CS = 18 K/µs, a scuffing safety SintS,LOL < 1.0 is not reached for speeds vt,C ≥ 52 m/s for the LOL time considered. For the decreased gradient of scuffing temperature to CS = 9 K/µs, the scuffing safeties decrease. For speeds vt,C ≥ 52 m/s, a scuffing safety SintS,LOL < 1.0 is reached after approx. 240 s as the latest. For the increased gradient of scuffing temperature to CS = 25 K/µs, the scuffing safeties SintS,LOL = 1.0 are comparable to CS = 18 K/µs.
The scuffing temperature increase due to increased scuffing load stages leads to significantly increased scuffing safeties, especially for a speed range of 1 ≤ vt,C ≤ 52 m/s. This effect is more pronounced for a scuffing load stage increase from SLS7 to SLS10.
5. Discussion
Section 5.1 discusses the results of the calculation study from Section 4.1, Section 4.2, Section 4.3, Section 4.4, Section 4.5 and Section 4.6 and elaborates on the main parameters influencing LOL performance. In Section 5.2 the calculation method and the results are reflected.
5.1. Classification of Influencing Factors on LOL Performance
This section classifies and compares the results presented in the calculation study of Section 4.1, Section 4.2, Section 4.3, Section 4.4, Section 4.5 and Section 4.6 for the considered LOL time of tLOL = 300 s and speed range of 1 ≤ vt,C ≤ 100 m/s. Thereby, the scuffing safeties are compared to the reference Ref (cf. Section 3.5, Table 2, and Figure 8a). The mean reference scuffing safety ØSRef is derived as a single characteristic value by averaging the calculated scuffing safeties of the reference SintS,LOL|Ref for tLOL = 1–300 s and vt,C = 1–100 m/s:
The mean scuffing safeties of the variations in the calculation study ØSVar, are derived the same way:
The mean scuffing safeties are then compared to derive the relative mean scuffing safety Srel:
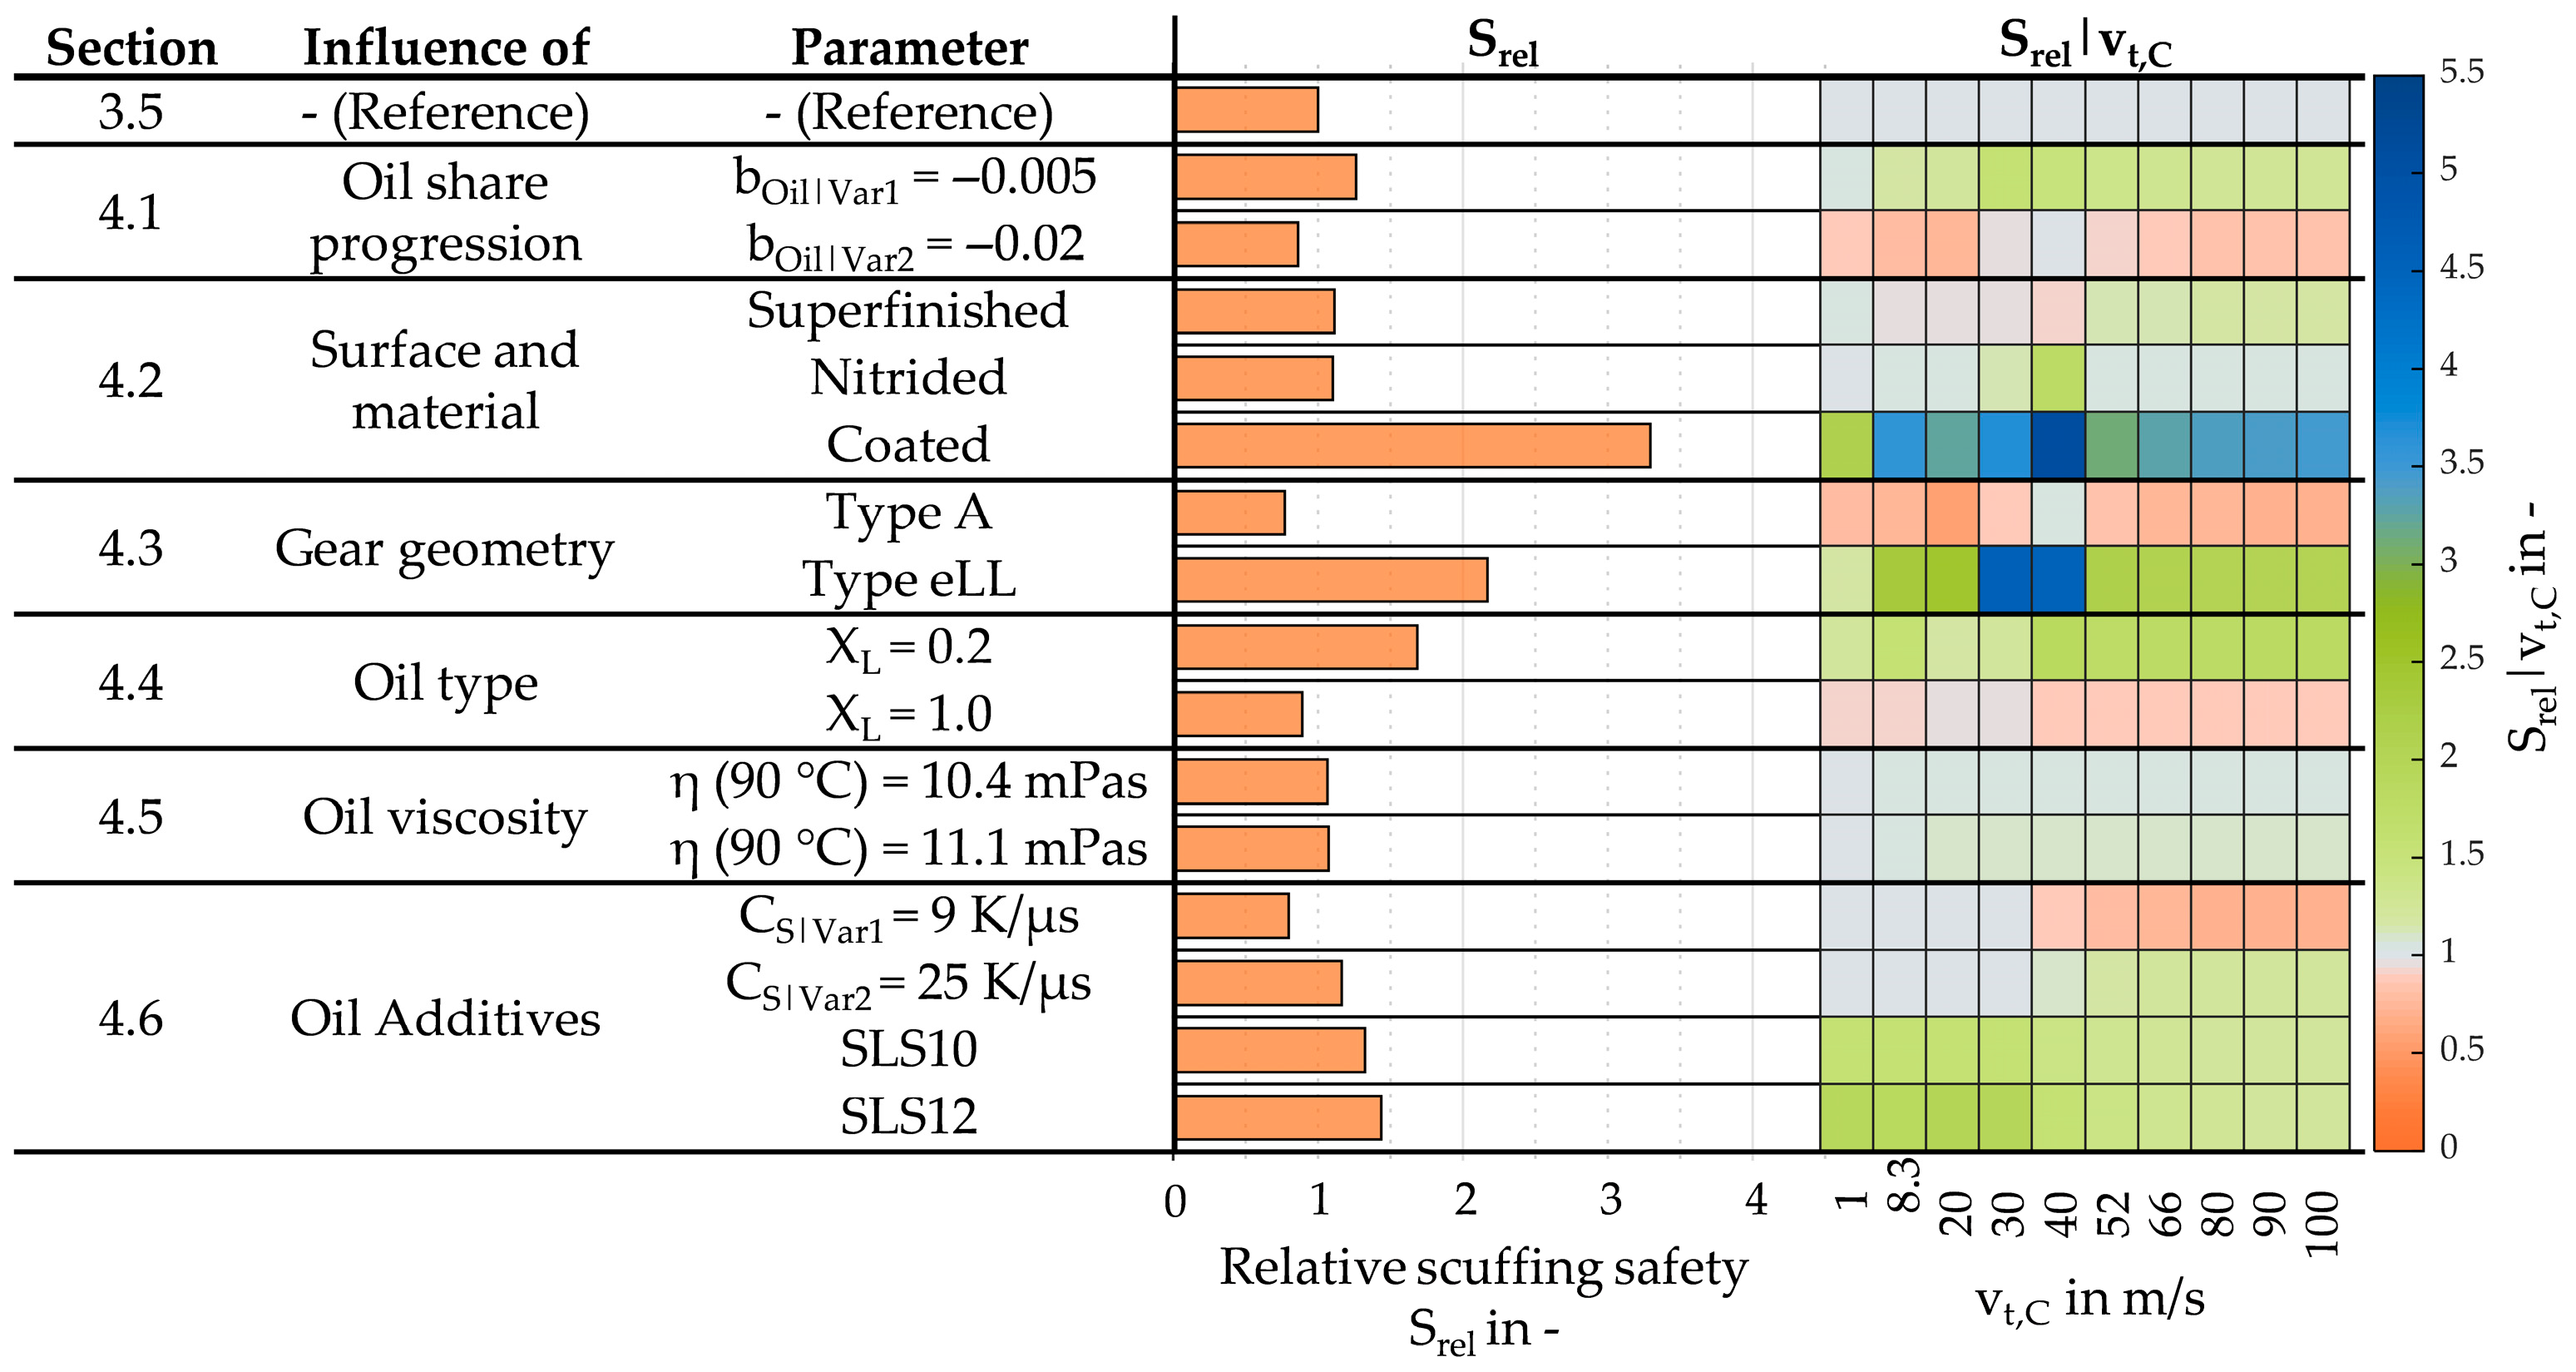
Figure 18 shows the resulting relative mean scuffing safeties Srel for the calculation study variants from Section 4.1, Section 4.2, Section 4.3, Section 4.4, Section 4.5 and Section 4.6. Srel is enhanced by the influenced speed range Srel|vt,C for discrete speeds vt,C according to the following:
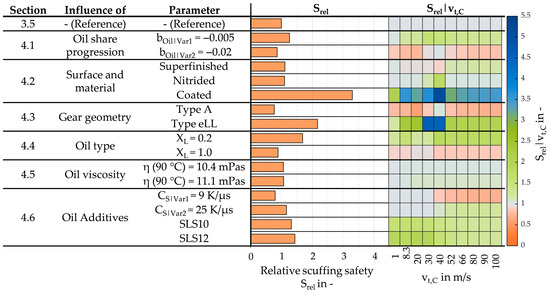
Figure 18.
Summary of the relative mean scuffing safeties Srel during LOL and the influenced speed range Srel|vt,C for the variations in the calculation study presented in Section 4.1, Section 4.2, Section 4.3, Section 4.4, Section 4.5 and Section 4.6 at LS7 and ϑOil = 90 °C. (The ‘Reference’ includes the oil share progression bOil|Ref = −0.01, surface and material REF, gear geometry Cmod,LOL, lubricant factor XL = 0.8, oil viscosity η (90 °C) = 6.0 mPas, CS = 18 K/µs, and SLS7 according to Table 2).
The reference (cf. Section 3.5) shows a strong dependency of the LOL time tLOL, and a strong dependency of the circumferential speed vt,C. For low speeds in the range of 8.3 ≤ vt,C < 40 m/s, the scuffing safety decreases significantly and reaches safeties < 1.0 within the margin of seconds. For speeds 52 ≤ vt,C ≤ 100 m/s, the scuffing safety is generally higher and does not fall below scuffing safeties < 1.0 within the considered LOL time of 300 s. According to Equation (29), the relative mean scuffing safeties Srel and Srel|vt,C are 1.0 over the entire speed range.
Varied oil share progressions (cf. Section 4.1) influence gear bulk temperatures and scuffing safety during LOL. This demonstrates that, as reported in the literature [2,15,18,19], an increased availability of residual lubricant can extend the LOL time before scuffing occurs. An increased oil share increases scuffing safeties almost for the entire speed range and leads to Srel = 1.3. A decreased oil share decreases scuffing safeties at low to medium and high speeds, leading to Srel = 0.9.
The choice of surface and material (cf. Section 4.2) can have a significant impact on scuffing safety during LOL. Superfinishing reduces scuffing safeties in the medium speed range, but increases it at higher speeds as friction is reduced. The relative mean scuffing safety Srel increases slightly to 1.1. Nitriding increases scuffing safety at medium speeds. The relative mean scuffing safety Srel increases slightly to 1.1. Coatings can most effectively increase scuffing safety as they can prevent scuffing. This has the greatest effect on medium and very high speeds. The relative mean scuffing safety Srel increases significantly to 3.3. Note that coating durability and wear are not considered in this evaluation.
The gear geometry (cf. Section 4.3) can significantly influence the scuffing safety progression during LOL as sliding speeds can be decreased or increased. The FZG test gear of type A increases sliding speeds and reduces scuffing safeties at medium and high speeds. This results in a reduced relative mean scuffing safety of Srel = 0.8. The low-loss gear geometry eLL remarkably increases scuffing safety due to reduced sliding speeds, leading to an increased relative mean scuffing safety of Srel = 2.2.
The oil type (cf. Section 4.4) has a significant influence on the friction coefficients. Reduced gear friction, represented by a lubricant factor of XL = 0.2, significantly increases scuffing safety and leads to an increase in relative mean scuffing safety to Srel = 1.7. Increased gear friction, represented by a lubricant factor of XL = 1.0, decreases scuffing safety at low and higher speeds and leads to a decreased relative mean scuffing safety of Srel = 0.9.
Increased oil viscosities (cf. Section 4.5) increase gear friction, but also increase heat transfer. Therefore, synthetic esters with increased viscosities can slightly increase scuffing safety. This effect is more pronounced at higher speeds, leading to a relative mean scuffing safety of Srel = 1.1.
Oil additives (cf. Section 4.6) can significantly increase the scuffing temperature. The gradient of the scuffing temperature CS has a significant influence on the scuffing safety at higher speeds when contact times are short. A decreased gradient of scuffing temperature decreases the relative mean scuffing safety to Srel = 0.8. An increased gradient of scuffing temperature increases the relative mean scuffing safety to Srel = 1.2. Increased scuffing load stages significantly increase scuffing safeties over the whole speed range. Increased scuffing load stages to SLS10 and SLS12 lead to increased relative mean scuffing safeties of Srel = 1.3 and 1.4.
To conclude, an increased oil share during LOL, coatings, a low-loss gear geometry, low-friction oils, and oils with a high scuffing load stage are effective measures to improve the LOL performance, whereas coatings and a low-loss gear geometry can increase scuffing safeties for most. To avoid early scuffing failure during LOL, the oil share should remain on the highest possible level, high sliding speeds resulting from unfavorable gear geometry should be avoided, and oils with no or no remarkable scuffing temperature increase at high speeds should not be used. Even though the discussed measures can increase scuffing safeties during LOL, decreasing scuffing safeties in a speed range of approx. 8 < vt,C < 40 m/s are hardly avoidable for higher LOL times.
5.2. Reflection
The aim of this study is to support the design of gears against LOL. To account for early design phases with a restricted amount of input data, simplifications are needed. This section reflects the calculation method and results, and discusses the limitations of the study.
Circumferential speed is a main influence on scuffing safety progression during LOL. The speed factor av (Section 3.1, Equation (5)) considers the influence of speed on the gear friction increase found in LOL tests by Morhard et al. [6,7,8], which were performed with the turbine oil AeroShell 500. Oil centrifugation at circumferential speeds up to approx. vt,C = 30 m/s has been proposed to increase torque loss and the risk of scuffing, since the amount of oil available for lubrication on the gear flanks is reduced [6,8]. However, the effect of rising gear friction in that speed range might differ for oils with different viscosities. For speeds vt,C > 40 m/s, no increase in torque loss was observed for LS7 [8]. Hildebrand et al. [57] demonstrated via CFD that, for non-immersed gears, airflow breaks up the oil sump at a specific threshold speed. This leads to the homogenization of the oil distribution inside the housing. This oil homogenization could explain the constant torque loss during LOL at higher speeds. Different oils with different viscosities might influence the oil shares in the oil–air mixture and the adhesion to the gear surfaces. This would affect the heat transfer and fluid film formation during LOL. Different oils and different viscosities might show a different speed-dependent gear friction increase during LOL. Therefore, future research on LOL with different oil types could lead to a better understanding of the speed-dependent increase in gear friction during LOL. To improve the accuracy of the model, the speed factor av could be adjusted based on new findings.
Bulk temperature is crucial for scuffing safety during LOL. The approach selected for calculating gear bulk temperatures during LOL is based on the assumption of a decreasing oil share during LOL and the associated heat transfer of the gear surface to the surrounding oil–air mixture (cf. Section 3.2). The assumed oil share progression (cf. Equation (16)) resulted in calculated bulk temperatures during LOL that aligned well with gear bulk temperature measurements from Morhard et al. [6] (cf. Figure 6). As the oil share progression during LOL was assumed based on temperature measurements from Collenberg [20], future work could focus on assessing the oil share progression during LOL. This could be achieved using CFD. However, the simulation effort may be high, as the oil share progression during LOL is affected by speed and LOL time. With a better understanding of the oil share progression during LOL, Equation (16) could be adjusted accordingly. Additionally, a thermal network model could be used to improve calculation accuracy by assessing not only the heat flow from the gear surface to the surrounding oil–air mixture, but also the heat flow from the gear bulk to the shafts, bearings, and housing.
The impact of the gear surface and the material on the scuffing safety during LOL is considered by the material factor aMat (cf. Section 3.3). The coated variant CO3 avoided scuffing during LOL tests but showed coating wear [7,8]. Even though scuffing was avoided for the LOL time considered, continuous wear over lifetime and, in consequence, a resulting scuffing event during LOL, are not considered in the calculation method. The remarkable scuffing safety increase for the variant CO3 should therefore be understood as a measure with high potential, but it has to be ensured that the coating does not wear out under design conditions.
6. Conclusions
This study proposes a calculation method for determining the scuffing safety of cylindrical gears facing loss of lubrication. The related factors were developed and integrated into the scuffing safety calculation of the integral temperature method according to ISO/TS 6336-21. The results were validated using the loss of lubrication test results from Morhard et al. [6,7,8]. A calculation study was conducted to assess the factors influencing loss of lubrication performance. The following conclusions can be drawn:
- The oil share during loss of lubrication should be kept at the highest possible level by taking constructive measures, as this increases the heat transfer and reduces bulk temperatures.
- DLC coatings offer the greatest potential for avoiding scuffing during loss of lubrication. However, the coating’s durability under design conditions must be ensured.
- A low-loss gear geometry is a promising solution for significantly improving the loss of lubrication performance, as sliding speeds are considerably reduced and scuffing safety is increased.
- The oil type can significantly influence the loss of lubrication performance when low friction is enabled. The viscosity itself has a subordinate influence.
- Oil additives can significantly increase loss of lubrication performance due to increased scuffing temperatures.
- A speed range of approx. 8 < vt,C < 40 m/s should be avoided, as the measures presented were unable to prevent a rapid decrease in scuffing safety within this speed range.
The proposed calculation method for cylindrical gears facing loss of lubrication can be used at an early design stage to evaluate the scuffing safety and to assess measures to improve the loss of lubrication performance. To improve the accuracy of the method, the oil share of the surrounding fluid flow and its impact on lubricant film formation during LOL should be better understood. CFD could be a suitable tool for this purpose. Additionally, the model could be validated for additional loads, gear geometries, lubricant types, and viscosities.
Author Contributions
Conceptualization, B.M.; methodology, B.M. and T.L.; software, B.M.; validation, B.M. and T.L.; formal analysis, B.M. and T.L.; investigation, B.M. and T.L.; resources, B.M.; data curation, B.M.; writing—original draft preparation, B.M.; writing—review and editing, B.M. and T.L.; visualization, B.M.; supervision, T.L. and K.S.; project administration, T.L. and K.S.; funding acquisition, T.L. and K.S. All authors have read and agreed to the published version of the manuscript.
Funding
The presented own work from the authors has received funding from the Clean Sky 2 Joint Undertaking (JU) under grant agreement No. 101007713. The JU received support from the European Union’s Horizon 2020 research and innovation program and the Clean Sky 2 JU members other than the Union. Views and opinions expressed are, however, those of the author(s) only and do not necessarily reflect those of the JU. Neither the European Union nor Clean Sky 2 JU can be held responsible for them.
Data Availability Statement
The data presented in this study are available on request from the corresponding author.
Acknowledgments
The authors would like to thank for the sponsorship and support received from the Clean Sky 2 Joint Undertaking. Many thanks go to all LUBGEAR project partners for the great collaboration and support.
Conflicts of Interest
The authors declare no conflicts of interest.
Nomenclature
| a | Center distance | mm |
| aMat | Material factor for loss of lubrication | - |
| aMat,REF | Material factor for loss of lubrication for case-hardened ground gears | - |
| aMat,SUF | Material factor for loss of lubrication for superfinished gears | - |
| aMat,CO3 | Material factor for loss of lubrication for coated gears | - |
| aMat,NIT | Material factor for loss of lubrication for nitrided gears | - |
| ap | Load factor for loss of lubrication | - |
| av | Speed factor for loss of lubrication | - |
| A | Starting point of meshing | - |
| b | Face width | mm |
| bOil | Factor for oil share decrease during LOL | - |
| B | Starting point of single tooth contact on driving gear | - |
| C | Pitch point | - |
| Ca | Tip relief | μm |
| CS | Gradient of the scuffing temperature | K/µs |
| C2 | Weighting factor | - |
| da1/2 | Tip diameter pinion/wheel | mm |
| db1/2 | Base diameter pinion/wheel | mm |
| dw1/2 | Pitch diameter pinion/wheel | mm |
| D | End point of single tooth contact point on driving gear | - |
| E | End point of meshing | - |
| Fbt | Tangential force at the base circle | N |
| FPi | Active surface of pinion | mm2 |
| FW | The tooth flank surface determining the heat transfer | mm2 |
| FWe | Active surface of wheel | mm2 |
| hc | Heat transfer coefficient | kcal/(mm2 s grd) |
| hmix | Heat transfer coefficient of oil air mixture | W/(m2 K) |
| hmix,LOL | Heat transfer coefficient of oil air mixture during LOL | W/(m2 K) |
| HV(L) | (Local) geometric tooth power loss factor | - |
| i | Transmission ratio | - |
| KBγ | Helical load factor | - |
| mn | Normal module | mm |
| pC | Hertzian pressure at the pitch point C | N/mm2 |
| pHm | Mean Hertzian pressure | kp/mm2 |
| Pin | Input power | W |
| PLGP | Load-dependent gear power loss | W (kcal/s for approach of Seitzinger [31]) |
| Pr | Prantl number | - |
| Q | Amount of lubricant (Volume flow rate) | L/min |
| q | Factor for heat transfer to the lubricant at the tooth flank surface and the face side | - |
| rC | Radius of pitch point C (wheel) | m |
| Ra | Arithmetic mean flank roughness | µm |
| Re | Reynolds number | - |
| SB | Scuffing safety factor (ISO/TS 6336-20) | - |
| SB,LOL | Scuffing safety factor for loss of lubrication based on ISO/TS 6336-20 | - |
| SintS | Scuffing safety factor (ISO/TS 6336-21) | - |
| SintS,LOL | Scuffing safety factor for loss of lubrication based on ISO/TS 6336-21 | - |
| SRef | Mean scuffing safety of the reference | - |
| SVar | Mean scuffing safety of variant | - |
| Srel | Relative scuffing safety | - |
| Srel|vt,C | Relative scuffing safety for discrete speeds vt,C | - |
| tC | Contact time | µs |
| tK | Contact time at the minimum of the scuffing speed curve | µs |
| Tin | Input torque | Nm |
| TLGP | Load-dependent gear torque loss | Nm |
| TLGP,LOL | Load-dependent gear torque loss during loss of lubrication | Nm |
| T1/T2 | Contact points of tangent (lines of engagement) at base circle | - |
| v | Reference line velocity | m/s |
| vgm | Mean sliding speed over the path of contact | m/s |
| vt,C | Circumferential speed at the pitch point C | m/s |
| v∑C | Sum speed at the pitch point C | m/s |
| wBt | Transverse unit load (ISO 6336-20)/ | N/mm |
| Specific tooth load (ISO 6336-21) | N/mm | |
| x1/2 | Profile shift coefficient | - |
| xi | Factor for the transmission ratio i | - |
| Xb | Factor for face width | - |
| XBE | Geometry factor at pinion tooth tip | - |
| XCa | Tip relief factor | - |
| XE | Run-in factor | - |
| XG | Geometry factor | - |
| XJ | Approach factor | - |
| XL | Lubricant factor | - |
| XLOL | Loss of lubrication factor | - |
| XM | Thermo-elastic factor (ISO 6336-20)/ | K∙N−3⁄4∙s1⁄2∙m−1⁄2∙mm/ |
| Themal flash factor (ISO 6336-21) | - | |
| XQ | Factor for the amount of oil/ | -/ |
| Approach factor (ISO 6336-21) | - | |
| XT | Factor considering the oil temperature (=1 for 90 °C) | - |
| XWrelT | Relative welding factor | - |
| Xαβ | Pressure angle ratio factor | - |
| XΓ | Load sharing factor | - |
| Xε | Contact ratio factor | - |
| z1/2 | number of teeth pinion/wheel | - |
Greek Symbols
| αn | Pressure angle | ° |
| αOil | Volumetric share of oil | - |
| αOil,Ref | Reference volumetric share of oil | - |
| αOil,Var1/2 | Volumetric share of oil of variant 1/2 | - |
| αsb | Working pressure angle | ° |
| β | Helix angle | ° |
| βg | Helix angle at base circle | ° |
| ε1/2 | Addendum contact ratio of the pinion/wheel | - |
| εα | Transverse contact ratio | - |
| εβ | Overlap ratio | - |
| η | Dynamic viscosity | mPas |
| ϑbmax | Maximum contact temperature | °C |
| ϑbmax,LOL | Maximum contact temperature for loss of lubrication | °C |
| ϑfl | Flash temperature | K |
| ϑfl,LOL | Flash temperature for loss of lubrication | K |
| ϑflaint | Mean flash temperature | K |
| ϑflaint,LOL | Mean flash temperature for loss of lubrication | K |
| ϑflaE | Flash temperature at pinion tooth tip when load sharing is neglected | K |
| ϑflaE,LOL | Flash temperature for loss of lubrication at pinion tooth tip when load sharing is neglected | K |
| ϑflmax | Maximum flash temperature | K |
| ϑflmax,LOL | Maximum flash temperature for loss of lubrication | K |
| ϑint | Integral temperature | °C |
| ϑint,LOL | Integral temperature for loss of lubrication | °C |
| ϑintS | Scuffing integral temperature | °C |
| ϑS | Scuffing temperature | °C |
| ϑSC | Constant scuffing temperature at long contact times | °C |
| ϑM | Bulk temperature | °C |
| ϑM,LOL | Bulk temperature during LOL | °C |
| ϑOil | Oil injection temperature | °C |
| ϑOver | Overtemperatuer | °C |
| λ | Thermal conductivity | W/(mK) |
| μmZ | Mean gear coefficient of friction | - |
| μmZ,LOL | Mean gear coefficient of friction during loss of lubrication | - |
| ν | Kinematic viscosity | mm2/s |
| ρredC | Relative curvature at the pitch point | mm |
| ρ | Density | kg/m3 |
| φavr | Physical properties of an averaged oil/air fluid flow | - |
| φavr,LOL | Physical properties of an averaged oil/air fluid flow during loss of lubrication | - |
| φoil/air | Physical properties of oil/air | - |
Abbreviations
| A | FZG test gear geometry “A” |
| CFD | Computational fluid dynamics |
| Cmod,LOL | FZG test gear geometry “Cmod,LOL” |
| eLL | FZG test gear geometry “extreme Low Loss” |
| EP | Extreme pressure |
| IL | Injection lubrication |
| ISO VG 46 | Oil “ISO VG 46” |
| LOL | Loss of lubrication |
| LS | Load stage |
| SLS | Scuffing load stage |
Appendix A
Table A1 lists the FZG test gear geometry parameters that were investigated within this study.

Table A1.
FZG test gear geometry parameters.
Table A1.
FZG test gear geometry parameters.
| Test Gear Geometry | Cmod,LOL [6] | A [52] | eLL [55] | |||
|---|---|---|---|---|---|---|
| Pinion | Wheel | Pinion | Wheel | Pinion | Wheel | |
| Number of teeth | 16 | 24 | 16 | 24 | 39 | 52 |
| Normal module mn in mm | 4.5 | 4.5 | 1.81 | |||
| Pressure angle αn in ° | 20 | 20 | 36 | |||
| Helix angle β in ° | - | - | 25 | |||
| Transverse contact ratio εα | 1.436 | 1.361 | 0.65 | |||
| Overlap ratio εβ | - | - | 2.08 | |||
| Face width b in mm | 14 | 20 | 28 | |||
| Center distance a in mm | 91.5 | 91.5 | 91.5 | |||
| Tip diameter da1/2 | 82.45 | 118.35 | 88.77 | 112.5 | 80.6 | 106.5 |
| Profile shift coefficient x1/2 | 0.182 | 0.171 | 0.853 | −0.5 | 0.183 | 0.168 |
| Tip relief Ca in μm | 35 | 35 | - | - | - | - |
| Geometric tooth power loss factor HV for LS7 | 0.195 | 0.302 | 0.066 | |||
| Arithmetic mean flank roughness Ra in µm | 0.29 | 0.29 | 0.29 | |||
Figure A1 shows geometry plots of the considered FZG test gear geometries of type Cmod,LOL, A, and eLL.
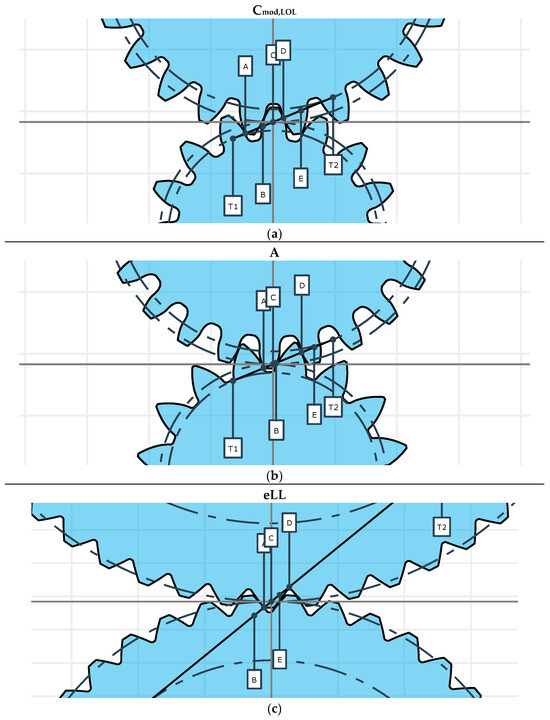
Figure A1.
Geometry plots of the considered FZG test gear of type (a) Cmod,LOL; (b) A; (c) eLL.
Figure A1.
Geometry plots of the considered FZG test gear of type (a) Cmod,LOL; (b) A; (c) eLL.
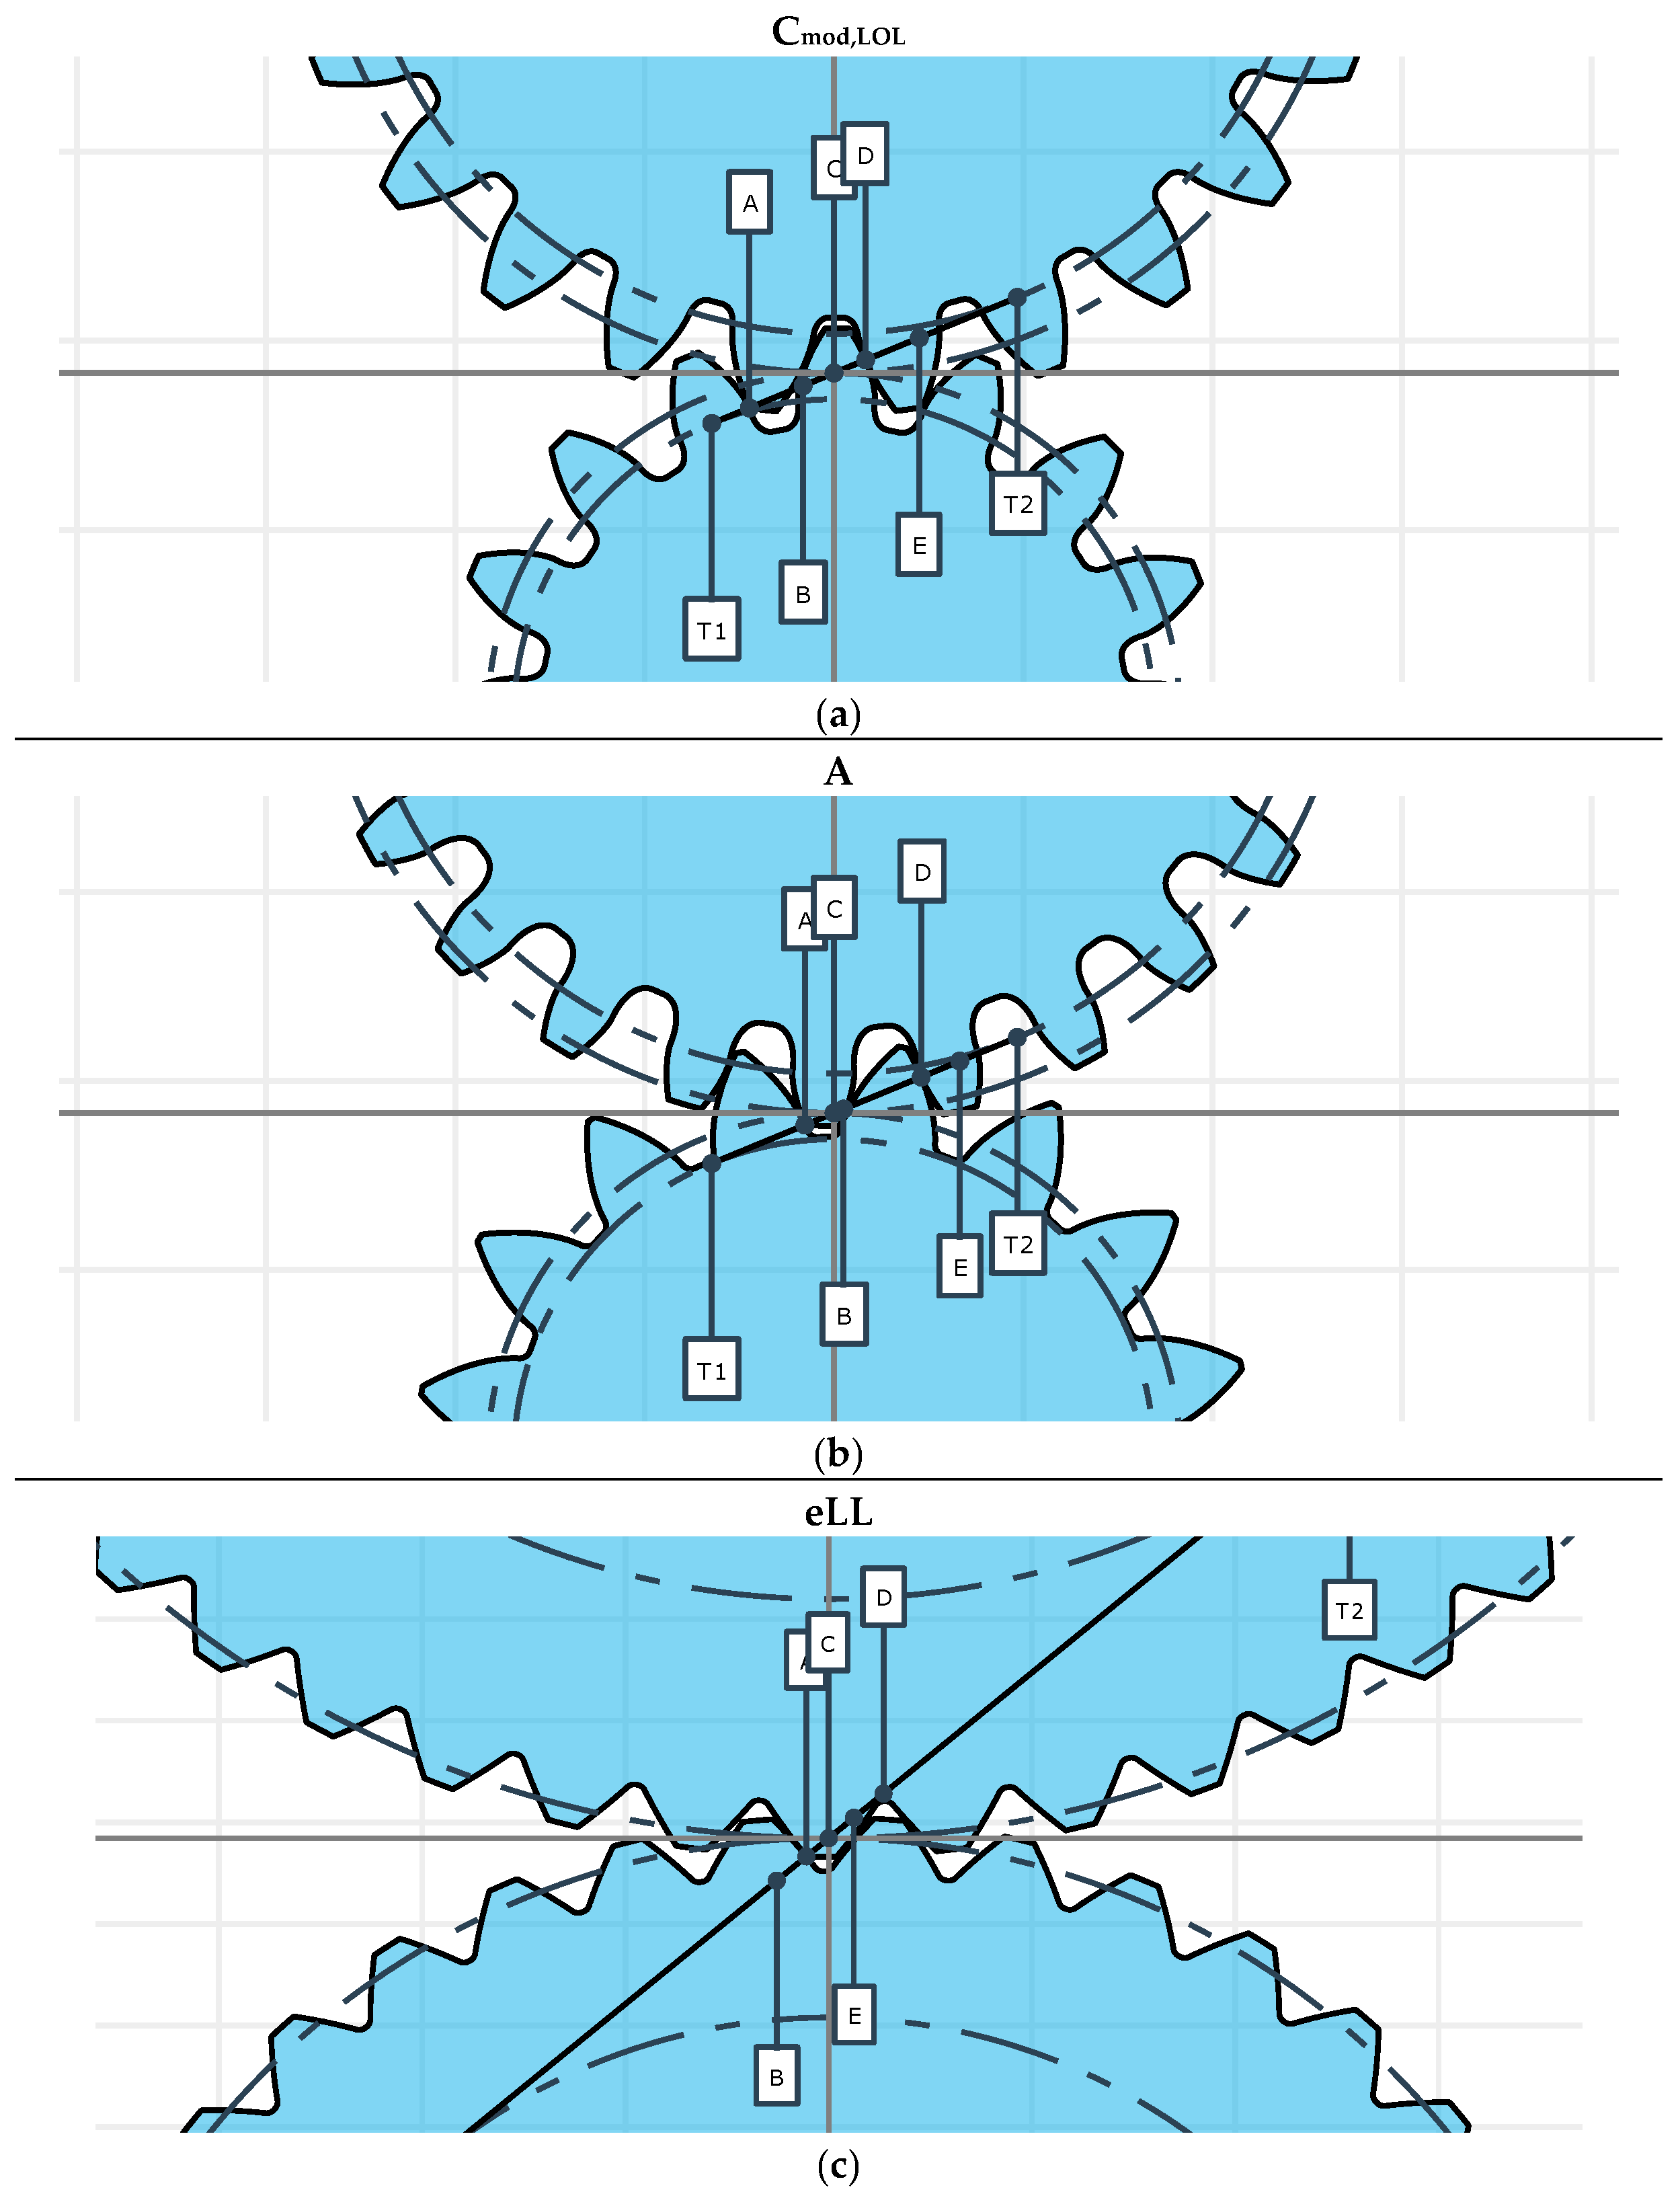
The FZG test gear of type Cmod,LOL features a well-balanced gear geometry, leading to an equally distributed sliding speed along the path of contact. The FZG test gear of type A features a pronounced profile shift, leading to a low sliding speed at the beginning of contact A and a high sliding speed at the end of contact E. The FZG test gear of type eLL features a low-loss geometry with small teeth and low sliding speeds. In lubricated conditions, the FZG test gear geometry of type eLL has shown strongly reduced load-dependent gear power loss PLGP [55].
Appendix B
Table A2 lists the lubricants that were investigated within this study.

Table A2.
Lubricants considered in this study.
Table A2.
Lubricants considered in this study.
| Oil | ISO VG 46 | AeroShell500 [6,58] | HAL0157 [59] | Mobil AGL [60] |
|---|---|---|---|---|
| ν(40 °C) in mm2/s | 46.0 | 23.0 | 52.8 | 68.0 |
| ν(100 °C) in mm2/s | 7.0 | 5.2 | 8.9 | 10.9 |
| ρ(15 °C) in kg/m3 | 860 | 1005 | 986 | 857 |
| η(90 °C) in mPas | 7.2 | 6.0 | 10.4 | 11.1 |
| Lubricant factor XL | 1.0 | 0.8 | 0.8 | 0.8 |
Appendix C
Table A3 lists the FZG load stages and their corresponding torques.

Table A3.
FZG load stages and their corresponding torques according to [52].
Table A3.
FZG load stages and their corresponding torques according to [52].
| Load Stage | Torque (Pinion) in Nm |
|---|---|
| 5 | 94.1 |
| 7 | 183.4 |
| 9 | 302.0 |
| 11 | 450.1 |
Appendix D
Seitzinger [31] used the heat transfer coefficient hc to estimate the mean surface temperature ϑMS via the oil temperature ϑOil and an over temperature ϑOver. Besides hc, ϑOver results from the load-dependent gear power loss PLGP, the factor for heat transfer of the gears to the oil q, and the tooth flank surface related to heat input FW. The mean surface temperature ϑMS results as:
with
XQ considers the amount of lubricant Q in comparison to the face width b:
Xb depicts the influence of the face width b:
XS considers the lubrication method and equals one for injection lubrication.
The tooth flank surface determining the heat transfer FW can be derived from the active surface areas of pinion FPi and wheel FWe. With increasing transmission ratio i, the teeth of the slower turning wheel cool down more until they mesh again than the teeth of the faster turning pinion. This is considered by the factor for the transmission ratio xi:
The heat transfer coefficient hc in Equation (10) was determined based on temperature measurements from Lechner [23] under consideration of the mean sliding speed over the path of contact vgm, the mean Hertzian pressure pHm, and the factor XT considering the oil temperature to:
Appendix E
Appendix E compares the derived scuffing safeties during LOL based on the adapted flash temperature method according to ISO/TS 6336-20 and the adapted integral temperature method according to ISO/TS 6336-21. The adapted integral temperature method is presented in Section 3.4. The following calculation equations show the calculation of the adapted scuffing safety factor for LOL SB,LOL.
according to Collenberg [20] (cf. Equation (26))
The scuffing safety factor during LOL SB,LOL is derived by the scuffing temperature ϑS, being the contact temperature, at which scuffing is likely to occur, compared it to the maximum contact temperature during LOL ϑbmax,LOL, both under consideration of the oil temperature
.
The scuffing temperature ϑS is calculated based on the contact-time-dependent scuffing temperature from Collenberg [20], respectively, ISO/TS 6336-20/21 [9,25] (cf. 3.4, Equation (26)).
ϑbmax,LOL consists of the bulk temperature during LOL ϑM,LOL (cf. Equation (13)) increased by the maximum value of the flash temperature during LOL ϑflmax,LOL (cf. Equation (A14)). The flash temperature during LOL ϑfl,LOL consists of the mean gear coefficient of friction during LOL μmZ,LOL (cf. Equation (3)), the thermo-elastic factor XM, the approach factor XJ, the geometry factor XG, the load sharing factor XΓ, the transverse unit load wBt, the pitch line velocity vt, and the center distance a.
The adapted flash temperature method based on ISO/TS 6336-20 [25] and the adapted integral temperature method based on ISO/TS 6336-21 [9] are compared via the FZG test gears of type Cmod,LOL and type A (cf. Table A1 and Figure A1a,b). The geometries of the FZG test gears of type Cmod,LOL and A are described in Section 4.3.
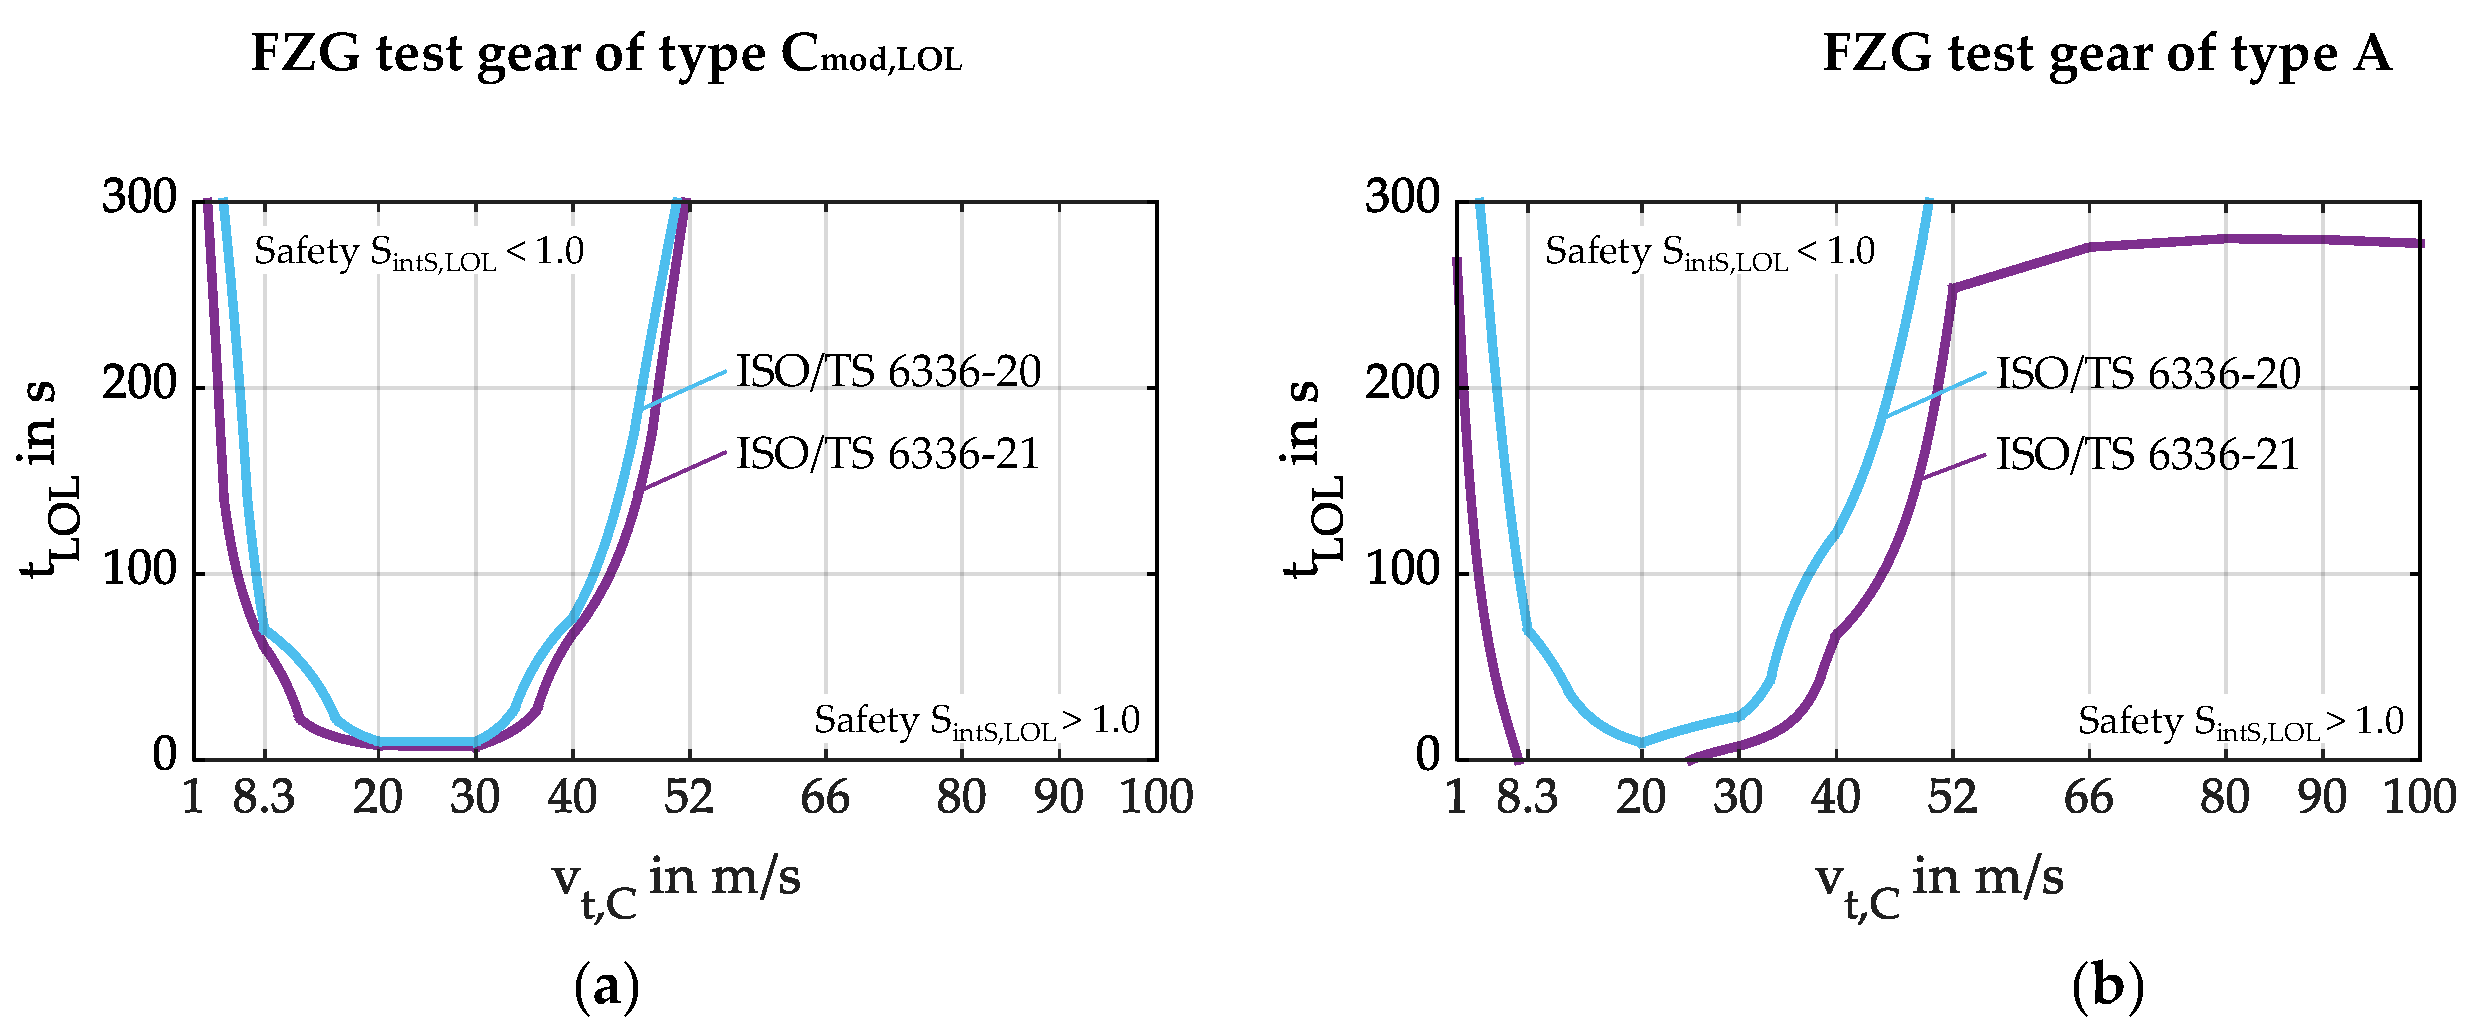
Figure A2a shows the scuffing safeties for the FZG test gears of type Cmod,LOL and Figure A2b shows the scuffing safeties for the FZG test gears of type A, both calculated with the adapted scuffing safety calculation methods based on the flash temperature method (ISO/TS 6336-20) [25] and the integral temperature method (ISO/TS 6336-21) [9].
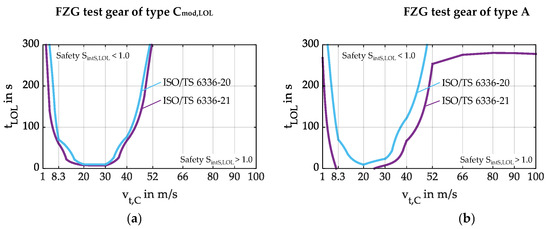
Figure A2.
Calculated scuffing safeties based on the flash temperature method (ISO/TS 6336-20) [25] and the integral temperature method (ISO/TS 6336-21 [9]) for (a) FZG test gear of type Cmod,LOL; (b) FZG test gear of type A for LS7, oil AeroShell 500, ϑOil = 90 °C, and surface and material variant REF.
For the FZG test gear of type Cmod,LOL, the difference in scuffing safeties based on ISO/TS 6336-20 [25] and ISO/TS 6336-21 [9] is marginal. The scuffing safeties based on the integral temperature method (ISO/TS 6336-21) [9] show slightly lower scuffing safeties and SintS,LOL < 1.0 is reached at slightly earlier LOL times tLOL.
For the FZG test gear of type A, the adapted integral temperature method according to ISO/TS 6336-21 [9] calculates lower scuffing safeties. This can be explained by the mean flash temperature ϑflaint. ϑflaint is based on the flash temperature in the mesh point E, which is, for the same operating condition, much higher for the test gear of type A than for type Cmod,LOL, as the sliding speed in the mesh point E is higher. The scuffing safety calculation based on the integral temperature method (ISO/TS 6336-21) [9] is more sensitive for gears with an uneven distribution of sliding speed along the path of contact.
The calculation method based on ISO/TS 6336-21 shows a scuffing safety SintS,LOL < 1 for LS7 and vt,C = 8.3 m/s at a LOL time of 0 s (cf. Figure A2b). This corresponds well with the scuffing test result according to the FZG scuffing test A/8.3/90 [52] which showed scuffing at LS7 with the FZG test gear of type A and the considered oil AeroShell 500 [6]. Due to a better agreement with the scuffing test, the integral temperature method according to ISO/TS 6336-21 is used for the validation in Section 3.5 and the calculation study presented in Section 4.
References
- Minister of Public Works and Government Services Canada. Aviation Investigation Report A09A0016: Main Gearbox Malfunction/Collision with Water; Transportation Safety Board of Canada: Gatineau, QC, Canada, 2010. [Google Scholar]
- Hudgins, W.A.; Schuetz, H.A. Loss-of-Lubrication of Helicopter Transmissions. Am. Helicopter Soc. 1982, 27, 3–10. [Google Scholar] [CrossRef]
- Faruck, A.A.M.; Hsu, C.-J.; Doerr, N.; Weigand, M.; Gachot, C. How lubricant formulations and properties influence the performance of rotorcraft transmissions under loss of lubrication conditions. Tribol. Int. 2020, 151, 106390. [Google Scholar] [CrossRef]
- Riggs, M.R.; Murthy, N.K.; Berkebile, S.P. Evaluation for Loss of Lubrication Performance of Black Oxide, Superfinished, and As-Ground Surfaces for Use in Rotorcraft Transmissions. US Army Research Laboratory ARL-TR-7815; Defense Technical Information Center: Fort Belvoir, VA, USA, 2016. [Google Scholar]
- Riggs, M.R.; Murthy, N.K.; Berkebile, S.P.; Korenyi-Both, A.L. Scuffing Resistance and Starved Lubrication Behavior in Helicopter Gear Steels Coated with Nanocomposite Surface Coatings with and without a Hard Sublayer. Tribol. Trans. 2020, 63, 610–620. [Google Scholar] [CrossRef]
- Morhard, B.; Paschold, C.; Lohner, T.; Stahl, K. Power Loss and Damage Behavior of Gears Operating under Loss of Lubrication. J. Tribol. 2024, 146, 072201. [Google Scholar] [CrossRef]
- Morhard, B.; Lohner, T.; Stahl, K. Influence of Surface and Material Technologies on the Loss of Lubrication Performance of Gears. J. Mater. Sci. Mater. Eng. 2024, 19, 1. [Google Scholar] [CrossRef]
- Morhard, B.; Lohner, T.; Stahl, K. Influence of high speeds on operating behavior of gears under loss of lubrication. Eng. Res. Forsch. Im Ingenieurwesen 2025, 89, 153. [Google Scholar] [CrossRef]
- ISO/TS 6336-21:2022; Calculation of Load Capacity of Spur and Helical Gears—Part 21: Calculation of Scuffing Load Capacity—Integral Temperature Method. International Organization for Standardization: Geneva, Switzerland, 2022.
- Alberti, J.; Lemanski, A. Oil-Starvation Test Program: Evaluation of VASCO-X2 Steel Spiral Bevel Gears; U.S. Army Air Mobility Research and Development Laboratory: Fort Rucker, AL, USA, 1972. [Google Scholar]
- Bartilotta, I.; Ciulli, E.; Manconi, S.; Toson, E. An experimental investigation on aerospace quality gears operating in loss of lubrication condition. In Proceedings of the ASME 2012 11th Biennial Conference on Engineering Systems Design and Analysis, Nantes, France, 2–4 July 2012; Advanced Manufacturing Processes; Biomedical Engineering; Multiscale Mechanics of Biological Tissues; Sciences, Engineering and Education; Multiphysics; Emerging Technologies for Inspection and Reverse Engineering; Advanced Materials and Tribology. Volume 4. [Google Scholar] [CrossRef]
- AGMA 18FTM08; Oil-Off Characterization Method Using In-Situ Friction Measurement for Gears Operating Under Loss-of-Lubrication Conditions. American Gear Manufacturers Association Fall Technical Meeting: Detroit, MI, USA, 2018.
- Berkebile, S.; Murthy, N.; Radil, K.; Dykas, B.; Colon-Rivera, R.; Fetty, J. Experimental evaluation of transmission loss-of-lubrication technologies. In Proceedings of the 74th Annual Forum and Technology Display of the American Helicopter Society (AHS), Phoenix, AZ, USA, 14–17 May 2018. Annual Forum Proceedings—AHS International. [Google Scholar]
- Kozachyn, M.; McIntyre, S.; Robuck, M.; Isaacson, A.; Black, B.; Sahay, V. Loss of lubrication testing. In Proceedings of the 74th American Helicopter Society International Annual Forum and Technology Display 2018: The Future of Vertical Flight, Phoenix, AZ, USA, 14–17 May 2018; Annual Forum Proceedings—AHS International. Volume 2018-May. [Google Scholar]
- Murakawa, M.; Komori, T.; Takeuchi, S.; Miyoshi, K. Performance of a rotating gear pair coated with an amorphous carbon film under a loss-of-lubrication condition. Surf. Coat. Technol. 1999, 120–121, 646–652. [Google Scholar] [CrossRef]
- Murthy, N.; Rai, A.K.; Berkebile, S. Improved loss-of-lubrication performance with lubricants containing nano-graphene platelets and ionic liquids. Appl. Sci. 2020, 10, 7958. [Google Scholar] [CrossRef]
- Braumann, L.; Viteri, V.S.d.; Morhard, B.; Lohner, T.; Ochoa, J.; Amri, H. Tribology technologies for gears in loss of lubrication conditions: A review. J. Mater. Sci. Mater. Eng. 2025, 20, 29. [Google Scholar] [CrossRef]
- Handschuh, R.F.; Morales, W. Lubrication System Failure Baseline Testing on an Aerospace Quality Gear Mesh. In Proceedings of the ASME Design Engineering Technical Conference, Baltimore, ML, USA, 10–13 September 2000; Volume 6, pp. 739–745, 8th International Power Transmission and Gearing Conference. [Google Scholar] [CrossRef]
- Handschuh, R.F.; Polly, J.; Morales, W. Gear mesh loss-of-lubrication experiments and analytical simulation. In Proceedings of the 67th Annual Forum and Technology Display (Forum 67), Virginia Beach, VA, USA, 3–5 May 2011. [Google Scholar]
- Collenberg, H.F. Untersuchungen zur Fresstragfähigkeit schnelllaufender Stirnradgetriebe—Engl.: Investigations into the Scuffing Load Capacity of High-Speed Spur Gears. Ph.D. thesis, Technical University of Munich, Munich, Germany, 1991. [Google Scholar]
- Bowman, W.F.; Stachowiak, G.W. A review of scuffing models. Tribol. Lett. 1996, 2, 113–131. [Google Scholar] [CrossRef]
- Brizmer, V.; Matta, C.; Nedelcu, I.; Morales-Espejel, G.E. The Influence of Tribolayer Formation on Tribological Performance of Rolling/Sliding Contacts. Tribol. Lett. 2017, 65, 57. [Google Scholar] [CrossRef]
- Lechner, G. Die Fress-Grenzlast bei Stirnrädern aus Stahl—Engl.: The Limit Scuffing Load for Spur Gears Made of Steel. Ph.D. thesis, Technical University of Munich, Munich, Germany, 1966. [Google Scholar]
- Michaelis, K. Die Integraltemperatur zur Beurteilung der Fresstragfähigkeit von Stirnradgetrieben—Engl.: The Integral Temperature for Assessment of the Scuffing Load Capacity of Spur Gears. Ph.D. thesis, Technical University of Munich, Munich, Germany, 1987. [Google Scholar]
- ISO/TS 6336-20:2022; Calculation of Load Capacity of Spur and Helical Gears—Part 20: Calculation of Scuffing Load Capacity—Flash Temperature Method. International Organization for Standardization: Geneva, Switzerland, 2022.
- Ziegltrum, A.; Emrich, S.; Lohner, T.; Michaelis, K.; Brodyanski, A.; Merz, R.; Kopnarski, M.; Hoehn, B.-R.; Stahl, K. Influence of tribofilms on failures and friction of gears with particular focus on running-in. Ind. Lubr. Tribol. 2019, 71, 1017–1026. [Google Scholar] [CrossRef]
- Wu, J.; Wei, P.; Liu, G.; Chen, D.; Zhang, X.; Chen, T.; Liu, H. A comprehensive evaluation of DLC coating on gear bending fatigue, contact fatigue, and scuffing performance. Wear 2024, 536–537, 205177. [Google Scholar] [CrossRef]
- Winter, H.; Michaelis, K. Scoring Tests of Aircraft Transmission Lubricants at High Speeds and High Temperatures. J. Synth. Lubr. 1986, 3, 121–135. [Google Scholar] [CrossRef]
- Winter, H.; Michaelis, K.; Collenberg, H.F. Investigations on the Scuffing Resistance of High-Speed Gears. AGMA Tech. Pap. 1990, 8, 1–14. [Google Scholar]
- Oster, P. Beanspruchung der Zahnflanken unter Bedingungen der Elastohydrodynamik—Engl.: Stress on the Tooth Flanks Under Elastohydrodynamic Conditions. Ph.D. thesis, Technical University of Munich, Munich, Germany, 1982. [Google Scholar]
- Seitzinger, K. Die Erwärmung einsatzgehärteter Zahnräder als Kennwert für ihre Freßtragfähigkeit—Engl.: The Heating of Case-Hardened Gears as a Characteristic Value for their Scuffing Load Capacity. Ph.D. thesis, Technical University of Munich, Munich, Germany, 1971. [Google Scholar]
- NASA/TM—2014-218396; Test Facility Simulation Results for Loss-of-Lubrication of Spur Gears. National Aeronautics and Space Administration: Washington, DC, USA, 2014.
- Handschuh, R.F. Thermal behavior of aerospace spur gears in normal and loss-of-lubrication conditions. Am. Helicopter Soc. Annu. Forum Technol. Disp. 2015, 4, 2292–2301. [Google Scholar] [CrossRef]
- Michaelis, K.; Höhn, B.-R.; Doleschel, A. Lubricant influence on gear efficiency. In Proceedings of the ASME International Design Engineering Technical Conferences and Computers and Information in Engineering Conference 2009, San Diego, CA, USA, 30 August–2 September 2009. DETC2009. [Google Scholar] [CrossRef]
- Yilmaz, M.; Lohner, T.; Michaelis, K.; Stahl, K. Minimizing gear friction with water-containing gear fluids. Eng. Res. 2019, 83, 327–337. [Google Scholar] [CrossRef]
- Becker, K.M. Measurements of convective heat transfer from a horizontal cylinder rotating in a tank of water. Int. J. Heat Mass Transf. 1963, 6, 1053–1062. [Google Scholar] [CrossRef]
- Handschuh, R.F. Thermal Behavior of Spiral Bevel Gears; NASA Technical Memorandum 106518. Army Research Laboratory 1995, Technical Report ARL-TR-403; Case Western Reserve University: Cleveland, OH, USA, 1993. [Google Scholar]
- Lebeck, A.O. Principles and Design of Mechanical Face Seals, 1st ed.; Wiley-Interscience: New York, NY, USA, 1991; ISBN 978-0-471-51533-3. [Google Scholar]
- Long, H.; Lord, A.A.; Gethin, D.T.; Roylance, B.J. Operating temperatures of oil-lubricated medium-speed gears: Numerical models and experimental results. Proc. Inst. Mech. Eng. Part G J. Aerosp. Eng. 2003, 217, 87–106. [Google Scholar] [CrossRef]
- Patir, N.; Cheng, H.S. Prediction of the Bulk Temperature in Spur Gears Based on Finite Element Temperature Analysis. ASLE Trans. 1977, 22, 25–36. [Google Scholar] [CrossRef]
- Hildebrand, L.; Genuin, S.; Lohner, T.; Stahl, K. Numerical Analysis of the Heat Transfer of Gears under Oil Dip Lubrication. Tribol. Int. 2024, 195, 109652. [Google Scholar] [CrossRef]
- Qiao, Z.; Zhou, C.; Su, J.; Jiang, X. A novel dynamic heat-flow coupled model under spray lubrication for high-speed gears: CFD simulation and experimental validation. Simul. Model. Pract. Theory 2024, 131, 102867. [Google Scholar] [CrossRef]
- Roda-Casanova, V.; Sanchez-Marin, F.; Martinez-Cuenca, R. Convective heat transfer modelling in dry-running polymer spur gears. Int. J. Mech. Sci. 2023, 241, 107927. [Google Scholar] [CrossRef]
- Zou, T.; Yan, Q.; Sui, T.; Zhao, Z.; Li, J.; An, Y. Key Parameters and Experimental Study of High-Speed Rotating Meshing Gear Injection Lubrication Based on Moving Particle Semi-Implicit Method. Lubricants 2023, 11, 366. [Google Scholar] [CrossRef]
- von Plehwe, F. Untersuchung des Wärmeübergangs durch Einspritzkühlung für ein Höchstleistungsgetriebe—Engl.: Investigation of Heat Transfer by Injection Cooling for a High Performance Gearbox. Ph.D. thesis, Karlsruher Institut für Technologie, Karlsruhe, Germany, 2022. [Google Scholar]
- Ohlendorf, H. Verlustleistung und Erwärmung von Stirnrädern—Engl.: Power Loss and Heat Generation in Cylindrical Gears. Ph.D. thesis, Technical University of Munich, Munich, Germany, 1958. [Google Scholar]
- Michalczewski, R.; Szczerek, M.; Tuszyński, W.; Wulczyński, J.; Antonov, M. The effect of low-friction PVD coatings on scuffing and pitting resistance of spur gears. Tribologia 2013, 251, 5. [Google Scholar]
- Wimmer, J.A. Lastverluste von Stirnradverzahnungen: Konstruktive Einflüsse, Wirkungsgradmaximierung, Tribologie—Engl.: Load Losses of Spur Gears: Design Influences, Efficiency Maximization, Tribology. Ph.D. thesis, Technical University of Munich, Munich, Germany, 2006. [Google Scholar]
- Schlenk, L. Untersuchungen zur Freßtragfähigkeit von Großzahnrädern—Engl.: Investigations into the Scuffing Load Capacity of Large Gears. Ph.D. thesis, Technical University of Munich, Munich, Germany, 1995. [Google Scholar]
- Doleschel, A. Wirkungsgradberechnung von Zahnradgetrieben in Abhängigkeit vom Schmiertstoff—Engl.: Efficiency Calculation of Gearboxes in Dependency of the Lubricant. Ph.D. thesis, Technical University of Munich, Munich, Germany, 2003. [Google Scholar]
- ISO/TR 14179-1:2001-01; Gears -Thermal Capacity-Part 1: Rating Gear Drives with Thermal Equilibrium at 95 °C Sump Temperature. International Organization for Standardization: Geneva, Switzerland, 2001. Available online: https://www.iso.org/obp/ui/#iso:std:iso:tr:14179:-1:ed-1:v1:en (accessed on 21 October 2025).
- ISO 14635-1:2000; Gears—FZG Test Procedures-Part 1: FZG Test Method A/8,3/90 for Relative Scuffing Load-Carrying Capacity of Oils. International Organization for Standardization: Geneva, Switzerland, 2000.
- Dewinter, A.; Blok, H. Fling-Off Cooling of Gear Teeth. J. Eng. Ind. Trans. ASME 1974, 96, 60–70. [Google Scholar] [CrossRef]
- Blok, H. The Present Status of the Theory of Gear Lubrication; Laboratory for Machine Elements and Tribology, University of Technology: Delft, The Netherlands, 1968. [Google Scholar]
- Lohner, T.; Paschold, C. A Pathway Towards Energy Efficiency Classes for Gearboxes Related to Superefficiency. Eng. Res. Forsch. Im Ingenieurwesen 2025, 89, 2. [Google Scholar] [CrossRef]
- Shell. Technical Data Sheet—Turbine Oil 3: Mineral Lubricating Oil for Aircraft Turbine Engines; Shell PLC: London, UK, 2021. [Google Scholar]
- Hildebrand, L.; Lohner, T.; Stahl, K. A Mechanism-Based Characterization of the Load-Independent Power Loss of Dip-Lubricated Gears—Eingereicht. Proc. Inst. Mech. Eng. Part J J. Eng. Tribol. 2024, 239, 1382–1400. [Google Scholar] [CrossRef]
- Shell. Technical Data Sheet—AeroShell Turbine Oil 500: Synthetic Lubricating Oil for Aircraft Turbine Engines; Shell PLC: London, UK, 2021. [Google Scholar]
- EASTMAN. Technical Data Sheet—Easstman HALO 157: Synthetic Lubricating Oil for Aircraft Turbine Engines; Eastman: Kingsport, TN, USA, 2018. [Google Scholar]
- Exxon. Safety Data Sheet—Mobil Agl—Synthetic Aviation Gear Lubricant: Synthetic Lubricating Oil for Aircraft Turbine Engines; Exxon Mobil Corporation: Spring, TX, USA, 2002. [Google Scholar]
Disclaimer/Publisher’s Note: The statements, opinions and data contained in all publications are solely those of the individual author(s) and contributor(s) and not of MDPI and/or the editor(s). MDPI and/or the editor(s) disclaim responsibility for any injury to people or property resulting from any ideas, methods, instructions or products referred to in the content. |
© 2025 by the authors. Licensee MDPI, Basel, Switzerland. This article is an open access article distributed under the terms and conditions of the Creative Commons Attribution (CC BY) license (https://creativecommons.org/licenses/by/4.0/).


