Abstract
Introduction: The role of positron-emission tomography/computed-tomography (PET/CT) in the management of sarcomas and as a prognostic tool has been studied. However, it remains unclear which metric is the most useful. We aimed to investigate if volume-based PET metrics (Tumor volume (TV) and total lesions glycolysis (TLG)) are superior to maximal standardized uptake value (SUVmax) and other metrics in predicting survival of patients with soft tissue and bone sarcomas. Materials and Methods: In this retrospective cohort study, we screened over 52′000 PET/CT scans to identify patients diagnosed with either soft tissue, bone or Ewing sarcoma and had a staging scan at our institution before initial therapy. We used a Wilcoxon signed-rank to assess which PET/CT metric was associated with survival in different patient subgroups. Receiver-Operating-Characteristic curve analysis was used to calculate cutoff values. Results: We identified a total of 88 patients with soft tissue (51), bone (26) or Ewing (11) sarcoma. Median age at presentation was 40 years (Range: 9–86 years). High SUVmax was most significantly associated with short survival (defined as <24 months) in soft tissue sarcoma (with a median and range of SUVmax 12.5 (8.8–16.0) in short (n = 18) and 5.5 (3.3–7.2) in long survival (≥24 months) (n = 31), with (p = 0.001). Similar results were seen in Ewing sarcoma (with a median and range of SUVmax 12.1 (7.6–14.7) in short (n = 6) and 3.7 (3.5–5.5) in long survival (n = 5), with (p = 0.017). However, no PET-specific metric but tumor-volume was significantly associated (p = 0.035) with survival in primary bone sarcomas (with a median and range of 217 cm3 (186–349) in short survival (n = 4) and 60 cm3 (22–104) in long survival (n = 19), with (p = 0.035). TLG was significantly inversely associated with long survival only in Ewing sarcoma (p = 0.03). Discussion: Our analysis shows that the outcome of soft tissue, bone and Ewing sarcomas is associated with different PET/CT metrics. We could not confirm the previously suggested superiority of volume-based metrics in soft tissue sarcomas, for which we found SUVmax to remain the best prognostic factor. However, bone sarcomas should probably be evaluated with tumor volume rather than FDG PET activity.
1. Introduction
Sarcomas are a very rare and heterogeneous group of tumors of various histological subtypes, arising in soft tissue or bone. Differences in tumor biology result in a wide range of clinical behavior from dismal prognosis to long-term survival even within one histological subtype. However, current tools to predict survival are limited. Apart from histological grading, there are other prognostic factors to determine how aggressive a tumor is. In soft tissue sarcomas (STS), for instance, it is the tumor location, the size of the primary tumor and its grade [1,2]. Deeper and more proximally located sarcomas have a worse prognosis than superficially located sarcomas of the distal extremities, for instance. As for bone sarcomas (BS) also in osteosarcoma, initial tumor size has been shown to be a prognostic factor and to predict presence of metastases [3]. For BS and ES, in general, tumor volume is an important factor for staging and has an impact on prognosis; other negative prognostic factors include the presence of a pathological fracture and elevated serum levels of alkaline phosphatase (AP) and lactate dehydrogenase (LDH) [4].
Radiologic examinations of all sorts can potentially provide both the size and location of a tumor. MRI scans have been used early in the assessment of STS, not only for measurement purposes, but also to gain information about tumor metabolism via spectroscopy [5]. Further, the absence of a peritumoral edema in MRI scans has been described as a potentially positive prognostic factor [6]. In Ewing sarcoma family of tumors (ESFT), larger tumor volume in MRI scans has been associated with poorer survival [7].
The role of positron-emission tomography/computed-tomography (PET/CT) scans using 18F-Fluorodeoxyglucose (FDG) in the management of sarcomas has been primarily to rule out metastatic disease. However, it has also been discussed as a potential prognostic tool [8]. In cohorts of different STS the maximum standardized uptake value (SUVmax) was reported to correlate with overall survival (OS) [9,10], but also in more specific histological subgroups, such as synovial sarcoma [11]. Later, also volume-based PET metrics such as total lesion glycolysis (TLG) were suggested to be superior to predict outcome in STS, as they provide more information on tumor metabolism than a single voxel maximum value [12,13]. Others explicitly concluded that volume-based PET metrics do not add any additional information on survival prediction in STS [10]. In a meta-analysis, SUVmax, metabolic tumor volume (MTV) and TLG were all found to be prognostic in STS [14]. Also in osteosarcomas SUVmax was found to be a prognostic factor by some [15], while Byun et al. suggested that MTV might be a better predictor for survival than SUVmax in osteosarcomas [16]. Other studies investigating mixed cohorts of bone sarcomas (including mostly osteosarcoma and some ESFT) found no correlation between survival and SUVmax [9]. In ESFT, SUVmax was shown to correlate with OS and progression free survival (PFS) [17,18,19].
Assessing the aggressiveness of the disease is essential in the management of sarcoma patients to guarantee treatment adequate to the disease and in the case of STS to help decide which patients might be candidates for adjuvant or neo-adjuvant chemotherapy. This is done by integrating histology, grade and anatomical location in relation to the fascia (deep versus superficial) and tumor dimensions into the clinical decision-making process for example in STS [20]. This approach has limitations: especially tumor heterogeneity can lead to a sampling error while performing the initial biopsy to establish the histopathological diagnosis. Radiology and nuclear medicine provide tools to assess a tumor comprehensively and non-invasively. However, the existing data are inconclusive and rather contradictory about which PET metric provides the best prognostic factor for which group of sarcomas.
We aimed to investigate if volume derived from the CT scan, or a volume-based PET metric (TLG) are superior compared to SUVmax in association with outcome in different types of sarcomas and to determine, if there are cutoff values that best predict outcome for different histological subtypes.
2. Materials and Methods
2.1. Patient Selection
In this retrospective study, all FDG-PET/CT scans performed at the University Hospital Zurich between 2001–2014 were identified. Using the search terms for different sarcoma subtypes and the respective ICD-10 codes for sarcomas, all reports were automatically and subsequently manually searched for initial staging examinations of sarcomas. In accordance with the approval of the local ethics committee (BASEC Nr. 2017-00475), informed consent was waived. Patients whose initial scans were performed after surgery, radiotherapy or chemotherapy were excluded. Tumor biopsy was not considered surgery. Interpretation of sarcoma histology is a challenging task and a diagnosis can vary among different pathologists. Furthermore, the classification of sarcomas and the nomenclature of histological subtypes has changed over the years. Whenever possible, the sarcoma diagnosis was therefore reviewed and validated by our specialized reference pathologist (BB) to verify the exact histopathological diagnosis according to the currently valid “WHO Classification of Tumours of Soft Tissue and Bone (2013)” [21]. For the analysis, we split the patients in three groups: STS (comprising non uterine leiomyosarcomas, liposarcomas, angiosarcomas, rhabdomyosarcomas, undifferentiated pleomorphic sarcomas, synovial sarcomas, myxofibrosarcomas and others); BS (comprising osteosarcomas, chondrosarcomas, undifferentiated pleomorphic sarcomas of the bone and leiomyosarcomas of the bone), and ESFT (Ewing sarcomas and other Ewing sarcoma family tumors). Clinical data of the patients were collected from the patients’ records for survival analyses.
2.2. PET/CT Scans
All patients were scanned on a dedicated PET/CT machine (GE Healthcare DSTX, 16-or 64-slices CT, 7–8 frames, frame time 1.5 or 2 min). Fasting for 6 h prior to the study was mandatory. Patients were not allowed to consume sweetened beverages and chewing gum. Blood glucose was measured prior to the FDG-injection and had to be below 120 mg/dl. Patients received 2–4 MBq 18F-FDG per kilogram bodyweight, followed by a 45–60 min uptake period. Afterwards, a low-dose, attenuation correction CT scan was acquired (100–120 kV, approx. 80 mA), followed by the PET scan from mid-thigh to the vertex of the skull followed by a scan of the lower extremities depending on tumor localization.
2.3. Image Analysis
The PET/CT data of the included patients were all processed using the PMOD Technologies LLC software (www.pmod.com, accessed on 30 April 2018), and the primary tumors were manually outlined on all slices with care, thus obtaining accurate volumes of interest (VOI) representing the radiologic tumor volumes. All VOIs were created by the same reader (RIH) ensuring a consistent interpretation of tumor volumes under the supervision of a nuclear radiologist (IAB). The VOI were used on the PET data, as well as on the CT data. The volume outlined in the CT scan was always checked to fit the PET-scan best and minor changes on the basis of FDG-avidity could be made. Decay corrected activity on PET images was normalized using the following formula to obtain standardized uptake value (SUV): .
Within the pre-defined volume based on the CT data, the following PET/CT metrics were calculated and exported: SUVmax, SUVavg, SUVmedian, SUVmin and TLG (defined as SUVavg * tumor volume). For CT-parameters, the tumor volume and the Hounsfield units (HU) were acquired within the same VOI. Figure 1 is giving an example for tumor segmentation in a patient with a large gluteal STS.
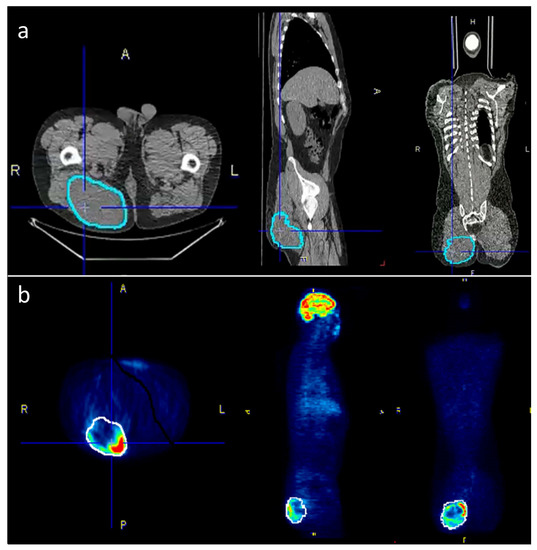
Figure 1.
To accurately outline the tumors, the VOIs were selected semi-automatically on the PET-images where possible and then manually adjusted to the tumor borders on the CT scan. (a) The corrected VOIs were then copied back to the PET-scan (b) in order to obtain identical VOIs for both PET and CT data.
2.4. Statistics
For the statistical analysis, we divided the patients into a long and short survival group. Survival time was defined as the time since the initial PET scan until death or last follow-up. The threshold for long survival was defined as 24 months or more. Short survival was defined as less than 24 months. Patients who did not die of their disease but were lost to follow-up in this time frame (n = 5, one of which died of a reason unrelated to the sarcoma) were not considered for the survival analysis, leaving 83 patients. Statistical calculations were performed using IBM SPSS Statistics 24. We used a Wilcoxon signed-rank test to analyze, which PET/CT metrics were associated with survival in the different patient subgroups. A Spearman’s rho coefficient was used to correlate survival time with these PET metrics. A p-value < 0.05 was considered significant. In case of significant association, receiver-operating-characteristic (ROC) curves were used to determine the area under the curve (AUC) in each group, which allowed to use cutoff values using the Youden index. Only patients with at least 24 months of follow-up or patients who died of their disease within this time frame (n = 83) were considered for this analysis. For Kaplan–Meier estimation of survival curves, all 88 patients were included. Patients were grouped into one of the three categories mentioned above (STS, BS and ESFT). A statistical analysis for the individual histologies was not possible in many cases due to low patient numbers. However, whenever possible we investigated these subgroups as well.
3. Results
3.1. Patient Cohort
The screening of all PET/CT scans resulted in a total of n = 88 eligible patients (Figure 2). Of the 88 patients 49 were male and 39 female. Median age at presentation was 40 years (Range: 9–86 years). At the time the initial scan was performed, 70 patients (36 men and 34 women) had localized disease and 18 patients (13 men and 5 women) had metastases on PET/CT scan. In the initial scan, a mean dose of 347 (±51) MBq was administered. Median Follow-up time was 47 months (Range 1–157). At the end of follow-up, 48 patients were alive and 35 free of disease. Follow-up ended when a patient died or at the last point in time he or she was reportedly alive. The patient characteristics are summarized in Table 1.
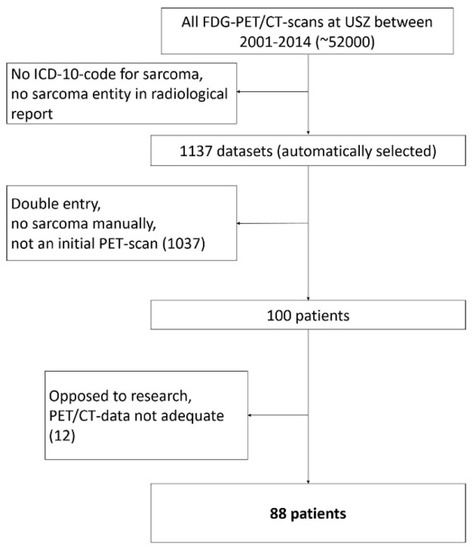
Figure 2.
Patient selection flow chart.

Table 1.
Patient characteristics.
The exact histopathological diagnosis was determined for every patient. Eighty of 88 histopathology samples were reevaluated, resulting in 31 different diagnostic subcategories as shown in Table 2. For further analysis, these categories were summarized in the three aforementioned main groups: bone sarcoma (BS), soft tissue sarcoma (STS) and Ewing sarcoma family tumors (ESFT).
Table 2.
Detailed tumor entity information and subgroups.
3.2. PET Metrics for Different Subgroups
PET quantification metrics between the three subgroups are shown in Table 3. There was a highly significant difference in the average Hounsfield density, which is not surprising since we compared tumors arising mostly in bone (BS, ESFT) with STS. In addition, TLG was significantly different between the three groups with BS showing the lowest median TLG value.
Table 3.
Metrics between the 3 subgroups.
3.3. PET Metrics Predicting Survival
To investigate the PET metric most strongly associated with long-term survival (which we defined as more than 24 months after diagnosis), we included the 83 patients with follow-up of at least or death within 24 months. In the entire study population comprising all three subgroups, the FDG uptake represented by SUVmax did show a significant negative correlation with overall survival time according to Spearman’s rho coefficient (r = −0.414, p < 0.001) (Figure 3a), but not for volume (r= −0.042, p = 0.699) (Figure 3b). However, focusing on the defined individual sarcoma subgroups, SUVmax was not significantly higher in patients with short time survival in BS, but remained significant in STS (p = 0.001) and ESFT (p = 0.017) (Table 4 and Figure 4a). In contrast, in BS, a high tumor volume was positively correlated with a short survival period (p = 0.035) (Table 4 and Figure 4b). Higher TLG was only significantly correlated with short survival in ESFT but not in BS and STS (p =0.03) (Table 4 and Figure 4c).
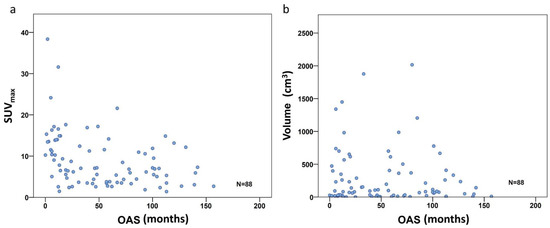
Figure 3.
Correlation scatterplot for SUVmax (a) and volume (b) including all 88 patients. Only the SUVmax group shows significant correlation with OS (r = −0.414, p < 0.001), volume did not (r = −0.042, p = 0.699).
Table 4.
PET and volume metrics and survival period a.
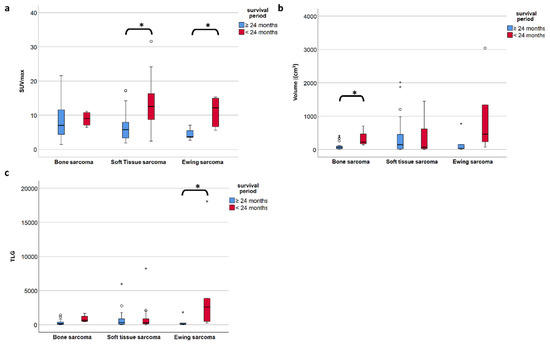
Figure 4.
(a–c) The median SUVmax is significantly different in short- and long-term survival patients in soft tissue and Ewing sarcoma but not in bone sarcoma (a), whereas in bone sarcoma is the volume of the primary tumor is significantly different in short vs. long term survival (b). TLG only proves significant in ESFT but less so than SUVmax. (c). A p-value less than 0.05 is considered significant (*).
3.4. Optimal Cutoff for Survival
To determine the optimal cutoff value for each subgroup, the PET metric with the best discrimination between short- and long-term survival was selected, and ROC analysis yielded the following cutoffs: for ESFT an SUVmax of 5.5, for STS an SUVmax of 8.5 and for BS a volume of 127 cm3 (Figure 5a–c). The corresponding Kaplan–Meier graphs illustrate the significant difference in survival for the patients of the three subgroups using the above-mentioned cutoff values (Figure 5d–f).
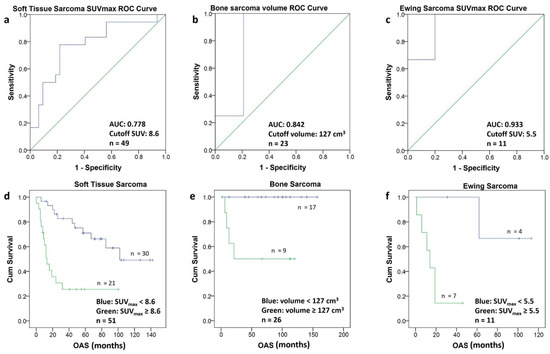
Figure 5.
(a–f) The ROC-Curves for soft tissue sarcomas (a), bone sarcomas (b) and Ewing sarcomas (c) allowed to calculate a cutoff value (Youden Index) for SUVmax and for the volume, respectively. Using the calculated cutoff value each population was divided into two groups. The Kaplan–Meier curves of the two groups in soft tissue sarcomas (d) bone sarcomas (e) and Ewing sarcomas (f) are depicted. The Kaplan–Meier curves include patients with short follow-up (n = 5).
4. Discussion
In concordance with the literature, we found a very wide range of survival-time for sarcoma patients who also showed considerable differences in tumor size and PET metrics. The metrics of interest were SUVmax, representing the part of the tumor with the most activity, which can be obtained semi-automatically from the PET data, as well as volume, which can be obtained from the CT scan data manually and depending on the tumor activity and homogeneity also be estimated semi-automatically from the PET-scan data. Both SUVmax and volume are needed to calculate volume-based metrics, such as TLG, which is tumor volume times total SUV avidity giving information about how active a tumor is in its whole. Interestingly, we found that FDG PET-specific metrics did not correlate with survival in all the subgroups of sarcomas. While high FDG-accumulation predicted a worse outcome in ESFT (with a cutoff at SUVmax 5.5) and in STS (with a cutoff at SUVmax 8.6), the prognostic value of FDG uptake in BS could not be reproduced. In our patient population, the outcome for BS was strongly related to tumor volumes (with a cutoff at 127 cm3). However, due to the low patient numbers in the subgroups BS and ESFT and due to the inherently high heterogeneity in the STS subgroup comprising several histological sub-entities, we cannot rule out biases inherent to retrospective analyses.
4.1. Importance of Pathology and Selected Pathological Findings
Correct histopathological diagnosis of mesenchymal tumors may be challenging for the non-specialized pathologist due to the rarity of individual entities and heterogeneity of microscopical appearance. The histopathological diagnosis should therefore always be reviewed by expert pathologists at a reference center with high case load and access to specialized diagnostic methods. The expert histopathological review of the tumor tissue slides was possible for 80 out of 88 cases (91%) of the current study, with careful critical review of the pathology reports for the cases, in which slides were not available. As a result of this review, eight diagnoses have been altered and all the tumors were classified according to the modern, currently valid WHO classification of soft tissue and bone tumors [21], which we consider to be one of the strengths of our study.
Seven out of eleven patients of our ESFT group had a proven EWS gene alteration, but the group contained also three ES without a distinct mutation and one ES with a CIC-DUX4 mutation. This subpopulation of tumors may behave more aggressively than classical ES. However, the PET metrics of those patients were in line with the rest of the ESFT group, whilst the patient with the CIC-DUX4 mutation survived for 19 months (equal to the median OAS of the ESFT group with an interquartile range of 11–62 months) with this more aggressive tumor biology. Hence, we believe a greater more homogeneous group consisting of only classical ES would show an even higher correlation with SUVmax. Another group worth mentioning are the patients with liposarcomas. In our cohort, we had a variety of different subtypes (well-differentiated, myxoid, pleomorph and dedifferentiated) with gradings ranging from G1 to G3. These different subtypes are known to have different behavior with dedifferentiated liposarcoma being much more aggressive, which was also reflected in this study with all patients who reportedly had a G1 tumor alive at the cutoff date. These two examples illustrate the importance of the correct histopathological diagnosis when interpreting our findings, but they also show the difficulties that derive from the heterogeneity of sarcomas even within one histological group, hindering a more detailed analysis for each specific subgroup.
4.2. Importance of Tumor Metrics
PET metrics have recently been linked to the proliferation activity of tumors as measured immunohistochemically by the nuclear expression of Ki-67, a marker for cell division, pointing to the fact that higher proliferation is associated with higher PET metrics. [22] Since most aggressive sarcomas show high proliferation rates, we could derive information about tumor biology and aggressiveness of the disease from PET-CT scans. However, there are various, sometimes contradictory results regarding PET metrics for sarcoma. A comprehensive review of the literature is given in Table 5.
Table 5.
Literature summary a.
Apart from histology, simple basic metrics such as tumor volume or diameter are widely used for risk stratification in STS and are already part of guidelines and nomograms. [20,23,24] The role of neo-adjuvant or adjuvant chemotherapy in high-risk localized STS remains very controversial and new tools to stratify the risk of this patient group could further help in clinical decision-making [25,26,27,28]. FDG PET/CT was suggested to be such a potential tool that might allow an improved risk stratification. However, the assessment of FDG PET metrics throughout the literature is not uniform and ill defined, with various semiautomatic methods that lead to significant limitations of the results. For example, PET-based volume metrics using an absolute threshold of SUVmax (e.g., 42%) is of limited value for sarcoma assessment, since they tend to underestimate the tumor burden in highly active tumors [29]. Due to the intratumoral heterogeneity of sarcomas, we performed manual segmentation, slice by slice to ensure detailed VOI for further analysis. All segmentations were carried out by the same reader to avoid contaminating the results by interreader variability. Despite this accurate but very labor-intensive segmentation method to calculate the total tumor burden, the best predictive value for survival in our cohort of STS and ESFT was still SUVmax which is illustrated in Figure 6.
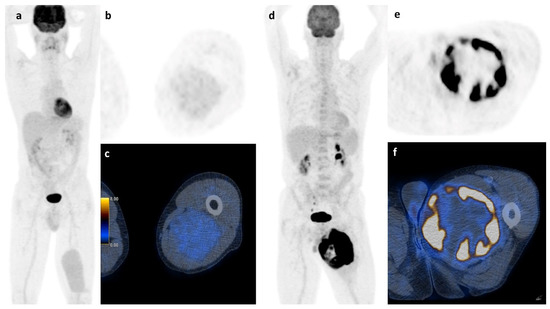
Figure 6.
Soft tissue sarcoma: A whole body scan (a) and the axial images (b,c) of a 45 y.o. patient with a myxoid liposarcoma of the left thigh and a survival of at least 107 months shows low FDG-activity (2.35 SUVmax), while the 73 y.o. patient on the right (d–f) with a pleomorphic undifferentiated sarcoma and high FDG-activity (31.60 SUVmax) had a survival of only 12 months.
4.3. Comparison with Existing Literature
Our results are in line with part of the existing literature. [9,10,30,31] For ESFT an SUVmax of 5.5, for STS an SUVmax of 8.5 and for BS a volume of 127 cm3 were found to be the cutoff values for long survival. Several cut offs, e.g., 5.8 to 17.0 in ES and 6.0 to 17.7 in STS have been suggested, respectively. For BS, no volume cutoff has been reported to our knowledge. Anderson et al. reported a MTV40% of 32.6 cm3/mL which is not directly comparable [13]. Table 5 is giving an overview of the existing publications concerning PET metrics and survival.
In our study, volume-based metrics showed no correlation with survival in STS patients, contradicting some previous studies [13]. In synovial sarcomas, some authors found TLG and SUVmax to be prognostic [11]. Our cohort does not allow for further statistical analyses in synovial sarcomas alone due to low case numbers (n = 3). In rhabdomyosarcomas (RMS), SUVmax was described as a predictor of outcome [32]. Since our cohort only encompassed five patients who moreover showed different histological subtypes (alveolar, embryonal, and pleomorphic), we were not able to perform a meaningful statistical analysis in RMS.
Some authors found TLG to be an even better predictor of prognosis in STS than SUVmax [12]. There is one meta-analysis concerning the prognostic value of PET/CT metrics in STS [14], stating that not only SUVmax but also TLG adds prognostic information, a finding corroborated by other studies as well [33]. We could not reproduce the latter finding; however, we present further evidence that SUVmax could be a reliable prognostic factor in STS in general. Given the rarity of each sarcoma subgroup, we were not able to statistically analyze most of the individual subgroups. In different subgroups, different metrics may have a prognostic value, however, this needs further validation whenever large enough cohorts with the respective histology are available. In addition, small patient numbers may be one factor that leads to contradictory statements in different cohorts.
Our findings show that a higher SUVmax in ESFT is associated with shorter survival with a cutoff value of 5.5, which is in line with Hwang et al. who found the cutoff value to be at 5.8 [18] and others [17,19]. In our study, high TLG also correlated with short survival in ESFT patients, but less significant than SUVmax. Volume did not correlate with survival in ESFT (p = 0.08) in our cohort, despite the literature suggesting such an association [7].
In our cohort, SUVmax and other PET metrics were not significantly associated with survival in BS partly confirming the findings of some authors [9] and contradicting others who found SUVmax and TLG to be prognostic factors in osteosarcoma [15]. Andersen et al. also found that TLG adds prognostic value in BS, which was not the case in our study, but we found the same tendency (p = 0.054) [13]. Our findings showed that tumor volume itself was a significant predictor of survival in BS with a volume equal or higher than 127 cm3 indicative of short survival. Figure 7 shows an example of a high and low volume BS. This observation is consistent with one publication suggesting a cutoff at 150 cm3 for metastasis free survival [3].
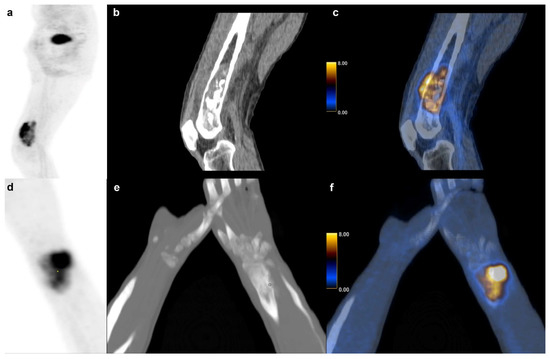
Figure 7.
Bone sarcoma: Dedifferentiated chondrosarcoma of a 73 y.o. patient with a survival of 6 months (231.9 cm3) in the right distal femur (a) sagittal FDG PET maximum intensity projection (b) CT and (c) fused FDG PET/CT images. (d–f) Osteosarcoma in a 14 y.o. patient with a (60.1 cm3) of the right radius and a survival of at least 101 months.
We found TLG to be significantly different between the three groups with BS showing the lowest median TLG value. This could be due to the fact that the BS group consisted substantially of osteosarcomas which per definition consist of a variable volume percentage of extracellular osteoid leading to lower metabolic activity in comparison to STSs or a highly active ESFTs.
The main limitations of our study are the retrospective nature and the relatively low number of cases due to the rarity of the disease. Despite screening over 52′000 PET/CT scans not more than 88 patients with FDG PET/CT scans for primary staging could be identified. This also limited the possibility of further subanalysis regarding other important risk factors, such as age or metastatic disease. Additionally, and also owed to this diseases nature the cohort is heterogeneous in terms of the histology. This leads to very small patient groups for several sarcoma types, not allowing to investigate the entity-specific best predictive PET metric. This would be even more complex if different age groups would be considered distinct. However, we were able to analyze the ESFT as a distinct subgroup in comparison to other STSs and BSs types.
Nevertheless, a metric such as SUVmax for STS patients could be further used in risk stratification and to assess tumor aggressiveness, which might have therapeutic implications. Furthermore, simple PET/CT metrics might not only add information about risk stratification. It has already been a proven tool in monitoring the success of therapy using SUVmax decrease in sarcomas [30,34,35,36,37,38].
5. Conclusions
We have demonstrated that survival-time and SUV-activity are linked in STS and ESFT with a higher SUVmax indicating poorer survival. However, this is not the case in BS in our cohort where we found a significant association between tumor volume and survival time, irrespective of FDG accumulation. Higher tumor volume indicated poorer survival and should therefore also be considered a predictor in the group of BS. Our results need further validation given the small cohort size and more research with higher patient numbers for the various subentities has to be carried out.
Author Contributions
R.I.H.—data collection, statistics, manuscript writing. D.A.F.—data collection, manuscript editing. B.B.-L.—pathology evaluation, manuscript editing. A.S.B.—statistics, data analysis. G.I.W.—data analyses, manuscript editing. D.A.M., G.U.E.—data collection, data analyses, manuscript editing. C.B., I.A.B.—study design and manuscript editing. All authors have read and agreed to the published version of the manuscript.
Funding
The Department of Nuclear Medicine holds an institutional Research Contract with GE Healthcare. The authors thank the Iten-Kohaut foundation for their financial support.
Institutional Review Board Statement
The study was conducted according to the guidelines of the Declaration of Helsinki, and approved by the local ethics committee of Zurich. The ethics committee waived informed consent for patients due to the retrospective nature of the study (BASEC Nr. 2017-00475).
Informed Consent Statement
Informed consent was waived by the local ethics committee.
Data Availability Statement
Patient imaging was done in the scope of routine clinical diagnostic studies, and the raw data are stored in the hospital archiving system at the Zurich University Hospital, Zurich, Switzerland.
Acknowledgments
The authors acknowledge the technicians Josephine Trinckauf and Marlena Hofbauer and their team for the excellent work on high quality PET images.
Conflicts of Interest
The authors declare that no competing financial interest exist. Author G.W. is an employee at PMOD Technologies. Author I.A.B. has received research grants and speaker honorarium from GE Healthcare. Authors R.I.H., A.S.B., B.B.-L., D.A.M., D.A.F. and C.B. declare no conflict of interest.
References
- Pisters, P.W.; Leung, D.H.; Woodruff, J.; Shi, W.; Brennan, M.F. Analysis of prognostic factors in 1,041 patients with localized soft tissue sarcomas of the extremities. J. Clin. Oncol. 1996, 14, 1679–1689. [Google Scholar] [CrossRef]
- Guillou, L.; Coindre, J.M.; Bonichon, F.; Nguyen, B.B.; Terrier, P.; Collin, F.; O Vilain, M.; Mandard, A.M.; Le Doussal, V.; Leroux, A.; et al. Comparative study of the National Cancer Institute and French Federation of Cancer Centers Sarcoma Group grading systems in a population of 410 adult patients with soft tissue sarcoma. J. Clin. Oncol. 1997, 15, 350–362. [Google Scholar] [CrossRef] [PubMed]
- Bieling, P.; Rehan, N.; Winkler, P.; Helmke, K.; Maas, R.; Fuchs, N.; Bielack, S.; Heise, U.; Jurgens, H.; Treuner, J.; et al. Tumor size and prognosis in aggressively treated osteosarcoma. J. Clin. Oncol. 1996, 14, 848–858. [Google Scholar] [CrossRef] [PubMed]
- Casali, P.G.; Bielack, S.; Abecassis, N.; Aro, H.; Bauer, S.; Biagini, R.; Bonvalot, S.; Boukovinas, I.; Bovee, J.V.M.G.; Brennan, B.; et al. Bone sarcomas: ESMO-PaedCan-EURACAN Clinical Practice Guidelines for diagnosis, treatment and follow-up. Ann. Oncol. 2018, 29, iv79–iv95. [Google Scholar] [CrossRef] [PubMed]
- Sostman, H.D.; Prescott, D.M.; Dewhirst, M.W.; Dodge, R.K.; E Thrall, D.; Page, R.L.; A Tucker, J.; Harrelson, J.M.; Reece, G.; A Leopold, K. MR imaging and spectroscopy for prognostic evaluation in soft-tissue sarcomas. Radiology 1994, 190, 269–275. [Google Scholar] [CrossRef]
- Tsagozis, P.; Brosjö, O.; Skorpil, M. Preoperative radiotherapy of soft-tissue sarcomas: Surgical and radiologic parameters associated with local control and survival. Clin. Sarcoma Res. 2018, 8, 19. [Google Scholar] [CrossRef] [Green Version]
- Miller, S.L.; Hoffer, F.A.; Reddick, W.; Wu, S.; Glass, J.O.; Gronemeyer, S.A.; Haliloglu, M.; Nikanorov, A.Y.; Xiong, X.; Pappo, A.S. Tumor volume or dynamic contrast-enhanced MRI for prediction of clinical outcome of Ewing sarcoma family of tumors. Pediatr. Radiol. 2001, 31, 518–523. [Google Scholar] [CrossRef]
- Gabriel, M.; Rubello, D. 18F-FDG PET-CT in soft tissue sarcomas: Staging, restaging, and prognostic value? Nucl. Med. Commun. 2016, 37, 3–8. [Google Scholar] [CrossRef]
- Andersen, K.F.; Fuglo, H.M.; Rasmussen, S.H.; Petersen, M.M.; Loft, A. Semi-Quantitative Calculations of Primary Tumor Metabolic Activity Using F-18 FDG PET/CT as a Predictor of Survival in 92 Patients with High-Grade Bone or Soft Tissue Sarcoma. Medicine 2015, 94, e1142. [Google Scholar] [CrossRef]
- Hong, S.-P.; Lee, S.E.; Choi, Y.-L.; Seo, S.W.; Sung, K.-S.; Koo, H.H.; Choi, J.Y. Prognostic value of 18F-FDG PET/CT in patients with soft tissue sarcoma: Comparisons between metabolic parameters. Skelet. Radiol. 2014, 43, 641–648. [Google Scholar] [CrossRef]
- Chang, K.J.; Lim, I.; Park, J.Y.; Jo, A.R.; Kong, C.B.; Song, W.S.; Jo, W.H.; Lee, S.Y.; Koh, J.S.; Kim, B.I.; et al. The Role of (18)F-FDG PET/CT as a Prognostic Factor in Patients with Synovial Sarcoma. Nucl. Med. Mol. Imaging 2015, 49, 33–41. [Google Scholar] [CrossRef] [PubMed] [Green Version]
- Choi, E.-S.; Ha, S.-G.; Kim, H.-S.; Ha, J.H.; Paeng, J.C.; Han, I. Total lesion glycolysis by 18F-FDG PET/CT is a reliable predictor of prognosis in soft-tissue sarcoma. Eur. J. Nucl. Med. Mol. Imaging 2013, 40, 1836–1842. [Google Scholar] [CrossRef] [PubMed]
- Andersen, K.F.; Fuglo, H.M.; Rasmussen, S.H.; Petersen, M.M.; Loft, A. Volume-Based F-18 FDG PET/CT Imaging Markers Provide Supplemental Prognostic Information to Histologic Grading in Patients With High-Grade Bone or Soft Tissue Sarcoma. Medicine 2015, 94, e2319. [Google Scholar] [CrossRef] [PubMed]
- Chen, L.; Wu, X.; Ma, X.; Guo, L.; Zhu, C.; Li, Q. Prognostic value of 18F-FDG PET-CT-based functional parameters in patients with soft tissue sarcoma: A meta-analysis. Medicine 2017, 96, e5913. [Google Scholar] [CrossRef] [PubMed]
- Costelloe, C.M.; Macapinlac, H.A.; Madewell, J.E.; Fitzgerald, N.E.; Mawlawi, O.R.; Rohren, E.M.; Raymond, A.K.; Lewis, V.O.; Anderson, P.M.; Bassett, R.L.; et al. 18F-FDG PET/CT as an indicator of progression-free and overall survival in osteosarcoma. J. Nucl. Med. 2009, 50, 340–347. [Google Scholar] [CrossRef] [Green Version]
- Byun, B.H.; Kong, C.-B.; Park, J.; Seo, Y.; Lim, I.; Choi, C.W.; Cho, W.H.; Jeon, D.-G.; Koh, J.-S.; Lee, S.-Y.; et al. Initial metabolic tumor volume measured by 18F-FDG PET/CT can predict the outcome of osteosarcoma of the extremities. J. Nucl. Med. 2013, 54, 1725–1732. [Google Scholar] [CrossRef] [Green Version]
- Jamet, B.; Carlier, T.; Campion, L.; Bompas, E.; Girault, S.; Borrely, F.; Ferrer, L.; Rousseau, M.; Venel, Y.; Kraeber-Bodéré, F.; et al. Initial FDG-PET/CT predicts survival in adults Ewing sarcoma family of tumors. Oncotarget 2017, 8, 77050–77060. [Google Scholar] [CrossRef] [Green Version]
- Hwang, J.P.; Lim, I.; Kong, C.-B.; Jeon, D.G.; Byun, B.H.; Kim, B.I.; Choi, C.W.; Lim, S.M. Prognostic Value of SUVmax Measured by Pretreatment Fluorine-18 Fluorodeoxyglucose Positron Emission Tomography/Computed Tomography in Patients with Ewing Sarcoma. PLoS ONE 2016, 11, e0153281. [Google Scholar] [CrossRef] [Green Version]
- Salem, U.; Amini, B.; Chuang, H.H.; Daw, N.C.; Wei, W.; Haygood, T.M.; Madewell, J.E.; Costelloe, C.M. 18F-FDG PET/CT as an Indicator of Survival in Ewing Sarcoma of Bone. J. Cancer 2017, 8, 2892–2898. [Google Scholar] [CrossRef] [Green Version]
- The ESMO/European Sarcoma Network Working Group. Soft tissue and visceral sarcomas: ESMO Clinical Practice Guidelines for diagnosis, treatment and follow-up. Ann. Oncol. 2014, 25 (Suppl. 3), iii113–iii123. [Google Scholar] [CrossRef]
- Bridge, J.A. WHO Classification of Tumours of Soft Tissue and Bone, 4th ed. World Health Organization Classification of Tumours. Available online: http://gbv.eblib.com/patron/FullRecord.aspx?p=4661026 (accessed on 6 May 2018).
- Kitao, T.; Shiga, T.; Hirata, K.; Sekizawa, M.; Takei, T.; Yamashiro, K.; Tamaki, N. Volume-based parameters on FDG PET may predict the proliferative potential of soft-tissue sarcomas. Ann. Nucl. Med. 2019, 33, 22–31. [Google Scholar] [CrossRef] [PubMed]
- Sarculator. Available online: http://www.sarculator.com (accessed on 12 June 2019).
- Callegaro, D.; Miceli, R.; Bonvalot, S.; Ferguson, P.; Strauss, D.C.; Levy, A.; Griffin, A.; Hayes, A.; Stacchiotti, S.; Le Pechoux, C.; et al. Development and external validation of two nomograms to predict overall survival and occurrence of distant metastases in adults after surgical resection of localised soft-tissue sarcomas of the extremities: A retrospective analysis. Lancet Oncol. 2016, 17, 671–680. [Google Scholar] [CrossRef]
- Frustaci, S.; Gherlinzoni, F.; De Paoli, A.; Bonetti, M.; Azzarelli, A.; Comandone, A.; Olmi, P.; Buonadonna, A.; Pignatti, G.; Barbieri, E.; et al. Adjuvant chemotherapy for adult soft tissue sarcomas of the extremities and girdles: Results of the Italian randomized cooperative trial. J. Clin. Oncol. 2001, 19, 1238–1247. [Google Scholar] [CrossRef] [PubMed]
- Eilber, F.C.; Brennan, M.; Eilber, F.R.; Eckardt, J.J.; Grobmyer, S.R.; Riedel, E.; Forscher, C.; Maki, R.G.; Singer, S. Chemotherapy is associated with improved survival in adult patients with primary extremity synovial sarcoma. Ann. Surg. 2007, 246, 105–113. [Google Scholar] [CrossRef] [PubMed]
- Gronchi, A.; Frustaci, S.; Mercuri, M.; Martin, J.; Pousa, A.L.; Verderio, P.; Mariani, L.; Valagussa, P.; Miceli, R.; Stacchiotti, S.; et al. Short, full-dose adjuvant chemotherapy in high-risk adult soft tissue sarcomas: A randomized clinical trial from the Italian Sarcoma Group and the Spanish Sarcoma Group. J. Clin. Oncol. 2012, 30, 850–856. [Google Scholar] [CrossRef]
- Woll, P.J.; Reichardt, P.; Le Cesne, A.; Bonvalot, S.; Azzarelli, A.; Hoekstra, H.J.; Leahy, M.; Van Coevorden, F.; Verweij, J.; Hogendoorn, P.; et al. Adjuvant chemotherapy with doxorubicin, ifosfamide, and lenograstim for resected soft-tissue sarcoma (EORTC 62931): A multicentre randomised controlled trial. Lancet Oncol. 2012, 13, 1045–1054. [Google Scholar] [CrossRef]
- Steiger, S.; Arvanitakis, M.; Sick, B.; Weder, W.; Hillinger, S.; Burger, I.A. Analysis of Prognostic Values of Various PET Metrics in Preoperative 18F-FDG PET for Early-Stage Bronchial Carcinoma for Progression-Free and Overall Survival: Significantly Increased Glycolysis Is a Predictive Factor. J. Nucl. Med. 2017, 58, 1925–1930. [Google Scholar] [CrossRef] [Green Version]
- Schuetze, S.M.; Rubin, B.P.; Vernon, C.; Hawkins, D.S.; Bruckner, J.D.; Conrad, E.U.; Eary, J.F. Use of positron emission tomography in localized extremity soft tissue sarcoma treated with neoadjuvant chemotherapy. Cancer 2005, 103, 339–348. [Google Scholar] [CrossRef]
- Skamene, S.R.; Rakheja, R.; Dalhstrom, K.R.; Roberge, D.; Nahal, A.; Charest, M.; Turcotte, R.; Hickeson, M.; Freeman, C. Metabolic activity measured on PET/CT correlates with clinical outcomes in patients with limb and girdle sarcomas. J. Surg. Oncol. 2014, 109, 410–414. [Google Scholar] [CrossRef]
- Casey, D.L.; Wexler, L.H.; Fox, J.J.; Dharmarajan, K.V.; Schoder, H.; Price, A.N.; Wolden, S.L. Predicting outcome in patients with rhabdomyosarcoma: Role of (18)ffluorodeoxyglucose positron emission tomography. Int. J. Radiat. Oncol. Biol. Phys. 2014, 90, 1136–1142. [Google Scholar] [CrossRef]
- Ha, S.C.; Oh, J.S.; Roh, J.-L.; Moon, H.; Kim, J.S.; Cho, K.-J.; Choi, S.-H.; Nam, S.Y.; Kim, S.Y. Pretreatment tumor SUVmax predicts disease-specific and overall survival in patients with head and neck soft tissue sarcoma. Eur. J. Nucl Med. Mol. Imaging 2016, 44, 33–40. [Google Scholar] [CrossRef] [PubMed]
- Hawkins, D.S.; Schuetze, S.M.; Butrynski, J.E.; Rajendran, J.G.; Vernon, C.B.; Conrad, E.U.; Eary, J.F. 18FFluorodeoxyglucose positron emission tomography predicts outcome for Ewing sarcoma family of tumors. J. Clin. Oncol. 2005, 23, 8828–8834. [Google Scholar] [CrossRef]
- Raciborska, A.; Bilska, K.; Drabko, K.; Michalak, E.; Chaber, R.; Pogorzala, M.; Polczynska, K.; Sobol, G.; Wieczorek, M.; Muszynskaroslan, K.; et al. Response to chemotherapy estimates by FDG PET is an important prognostic factor in patients with Ewing sarcoma. Clin. Transl. Oncol. 2016, 18, 189–195. [Google Scholar] [CrossRef] [PubMed]
- Sheikhbahaei, S.; Marcus, C.; Hafezi-Nejad, N.; Taghipour, M.; Subramaniam, R.M. Value of FDG PET/CT in Patient Management and Outcome of Skeletal and Soft Tissue Sarcomas. PET Clin. 2015, 10, 375–393. [Google Scholar] [CrossRef] [PubMed]
- Benz, M.R.; Czernin, J.; Tap, W.D.; Eckardt, J.J.; Seeger, L.L.; Allen-Auerbach, M.S.; Dry, S.M.; Phelps, M.E.; Weber, W.A.; Eilber, F.C. FDG-PET/CT Imaging Predicts Histopathologic Treatment Responses after Neoadjuvant Therapy in Adult Primary Bone Sarcomas. Sarcoma 2010, 2010, 143540. [Google Scholar] [CrossRef] [PubMed]
- Herrmann, K.; Benz, M.R.; Czernin, J.; Allen-Auerbach, M.S.; Tap, W.D.; Dry, S.M.; Schuster, T.; Eckardt, J.J.; Phelps, M.E.; Weber, W.A.; et al. 18F-FDG-PET/CT Imaging as an early survival predictor in patients with primary high-grade soft tissue sarcomas undergoing neoadjuvant therapy. Clin. Cancer Res. 2012, 18, 2024–2031. [Google Scholar] [CrossRef] [Green Version]
Publisher’s Note: MDPI stays neutral with regard to jurisdictional claims in published maps and institutional affiliations. |
© 2021 by the authors. Licensee MDPI, Basel, Switzerland. This article is an open access article distributed under the terms and conditions of the Creative Commons Attribution (CC BY) license (https://creativecommons.org/licenses/by/4.0/).