Abstract
This study investigated the dynamic behavior of AA7075 plates joined by Friction Stir Welding (FSW), focusing on the influence of key process parameters, rotation, and traverse speeds, on the resulting dynamic characteristics. Experimental Modal Analysis (EMA) was performed under free boundary conditions to determine resonance frequencies, mode shapes, and damping ratios, revealing that an increase in traverse speed consistently led to a decrease in natural frequencies across most modes, thereby indicating reduced joint stiffness attributed to insufficient heat input. Furthermore, localized weld defects caused significant damping variations, particularly in low-order modes. To complement the experimental findings and enable simultaneous, multi-output prediction of these coupled dynamic parameters, a Co-Active Neuro-Fuzzy Inference System (CANFIS) model was developed. The CANFIS architecture utilized spindle speed and feed rate as inputs to predict natural frequency and damping ratio for multiple vibration modes as tightly coupled outputs. The trained model demonstrated strong agreement and high predictive accuracy against the EMA experimental data, with convergence analysis confirming its stable learning and excellent generalization capability. The successful integration of EMA and CANFIS establishes a robust hybrid framework for both physical interpretation and intelligent, coupled prediction of the dynamic behavior of FSW-welded AA7075 plates.
1. Introduction
The contemporary engineering and manufacturing sectors, driven by the need to achieve ambitious net-zero emission targets and develop sustainable practices, are increasingly reliant on advanced joining technologies. Among these, Friction Stir Welding (FSW) has emerged as a particularly promising solid-state technique, vital for industries such as automotive and aerospace that demand lightweight, high-strength materials like AA7075, as well as various copper, magnesium, and titanium alloys, and even steels (Mishra and Ma [1], Singh et al. [2], Küçüköğeroğlu et al. [3], Çam et al. [4], İpekoğlu and Çam [5] and Ahmed et al. [6]). Unlike traditional fusion methods, FSW successfully bonds these materials without melting the base metal. The process utilizes a non-consumable, rotating tool whose frictional heat softens the material, enabling the specialized pin to physically stir and mix the components across the joint line, resulting in a strong, continuous bond (Sami and Sahin [7] and Chen et al. [8]). While FSW offers significant advantages, including the avoidance of solidification defects, a minimal heat-affected zone, and high energy efficiency, its widespread industrial adoption is still hindered by specific weld flaws like keyhole defects, kiss joints, and weld thinning. The quality and mechanical properties of the final joint are critically dependent on the tool pin’s geometry, as this design directly dictates the localized heat generation and material flow within the weld zone. Extensive research is therefore focused on optimizing tool pin designs to facilitate FSW’s transition to a foundational commercial manufacturing technology (Zhao et al. [9], Sabry et al. [10] and Sabry [11]).
The successful implementation of FSW in critical engineering systems requires a detailed understanding of the joint’s performance under dynamic loads. Consequently, characterizing the fatigue characteristics and, more fundamentally, the dynamic properties of these components is essential (Haagersen et al. [12], Dickersen and Przydatek [13] and Chen et al. [14]). Dynamic characteristics such as natural frequencies and vibration mode shapes are critical for ensuring stable and safe operation, as excitation near a natural frequency can trigger resonance, potentially leading to catastrophic structural failure (Kosturek [15], Czechowski [16] and Edwards and Ramulu [17]). The dynamic behavior of FSW joints is inherently influenced by the intricate interplay between the welding operation parameters and the residual thermal stress induced during the process. Numerical techniques, such as FEM model updating, provide powerful predictive tools, yet they struggle to accurately predict the damping ratio, a crucial dynamic property (Abdelmoulo [18], Zahari et al. [19], Zahari et al. [20] and Nazri et al. [21]).
This limitation, coupled with the time and expense associated with experimental characterization, has driven a significant shift toward data-driven machine learning (ML) approaches (Zaparoli [22]). ML models, such as the Adaptive Neuro-Fuzzy Inference System (ANFIS), have demonstrated high accuracy in predicting FSW outcomes (Dewan et al. [23], Shehabeldeen et al. [24], Das [25], Ashok and Ponni [26], Djouider et al. [27] and Rao et al. [28]). However, existing ANFIS models are typically Single-Input-Single-Output (SISO) or Multiple-Input-Single-Output (MISO), insufficient for the simultaneous, coupled prediction of dynamic properties, as natural frequency and damping ratio are physically coupled. The Co-active Neuro-Fuzzy Inference System (CANFIS) addresses this architectural limitation by providing a Multiple-Input-Multiple-Output (MIMO) framework, utilizing parallel, interacting inference modules to capture critical cross-coupling effects (Van Niekerk et al. [29], Zapata et al. [30], Muradova et al. [31], Zong et al. [32], Krishnamurthy and Rakkiyannan [33] and Ambekar and Kittur [34]).
This study provides a detailed investigation into the dynamic behavior of AA7075 plates joined by FSW, a method crucial for critical engineering applications. Recognizing that FSW process parameters like rotation and traverse speeds directly influence the final weld microstructure, the primary objective of this work was twofold: first, to determine the effect of these varying speeds on the dynamic characteristics of the resulting weld joints experimentally; and second, to develop an advanced machine learning model for prediction. To achieve the first objective, Experimental Modal Analysis (EMA) was utilized as a non-destructive technique to experimentally determine the dynamic properties (natural frequencies, anti-resonance frequencies, vibration damping ratios, and vibration mode shapes) of the structures. These experimental results, which established a direct relationship between FSW process parameters and dynamic performance, were then leveraged to develop a Co-active Neuro-Fuzzy Inference System (CANFIS) model. This CANFIS architecture was strategically implemented to overcome the limitations of standard ANFIS by enabling the simultaneous and coupled prediction of the dynamic properties of the FSW joints. The successful development of this CANFIS model, utilizing the robust data yielded from EMA, yields critical data and a powerful predictive tool essential for ensuring the safe and stable operation of engineering systems.
2. Materials and Methods
2.1. Friction Stir Welding of AA7075 Plates
In the present experimental design, tool geometry, tilt angle, plunge depth, and other process-related parameters were kept constant for all welding conditions. Therefore, rotational speed and traverse speed were selected as the primary input variables, as they represent the dominant controllable parameters governing heat generation and material flow, while the effects of other parameters are implicitly embedded in the experimental response.
The Friction Stir Welding (FSW) process was conducted on a CNC milling machine under three distinct rotational speeds (1800, 2000, and 2200 rpm) and four different traverse speeds (15, 20, 25 and 30 mm/min). An illustration of the FSW process setup is provided in Figure 1.
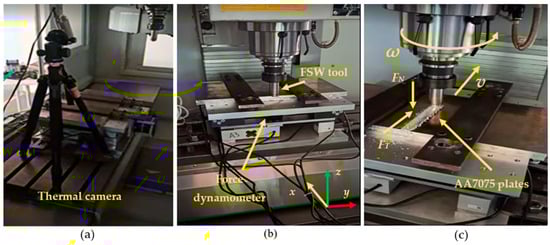
Figure 1.
FSW process images: (a) Thermal camera for temperature measurement, (b) coordinate system, (c) axial and tangential forces.
The thrust force (normal force) and feed force (tangential force) were measured using a two-axis dynamometer. Prior to the measurements, the dynamometer was calibrated and its repeatability was assessed. The thrust force was generated by providing a vertical plunge depth after the processing pin was zeroed on the workpiece. The resulting force-time graphs for a single specimen are shown in Figure 2.
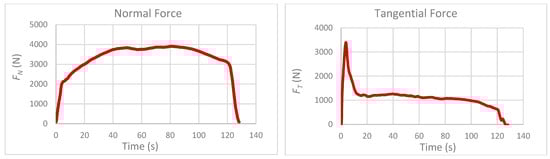
Figure 2.
Force graphs (ω: 1800 rpm, v: 25 mm/min).
The temperature distributions on the samples during the joining processes were determined via thermal imaging (Figure 1a). To quantitatively analyze these data, the temperature variation along the y-axis was examined on a line located 5 mm behind the tool center (Figure 3a). The resulting temperature variation trends captured by the thermal camera for one of the samples are shown in Figure 3b.
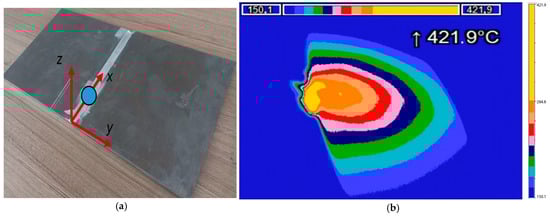
Figure 3.
(a) Coordinate systems and (b) temperature distribution plots of the Friction Stir Welding (FSW) process.
Higher rotational speeds of the pin tip generate higher temperatures. The maximum temperature of the welding pin shown in Figure 3b is 421.9 °C, which corresponds to 88.45% of the solidification temperature of the AA7075 alloy. For faster welding, the weld temperature must be appropriately increased. When the temperature is insufficient, the temperature distribution in the weld stir zone will not meet the thermal requirements at high welding speeds. Due to an extended preheating time, the preheating zone maintains a higher temperature at the start of welding. However, as the welding process continues the temperature of this preheating zone gradually decreases.
The taper cylindrical pinned stirring tool used during the FSW process was manufactured from stainless steel. The geometry and an image of the tool are presented in Figure 4.
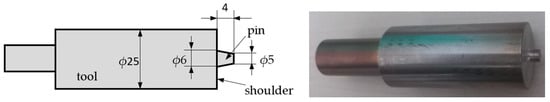
Figure 4.
Stirring tool and its geometry used in the FSW process.
2.2. Dynamic Analysis of Friction Stir-Welded AA7075 Plates
This study uses EMA to investigate the dynamic properties of friction stir-welded AA7075 plates. Unlike theoretical methods, EMA is a data-driven approach that measures a physical structure’s response to an applied excitation force, typically from a modal hammer or shaker. The core of this process is the collection of paired excitation and response data, which is then used to compute Frequency Response Functions (FRFs). Acting as a dynamic fingerprint, each FRF is the frequency-domain ratio of the system’s output to its input, capturing crucial information about the structure’s behavior under dynamic loads.
In the EMA process, the initial step is to perform experimental planning to determine the response and excitation points on the samples to be analyzed. Examples of the samples prepared for EMA, showing the response and excitation points, are provided in Figure 5. The samples in this study were obtained by joining 150 × 150 × 8 mm plates via FSW. This was conducted under various operational parameters, specifically rotational speeds of 1800, 2000, and 2200 rpm, and welding speeds of 15, 20, 25 and 30 mm/min.
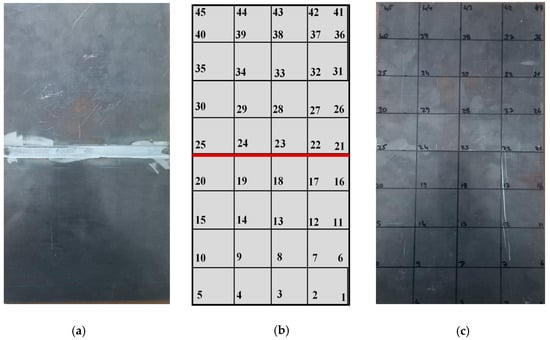
Figure 5.
EMA nodal planning, (a) FSWed plate, (b) measurement and excitation coordinates (red line corresponds the weld line), (c) portioned plate.
For the EMA studies, the analysis of the samples was conducted under free-boundary conditions. To achieve this, very small holes were drilled into two corners of each sample, which were then suspended from a test stand using thin thread. A single-axis accelerometer (Dytran-3097A2/2373-Dytran Instruments Inc., Chatsworth, SC, USA) was positioned at the bottom corner of the samples (coordinate 1) to capture all vibration modes. The accelerometer was placed at this point because it is mobile in all mode shapes and does not coincide with any nodal points. This ensures that all data acquired from the accelerometer is meaningful. Subsequently, the plates were excited with a modal hammer (Kistler-9724A200/SN2069942-Kistler Group, Winterthur, Switzerland) by applying three impacts at each coordinate, sequentially from coordinate 1 to 45. In this context, it is crucial to avoid the double-hit effect when using the modal hammer and to strike the designated coordinate points accurately. To achieve this, each excitation point was struck three times with the modal hammer, taking care to avoid any double hits. The resulting excitation force and acceleration response data were then recorded. During the vibration tests, the sampling frequency was set to at least twice the maximum vibration frequency to satisfy the Nyquist criterion, considering the predetermined frequency band for the samples. Prior to the main experiments, standard Linearity, Reciprocity, and Repeatability checks were conducted on the experimental setup. The EMA test setup with FFT analyzer (OROS Group, Montbonnot Saint Martin, France) is shown schematically in Figure 6.
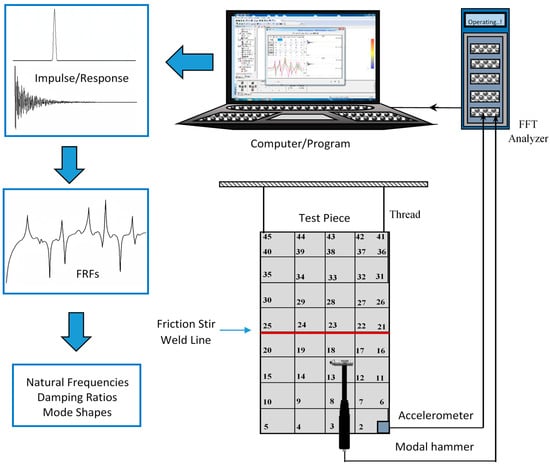
Figure 6.
EMA test setup schematic illustration.
An exemplary excitation and response time signal for one sample is shown in Figure 7, while a visual of the EMA process is provided in Figure 8.
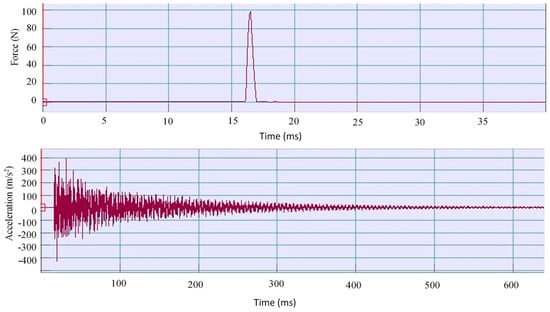
Figure 7.
An example of excitation and response signals in the time domain.
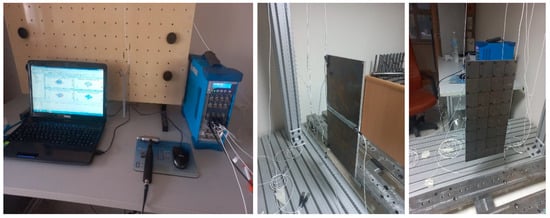
Figure 8.
EMA test setup.
The acquired time-domain data were converted to the frequency domain by performing a Fast Fourier Transform (FFT), and Frequency Response Functions (FRFs) of the accelerance type were obtained from the ratio of the response to the excitation. This data can also be integrated to be converted into mobility and receptance. Some of the FRFs for one of the samples are presented in Figure 9.
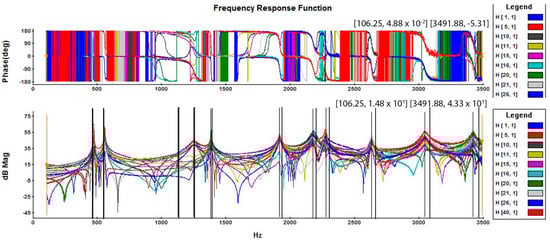
Figure 9.
All obtained FRFs of a FSWed plate sample.
The Modal Indication Function, derived from the obtained FRFs, was then processed over a selected frequency band (0–3500 Hz) to extract the first 11 resonance frequencies of the sample. Based on this analysis, Modal Indication Function and Stabilization Chart were generated (Figure 10 and Figure 11).
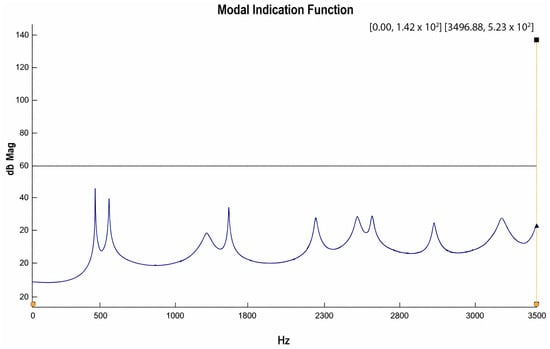
Figure 10.
Modal Indication Function belongs to one of the samples.
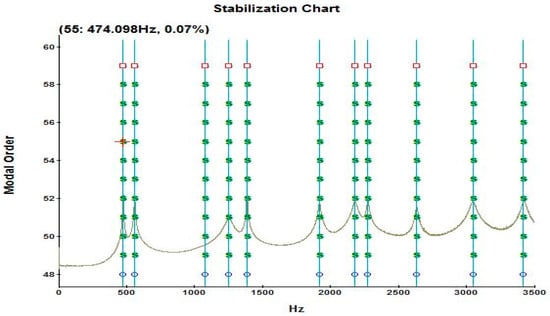
Figure 11.
Stabilization Chart belongs to one of the samples.
The distinct peaks in the Modal Indication Function (MIF) and Stabilization Chart plots, shown in Figure 10 and Figure 11, respectively, represent the structure’s resonance points, which are its natural frequencies. These peaks indicate the frequencies where the amplitude of an externally applied vibration reaches its maximum, pointing to the modes where the structure stores the highest amount of energy. Therefore, the peaks obtained from these plots allow us to accurately determine the structure’s vibration modes and their corresponding natural frequency values.
The vibration mode shapes obtained from different samples were compared using the Modal Assurance Criterion (MAC) (Equation (1)).
In Equation (1), ϕA and ϕB represent the mode shape vectors to be compared. The subscripts i and j denote the corresponding modes. Accordingly, if a linear relationship exists between the two mode shape vectors, the MAC value will approach 1, whereas it will approach 0 if no linear relationship exists. The degree of the MAC value therefore represents the similarity ratio between the mode shape vectors.
The damping ratios (ζ) were determined from the natural frequencies by applying the Half-Power Bandwidth Method. This involved calculating the ratios via Equation (2) (Treszkai et al. [35]), based on the analysis of the frequency spectrum’s half-power peaks (Figure 12).
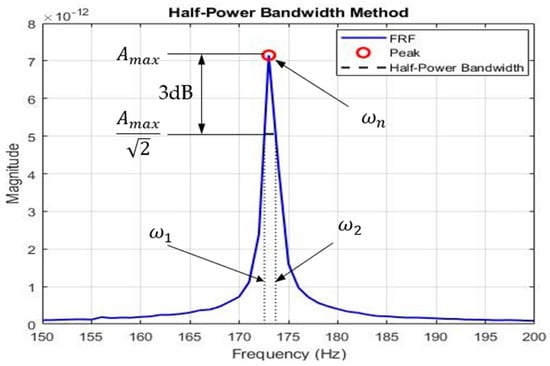
Figure 12.
Half-Power Bandwidth Method for determining damping ratios (Treszkai et al. [35]).
3. Experimental Results
The resonance frequency and damping values obtained from the experimental modal analysis of the joined samples are summarized in Table 1, Table 2 and Table 3.

Table 1.
Natural Frequencies and damping ratios (1800 rpm).
Table 2.
Natural Frequencies and damping ratios (2000 rpm).
Table 3.
Natural Frequencies and damping ratios (2200 rpm).
An analysis of the natural frequency values (Table 1, Table 2 and Table 3 and Figure 13, Figure 14, Figure 15, Figure 16 and Figure 17) reveals a consistent decreasing trend with increasing traverse speed across the examined modes. This global reduction is primarily attributed to the decreased heat input per unit length, which hinders adequate material plasticization and promotes the formation of volumetric defects (e.g., tunnel voids, kissing bonds), thereby degrading global stiffness. Notably, this stiffness degradation manifests nonlinearly; while a gradual frequency decline in the 15–25 mm/min range suggests minor microstructural evolution (e.g., precipitate dissolution), the abrupt drop observed at 30 mm/min (particularly evident in modes such as 2 and 4) indicates a critical thermal threshold where severe geometric defects compromise the structural integrity.
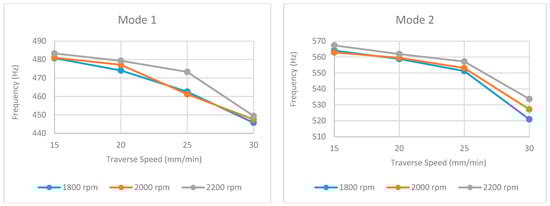
Figure 13.
Obtained natural frequencies under different traverse and rotational speeds for mode 1 and mode 2.
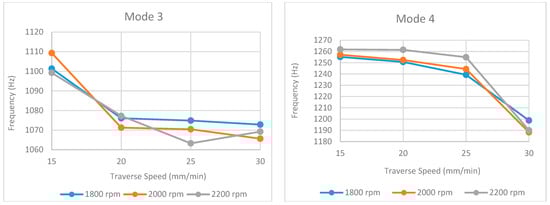
Figure 14.
Obtained natural frequencies under different traverse and rotational speeds for mode 3 and mode 4.
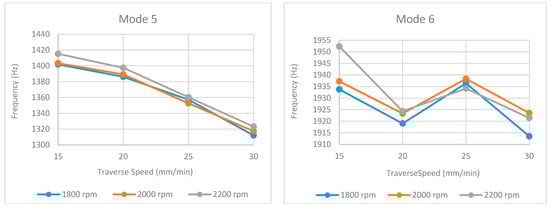
Figure 15.
Obtained natural frequencies under different traverse and rotational speeds for mode 5 and mode 6.
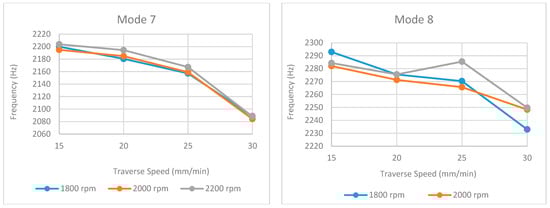
Figure 16.
Obtained natural frequencies under different traverse and rotational speeds for mode 7 and mode 8.
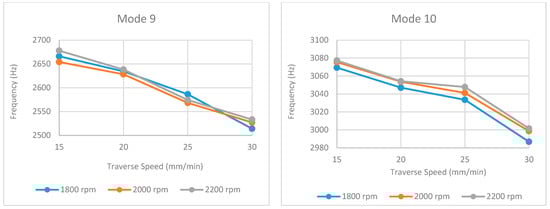
Figure 17.
Obtained natural frequencies under different traverse and rotational speeds for mode 9 and mode 10.
The damping ratios corresponding to the natural frequencies obtained for each mode examined were determined. The damping ratios obtained for different rotational and traverse speeds are presented using comparative bar charts in Figure 18, Figure 19, Figure 20, Figure 21 and Figure 22.
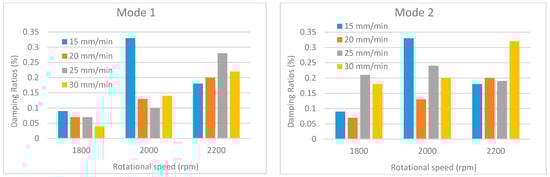
Figure 18.
Damping ratios under different traverse and rotational speeds for mode 1 and mode 2.
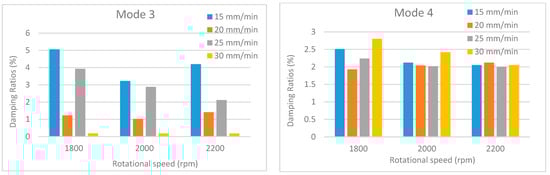
Figure 19.
Damping ratios under different traverse and rotational speeds for mode 3 and mode 4.
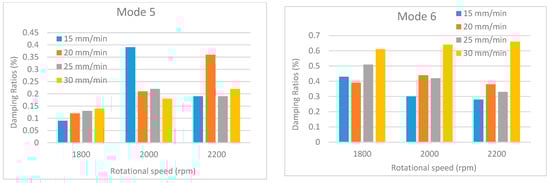
Figure 20.
Damping ratios under different traverse and rotational speeds for mode 5 and mode 6.
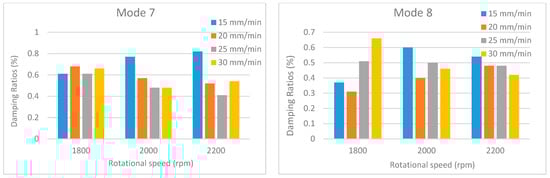
Figure 21.
Damping ratios under different traverse and rotational speeds for mode 7 and mode 8.
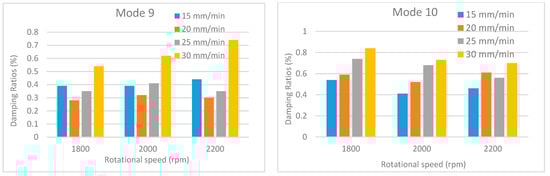
Figure 22.
Damping ratios under different traverse and rotational speeds for mode 9 and mode 10.
An examination of the comparative damping ratio charts presented in Figure 18, Figure 19, Figure 20, Figure 21 and Figure 22 reveals significant fluctuations in the damping ratios for certain modes (modes 1–3). In contrast, the damping ratio fluctuations observed in the other modes are remain considerably lower. This situation is closely related to the vibration characteristic and energy dissipation within the welded structures. Damping is a measure of how quickly a system dissipates energy, and this dissipation mechanism depends on the mode, frequency, and the location of defects in the structure. Low-order modes (particularly the first, second, and third bending/torsional modes) are the most sensitive to the overall stiffness and boundary conditions of the structure. These modes can distribute a large portion of the vibrational energy across the entire structure, including the weld region. Since the weld region is where the stiffness is most affected, these modes are subjected to the highest stress and deformation here. Furthermore, low-order modes can dissipate energy more rapidly through mechanisms such as micro-slip, friction at crack tips, or unbonded/poorly bonded surfaces within the weld region. As process parameters (speed, temperature) change, these friction and energy dissipation mechanisms also change significantly, leading to major fluctuations in the damping ratios.
Additionally, as the traverse speed changes, the size and geometry of defects, such as voids or incomplete bonding (kissing bonds), formed at the weld trailing edge can also change. The coincidence of the high strain energy or large displacements of the low-order modes with the regions where these defects are located can cause a sudden and significant increase in the damping ratio. Conversely, higher-order modes exhibit greater tolerance toward defect locations due to their larger number of vibration nodal points. If a defect is located near a nodal point, its effect on damping is minimized, which tends to keep the overall damping fluctuation at a lower level.
Each vibration mode responds with a different sensitivity to the stiffness variations within the welded structure. For instance, modes that induce large displacements in the weld region (where stiffness change is most pronounced) are more susceptible to weld defects and the discontinuities they create. Consequently, the effect of these defects on the natural frequencies is more significant and clearly observable in these specific modes. Vibration mode shapes for one of the FSW-welded plate samples are shown in Table 4.
Table 4.
Vibration mode shapes for the first 11 modes obtained for one of the FSW-welded plate samples.
MAC comparisons were conducted for the mode shapes obtained from each sample, some of which are presented in Table 5 and Table 6. An examination of the MAC comparison tables reveals that the lowest similarity value corresponds to the third vibration mode. This result demonstrates that the effect of stiffness irregularities in the weld seam region is more pronounced on the torsional vibrations.
Table 5.
MAC Comparison: Samples obtained under 15–30 mm/min traverse speeds and 1800 rpm rotational speed.
Table 6.
MAC Comparison: Samples obtained under 1800–2000 rpm rotational speeds and 20 mm/min traverse speed.
4. CANFIS Model
Adaptive Neuro-Fuzzy Inference Systems (ANFISs) have been widely employed in friction stir welding studies for predicting individual process responses, owing to their capability to combine fuzzy reasoning with adaptive learning. However, conventional ANFIS implementations are typically formulated for single-output prediction, and extending them to problems involving multiple correlated outputs generally requires the use of multiple independent ANFIS models trained separately for each response variable. Such an approach neglects the shared inference structure and common process dependencies among different output quantities.
In the present study, the dynamic characterization of friction stir-welded AA7075 plates requires the simultaneous prediction of multiple modal parameters, namely natural frequencies and damping ratios associated with different vibration modes, using a common set of welding parameters. To address this multi-input–multi-output (MIMO) requirement within a unified modeling framework, a Co-Active Neuro-Fuzzy Inference System (CANFIS) was adopted. Unlike multiple independent ANFIS models, CANFIS employs a shared fuzzy rule base and common premise parameters while allowing multiple output nodes to be estimated concurrently. This structure enables consistent and simultaneous prediction of multiple physically related dynamic responses and provides a more coherent representation of the underlying process–response relationships. Therefore, the use of CANFIS in this study is not intended as a direct performance comparison with classical ANFIS-based models, but as a methodological extension suitable for coupled multi-output prediction in vibration-based analysis of friction stir-welded structures.
In this context, a CANFIS model was employed to predict the dynamic response characteristics of the system in terms of natural frequencies and damping ratios. The CANFIS approach was selected due to its proven capability in modeling highly nonlinear relationships and its effective multi-output prediction performance demonstrated in the previous studies. The developed CANFIS structure is formulated as a two-input and two-output prediction model. The input parameters consist of spindle speed, defined at three discrete levels, and feed rate, defined at four discrete levels, which together represent the dominant operational variables of the system. For each experimental condition, two output parameters, namely natural frequency and damping ratio, were estimated simultaneously for the first ten vibration modes, resulting in a total of twenty dynamic response outputs considered in the modeling framework. It should be noted that the CANFIS model employed in this study is not intended to function as a large-scale data-driven machine learning predictor. Instead, it is used as a compact and interpretable neuro-fuzzy framework specifically suited for small experimental datasets. The primary objective of the CANFIS implementation is to capture the coupled and localized nonlinear relationships between the friction stir welding parameters and the corresponding modal characteristics within the experimentally investigated parameter space. The five-layer CANFIS architecture developed in this study is illustrated in Figure 23.
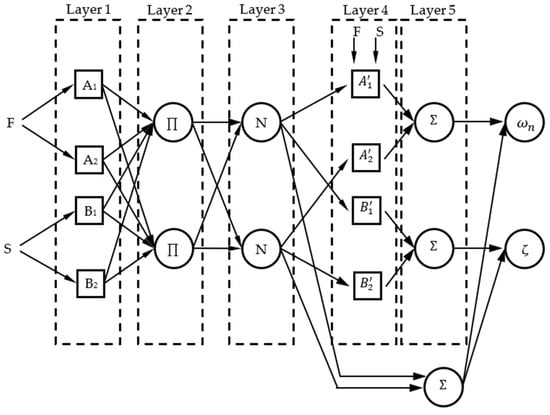
Figure 23.
CANFIS architecture employed for the prediction of natural frequencies and damping ratios based on spindle speed and feed rate inputs.
From an interpretability perspective, the five-layer CANFIS architecture illustrated in Figure 22 provides clear insight into how the input parameters influence the predicted modal responses. In Layer 1 (Fuzzification Layer), the spindle speed and feed rate inputs are transformed into overlapping fuzzy regions through membership functions, allowing smooth transitions between different operating conditions. Layer 2 (Rule Layer) combines these fuzzy inputs to generate rule activations, where each rule represents a localized dynamic relationship between the operational parameters and the modal responses. In Layer 3 (Normalization Layer), the firing strengths of all activated rules are proportionally scaled to ensure balanced contributions and to prevent the dominance of any single rule. Layer 4 (Consequent Layer) computes local linear outputs associated with each rule, enabling the model to capture subtle variations in natural frequencies and damping ratios across different vibration modes. Finally, in Layer 5 (Output Layer), all rule-based contributions are aggregated to produce the final crisp predictions of the modal parameters. This layered and rule-based reasoning mechanism allows the CANFIS model to function not only as a powerful predictive tool but also as an interpretable framework for understanding the dynamic behavior of the system under varying operational conditions.
A MATLAB (R 2015a) code was developed using the theoretical framework based on the CANFIS architecture given in Figure 23. The program first reads the measured input–output data from an external Excel file, arranges them in matrix form, and separates the samples into training and testing subsets. Due to the limited number of experimental samples, a controlled hold-out strategy was adopted instead of random data splitting. The testing samples were deterministically selected from distinct parameter combinations and were excluded from the training process to avoid data leakage. The testing phase is therefore intended as a consistency and stability evaluation within the investigated parameter space rather than a statistical generalization test. This preprocessing step ensures that the learning algorithm works on properly structured data and that the predictive performance of the model can be assessed on unseen samples. After data loading, the CANFIS structure is defined in terms of the number of inputs and outputs, the type and number of membership functions assigned to each input, and the resulting fuzzy rule base. To mitigate model complexity and reduce the risk of overfitting under small-sample conditions, the number of membership functions assigned to each input variable was intentionally limited to three. Simple Gaussian membership functions were adopted, resulting in a compact rule base and a reduced number of trainable premise and consequent parameters. Once the network architecture is specified, initial values are assigned to the premise parameters (membership function centers and spreads) and to the consequent parameters of the first-order Takagi–Sugeno functions associated with each rule. These initial values provide a starting point for the adaptive optimization process. During training, the MATLAB code performs a forward computation for each sample by successively executing the five layers of the CANFIS architecture: fuzzification of the crisp inputs, computation of rule firing strengths, normalization of these firing strengths, evaluation of the local Takagi–Sugeno consequents, and aggregation of all rule contributions to obtain the model outputs. The predicted outputs are then compared with the corresponding experimental values, and an error measure (typically based on the squared difference) is computed and accumulated over the training set. This error information is used in the parameter update step, where the consequent parameters are adjusted using a least-squares or gradient-based scheme, and the premise parameters may be refined through a backpropagation-type adaptation. The training loop continues until a stopping criterion such as a target mean-squared error, negligible improvement between iterations, or a maximum number of epochs is satisfied. At the end of this process, the optimized CANFIS model, including updated membership functions and rule consequents, is stored and subsequently used to predict and evaluate the output responses for both training and testing datasets.
The learning dynamics and internal rule-based behavior of the CANFIS model are evaluated through two complementary graphical representations. As shown in Figure 24, the evolution of the RMSE values over the training iterations demonstrates the convergence characteristics of the model. In parallel, the distribution of normalized firing strengths for all fuzzy rules across the training dataset is illustrated in Figure 25, providing a clear interpretation of how different rules are activated under varying input conditions and how their relative contributions shape the overall model response.
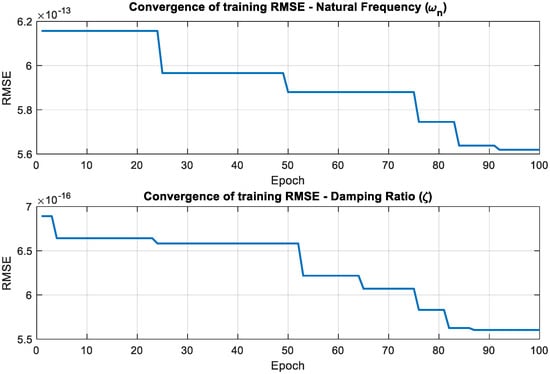
Figure 24.
RMSE-based convergence of the CANFIS model during training.
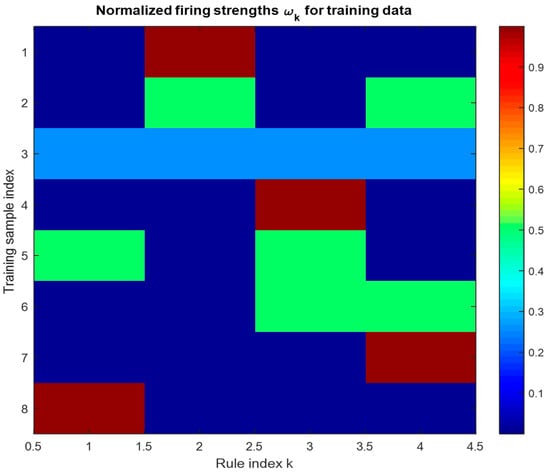
Figure 25.
Distribution of normalized firing strengths () for the CANFIS rule base over the training dataset.
The RMSE-based convergence curves presented in Figure 24 clearly demonstrate that the CANFIS model exhibits a stable learning behavior for both the natural frequency () and damping ratio (ζ) predictions. For both output parameters, the RMSE values decrease progressively with increasing training epochs and eventually reach a steady plateau, indicating that the process successfully converges and that further iterations do not lead to significant improvements in prediction accuracy. This behavior confirms the numerical stability and effective learning capability of the proposed CANFIS structure. Complementary to this, Figure 25 illustrates the distribution of normalized firing strengths of the CANFIS rule base over the training dataset. The colourmap reveals that different fuzzy rules are activated with varying dominance for different training samples, highlighting the adaptive and region-specific reasoning mechanism of the model. The presence of strongly activated rules in distinct regions of the input space confirms that the CANFIS model effectively captures the nonlinear input–output relationships through localized rule contributions.
The predictive capability of the proposed CANFIS model was evaluated using both training and testing datasets through a series of graphical analyses. As presented in Figure 26, the agreement between the experimental (target) values and the CANFIS predictions for natural frequency and damping ratio is illustrated for both datasets. The corresponding prediction errors in the test set are further analyzed through the residual distributions shown in Figure 27. Finally, the correlation between the actual and predicted values is assessed using the scatter plots given in Figure 27, providing a comprehensive evaluation of the model accuracy and generalization performance.
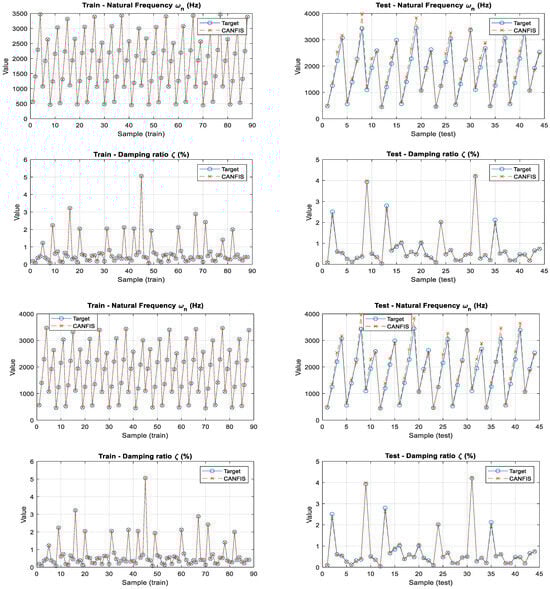
Figure 26.
Comparison of target (experimental) values and CANFIS predictions for training and testing datasets.
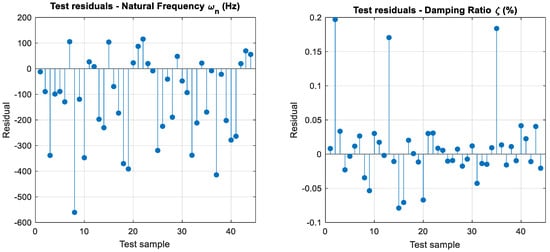
Figure 27.
Residuals of the CANFIS predictions for natural frequency () and damping ratio (ζ) in the test dataset.
Figure 26, Figure 27 and Figure 28 collectively demonstrate that the proposed CANFIS model provides accurate and physically consistent predictions for both natural frequency and damping ratio across the training and testing datasets within the experimentally investigated parameter space. As observed in Figure 26, the CANFIS predictions closely follow the experimental target values for both output parameters, indicating that the model effectively captures the underlying dynamic behavior of the system. The test residuals presented in Figure 26 are generally small and symmetrically distributed around zero, confirming the absence of systematic bias and showing that the prediction errors remain within acceptable limits for both natural frequency and damping ratio. Furthermore, the actual–predicted scatter plots shown in Figure 28 exhibit a strong alignment along the 1:1 reference line for both training and testing cases, demonstrating a high level of consistency between predicted and measured values. Accordingly, the performance of the CANFIS model is evaluated in terms of convergence behavior, consistency with experimental trends, and physical plausibility of the predicted modal parameters, rather than statistical generalization to operating conditions beyond the tested parameter range. Overall, these results verify that the proposed CANFIS framework provides reliable and stable multi-output predictions for modal parameters under varying operational conditions.
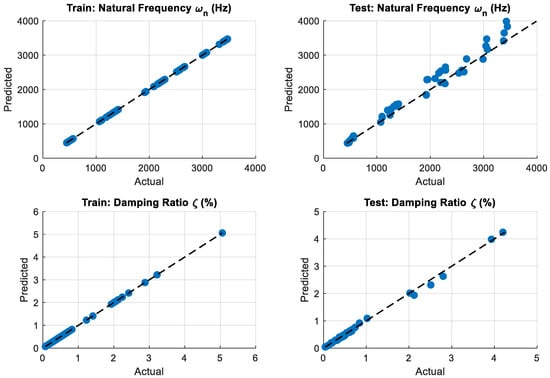
Figure 28.
Actual and predicted values for the CANFIS model in training and testing datasets.
5. Conclusions
This study comprehensively investigated the dynamic behavior of AA7075 plates joined by FSW. It was emphasized that key FSW parameters, such as rotational and traverse speeds, directly influence heat generation, material flow, and the resulting microstructure in the weld zone. The primary objective of the research was to determine the impact of these varying parameters on the dynamic properties of the resulting welded joints. Using a non-destructive technique such as EMA, the unique dynamic characteristics of the welded structures were experimentally identified. This approach enabled a precise evaluation of the permanent changes induced in the plates by the FSW process (e.g., in the weld and heat-affected zones) and their subsequent effects on dynamic performance. The study established a direct relationship between FSW process parameters and dynamic behavior, revealing significant variations in natural frequencies, anti-resonance frequencies, vibration damping ratios, and vibration mode shapes of the structures. Specifically, by systematically adjusting the welding parameters, a high degree of correlation was achieved between numerical dynamic analysis results and experimental EMA findings.
Some key findings can be concluded as follows.
- A primary finding was the consistent decrease in natural frequencies with increasing traverse speed across almost all modes. This indicates a proportional reduction in overall joint stiffness attributed to decreased heat input and subsequent material deficiencies.
- The analysis of frequency reduction rates revealed non-uniform behavior, characterized by slow and abrupt transitions. This demonstrates that increasing the traverse speed beyond a critical threshold causes the process to shift abruptly from a microstructurally sound regime to a defect-ridden regime. This shift is marked by the formation of severe volumetric defects (e.g., tunnels and voids), which result in a sharp and significant loss of structural stiffness and, consequently, a steep drop in natural frequencies.
- Significant damping fluctuations were concentrated in the low-order modes (1–3). This is because these global modes are the most sensitive to localized stiffness variations and high strain energy concentrations in the defect-prone weld region. Changes in welding parameters strongly influence the energy dissipation mechanisms (such as micro-slip and friction at internal discontinuities), causing major damping variations. In contrast, higher-order modes exhibited more stable damping behavior due to their greater number of nodal points, offering increased tolerance to defect locations.
- The MAC comparison further validated the effect of localized defects, showing the lowest mode shape similarity in the third (torsional) mode. This confirms that stiffness irregularities within the weld seam have the most pronounced impact on the structure’s torsional vibrational response.
- Beyond the experimental characterization, a Co-Active Neuro-Fuzzy Inference System (CANFIS) model was successfully implemented to predict the coupled dynamic responses in terms of natural frequency and damping ratio. By employing spindle speed and feed rate as input parameters, the CANFIS model achieved highly accurate multi-output predictions for multiple vibration modes. The RMSE-based convergence characteristics confirmed stable learning behavior, while residual analyses and actual–predicted correlation plots demonstrated excellent agreement between experimental and predicted results for both training and testing datasets. Although the available dataset is limited in size, the present results demonstrate that the CANFIS framework can effectively model coupled natural frequency and damping ratio responses under small-sample conditions when a compact architecture with a limited number of membership functions is employed. These findings verify that CANFIS offers a powerful and reliable tool for intelligent prediction of coupled dynamic properties in friction stir-welded structures.
- It should be emphasized that the CANFIS model is not introduced as a replacement for physics-based or deterministic models governing structural dynamics. Instead, it is employed as a surrogate and complementary framework that operates on experimentally identified modal parameters. This perspective ensures that CANFIS supports, rather than contradicts, the underlying physical principles of structural dynamics, while enabling the implicit effects of weld-induced heterogeneity, localized defects, and residual stresses features that are difficult to model explicitly to be captured without additional physical assumptions.
- Although the global dynamic behavior of plates can be described using classical physical parameters, the presence of friction stir-welded joints introduces strong local heterogeneity, defect-induced stiffness degradation, and complex damping mechanisms concentrated in the weld and heat-affected zones. Such localized and coupled effects cannot be adequately represented using simplified physics-based formulations or conventional regression models relying on global or averaged parameters. Therefore, the CANFIS framework is employed to capture these implicit and coupled relationships directly from experimentally identified modal data, without requiring explicit modeling of the weld zone microstructure.
- Overall, the integrated EMA–CANFIS framework presented in this study provides both physical insight and predictive capability for the dynamic behavior of FSW AA7075 plates. The established relationships between process parameters and modal responses offer critical guidance for optimizing welding conditions, avoiding resonance, and ensuring vibration-safe operational regimes. Although the available dataset is limited in size, the present results demonstrate that the CANFIS framework can effectively model coupled natural frequency and damping ratio responses under small-sample conditions, providing a practical and physically interpretable alternative to data-intensive machine learning approaches. The proposed methodology is directly applicable to advanced structural design, process optimization, and intelligent monitoring of friction stir-welded components in aerospace and automotive applications.
- Consequently, this study demonstrates that dynamic analysis serves as a robust macroscopic Non-Destructive Testing (NDT) tool, capturing the integrated effect of volumetric defects along the entire weld length which might be missed by localized cross-sectional metallography. The experimental reduction in natural frequencies provided direct physical validation of global stiffness degradation in accordance with fundamental vibration theory , independent of microstructural imaging. Accordingly, the proposed CANFIS model successfully mapped the process parameters to these global mechanical responses, proving its efficacy in predicting structural integrity.
The established direct relationship between the FSW process parameters and the dynamic performance of AA7075 plates provides critical quantitative insight into the stiffness and damping characteristics of the welded structures. When coupled with the CANFIS-based multi-output prediction framework developed in this study, this relationship not only enables accurate estimation of natural frequencies and damping ratios under varying welding conditions but also offers a powerful predictive and decision-support capability. This combined experimental–artificial intelligence approach is essential for optimizing welding procedures and allows engineers to strategically define safe operational envelopes by avoiding resonance conditions and mitigating the risks of undesirable vibration, noise, and stress accumulation in critical FSW-jointed structural systems. Consequently, the proposed EMA–CANFIS-integrated framework represents a robust and practical tool for vibration-aware design, process optimization, and reliability-oriented engineering of advanced welded components.
Author Contributions
Conceptualization, methodology, formal analysis, writing—review and editing, and supervision, M.Ş.; data curation, writing—original draft, and review and editing, M.H.; analysis, data collection, writing—original draft, and review and editing, M.E.Ö.; data curation, formal analysis, interpretation, and writing—original draft, O.Y.; data curation, writing—review and editing, S.K.; investigation, data curation, and writing—review and editing, S.E.K.; investigation, data curation, and writing—review and editing, Y.O.Y.; investigation, data curation, and writing—review and editing, M.A.G. All authors have read and agreed to the published version of the manuscript.
Funding
This study is funded by Firat University Scientific Research Projects Management Unit (FUBAP) (MF.25.149) and Scientific and Technological Research Institution of Turkiye (TUBITAK) (123M333).
Data Availability Statement
All data generated or analyzed during this study are included in this published article.
Acknowledgments
This study was carried out with the resources provided within the scope of the TÜBİTAK 123M333 Project. The authors thank TÜBİTAK and FUBAP for their support.
Conflicts of Interest
The author declares that he has no known competing financial interests or personal relationships that could have appeared to influence the work reported in this paper.
Correction Statement
This article has been republished with a minor correction to remove a duplicated Figure 26. This change does not affect the scientific content of the article.
References
- Mishra, R.S.; Ma, Z.Y. Friction Stir Welding and Processing. Mater. Sci. Eng. R Rep. 2005, 50, 1–78. [Google Scholar] [CrossRef]
- Singh, R.P.; Dubey, S.; Singh, A.; Kumar, S. A Review Paper on Friction Stir Welding Process. Mater. Today Proc. 2020, 38, 6–11. [Google Scholar] [CrossRef]
- Küçükömeroğlu, T.; Şentürk, E.; Kara, L.; İpekoğlu, G.; Çam, G. Microstructural and Mechanical Properties of Friction Stir Welded Nickel-Aluminum Bronze (NAB) Alloy. J. Mater. Eng. Perform. 2016, 25, 320–326. [Google Scholar] [CrossRef]
- Çam, G.; Javaheri, V.; Heidarzadeh, A. Advances in FSW and FSSW of Dissimilar Al-Alloy Plates. J. Adhes. Sci. Technol. 2023, 37, 162–194. [Google Scholar] [CrossRef]
- İpekoğlu, G.; Çam, G. Effects of Initial Temper Condition and Postweld Heat Treatment on the Properties of Dissimilar Friction-Stir-Welded Joints between AA7075 and AA6061 Aluminum Alloys. Metall. Mater. Trans. A 2014, 45, 3074–3087. [Google Scholar] [CrossRef]
- Ahmed, M.M.Z.; El-Sayed Seleman, M.M.; Fydrych, D.; Çam, G. Review on Friction Stir Welding of Dissimilar Magnesium and Aluminum Alloys: Scientometric Analysis and Strategies for Achieving High-Quality Joints. J. Magnes. Alloys 2023, 11, 4082–4127. [Google Scholar] [CrossRef]
- Sami Yilbas, B.; Sahin, A.Z. Friction Welding: Thermal and Metallurgical Characteristics; SpringerBriefs in Applied Sciences and Technology; Springer: Berlin/Heidelberg, Germany, 2014. [Google Scholar]
- Chen, J.; Shi, L.; Wu, C.; Jiang, Y. The Effect of Tool Pin Size and Taper Angle on the Thermal Process and Plastic Material Flow in Friction Stir Welding. Int. J. Adv. Manuf. Technol. 2021, 116, 2847–2860. [Google Scholar] [CrossRef]
- Zhao, Y.H.; Lin, S.B.; Qu, F.X.; Wu, L. Influence of Pin Geometry on Material Flow in Friction Stir Welding Process. Mater. Sci. Technol. 2006, 22, 45–50. [Google Scholar] [CrossRef]
- Sabry, I.; El-Zathry, N.E.; Mahamood, R.M.; Akinlabi, S.; Woo, W.L.; El Wakil, M. Performance optimization of friction stir welded flanges: Insights from a hybrid Grey-Taguchi method. Weld. World 2025. [Google Scholar] [CrossRef]
- Sabry, I. Hybrid GRA-TOPSIS optimization of friction stir welding for SiCp-reinforced AZ31C magnesium alloy. Int. J. Adv. Manuf. Technol. 2025, 139, 4457–4478. [Google Scholar] [CrossRef]
- Haagensen, P.J.; Midling, O.T.; Ranes, M. Fatigue Performance of Friction Stir Butt Welds in a 6000 Series Aluminum Alloy. WIT Trans. Eng. Sci. 1995, 8, 225–237. [Google Scholar]
- Dickerson, T.L.; Przydatek, J. Fatigue of Friction Stir Welds in Aluminium Alloys That Contain Root Flaws. Int. J. Fatigue 2003, 25, 1399–1409. [Google Scholar] [CrossRef]
- Chen, A.; Zang, W.F.; Dong, D.K.; Gong, Y.Z. Fatigue Behavior of Friction Stir Welded Lap Joints for Dissimilar AA7150-AA2524 Aluminum Alloy. IOP Conf. Ser. Mater. Sci. Eng. 2020, 751, 012086. [Google Scholar] [CrossRef]
- Kosturek, R.; Torzewski, J.; Joska, Z.; Wachowski, M.; Śnieżek, L. The Influence of Tool Rotation Speed on the Low-Cycle Fatigue Behavior of AA2519-T62 Friction Stir Welded Butt Joints. Eng. Fail. Anal. 2022, 142, 106756. [Google Scholar] [CrossRef]
- Czechowski, M. Low-Cycle Fatigue of Friction Stir Welded Al-Mg Alloys. J. Mater. Process. Technol. 2005, 164–165, 1001–1006. [Google Scholar] [CrossRef]
- Edwards, P.; Ramulu, M. Fatigue Performance of Friction Stir Welded Ti-6Al-4V Subjected to Various Post Weld Heat Treatment Temperatures. Int. J. Fatigue 2015, 75, 19–27. [Google Scholar] [CrossRef]
- Abdelmoula, F.; Refassi, K.; Bouamama, M.; Elmeiche, A. Modal Analysis of FSW Plate Considering the Residual Stresses Effect. Ann. Chim. Sci. Mater. 2021, 45, 75–82. [Google Scholar] [CrossRef]
- Zahari, S.N.; Sani, M.S.M.; Ishak, M. Finite Element Modelling and Updating of Friction Stir Welding (FSW) Joint for Vibration Analysis. MATEC Web Conf. 2016, 90, 01021. [Google Scholar] [CrossRef]
- Zahari, S.N.; Sani, M.S.M.; Husain, N.A.; Ishak, M.; Zaman, I. Dynamic Analysis of Friction Stir Welding Joints in Dissimilar Material Plate Structure. J. Teknol. 2016, 78, 57–65. [Google Scholar] [CrossRef]
- Nazri, N.A.; Sani, M.S.M.; Mansor, M.N.; Zahari, S.N. Model Updating of Friction Stir Welding for Aluminium and Magnesium Plate Structure. MATEC Web Conf. 2018, 150, 04004. [Google Scholar] [CrossRef]
- Zaparoli Cunha, B.; Droz, C.; Zine, A.M.; Foulard, S.; Ichchou, M. A Review of Machine Learning Methods Applied to Structural Dynamics and Vibroacoustic. Mech. Syst. Signal Process. 2023, 200, 110535. [Google Scholar] [CrossRef]
- Dewan, M.W.; Huggett, D.J.; Warren Liao, T.; Wahab, M.A.; Okeil, A.M. Prediction of Tensile Strength of Friction Stir Weld Joints with Adaptive Neuro-Fuzzy Inference System (ANFIS) and Neural Network. Mater. Des. 2016, 92, 288–299. [Google Scholar] [CrossRef]
- Shehabeldeen, T.A.; Elaziz, M.A.; Elsheikh, A.H.; Zhou, J. Modeling of Friction Stir Welding Process Using Adaptive Neuro-Fuzzy Inference System Integrated with Harris Hawks Optimizer. J. Mater. Res. Technol. 2019, 8, 5882–5892. [Google Scholar] [CrossRef]
- Das, O. Prediction of the Natural Frequencies of Various Beams Using Regression Machine Learning Models. Sigma J. Eng. Nat. Sci. 2023, 41, 302–321. [Google Scholar] [CrossRef]
- Ashok, S.K.; Ponni Alias Sathya, S. A Fuzzy Model to Predict the Mechanical Characteristics of Friction Stir Welded Joints of Aluminum Alloy AA2014-T6. Aeronaut. J. 2023, 127, 818–830. [Google Scholar] [CrossRef]
- Djouider, F.; Elaziz, M.A.; Alhawsawi, A.; Banoqitah, E.; Moustafa, E.B.; Elsheikh, A.H. Experimental Investigation and Machine Learning Modeling Using LSTM and Special Relativity Search of Friction Stir Processed AA2024/Al2O3 Nanocomposites. J. Mater. Res. Technol. 2023, 27, 7442–7456. [Google Scholar] [CrossRef]
- Rao, T.V.; Vara Prasad, A.S.; Sri, M.N.S.; Anusha, P.; Gupta, D.; Vijayakumar, S.; Pydi, H.P.; Cheepurupalli, N. Multi-Response Optimization of FSW Parameters for Al-Mg-Zn Alloys Using Box-Behnken Design and Gray Relational Analysis and Comparative Study with ANFIS Technique. AIP Adv. 2025, 15, 025209. [Google Scholar] [CrossRef]
- Van Niekerk, T.I.; Hua, T.; Hattingh, D.G. A Neuro-Fuzzy Scheme for Process Control during Complex Curvature Friction Stir Welding. IFAC Proc. Vol. 2006, 39, 113–118. [Google Scholar] [CrossRef]
- Zapata, J.; Vilar, R.; Ruiz, R. An Adaptive-Network-Based Fuzzy Inference System for Classification of Welding Defects. NDT E Int. 2010, 43, 191–199. [Google Scholar] [CrossRef]
- Muradova, A.D.; Tairidis, G.K.; Stavroulakis, G.E. Adaptive Neuro-Fuzzy Vibration Control of a Smart Plate. Numer. Algebra Control Optim. 2017, 7, 251–271. [Google Scholar] [CrossRef]
- Zong, G.; Kang, C.; Chen, S. Active Vibration Avoidance Method for Variable Speed Welding in Robotic Friction Stir Welding Based on Constant Heat Input. Materials 2024, 17, 2593. [Google Scholar] [CrossRef]
- Krishnamurthy, B.; Rakkiyannan, J. Enhancing Tool Condition Monitoring in Friction Stir Welding with Probabilistic Neural Network Algorithm. Front. Mech. Eng. 2025, 11, 1613216. [Google Scholar] [CrossRef]
- Ambekar, M.; Kittur, J. Multiresponse Optimization of Friction Stir Welding Process Parameters by an Integrated WPCA-ANN-PSO Approach. Mater. Today Proc. 2020, 27, 363–368. [Google Scholar] [CrossRef]
- Treszkai, M.F.; Vehovszky, B.; Feszty, D. Damping Determination by the Half Power Bandwidth Method for a Rectangular Flat Plate with Bitumen Damping Layer Application. J. Vibroeng. 2021, 23, 1267–1277. [Google Scholar] [CrossRef]


Disclaimer/Publisher’s Note: The statements, opinions and data contained in all publications are solely those of the individual author(s) and contributor(s) and not of MDPI and/or the editor(s). MDPI and/or the editor(s) disclaim responsibility for any injury to people or property resulting from any ideas, methods, instructions or products referred to in the content. |
© 2026 by the authors. Licensee MDPI, Basel, Switzerland. This article is an open access article distributed under the terms and conditions of the Creative Commons Attribution (CC BY) license.