Abstract
Foreign Objects (FO) within an aircraft fuel tank present a serious risk of damage and possible catastrophic loss of the aircraft. As such, aircraft manufacturers place great emphasis on the thorough inspection of fuel tanks before they are closed and sealed. If a FO was left undetected in the tank then it could migrate throughout the fuel system due to phenomenon such as aircraft maneuvers and fuel sloshing and could potentially clog filters and pumps, block fuel tubes, or create structural damage which could harm the integrity of the aircraft. While industry carefully develops the physical inspection techniques for the fuel tank and implements preventive actions to mitigate the entry of FO into the tank during manufacture, there is no documented analysis about how the FO could move throughout the fuel system. In fact, current computational fluid dynamic (CFD) analysis of fuel systems is built on the assumption of FO-free fluid, and finite element methods (FEM) treat the fuel system as a solid body. This paper will propose a representative aircraft fuel tank design and create a methodology for evaluation of FO migration within that fuel tank. The methodology will include physical experimentation of a fuel tank prototype and documentation of FO migration characteristics for distinct types of FO and present the FO migration results expressed in terms of risk. Additionally, a simulation approach will be created to analyze not only fluid flow, but also the movement of a FO within that fluid flow. These results will enable a new understanding of how FO impacts an aircraft fuel system which can be useful for future FO-resilient fuel tank design and safer aircraft operation.
1. Introduction
Aircraft fuel tank design is critically complex and must ensure that fuel is stored in sufficient quantity and also provided as required to the engine(s) for propulsion. This can be challenging given the characteristics of flight which include pitch, yaw, and roll [1] as fuel will move or slosh around within the fuel tank. By design, aircraft fuel tanks consist of numerous interconnected bays and are typically located within aircraft wings and center bodies [2]. As such, aircraft are designed with fuel systems which can move the fuel around the aircraft to maintain center of gravity (CG) and flight stability [3]. This is accomplished with pumps, valves, and tube networks which move the fuel from bay to bay within the fuel tank. The bays are created as a biproduct of structural member design (bulkheads, longerons, spars, and ribs) which when assembled create a network of confined spaces in which fuel will ultimately reside. These parts are often made from forgings and plates which are subsequently milled [4]. To allow for free flow of fuel and insertion of fuel tubes the structural members will have a series of holes and openings designed into them and serve as a form of baffle. Baffles are partitions which control the rapid movement of fuel and are beneficial in controlling the sloshing of fuel [5]. Fuel systems also utilize filters and sensors to control the movement of the fuel from bay to bay [6]. The filters help screen out contaminants which could contribute to a loss of propulsive power, and fuel quantity indication systems measure the fuel in the tanks and subsequently inform the correct amount of fuel to move from bay to bay.
The presence of FOs within aircraft fuel tanks represents a significant safety hazard, as evidenced by multiple high-profile incidents and investigative findings. A particularly tragic case involved Air France Concorde Flight 4590, where a fragment of metal debris on the runway punctured a fuel tank, triggering a fatal fire shortly after takeoff [7]. In the realm of general aviation, maintenance-related contamination has also proven deadly. For example, a remnant of a shop towel left inside a Mooney M20C’s fuel tank obstructed the fuel selector valve, resulting in engine failure and the loss of both occupants [8]. Similarly, aircraft repainted prior to flight have experienced fuel starvation when loosened paint particles migrated into and blocked fuel filters [9]. These events collectively underscore that even minor, seemingly innocuous FOs can severely impair fuel system integrity, performance, and flight safety.
Beyond the findings of accident investigations, both manufacturers and regulatory bodies have implemented substantial measures to reduce the risk of FO contamination. Boeing, for instance, identified tools and debris within the fuel tanks of undelivered 737 MAX and KC-46 aircraft during internal quality control inspections. These discoveries prompted broad corrective actions and design modifications aimed at minimizing FO ingress during manufacturing processes [10]. On the regulatory front, the Federal Aviation Administration (FAA) has issued airworthiness directives mandating the use of impact-resistant fuel tank covers and emphasizing strict FO prevention protocols during both maintenance and assembly operations [11]. Collectively, these initiatives reflect a growing industry-wide recognition of FO hazards and underscore the need for enhanced design practices and inspection regimes to mitigate their occurrence.
While recent initiatives have yielded notable safety gains, the problem of FO migration within fuel systems remains only partially addressed, especially within the intricate confines of internal fuel tank environments. The diverse range of FO materials, shapes, and densities (including metal shavings, cured sealants, plastic debris, and fibrous contaminants) complicates efforts to predict their behavior. Such variability makes it challenging to determine how FOs will traverse or settle within the system under dynamic operating conditions. This inherent complexity underscores the necessity for analytical and probabilistic modeling tools capable of simulating FO migration patterns.
Studies have shown that fuel sloshing can introduce hydrodynamic loads onto the aircraft which can affect flight performance and baffle design can serve as a form of dampening. FEM can be used to make numerical assessments of lateral sloshing forces developed within liquid filled tanks with various internal baffles and components [12]. Baffle designs have been tested experimentally, including solid, slotted, and scaled configurations, and it has been observed that fuel fill level was not found to be significant to their performance [13]. Another study of a porous baffle was shown to reduce the sloshing-induced loads and overall motion within the tank [14]. Baffles have been studied in other applications including laterally excited cylindrical tanks including various baffles configurations including floating circular baffles, wall-mounted ring baffles, and floating ring baffles [15]. In yet another study, a non-bottom mounted baffle design, in which the baffle is suspended at controllable depths off the bottom of the tank, was shown to significantly reduce the maximum surface displacement of the liquid in the tank [16]. Non-traditional tank designs have also been studied whereby a flexible container is proposed as a controllable sloshing absorber which was shown to be advantageous over rigid containers [17].
Fuel sloshing is not normally taken into account in aircraft design as it is common for fuel to be estimated as a solid mass [13]. In addition, typical CFD analysis of fuel systems is built on the assumption of FO-free fluid. These practices indicate that the simulation of sloshing with FO inclusions is immature in aircraft design; however representative examples can be seen in other particle flow, sifting, and grinding studies which utilize Ansys Fluent coupled with ROCKY 2025 R2 DEM software to perform computational fluid dynamics-discrete element methods (CFD-DEM) to simulate systems with fluid flow and moving solid particles. In one study, models, including fluid inside a boundary wall with large objects and small particles, was evaluated in stationary and free moving tubes to predict fluid structure interaction in a particle-fluid flow [18]. The combination of CFD and DEM techniques is called coupling, and there are two ways to couple [19]. The first is called one-way coupling in which the fluid flow is used to affect particle movement. The second is called two-way coupling in which the particle flow also influences the system behavior. In another study of semi-autogenous wet grinding, CFD-DEM coupling was used to analyze the interaction of particles and grinding media, which was subsequently compared to real world physical testing [20]. In yet another study, the accuracy of particle movements was analyzed by using cameras to capture and define real world particle coordinates which then underwent artificial-intelligence-driven regression and ultimately enabled a digital twin with the CFD-DEM simulation [21]. In this study the standard deviation between actual and predicted coordinates was found to be as small as 1.8 mm. These studies show the application of CFD-DEM that could be valuable for analyzing FO impacts on an aircraft fuel system.
Beyond simulation techniques, physical testing techniques must also be considered. It would be cost prohibitive to perform actual flight testing; however techniques with robotics show potential for quick learning. For example, in one study a robotic arm was used to study the hydrodynamic forces, pressure, and flow visualizations for the crawl stroke of a swimmer [22]. In this study the robot moved a hand-shaped mock-up, and a camera and laser were used to study the motion. Another study designed to study how restaurant waiters carry a tray of beverages used a robot with an end-effector which had a tray mounted on it with a partially filled cup of liquid on the tray. A smoothed particle hydrodynamics (SPH) simulation was used to show the fluid flow within the cup, and the robot was used to mimic the physical waiter motion and induce a physical response in the cup of liquid [23]. Another study utilized a robot to manipulate liquids to enable the study of sloshing dynamics of a liquid-filled vessel as the vessel moved along a three-dimensional trajectory [24]. This study demonstrated that sloshing can be mitigated if the relative motion between the liquid and vessel is compensated with closed loop tilting control which was enabled with a camera and computer analysis. One last study involved a two-meter-long liquid tank and a robot-manipulated oar which was rowed through the tank to simulate rowing of a boat [25]. The oar was manipulated at a predefined velocity and acceleration profile, and liquid vortices were captured with a camera and subsequently measured. These studies show that robotics can be used to perform representative studies of physical fluid flows and interactions.
Given the extreme importance of fuel tank design, the capabilities to analyze fluid and particle flow and the ability to utilize robotics as a testing approach, this paper will propose a representative aircraft fuel tank design and create a methodology for evaluation of FO migration within that fuel tank. The methodology will include the physical experimentation of a fuel tank prototype and documentation of FO migration characteristics for distinct types of FO and present the FO migration results expressed in terms of risk. Additionally, a simulation approach will be created to analyze not only fluid flow, but also the movement of a FO within that fluid flow. These results will test the hypothesis that not all FO migrate the same and enable a new understanding of how FO impacts an aircraft fuel system which can be useful for future FO-resilient fuel tank design and safer aircraft operation.
2. Materials and Methods
A representative aircraft fuel tank design is proposed as shown in Figure 1 to enable the study of FO migration through multiple compartments within an aircraft under motion. The fuel tank is 2 feet in length and approximately 5.5 inches in diameter and is configured with 5 zones separated by bulkheads with structural holes which serve as baffles. The overall layout of the fuel tank is shown in Figure 1. The tube serves as Zone 6. This design resembles a 1/8th scale size and the shape of fuel tanks exhibited in fighter aircraft such as the F-16 which are located on the rear of the aircraft on the sides of the engine and those that are mounted externally to the wings. A cap is shown on the left side and serves as an entry point to place FO and liquid inside the protype during the study. The design includes a floor in Zones 2 through 4 which creates a direct pathway from Zone 1 to Zone 5 underneath the floor. This design was chosen to reduce the need for internal vacuum and pumps to move liquid in the physical prototype during testing. Rather, the proposed design enables the fluid to circulate throughout the zones.
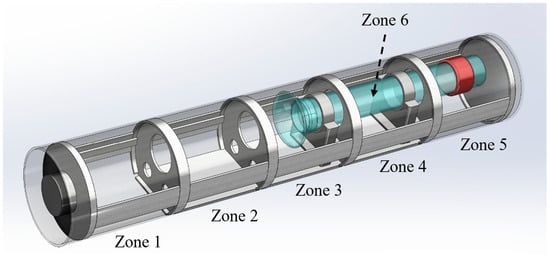
Figure 1.
Representative design of an aircraft fuel tank. The tank is divided into five primary zones by internal baffles and incorporates a fuel transfer tube, designated as Zone 6. This tube features a bell-mouth inlet (shown in blue), tube mounts located in Zones 3 and 4, and a red-colored tube clamp for stabilization.
Given this design configuration, the bulkhead holes and floor create a pathway for FO migration as shown in Figure 2. The pathways enable zone-to-zone movement either above the floor through the little and large holes or below the floor through a narrow channel. FO may also flow into the opening of the tube. It is expected that various types of FO will migrate differently, and this design and prototype will enable the study of migration in various orientations, fill levels, and with the FO placed in different starting zones. While migration of FO is expected, the most concerning migration is when the FO moves into the fuel tube as that would lead to fuel system issues.
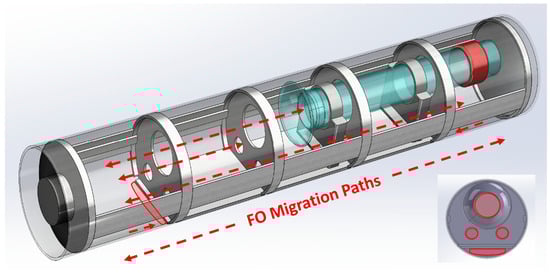
Figure 2.
Foreign object migration paths within the aircraft fuel tank.
As shown in Figure 3, a bolt and cap were selected as representative FOs to capture two typical behavioral extremes: a dense, sinking object (bolt) and a lightweight, buoyant object (cap). This contrast enables evaluation of FO migration influenced by gravity, buoyancy, and directional fuel flow. Both types of FO are smaller than 1.5 inches in length and can easily migrate through the baffle holes and channel. However, real-world aircraft fuel systems are subject to a much broader array of FO types—ranging from smooth, spherical particles that roll freely to irregular or fibrous materials that may fragment or become entrapped [7,10].
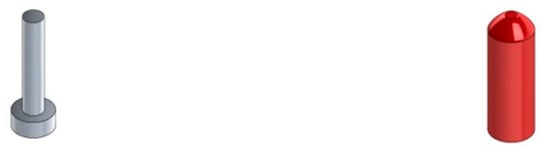
Figure 3.
Representative foreign objects (bolt: sinker and cap: floater).
The stimulation of the fuel tank and the liquid and FO inside is accomplished with a Kuka KR60-3 Robot, KRC4 controller, and an end-effector which grips a metal tube. The prototype was built using stereolithography additive manufactured components and assembled inside of a clear tube so that a camera mounted on the end-effector could capture motion of the liquid and FO. Holes were cut inside the metal tube to allow vision of the prototype mounted inside. As shown in Figure 4, the liquid can be seen moving inside the prototype as the robot moves the tube along a given path. The camera is used to capture images and video of the liquid and FO movement, but closer visual inspection is also utilized as the FO can move into dark or congested areas of the prototype that are not visible by the mounted camera. Testing began with a Rhombus R400 security camera as shown in Figure 4; however due to its large size it was replaced with a smaller drone FPV camera. In limited cases, a special cap with an embedded borescope camera was also used occasionally to view the prototype from the inside. Water was used as the liquid medium in this study and was purposefully colored blue to create a distinct color contrast against the white prototype. Jet fuel was not utilized for safety reasons, and it was assumed for this study that water would flow similarly enough to serve as an acceptable alternative. Furthermore, no study of fuel-induced corrosion or material alteration was performed.
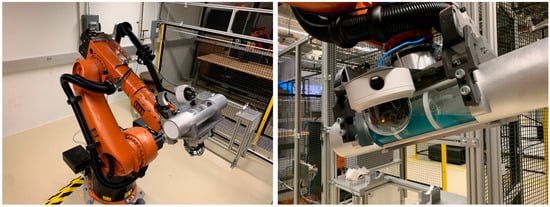
Figure 4.
Robotic test setup and fuel tank prototype.
The robot was programmed to move in a representative flight path pattern to create stimulation for FO migration. The flight pattern in X and Y axis resembles a “Figure 8” flight path but with elevation changes in the Z axis. As shown in Figure 5 and Figure 6, this started with an acceleration of the prototype that mimicked a quick takeoff, climb, numerous turning maneuvers which induced yaw, pitch, and roll of the prototype, numerous elevation changes, occasional jerks representing turbulence, and finally a landing resulting in a full stop. The rotations and positional changes created by the rapid robot movement were found to induce a dynamic velocity and acceleration profile during the flight path which created the required stimulation of liquid and FO inside to migrate within the tank.
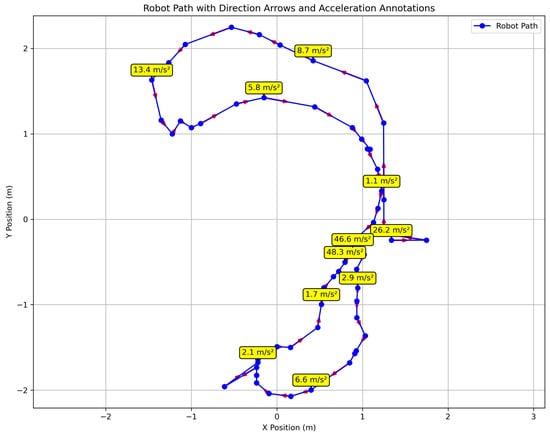
Figure 5.
Flight path pattern in XY axis with variation in acceleration shown.
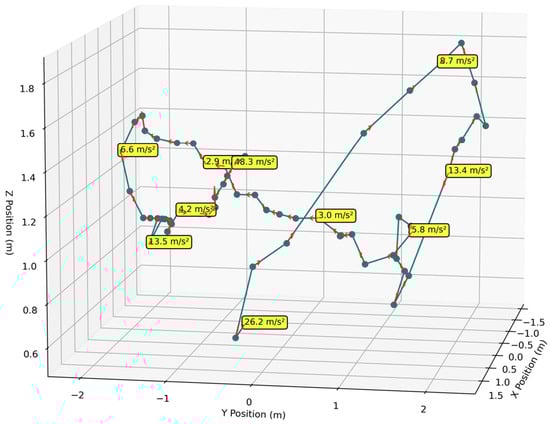
Figure 6.
Flight path pattern in XYZ axis with variation in acceleration shown.
The physical experimentation included 120 runs of this flight path which included 2 repetitions each of the full permutation of the following experimental variables: fill level, FO type, starting zone, and orientation. The fill level of the prototype was either full or half-full. The FO was either a cap or a bolt. The starting zone was either Zone 1, 2, 3, 4, or 5, and the starting orientation of the prototype was either 0, 90, or 180 degrees. Each permutation of these four variable combinations was set up, run through the same flight path, and then inspected afterwards to note where the FO migrated to. Video of the flights was also reviewed to understand characteristics of the fluid flow and FO movement as shown in Figure 7. In this figure the bolt is captured using the robot-mounted camera while the cap is captured using the special cap with a borescope to view the movement from inside.
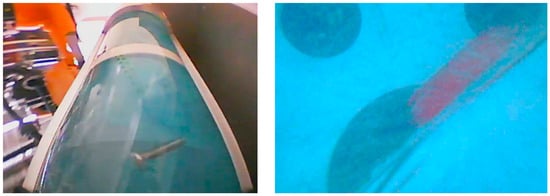
Figure 7.
Camera capture of FO movement during flight path.
The data and results from each test point were recorded so that the specific results from the flight path testing methodology could be shown. These results will be presented in Section 3. Additionally, analysis using the concept of Markov Chains can be used to model the movement of FO over time and will be discussed in more detail in Section 4. The Markov Chain analysis will help provide an explanation for the expected performance in the long term, as opposed to the actual results obtained in this single study.
3. Results
The performance of the 120 test points enabled documentation of migration characteristics as shown in Figure 8. From this figure it is visually apparent that most FO did not migrate as shown by the “1-1”, “2-2”, “3-3”, “4-4”, and “5-5” columns. It is also apparent that some FO migrated over multiple zones as shown for example by “1-4”. There was only one case out of 120 where the FO entered the fuel tube Zone 6. A final observation of this data is that the caps exhibit much more migration than the bolts.
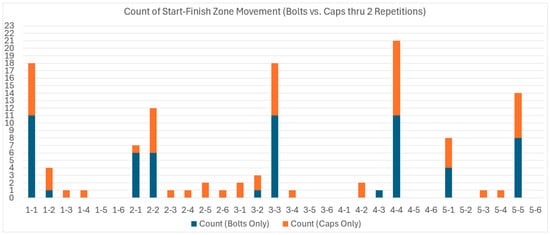
Figure 8.
Start-Finish zone migration for various FO during flight path. Bolt performance is shown in blue, and cap performance is shown in orange. The figure represents FO migration patterns, where values such as “1-2” indicate that the FO started in Zone 1 and finished in Zone 2.
This migration data can also be shown as a histogram that is focused on the magnitude and direction of the migration as shown in Figure 9. The number associated with each column indicated how many zones the FO migrated across. Again, most test runs had 0 migration for the FO. The bolt was found to migrate forwards or backwards by only one zone, while the cap was shown to move up to two zones forward and four zones backwards. The wider variation in the cap data shows that the caps are a larger risk for migration as compared to the bolts. This establishes that not all FO migrate the same.
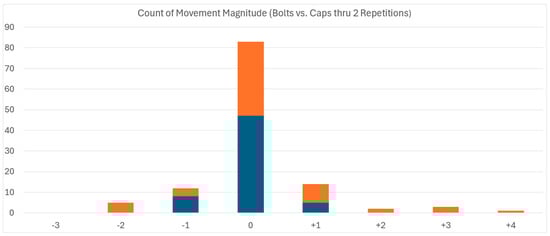
Figure 9.
Magnitude and direction of FO migration during flight path. FO that moved forward is represented by ‘−’ and FO that moved backward by ‘+.’ Forward movement typically results from liquid sloshing or deceleration, while backward movement is generally due to acceleration forces. The numbers indicate how many zones the FO migrated across.
While Figure 8 and Figure 9 can easily indicate differences between bolt and cap migration, little is understood about the effects of the other variables. Minitab 22 regression was used to further study the standardized effects of the data as shown in Figure 10. The regression indicates that the starting zone is the leading variable that contributes to migration and the only variable that is statistically significant with a p-value = 0.031. Since p < 0.05, this factor likely has a meaningful effect on the dependent variable which is the Finish Location. FO Type with p-value = 0.078 is close to being significant but does not meet the standard <0.05 threshold, which is interesting given the visually apparent FO-type performance data shown in Figure 7 and Figure 8. Finally, orientation and Fluid Level are not significant and do not contribute meaningfully to the model.
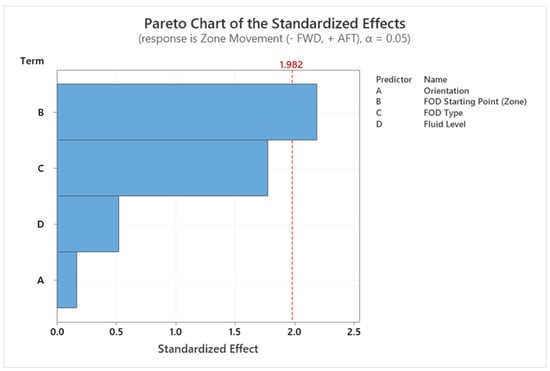
Figure 10.
Regression analysis of FO migration testing.
The regression data was further tested for autocorrelation in the residuals (errors) and found to exhibit positive autocorrelation with D = 0.9958 being < 2 as shown in Figure 11. This means that the errors in the model are not independent, which is technically a violation of a key assumption in linear regression in that residuals should be independent. This scenario highlights a risk that the p-values and conclusions from the regression may be incorrect, and further evaluation of omitted variables, clustering, and time-ordered techniques should be considered. Of course, the 120 test runs only included two repetitions, so there is already a clear need for further data gathering. Finally, risk of incorrect conclusions aside, there appears to be a notable difference between Starting Zones 3 and 4, as compared to Starting Zones 1, 2, and 5. Based on initial review of the prototype design, Zones 3 and 4 do visually appear to be more cluttered than the others, which might be a potentially omitted variable for future study.
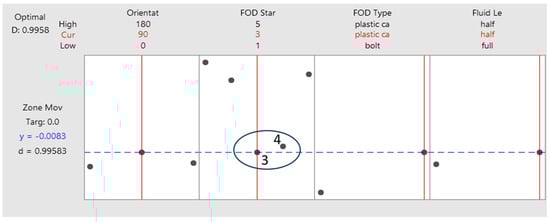
Figure 11.
Testing for autocorrelation.
The time required to perform physical testing is not as prohibitive as real flight testing but does take significant time to set up, execute, and inspect after each test run. While some initial quick learning was accomplished by the 120 test runs, the need for a digital simulation capability that could be used to test further scenarios has become clear. Since there is no established FO simulation capability found in the literature, a new capability was required to be created based on the CFD-DEM examples found in other applications. For this simulation capability, there were several necessary milestones which were required including the creation of a CFD simulation based on the proposed fuel tank design, creation of DEM simulation based on the bolt and cap FO particle types, coupling of the CFD and DEM capabilities, and application of the CFD-DEM solution to a custom user-defined function (UDF) that follows the same translation and rotation of the flight path used during physical testing.
The first milestone was the creation of a CFD simulation based on the proposed fuel tank. As shown in Figure 12, Ansys Fluent 2025 R2 was used to insert the fluid and air inside the proposed fuel tank which enables simulation with different fluid fill levels. The settings in Fluent started with 3D dimensions and a double precision pressure-based transient solver. Mesh was generated to have tetragonal elements with a total of 1,588,080 elements. Gravity was assigned for the y-direction at −9.81 m/s2. Three materials were added to the simulation including air, water in liquid phase, and a third material called particles. The material information for the particles was later input in the ROCKY software interface for DEM.
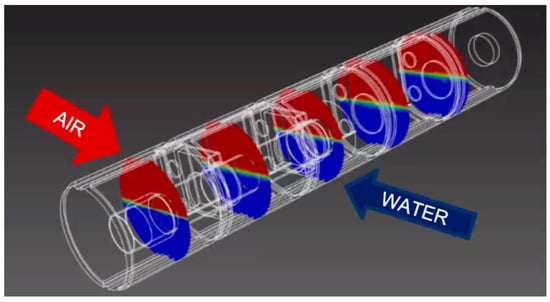
Figure 12.
CFD simulation of fuel tank.
A Multiphase Eulerian Model with three phases (phase 1 being air, phase 2 being water-liquid, and phase 3 being particles) was assigned. Particles, or in this case FO, are input into the simulation through ROCKY, while water and air are simulated in Fluent software. The Schiller–Naumann was used for drag coefficient calculation. Under the Viscous model, the Realizable k-epsilon model was enabled with scalable wall functions. Boundary conditions within Fluent are all detailed to be the fuel tank walls, since no fluid will be flowing or escaping through the capsule. Under Cell Zone Conditions a mesh motion was enabled, and motion was assigned to be 1 rad/s along the z axis.
Standard Initialization was selected for the Solution Initialization with Gage pressure x, y, and z. Velocity for Phases 1, 2, and 3 was zero (0), but turbulent kinetic energy and turbulent dissipation rate were one (1) for all phases. Once the simulation was initialized with the entire capsule volume being air, the bottom half of the volume was patched as water. A fixed time step of 0.0001 s was assigned with 150 maximum iterations per time step. The simulation was run across many time steps, and then the case and data file were extracted to be imported into the ROCKY simulation.
The second milestone required the creation of a DEM model for the FO type as a particle as shown in Figure 13. The DEM model was created using Ansys ROCKY software. Based on completion of these milestones the coupling may now occur. Within the ROCKY Simulation, the Coarse-Graining model was enabled, and gravity was assigned to be −9.81 m/s2 in the y-direction. Modules that were activated included the CFD Coupling Particle Statistics, enabling drag force and pressure gradient force. The geometry was imported into ROCKY by importing the .cas file that was exported from Fluent. Under the particle section in ROCKY, the FO was imported, and the particle material properties were updated. A volumetric inlet was inputted into the area so that the FO would drop near the bottom of the capsule.
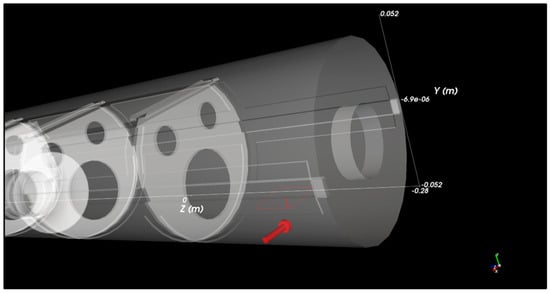
Figure 13.
DEM simulation with a foreign object (Bolt) as a particle.
Within ROCKY the two-way Fluent coupling was enabled which solves the Fluent simulation for the air and water interaction and for the FO particle, which would be solved by the ROCKY simulation. Two-way coupling was selected to show how the FO influences the fluid movement, and the fluid movement influences the FO movement. The Schiller–Naumann drag law was selected, and turbulent dispersion was enabled. Data initialization was used from the .dat file that was extracted from Fluent. The execution mode selected was local parallel. Once the data file was imported, the movement and features from Fluent were also imported. Once the motion was assigned, then the simulation duration was set, and the simulation was executed.
The programmed flight path points and timing for the fuel tank to arrive at each point was captured, along with the corresponding position and rotation data from the Kuka robot. This data enabled the creation of the UDF whereby smoothed polynomial regression was applied to derive the velocity and angular velocity of the fuel tank as shown in Figure 14. A dynamic mesh was utilized which applied the UDF to the fuel tank in 0.0001 s steps over a total span of 375,000 time steps. This UDF is what applied the motion which stimulated the air and liquid phases and the FO particle, to move. As such, the fuel tank can now be subjected digitally to the flight path pattern with the FO placed in various starting zones. As part of future continued research this model must be validated against the actual movement of FO particles inside the fuel tank. Because the focus of this study was on the starting and ending location for FO, so to show the migration, the cameras and viewing required to study all the phases of air, liquid, and FO will need to be designed for a new experiment. This comparison of actual versus simulated performance will naturally drive an optimization study, which is planned for a future research.
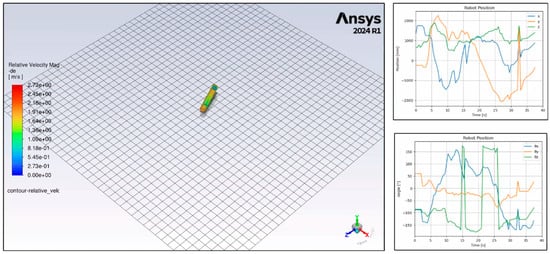
Figure 14.
CFD-DEM coupling and user-defined function integration.
4. Discussion
Based on experimental testing it can now be concluded that FO can migrate during flight; however most of the time they do not migrate beyond the zone of FO origination. While this containment of FO provides some relief to the aircraft industry, there is a risk that the FO will continue to migrate through the fuel systems until catastrophic damage or loss of aircraft occurs. Additionally, a method of evaluation which can inform fuel tank design would be most helpful to create FO resilient fuel tanks. To discuss and communicate this risk the concept of Markov Chains can be used to model the movement of FO over time. Based on the proposed protype, each zone represents a “state,” and the transition probabilities describe the chance of a FO moving between zones at each successive step or flight. Using the Markov Chain concept, the next state depends only on the current one, not the full history of states. This enables an understanding of the probabilistic movement over time without the need for countless physical and digital testing observations.
Based on the data captured in Figure 8 it is possible to construct a transition matrix where T[i][j] is the probability of moving from Zone i to Zone j. There is also an initial probability of which zone the FO may be inserted into the fuel tank. These details enable the Markov Chain model to calculate the probability of being in each zone after each flight or step. This is useful to inform how long it takes for FO to migrate to every zone. In the case of FO, migration is not desired, and therefore inhibition of FO migration is desired by design. This means that fuel tank designs which create low (near-zero) probabilities for migration or spread of FO are desired, or fuel tank designs which take a long time for FO to migrate to each zone. If FO migration is slow, then the aircraft preventive maintenance inspection cycles may enable the identification and removal of the FO before it could spread to a place which causes damage. In addition, the Markov Chain model can inform the maintainers of where to look for it in a risk-based sequence. The Markov Chain model for the fuel tank proposed in this study can be seen in Figure 15 where the risk of FO accumulation is shown by high probabilities, and the risk of FO spread is shown by low probabilities.
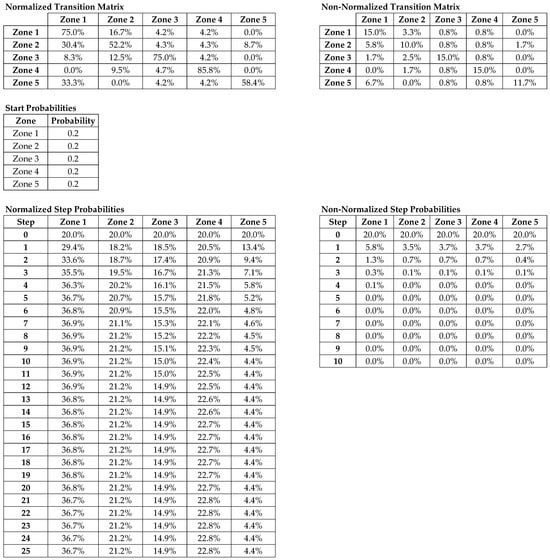
Figure 15.
Markov Chain model for FO migration.
The fuel tank proposed in this study is considered “circular” by design due to the underfloor channel which connects Zone 1 to Zone 5. A circular setup like this, while reducing the needs for pumps and prototype complication during testing, will enable FO migration faster (system is more dynamic since FO can fully travel in two directions without dead ends), while a more linear setup would constrain FO migration (system is more stable because dead ends limit the amount of two way movement). The diagonal values (where i = j) in the transition matrix represent “self-loop probabilities” where the FO stays or sticks in the same zone. If self-loop probabilities are large, or can be grown by design choices, then there is less probability that FO will migrate. Based on Figure 15 it is evident that Zones 1, 3, and 4 have the largest self-loops, and therefore the FO in these zones is most likely to stick or stay in that zone. Zone 2 and Zone 5 have smaller self-loops and therefore are the zones which promote the most FO migration. Knowing this enables design choices to be made which could reduce their outgoing linkages to other zones to inhibit overall system movement.
The Markov Chain has been normalized from the original version due to the rows in the transition matrix not adding up to 100%. This represents a form of leakage in the probability that does not mimic the use case. FO does not escape the fuel tank in real life (unless intentionally removed); however based on limitations in testing and other factors there appears to be some artificial losses or leakage in the transition matrix. To address this the matrix has been normalized to ensure that the rows add up to 100%. This will provide a more correct interpretation of the results.
The step probabilities represent the probability that FO could migrate into a given zone. With each successive flight or step, the probabilities converge with a unique stationary distribution. For the normalized case, after approximately ten to fifteen steps the system stabilizes with Zone 1 at approximately 36.9%, Zone 4 at approximately 22.4%, etc. The convergence in the normalized table indicates a long-run probability that can be useful for fuel tank designers to understand the potential migration of FO in their fuel system. This knowledge of the long-run probabilities and the self-loops can help influence tank design configurations, access panel configurations in a way that enable the inspection and retrieval of FO from the system, zone configurations where FO susceptible components are placed strategically, and even ways to accumulate or trap FO in specific intentional zones. The ability for fuel tank designers to now consider these factors will result in more FO resilient fuel tanks for future aircraft designs.
5. Conclusions
This paper proposed a methodology for the evaluation of FO migration within a representative aircraft fuel tank design which included physical experimentation of a fuel tank prototype, documentation of FO migration characteristics for distinct types of FO, and presentation the FO migration results expressed in terms of probabilistic risk. Additionally, a simulation approach was created to analyze fluid flow and also the movement of a FO within that fluid flow. Based on experimental testing it can now be concluded that FOs can migrate during flight; however most of the time they do not migrate beyond the bay that they originate from. This study shows that variables such as fluid fill and orientation of the fuel tank are not significant independent variables for migration, but rather the starting location and FO type are. This study has also identified bay clutter (congestion) as a potential new variable, and the need for further testing to be conducted digitally due to the time and resource prohibitive nature of physical testing. Finally, the determination of Markov Chain self-loops, circular versus linear design, and long-run step probabilities can be used to enable better understanding of FO migration within a fuel system. The methodologies and conclusions of this study enable more FO-resilient fuel tank design and can be further utilized for the potential future creation of a digital twin and digital-physical validation of accuracy.
Author Contributions
Conceptualization, C.L.C.; methodology, C.L.C.; software, B.P., L.B., A.M.-D., R.C. and D.G.; validation, C.L.C.; formal analysis, C.L.C.; investigation, C.L.C.; resources, B.P., L.B., A.M.-D., R.C. and D.G.; data curation, B.P., L.B., A.M.-D., R.C. and D.G.; writing—original draft preparation, C.L.C.; writing—review and editing, C.L.C., A.M.-D. and B.P.; visualization, B.P., L.B., A.M.-D., R.C. and D.G.; supervision, B.T. and Y.L.; project administration, C.L.C.; funding acquisition, B.T. and Y.L. All authors have read and agreed to the published version of the manuscript.
Funding
Funding for this research was provided by the University of Texas at El Paso (UTEP) High-Level Researcher Fellowship.
Institutional Review Board Statement
Not applicable.
Informed Consent Statement
Not applicable.
Data Availability Statement
No publicly archived datasets were used in this study.
Acknowledgments
The research for this paper was conducted at the Southern Methodist University (SMU) in the Center for Digital and Human-Augmented Manufacturing (CDHAM) and at the University of Texas at El Paso (UTEP). Supervision for this research was provided by Bill Tseng, Chair of the Industrial, Manufacturing, and Systems Engineering Department at UTEP, and by Yirong Lin, Chair Ad Interim of the Aerospace and Mechanical Engineering Department at UTEP. The research team consisted of PhD, Masters, and Undergraduate students from the SMU Mechanical Engineering Department and the UTEP Aerospace & Mechanical Engineering Department. The authors wish to express sincere gratitude to all University and Industrial parties for their exceptional teaming to make this Human Digital Twin research possible.
Conflicts of Interest
The authors declare no conflicts of interest. The funders had no role in the design of this study; in the collection, analyses, or interpretation of data; in the writing of the manuscript; or in the decision to publish the results.
Abbreviations
The following abbreviations are used in this manuscript:
| FO | Foreign Object |
| CFD | Computational Fluid Dynamics |
| FEM | Finite Element Methods |
| CG | Center of Gravity |
| CFD-DEM | Computational Fluid Dynamics-Discrete Element Methods |
| SPH | Smoothed Particle Hydrodynamics |
| UDF | User-Defined Function |
| SMU | Southern Methodist University |
| CDHAM | Center for Digital and Human-Augmented Manufacturing |
| UTEP | University of Texas at El Paso |
References
- Filippone, A. Flight Performance of Fixed and Rotary Wing Aircraft; Butterworth-Heinemann: Oxford, UK, 2006. [Google Scholar]
- Federal Aviation Administration. Aviation Maintenance Technician Handbook—Airframe: Volume 2 (FAA-H-8083-31A). U.S. Department of Transportation. 2012. Available online: https://www.faa.gov/regulations_policies/handbooks_manuals/aircraft (accessed on 5 August 2025).
- Goraj, Z.; Zakrzewski, P. Aircraft fuel systems and their influence on stability margin. Pr. Inst. Lotnictwa 2005, 4, 29–40. [Google Scholar]
- Saha, P.K. Aerospace Manufacturing Processes; CRC Press: Boca Raton, FL, USA, 2016. [Google Scholar]
- Aviation Dictionary. Baffle. In Academic Aviation Dictionary. (n.d.). Available online: https://aviation_dictionary.en-academic.com/824/baffle (accessed on 5 August 2025).
- Behbahani-Pour, M.J.; Radice, G. Fuel contamination on the large transport airplanes. J. Aeronaut. Aerosp. Eng. 2017, 6, 1000200. [Google Scholar]
- Air Force Safety Center. Beyond Concorde: FOD Detection in the 21st Century; Air Force Safety Center: Albuquerque, NM, USA, 2024. [Google Scholar]
- National Transportation Safety Board. Aircraft Accident Report WPR22FA094; National Transportation Safety Board: Washington, DC, USA, 2022. [Google Scholar]
- Aerossurance. Mooney M20C Fuel Starvation FOD Accident. 2020. Available online: https://aerossurance.com (accessed on 5 August 2025).
- Jolly, J.; Rushe, D. Boeing 737 Max: Debris Found in Fuel Tanks of Grounded Planes. The Guardian. 2020. Available online: https://aviationweek.com/air-transport/aircraft-propulsion/boeing-finds-debris-max-fuel-tanks (accessed on 5 August 2025).
- FAA-2013-0685; Notice of Proposed Rulemaking, Docket. Federal Aviation Administration: Washington, DC, USA, 2013.
- Mitra, S.; Khoo, B.C.; Kumar, A.; Sinhamahapatra, K.P. Influence of various internal components on slosh dynamics: A study using finite element method. Int. J. Fluid Mech. Res. 2010, 37, 359–381. [Google Scholar] [CrossRef]
- Constantin, L.; De Courcy, J.J.; Titurus, B.; Rendall, T.C.; Cooper, J.E. Fuel sloshing-induced effects on the dynamic response of a scaled research wing demonstrator. Aerosp. Sci. Technol. 2023, 140, 108450. [Google Scholar] [CrossRef]
- George, A.; Cho, I.H. Anti-sloshing effects of a vertical porous baffle in a rolling rectangular tank. Ocean Eng. 2020, 214, 107871. [Google Scholar] [CrossRef]
- Wang, W.; Peng, Y.; Zhou, Y.; Zhang, Q. Liquid sloshing in partly-filled laterally-excited cylindrical tanks equipped with multi baffles. Appl. Ocean Res. 2016, 59, 543–563. [Google Scholar] [CrossRef]
- Zhang, H.; Xin, Z.; Xu, S.; Zhou, X.; Soares, C.G. Numerical study on the physical mechanisms of non-bottom mounted baffles to suppress liquid tank sloshing. Ocean Eng. 2024, 304, 117859. [Google Scholar] [CrossRef]
- Gradinscak, M.; Semercigil, S.E.; Turan, Ö.F. A sloshing absorber with a flexible container. In Structural Dynamics, Volume 3, Proceedings of the 28th IMAC, A Conference on Structural Dynamics, Orlando, FL, USA, 1–4 February 2010; Springer: New York, NY, USA, 2011; pp. 315–322. [Google Scholar]
- He, Y.; Bayly, A.E.; Hassanpour, A. Coupling CFD-DEM with dynamic meshing: A new approach for fluid-structure interaction in particle-fluid flows. Powder Technol. 2018, 325, 620–631. [Google Scholar] [CrossRef]
- Fonte, C.B.; Oliveira, J.A., Jr.; de Almeida, L.C. DEM-CFD coupling: Mathematical modelling and case studies using ROCKY-DEM® and ANSYS Fluent®. In Proceedings of the 11th International Conference on CFD in the Minerals and Process Industries, CSIRO, Melbourne, Australia, 7–9 December 2015; pp. 7–9. [Google Scholar]
- Lvov, V.; Chitalov, L. Semi-autogenous wet grinding modeling with CFD-DEM. Minerals 2021, 11, 485. [Google Scholar] [CrossRef]
- Černilová, B.; Kuře, J.; Chotěborský, R.; Linda, M. Particle Movement in DEM Models and Artificial Neural Network for Validation by Using Contrast Points. Technologies 2024, 12, 257. [Google Scholar] [CrossRef]
- Takagi, H.; Nakashima, M.; Ozaki, T.; Matsuuchi, K. Unsteady hydrodynamic forces acting on a robotic hand and its flow field. J. Biomech. 2013, 46, 1825–1832. [Google Scholar] [CrossRef]
- Gattringer, H.; Müller, A.; Weitzhofer, S.; Schörgenhumer, M. Point to point time optimal handling of unmounted rigid objects and liquid-filled containers. Mech. Mach. Theory 2023, 184, 105286. [Google Scholar] [CrossRef]
- Moriello, L.; Biagiotti, L.; Melchiorri, C.; Paoli, A. Manipulating liquids with robots: A sloshing-free solution. Control Eng. Pract. 2018, 78, 129–141. [Google Scholar] [CrossRef]
- Grift, E.J.; Vijayaragavan, N.B.; Tummers, M.J.; Westerweel, J. Drag force on an accelerating submerged plate. J. Fluid Mech. 2019, 866, 369–398. [Google Scholar] [CrossRef]


Disclaimer/Publisher’s Note: The statements, opinions and data contained in all publications are solely those of the individual author(s) and contributor(s) and not of MDPI and/or the editor(s). MDPI and/or the editor(s) disclaim responsibility for any injury to people or property resulting from any ideas, methods, instructions or products referred to in the content. |
© 2025 by the authors. Licensee MDPI, Basel, Switzerland. This article is an open access article distributed under the terms and conditions of the Creative Commons Attribution (CC BY) license (https://creativecommons.org/licenses/by/4.0/).