Abstract
This paper proposes and demonstrates a domain-adapted ensemble machine learning approach for enhanced prediction of surface roughness (Ra) during the machining of polymeric materials. The proposed model methodology employs a two-stage pipelined architecture, where classified data are fed into the model for regressive analysis. First, a classifier (Logistic Regression or XGBoost, selected based on performance) categorizes machining data into distinct regimes based on cutting Speed (Vc), feed rate (f), and depth of cut (ap) as inputs. This classification leverages output discretization to mitigate data imbalance and capture regime-specific patterns. Second, a regressor (Support Vector Regressor or XGBoost, selected based on performance) predicts Ra within each regime, utilizing the classifier’s output as an additional feature. This structured hybrid approach enables more robust prediction in small, noisy datasets characteristic of machining studies. To validate the methodology, experiments were conducted on Polyoxymethylene (POM), Polytetrafluoroethylene (PTFE), Polyether ether ketone (PEEK), and PEEK/MWCNT composite, using a L27 Design of Experiments (DoEs) matrix. Model performance was optimized using k-fold cross-validation and hyperparameter tuning via grid search, with R-squared and RMSE as evaluation metrics. The resulting meta-model demonstrated high accuracy (R2 > 90% for XGBoost regressor across all materials), significantly improving Ra prediction compared to single-model approaches. This enhanced predictive capability offers potential for optimizing machining processes and reducing material waste in polymer manufacturing.
1. Introduction
Artificial intelligence (AI) and machine learning (ML) are revolutionizing manufacturing by enabling predictive models that enhance productivity and efficiency [1]. However, the adoption of predictive or preventive models in manufacturing remains limited in several regions, particularly in Asian and African countries, due to economic constraints and the substantial capital investment required for transitioning from conventional processes to digital automation. Despite these challenges, prediction models can play a critical role in facilitating this transformation by enabling production teams to forecast machining outputs in advance, thus optimizing operations and minimizing inefficiencies [2]. Table 1 gives comprehensive insights into past publications and their intended research.

Table 1.
Significant related publications in the last 4 years (2021–2024).
While ML has been widely applied to predict machining outcomes like tool wear and cutting force for metals [3,5,18], its use in polymeric machining, particularly for surface roughness (Ra), remains underexplored. From the literature review, more specifically from the literature on polymeric materials, Kim et al. [35] and Ghaderi et al. [36] worked on elastomeric materials, where the former used Gaussian Process Regression (GPR) and later employed Bayesian-based constitutive modeling. Yan et al. [37] applied dual Convolutional Neural Networks (CNNs) to predict the shape-memory properties of 14 thermosetting polymers, and Jin et al. [38] used an Artificial Neural Network (ANN) to optimize high-performance epoxy resin. Alejandro et al. [39] also used an ANN model to predict compressive stress of polypropylene and polystyrene foams. Shah et al. [40] conducted time series ML for predicting the melt pressure of PLA bead foam.
Existing models often rely on single algorithms Random Forest [5], SVR [20]) or focus on metal-specific datasets, limiting their applicability to polymers with diverse mechanical properties (e.g., Polyoxymethylene, Polytetrafluoroethylene, Polyether ether ketone). Ensemble methods combine multiple models [18,33], but rarely address data imbalance or integrate classification and regression in a pipeline for enhanced Ra prediction.
This study introduces a domain-specific meta-ensemble model that combines a classifier and regressor with output discretization to tackle data imbalance, specifically tailored for polymeric materials. By classifying machining regimes before regression, our approach achieves higher accuracy (R2 > 90%) compared to single-model methods, addressing a critical gap in sustainable polymer manufacturing where precise Ra prediction can reduce material waste and optimize processes [2].
Given a scenario of turning operation, the company may use a user interface program before starting machining that predicts whether the set parameters would result in high surface roughness or high tool wear. The current practice in the company is that the operator checks the quality of the machined part only after the machinery is performed. On the contrary, online quality checking and auto-reassignment of setting parameters are appreciable. The solution to the aforementioned problem is the integration of an appropriate ML model in the production line that encapsulates the smart manufacturing system.
The prediction model is a prevalent strategy that can estimate the tool wear, cutting temperature, cutting force, quality, and dimensional accuracy of the part before the start of the machining. In this way, SDG Goal 12, Responsible Consumption and Production, can be implemented. The authors of this article used standard research databases to gather the articles published in the last 4 years related to the implementation of prediction models in turning and milling operations (see Table 1).
Regressors are designed to predict continuous variables, while classifiers are used for categorical or discrete outputs. Although regression algorithms may appear suitable for discrete variables, classification algorithms are more often used when values represent distinct categories rather than data points. The choice between regression and classification ultimately depends on the semantic meaning of the target variable and the modeling objective.
It can be seen from the articles published over the past years that most of the research has been conducted on the machining of metals, especially steel and aluminum. Prediction models have been developed for drilling, turning, and milling of such materials. The performance of machine learning (ML) models has been improved mostly by optimizing the hyperparameters. While most of the model developers tune hyperparameters iteratively to achieve higher performance, some researchers have recently attempted optimization algorithms to tune the hyperparameters [41,42,43]. To this end, this article introduces a domain-dominated meta-based model development strategy in Section 2, followed by the validation and performance evaluation of the proposed methodology in Section 3.
2. Model Development Methodology in Detail
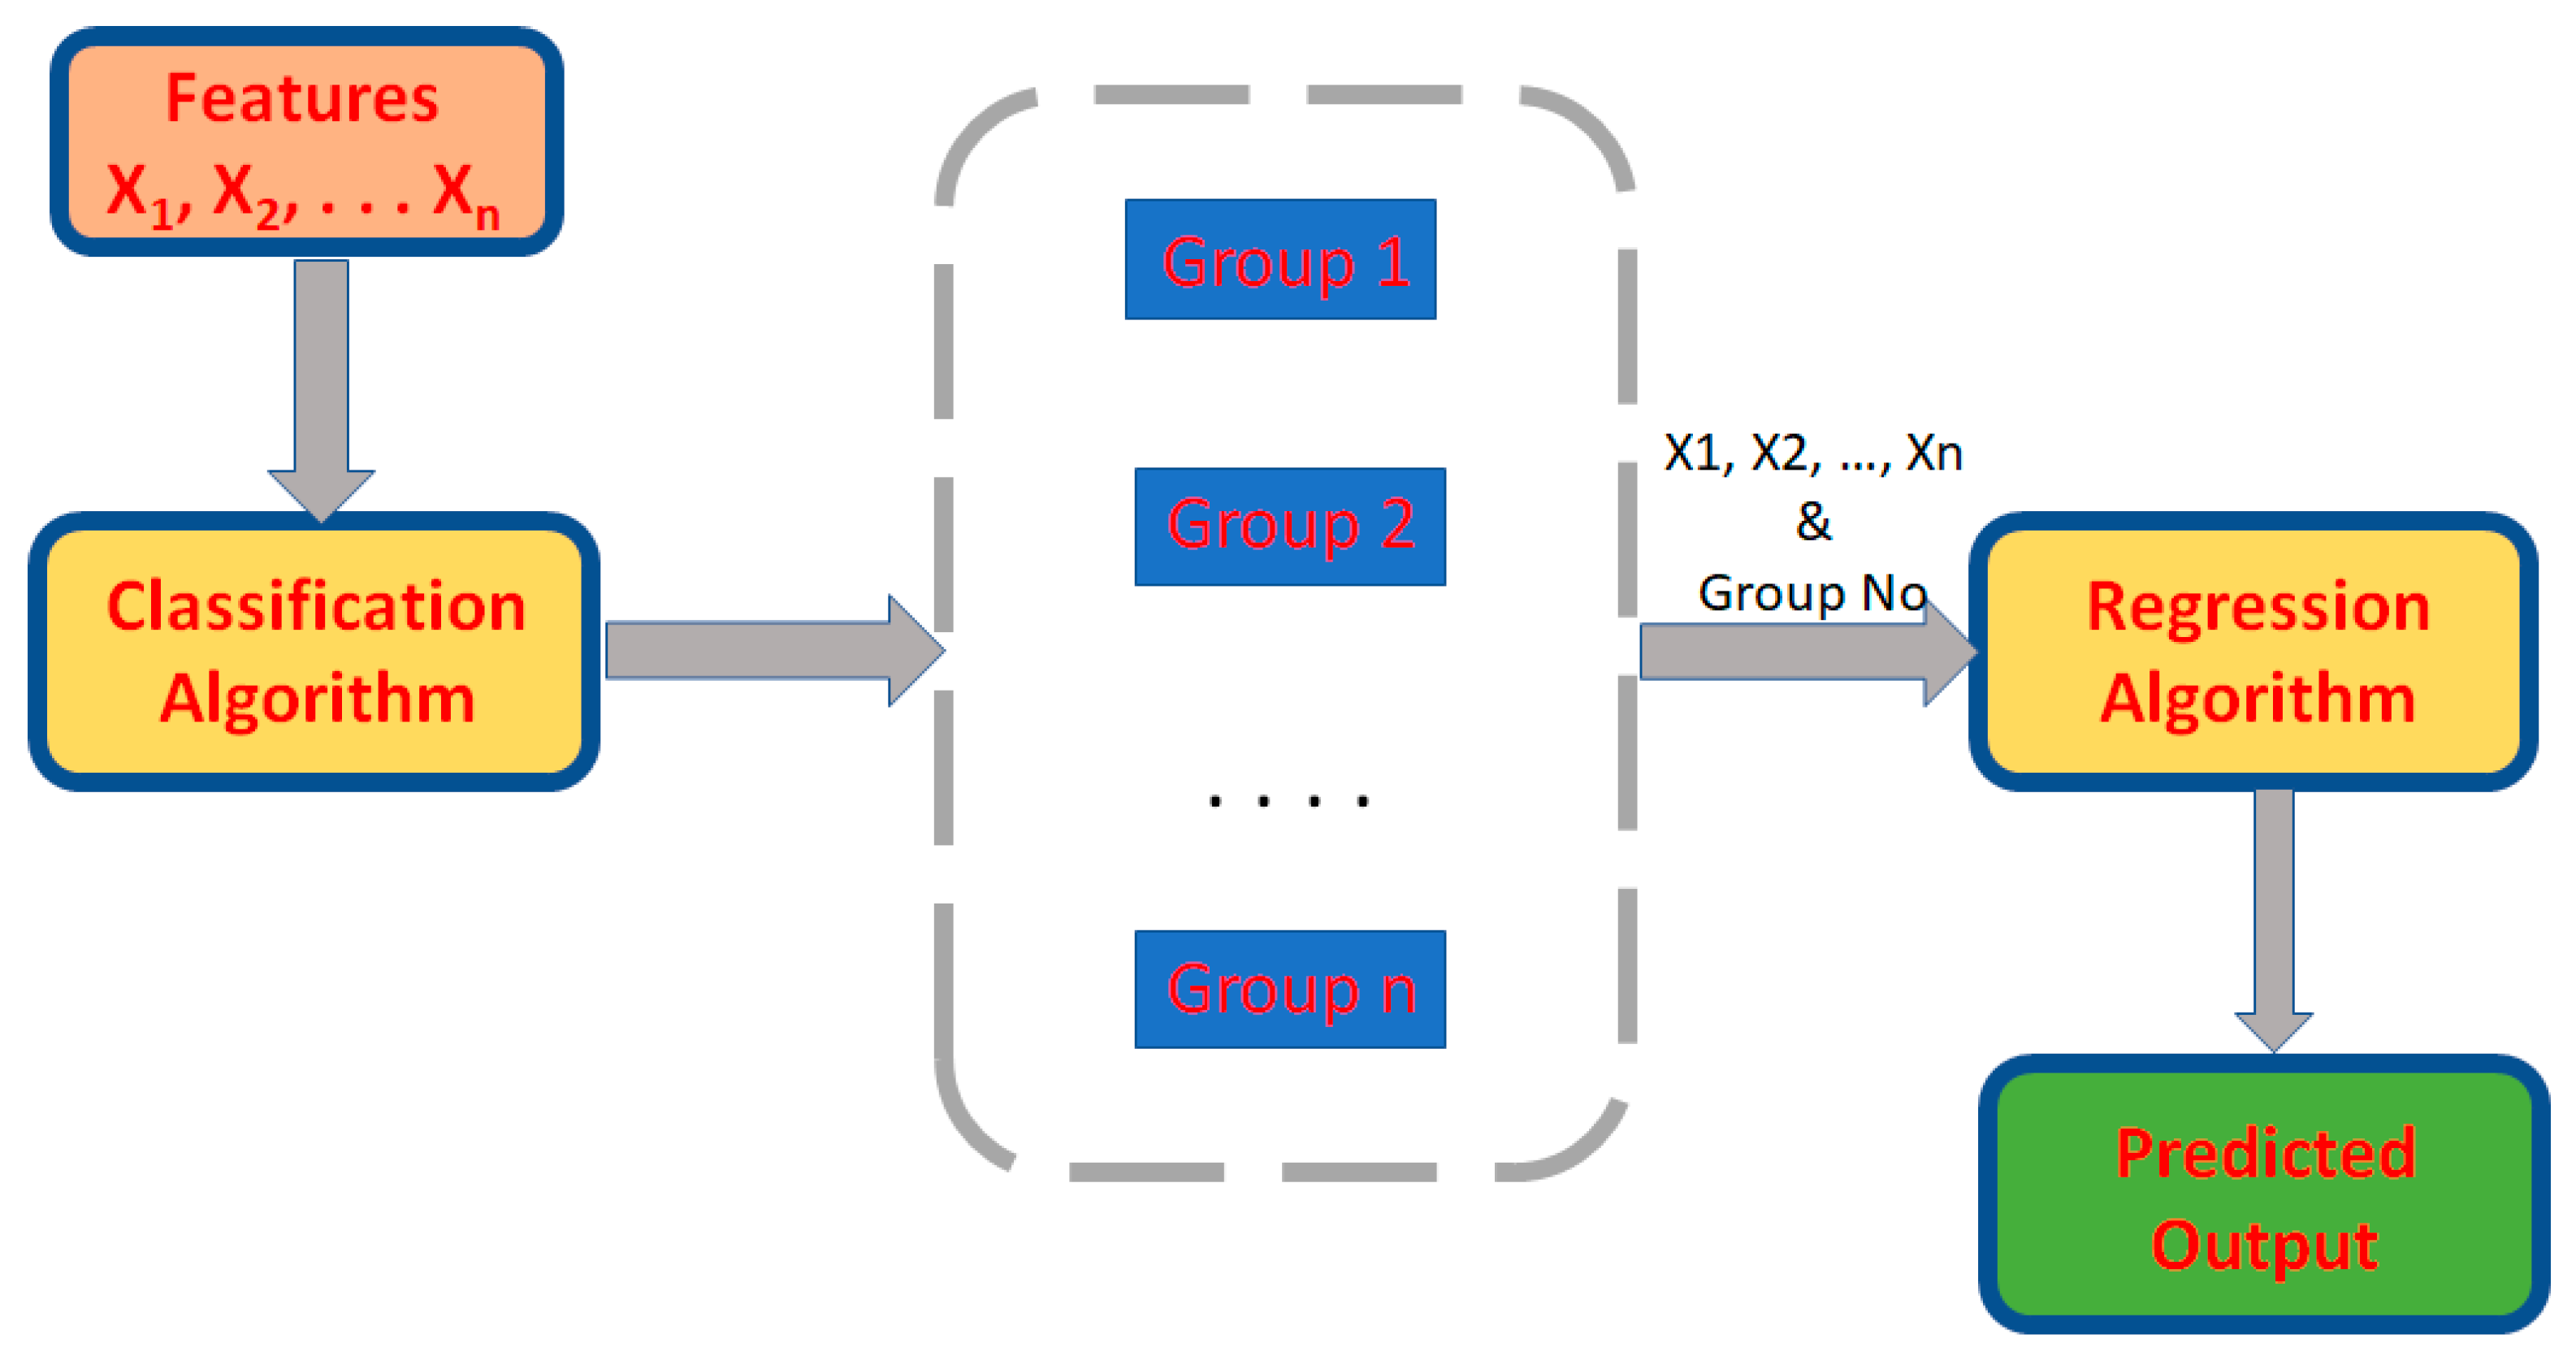
In this research, we propose a meta-based model that utilizes two ML algorithms, a classifier and a regressor, in a pipeline. A classifier is one that initially considers experimental data and classifies it into reasonable and more accurate groups. Regressor considers the grouped data and their attributes for teaching and prediction as depicted in Figure 1.

Figure 1.
Meta-based ML model illustrated.
One of the challenges in model development is the level of imbalance in the dataset. Most of the researchers developed models without considering the level of imbalance. Their focus was to evaluate the machine learning algorithms and to identify the suitable algorithm which shows the highest performance for their datasets. But it could end up with low accuracy or with a false high accuracy because the model could only fit the high-populated range of inputs and the output and perform very badly in the low-populated ranges.
To overcome the challenge of inaccuracy and to improve the accuracy of prediction models, a strategy known as output discretization has to be adopted. The output discretization, employed in the pre-processing step, discretizes the output variable into categorical bins (e.g., low, medium, high roughness) using a quantile-based binning strategy. This transformation enabled the use of a classification model to first identify the likely roughness category before applying a regression model to estimate the exact value. If the total variation range of the deviation of surface roughness is divided into three intervals of the same size, there will be x instances in the lower interval, y instances in the middle interval, and z instances in the higher interval. In output discretization, each sample will be assigned to a class based on its Ra value, resulting in x, y, and z instances in the low, medium, and high categories, respectively.
Quantile distribution is one method of performing output discretization. To prepare the dataset for model training and evaluation, a quantile distribution (otherwise called quantile binning) was applied to the surface roughness values (Ra), the response variable. For each material, the full range of Ra values was divided into two intervals based on quantile thresholds, creating two groups of approximately equal size. This binning approach ensures a more balanced representation of the surface roughness distribution and facilitates consistent model training and validation.
These instance counts were determined by the distribution of surface roughness in the dataset, not by tuning or post hoc performance adjustment. This discretized representation enabled the use of a hybrid classification and regression pipeline, where a classifier first predicts the roughness category, followed by a regressor that estimates a refined Ra value based on the predicted class. This method improves learning in cases where the continuous target exhibits clustering or skewness, and helps balance the training samples across output intervals. In the raw dataset, the majority of samples clustered within a narrow roughness range, while extreme values were underrepresented. Discretizing the target helped rebalance the distribution, ensuring that the model pays adequate attention to underrepresented regions of the target space.
Once the target output is classified into multiple classes using a distribution technique of quantile regression, then the predicted multi-class output can be utilized as a learning input parameter in the second stage of the model using a regressor to predict the final result. This technique with a meta-learning algorithm is called stacked generalization. Stacking is a type of ensemble learning algorithm that refers to combining the predictions of two or more predictive models. An ensemble machine learning algorithm uses meta-learning to combine the predictions made by ensemble members. In meta-based learning, experiences from multiple learning episodes are gained and utilized to improve future learning performance. Herein it is highlighted to the readers that the model developed in our research is a meta-based ML model, even if not specified anywhere in the article.
Cross Validation Method (k-Fold Method)
Another challenge in machine learning is not using all (100%) datasets for training. The evaluation of residuals estimates the difference between predicted and original responses, but it does not indicate how well the ML model will respond to real data or unseen data. The stability of the model in working with real data (unseen data) is to be checked, which is otherwise called validation of the model. It is to confirm whether the model has not considered the noise data, but it has considered most of the patterns from the right data. This process in ML model development is called cross-validation.
Generally, data analysts choose some percentage of datasets for training, some sets for testing, and some sets for validation. When we allocate some sets for testing and validation, there is a risk at the model to miss out some patterns in the datasets and it may possess underfitting. A method called k-fold cross-validation uses sufficient data for training and testing and does not leave any data for both training and testing. It divides the data into k subsets and uses one of k subsets for testing and k-1 subsets for training. It averages the error from k trials and finds the effectiveness of the model based on the averaged error. As it goes, every data point gets to be training set k-1 times and in the validation set exactly once. This method reduces the unfairness of avoiding the data points, as most of the data is used for fitting. It reduces variance as most of the data is also being used in validation. In addition, the effectiveness of the model is increased by interchanging the training and test sets. The k-fold cross-validation method was applied in every part of our model development and, hence, ensured that all datasets were used both in training and testing.
To optimize the performance of each machine learning algorithm, we employed a grid search method to systematically tune the model hyperparameters. During each iteration of grid search, model performance was evaluated using two key metrics: the coefficient of determination (R2), representing the goodness of fit, and the Root Mean Squared Error (RMSE), indicating the average prediction error. The goal of tuning was to maximize R2 and minimize RMSE on the validation set. This iterative process continued until the model achieved optimal performance under the defined grid. For each classifier, the hyperparameter configuration yielding the highest R2 and lowest RMSE was selected.
Subsequently, the best-performing classifier based on these evaluation criteria was chosen to advance to the next phase of the machine learning pipeline, which involved downstream regression.
3. Verification of the Proposed Model Development
3.1. Materials and Experiments
In order to validate the proposed meta-based model and to confirm the effectiveness of the method, some polymeric materials such as Polyoxymethylene (POM), Polytetrafluoroethylene (PTFE), Polyether ether ketone (PEEK), and Multiwall carbon nano tubes reinforced PEEK (PEEK/MWCNT) composite were considered. Among these four materials, three materials are polymer matrices, and PEEK/MWCNT is a polymer matrix composite whose material strength is higher than the other three materials. We selected these materials as they are some significant polymeric materials used in industrial applications and household items, as illustrated in Figure 2. More importantly, these materials have varied mechanical strength and operating conditions.
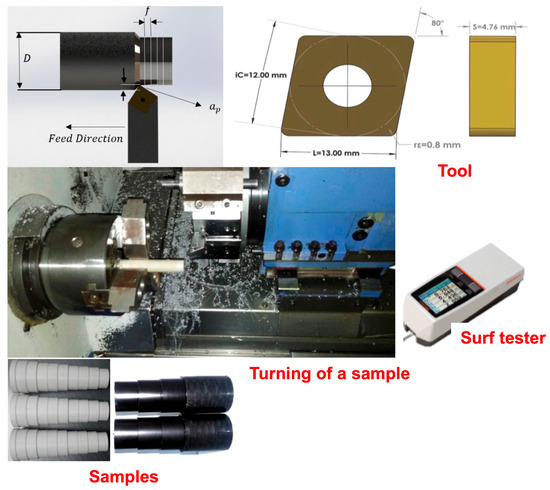
Figure 2.
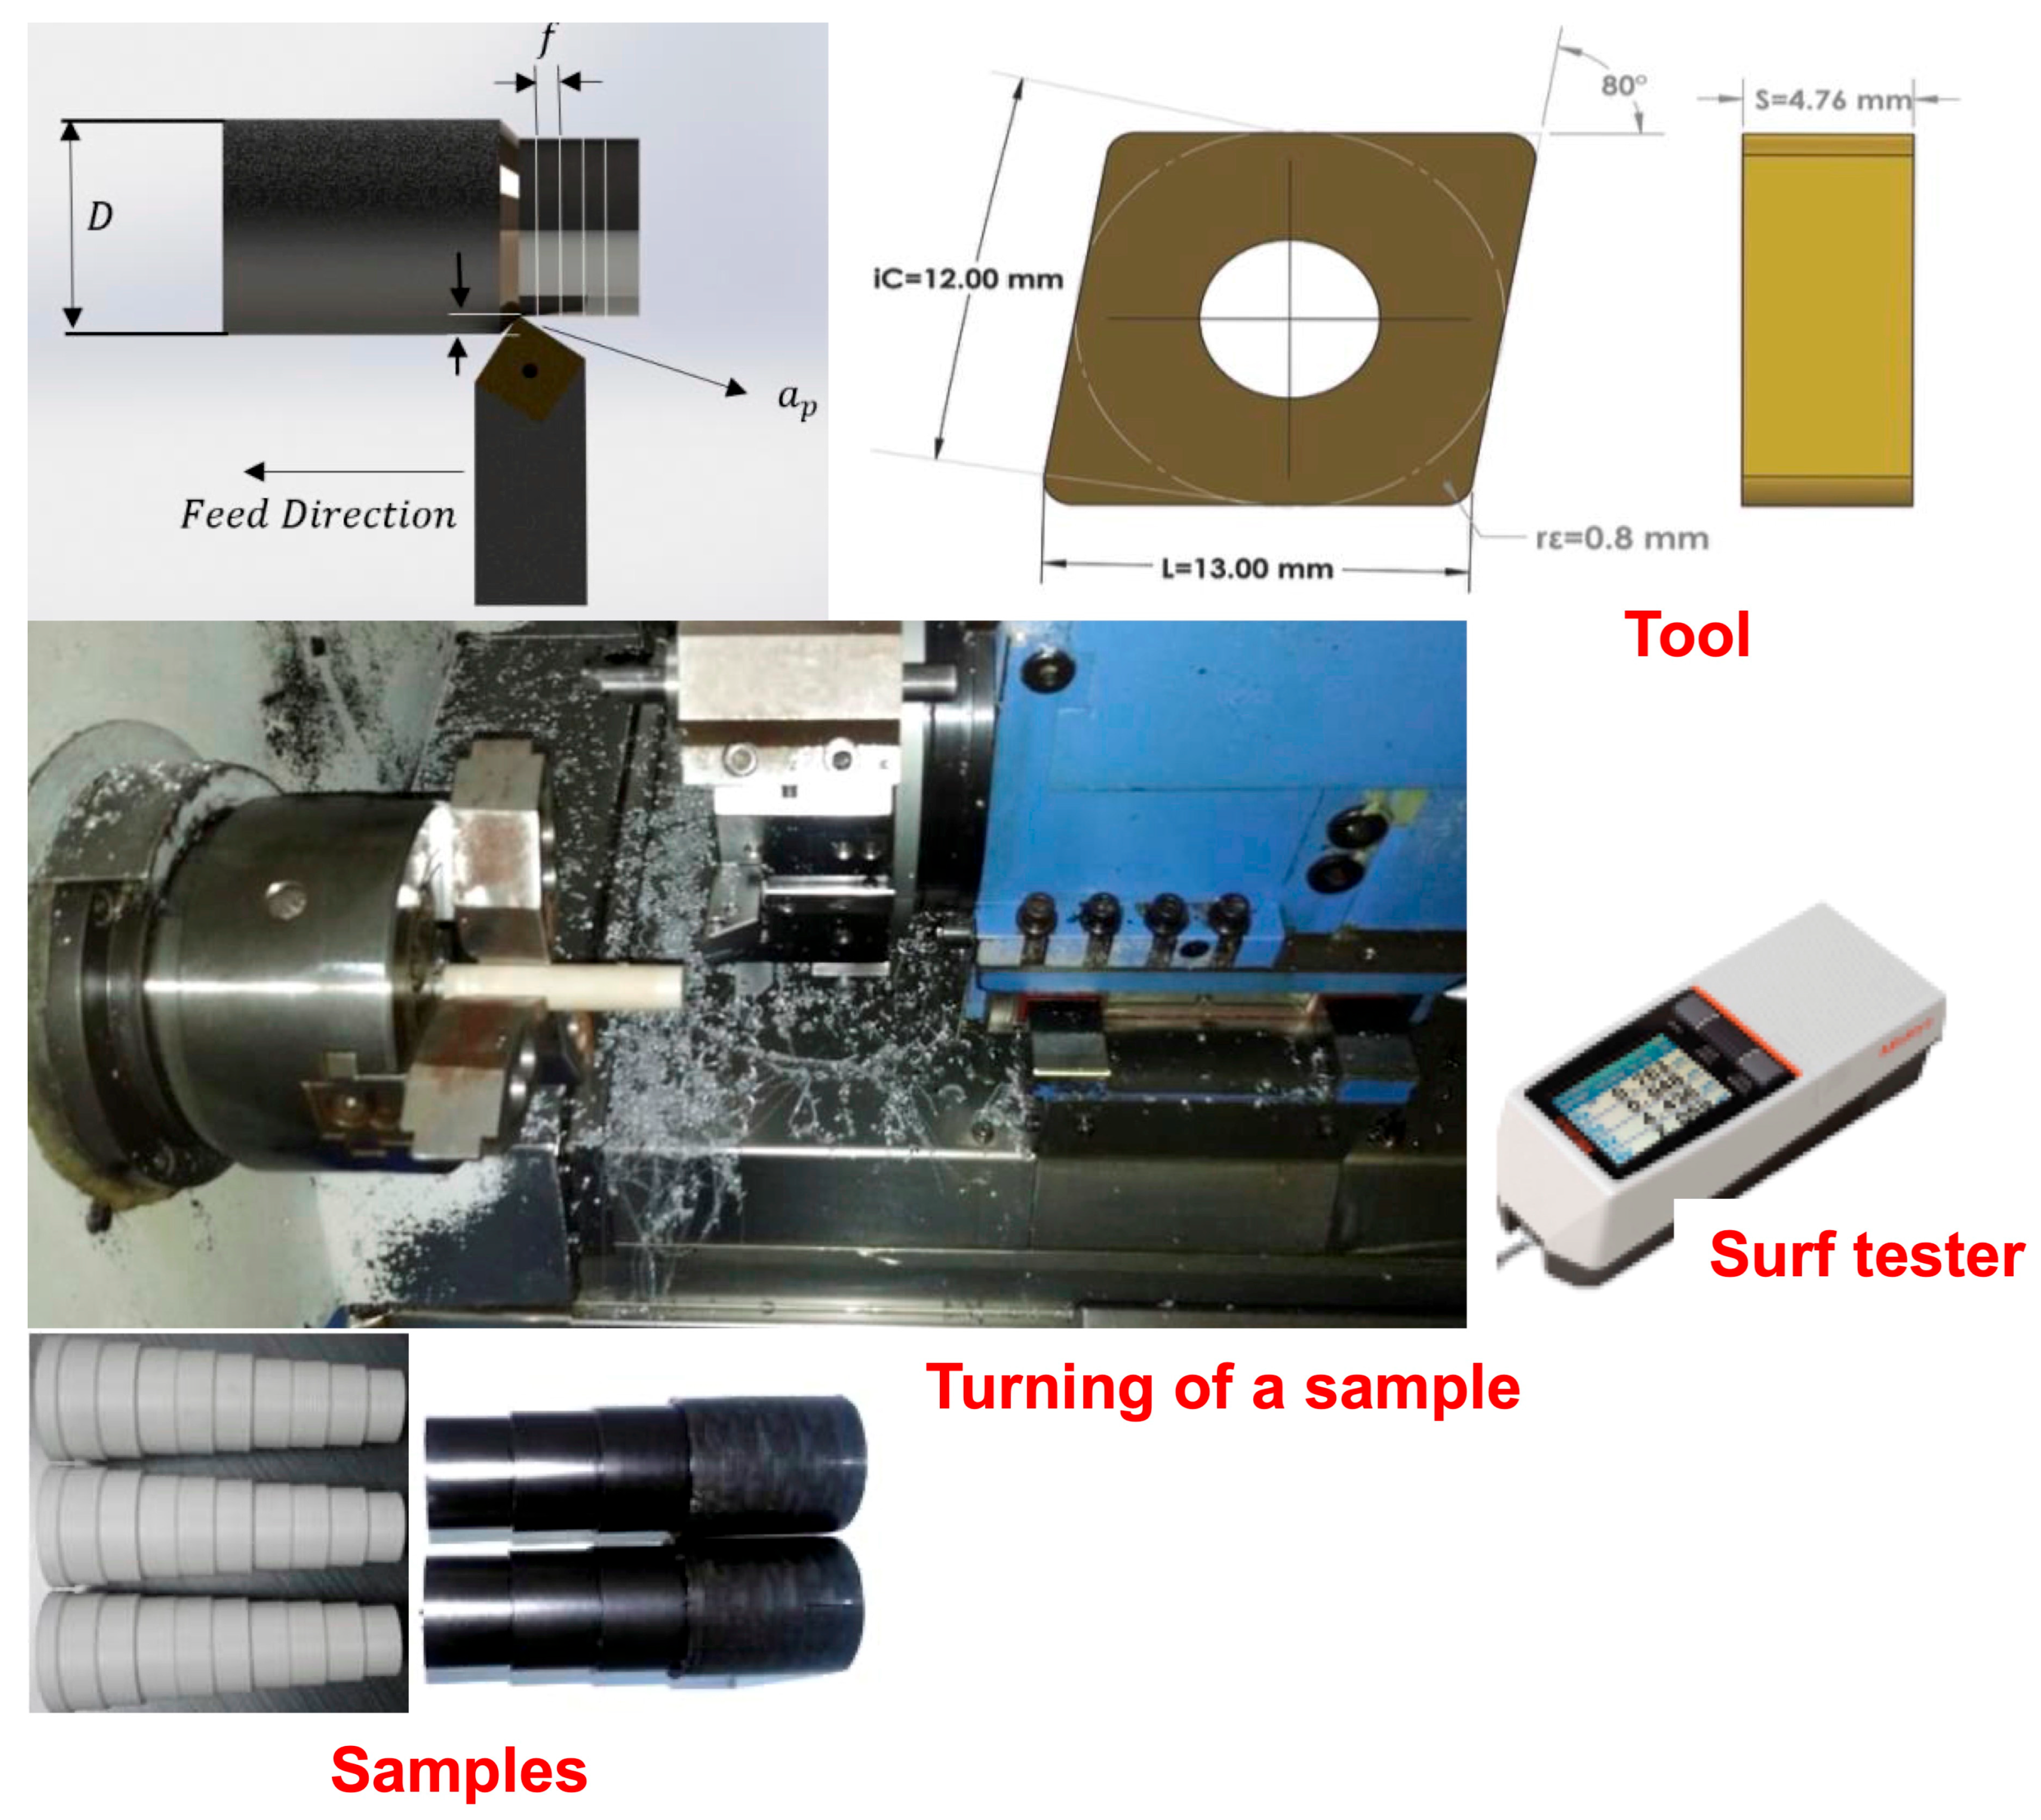
Overview illustrating the experimental setup and key elements used for machining polymeric materials. Insets show (top left) the cutting tool geometry and dimensions, (bottom left) the cylindrical samples prior to machining, (bottom center) the chips produced during the process, and (top right) the surface roughness tester used for post-machining surface quality measurements. In (middle right), the machining parameters are shown, including feed, cutting depth, and workpiece positioning.
To start with, a Design of Experiment (DoE) matrix for each material was prepared, considering Speed (Vc), feed (f), and depth of cut (ap) are control parameters (independent variables), while Surface finish (Ra) is the response variable (dependent variable). Table 2 depicts the levels chosen for each material, based on the advice from the supplier. L27 DoE matrix consisting of different combinations of values was prepared for each material using Minitab version 20, a statistical software.
Table 2.
Features and levels used in DoE.
For the experimentation, cylindrical rods in the size of 10 mm in diameter and 500 mm in length were purchased from Aerospace Engineers Private Limited, India. Turning experiments were performed as per the respective DoE using a CNC turning center (Model: Sprint 16TC Fanuc 0i T Mate Model C) supplied by Batliboi Ltd., Surat, India. The experiments were carried out with servo super cut coolant 32 t as per advice from the supplier. High-carbon cemented carbide tool (Grade CNMG 120408 QM) supplied by the same supplier was used in all experiments. The specification of the tool is Rhombie shape, insert angle = 80°, tolerance = ±0.13, insert size = 12 mm, insert thickness = 4.76 mm, insert clearance = 0°.
To measure surface roughness (Ra) instantaneously, a Mitutoyo-made surf tester was used. The specification of the meter is: stylus tip radius = 2 µm, stylus tip angle = 60°, stylus material = diamond, measuring force = 0.75 mN, skid radius = 40 mm. The 2 µm radius diamond stylus is designed to minimize deformation of soft materials during measurement. The low measuring force of 0.75 mN further reduces the risk of damaging delicate surfaces. Three trials of measurement were performed for each experiment, and the average of the measurements was recorded as shown in Table 3.
Table 3.
Cutting condition and surface roughness measured from turning experiments.
3.2. Meta-Based Model
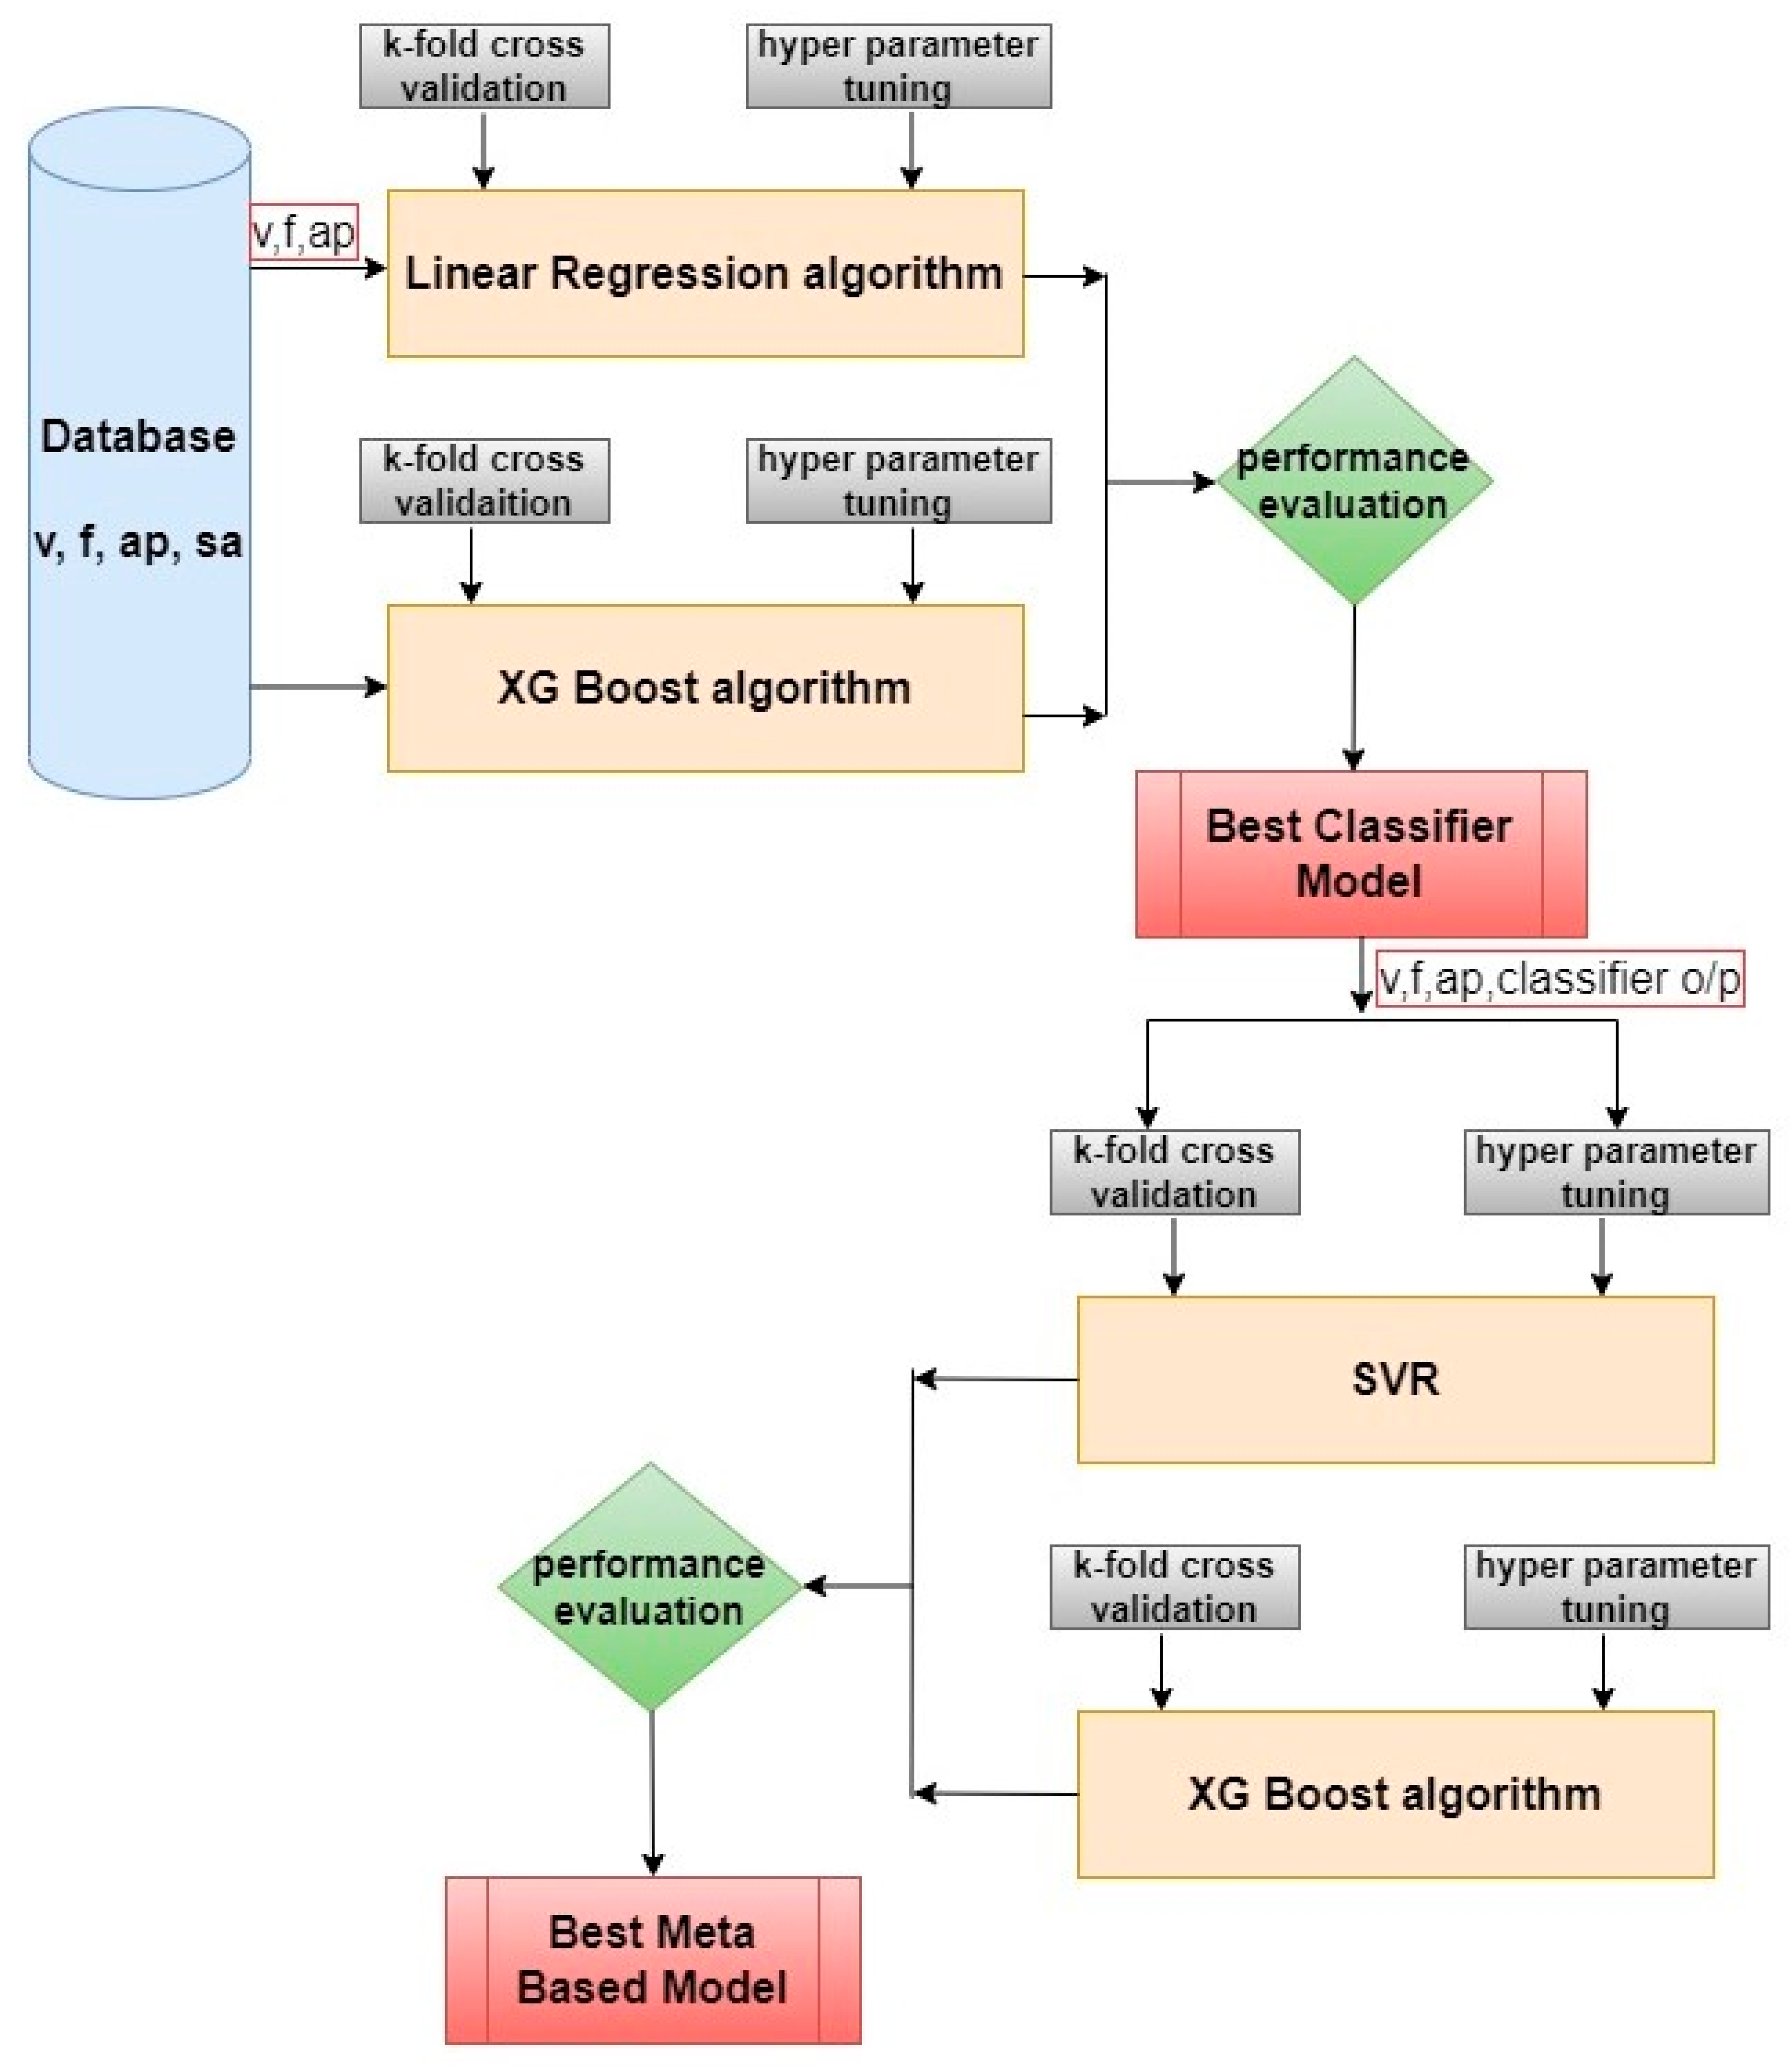
Intel(R) Core (TM) i7-7500U CPU @ 2.70GHz 2.90 GHz, 16.0 GB RAM, and Pycharm Community Edition 2024.3.2 were used for all model development. For each model, speed, feed, depth of cut, and surface roughness were used as features, and an 80:20 ratio was used for training and testing. To evaluate the performance of ML models, the XGBoost algorithm and Logistic Regression algorithms were used for the classifier part, and SVR and XGBoost algorithms were used for regression. These algorithms were selected based on both empirical performance and alignment with the characteristics of the dataset. Logistic Regression was chosen as a baseline classifier due to its interpretability, low variance, and ability to perform well on linearly separable data, which allows it to adequately distinguish machining regimes, especially with limited data. XGBoost was selected for both classification and regression due to its known robustness in small-to-medium-sized datasets, its ability to handle non-linear relationships, and its built-in mechanisms for managing missing values, feature interactions, and imbalanced data. Support vector regression (SVR) was chosen because of its effectiveness in modeling non-linear and high-dimensional data with limited training samples. The kernel trick enables SVR to capture complex relationships between input features and surface roughness without requiring a large dataset. To this end, this research explored simple, interpretable methods with more expressive learners, providing a performance versus complexity balance suitable for the polymer machining context. Figure 3 illustrates the methodology of the meta-based model development.
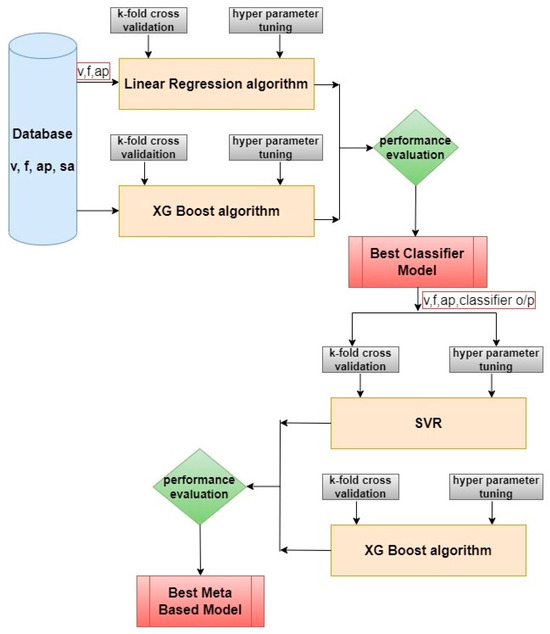
Figure 3.
Illustration of meta-based model development.
3.3. Results and Discussion
3.3.1. Quantile Distribution Method
Firstly, the quantile distribution method (also called quantile binning) was applied to split the data into the proper number of groups based on surface roughness (response variable). Based on the output from the quantile distribution, the datasets of the respective material were divided into two groups. For example, POM material datasets were grouped into two groups: Group 1, which has 14 datasets (µ ≤ 1.590), and Group 2, which has 13 datasets (µ > 1.590 and µ ≤ 1.88). The choice of the datasets was not random; it was performed by the Pareto principle. Table 4 shows the grouping of data and data size used for training and validation.
Table 4.
Output from quantile distribution.
3.3.2. Correlation Analysis
The foremost step in ML model development is to ensure the relationship between independent parameters and dependent parameters, and to identify the significance of the parameters. Hence correlation between inputs at outputs was performed using an Analysis of Variance (ANOVA). This analysis was performed to check if the inputs are correctly selected and to check if the inputs have any influence on the output. The significance was checked as (i) if the value of probability p ≤ 5%, the respective parameter is adequate and significant on response, and (ii) if the value of p > 5%, the respective parameter is insignificant on response. Table 5 shows the output of the correlation analysis. It is concluded from the analysis that feed is the most significant parameter on surface roughness.
Table 5.
Output from correlation analysis.
3.3.3. Performance of Meta-Based Models
After conducting the basis of feature extraction and correlation analysis, meta-based model development was started with a classifier and regressor. The classifier used experimental data and classified them into reasonable and more accurate groups. By decoupling the learning process into classification followed by regression, the model could focus on localized prediction within each bin, reducing variance and overfitting in sparse regions.
For classification, the XGBoost algorithm and the Logistic Regression algorithm were used separately. The dataset was first divided into an 80:20 ratio, where 80% of the data was used for model training and the remaining 20% was reserved as a hold-out test set for final evaluation. Within the training set, k-fold cross-validation was performed to internally validate the model and optimize hyperparameters using grid search. This approach ensures robust model selection while preserving an independent test set for evaluating generalization performance. This approach confirms nested validation properly and hence avoids data leakage, which is a major concern in ML development.
The goodness or accuracy of the model was assessed by determining the largest sum of squares (R2) and the smallest Mean Squared Error (MSE). During the training process, the performance of each model was monitored continuously and recorded with numerical results quantifying hypothesized relationships between variables. The prediction model with the lowest RMSE was considered the best model. The accuracy and performance of each classifier model were recorded as shown in Table 6. It is concluded from the results that the Logistic Regression model is the better model in all cases. Because it predicts probabilities of each observation in each class based on thresholds, it does not predict classes directly. It uses trade-off concerns or errors, like the number of false positives with respect to the number of false negatives. This is essential because each concern or error would affect other types of errors.
Table 6.
Performance metrics from classifier models.
Now, with four independent features (including output of the classifier), further model development has continued. Support Vector Regressor (SVR) and XGBoost (XGB) algorithms were used to complete meta based model. Cross validation method and grid search method were also adopted, and hyperparameters were tuned iteratively till the performance of the model is in the acceptable range. Table 7 shows the performance matrix of a meta-based model for each material. The experimental results clearly demonstrate that the XGB model consistently outperforms the SVR model across all four polymer materials. The XGB model achieved R2 values close to 100% and significantly lower RMSE values, both on the training and testing sets. These findings confirm that XGB provides superior predictive accuracy and generalizability for modeling surface roughness in polymer machining processes.
Table 7.
Performance metrics of meta-based model for each material.
3.3.4. Receiver Operating Characteristic (ROC) Curve Analysis
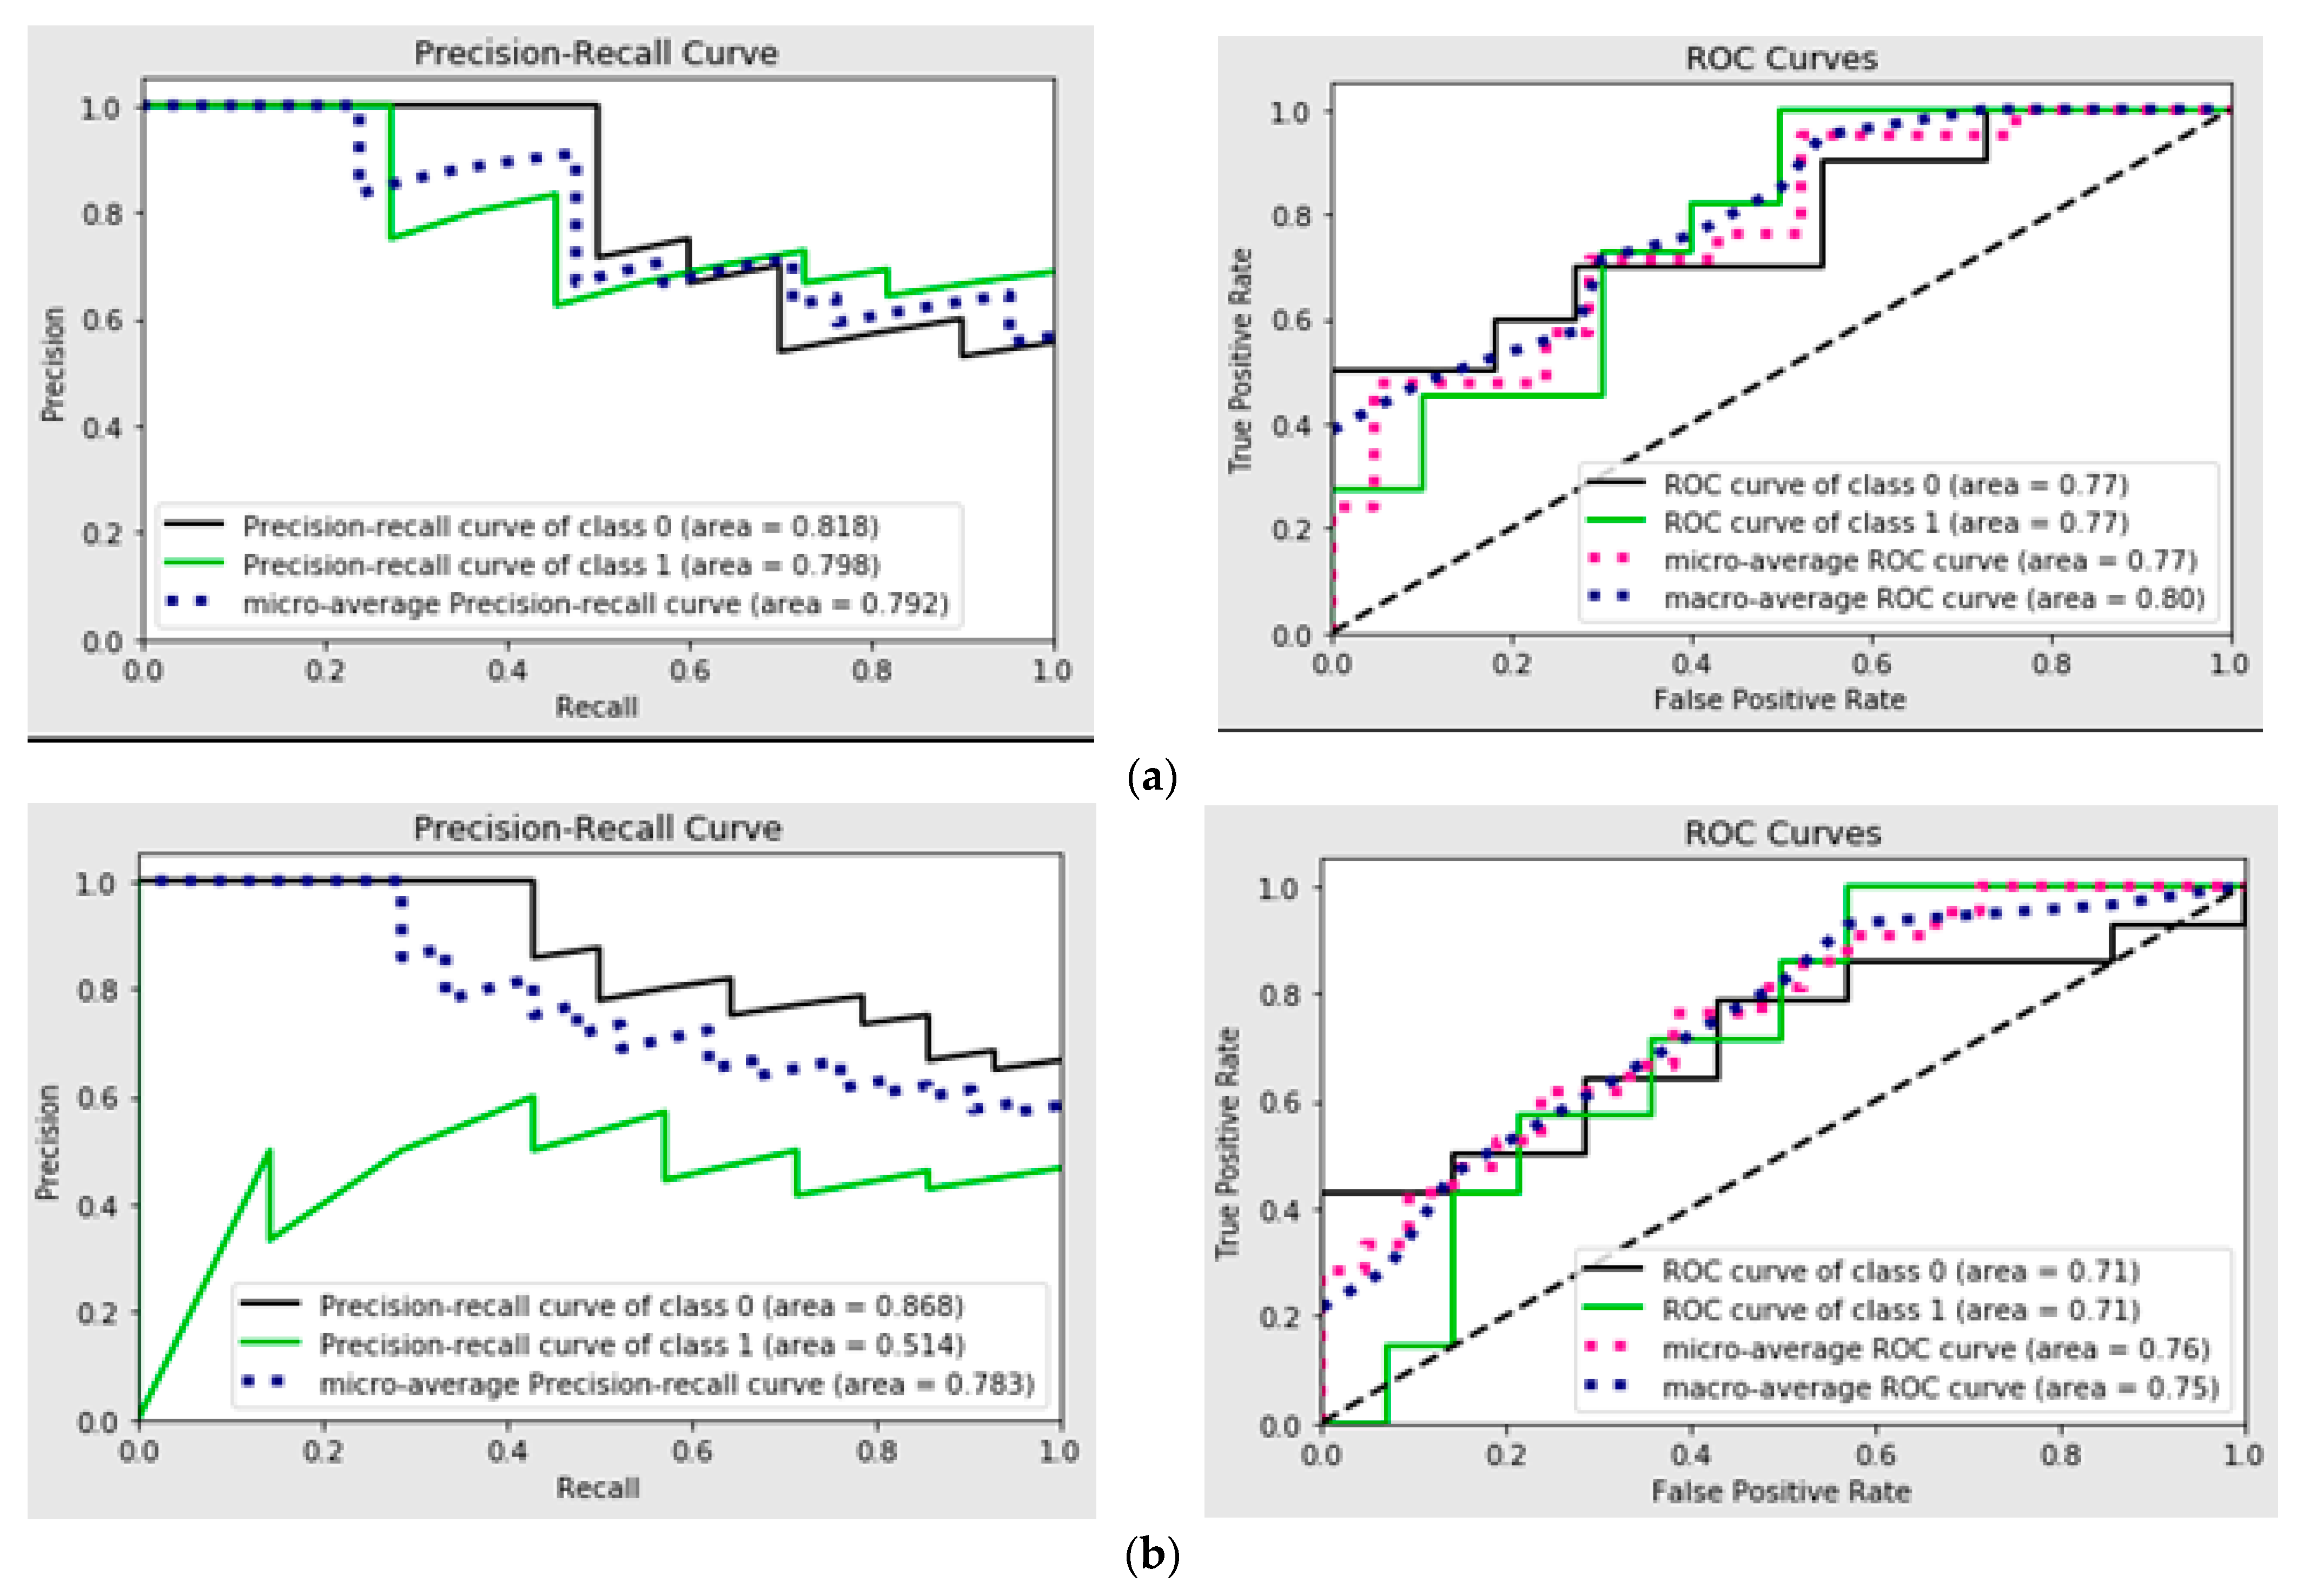
The analysis of Receiver Operating Characteristic (ROC) curves and Precision–Recall (PR) curves for the binary classification models offers insights into their predictive performance under varying probability thresholds. Specifically, ROC curves highlight the trade-off between true positives (sensitivity) and false positives (1-specificity). A classifier with an ROC curve closer to the top-left corner demonstrates superior performance, indicating a higher true positive rate for a lower false positive rate. If the curves for individual material models (Figure 4) approach this ideal, it suggests these models are effectively discriminating between the two classes.
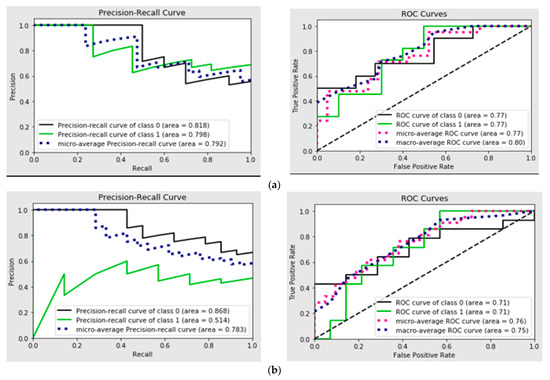
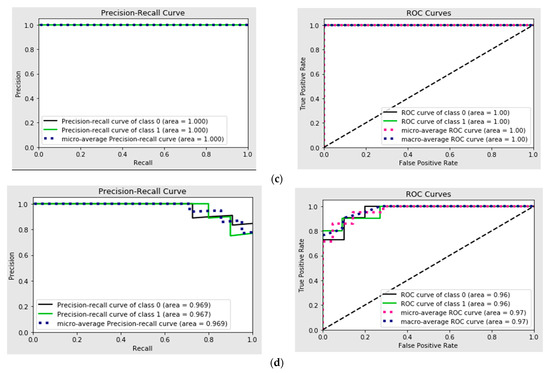
Figure 4.
(a) Precision–Recall curve and ROC curves for Delrin; (b) Precision–Recall curve and ROC curves for PTFE; (c) Precision–Recall curve and ROC curve for PEEK; (d) Precision–Recall curve and ROC curve for PEEK/MWCNT.
Precision–Recall curves (PRC) are particularly valuable in scenarios with class imbalance, emphasizing the trade-off between precision (positive predictive value) and recall (sensitivity). High Precision–Recall values across different thresholds suggest the models maintain strong predictive capabilities, even under challenging conditions.
By comparing both ROC and PR curves for individual material models, one can identify the models with the best balance of sensitivity, specificity, and precision. Models with steeper PRC and ROC curves closer to the top-left corner likely exhibit better overall performance. Variations across Figure 4 could reveal differences in the predictive reliability of the individual material models under study. These graphical tools collectively facilitate the selection of the most robust model for the given task, guiding decisions on threshold optimization for practical application scenarios.
To demonstrate our hypothesis that an ensemble approach (XGBoost) combined with output discretization can enhance prediction accuracy, further analysis was performed with a plain SVR model and a plain XGB model. The ensemble model (XGBoost) consistently outperformed SVR (Plain) and XGB (Plain) in both R2 and RMSE across all four materials (see Table 8).
Table 8.
Performance metrics of ensemble approach with output discretization compared with plain single model.
3.3.5. Limitation of the Study
Developing meta-based models with limited data presents a considerable challenge, as we discussed in Section 2, primarily due to increased risks of overfitting and reduced generalizability. Meta-based modeling techniques often rely on synthesizing predictions from multiple base models or learning patterns across tasks and typically benefit from large, diverse datasets. A greater volume of data not only facilitates more stable and faster convergence during training but also contributes to reducing statistical errors, particularly Type I (false positives) and Type II (false negatives). However, conducting additional experiments or acquiring more data can be prohibitively expensive or logistically infeasible in many real-world settings. As a result, a trade-off must be acknowledged between experimental cost and model performance. In such cases, leveraging strategies like transfer learning, data augmentation, or Bayesian optimization can help maximize predictive accuracy while minimizing the need for extensive new data collection.
4. Conclusions and Further Improvement
In this study, an innovative approach was investigated by combining classifiers and regressors in a unified prediction model. To address the challenge of inaccuracy and enhance predictive performance, a strategy known as output discretization was adopted. The approach of classifying the output into distinct levels before applying regression to predict the continuous response was successfully validated using three polymeric materials and one polymer matrix composite, considering speed, feed, depth of cut, and surface roughness as input parameters. The model’s reliability was assessed using the k-fold cross-validation method, and hyperparameter optimization was performed through grid search. Findings disclosed that the Logistic Regression algorithm outperformed the XGBoost algorithm for classification. Subsequently, when the outputs of the classifier were fed into regression algorithms, namely SVR and XGBoost, the XGBoost algorithm consistently delivered superior performance, achieving an R2 > 90% across all cases. At this end, our meta-based model for a single material is tested. In future work, the proposed approach combining classification and regression within a meta-based modeling framework will be extended to develop a unified meta-based model capable of generalizing across datasets from various polymeric materials. This integrated approach aims to leverage commonalities and differences among multiple material systems, enabling the model to predict both categorical properties (via classification) and continuous material responses (via regression) within a single, cohesive framework. By aggregating heterogeneous datasets, the unified model is expected to improve robustness, transferability, and predictability.
Author Contributions
Conceptualization and methodology, E.N.; software, S.E., M.R. and K.M.; validation, M.R., E.N. and A.K.; investigation, C.K.A.; data curation, C.K.A. and M.R.; writing—original draft, E.N.; writing—review and editing, M.R., S.E. and A.K.; supervision, E.N.; project administration, S.E. and K.M.; funding acquisition, A.K. All authors have read and agreed to the published version of the manuscript.
Funding
This research received no external funding.
Data Availability Statement
Data are included in the article itself.
Conflicts of Interest
Author 4, Karthikeyan Mohanraj was employed by the company Network International LLC, Dubai. The remaining authors declare that the research was conducted in the absence of any commercial or financial relationships that could be construed as a potential conflict of interest.
References
- Elango, S.; Natarajan, E.; Varadaraju, K.; Gnanamuthu, E.M.A.; Durairaj, R.; Mohanraj, K.; Osman, M.A. Extreme gradient boosting regressor solution for defy in drilling of materials. Adv. Mater. Sci. Eng. 2022, 2022. [Google Scholar] [CrossRef]
- Natarajan, E.; Fiorna, V.; Abdulaziz, A.-T.A.; Elango, S.; Abraham, G.E.M.; Saruchi, S.A.B. Characteristics of Machining Data and Machine Learning Models—Case Study. IET Conf. Proc. 2023, 23, 117–122. [Google Scholar] [CrossRef]
- Li, P.; Chang, Z. Accurate modeling of working normal rake angles and working inclination angles of active cutting edges and application in cutting force prediction. Micromachines 2021, 12, 1207. [Google Scholar] [CrossRef] [PubMed]
- Dörr, M.; Ott, L.; Matthiesen, S.; Gwosch, T. Prediction of tool forces in manual grinding using consumer-grade sensors and machine learning. Sensors 2021, 21, 7147. [Google Scholar] [CrossRef]
- Chacón, J.L.F.; de Barrena, T.F.; García, A.; de Buruaga, M.S.; Badiola, X.; Vicente, J. A novel machine learning-based methodology for tool wear prediction using acoustic emission signals. Sensors 2021, 21, 5984. [Google Scholar] [CrossRef]
- Xiao, Q.; Li, C.; Tang, Y.; Chen, X. Energy Efficiency Modeling for Configuration-Dependent Machining via Machine Learning: A Comparative Study. IEEE Trans. Autom. Sci. Eng. 2021, 18, 717–730. [Google Scholar] [CrossRef]
- Kundu, P.; Luo, X.; Qin, Y. Automatic Identification of Most Suitable Sensors and Health Indicators for Cutting Tool Wear Prediction in Smart Manufacturing Systems. In Proceedings of the 2021 26th International Conference on Automation and Computing (ICAC), Portsmouth, UK, 2–4 September 2021. [Google Scholar]
- Li, J.; Lu, J.; Chen, C.; Ma, J.; Liao, X. Tool wear state prediction based on feature-based transfer learning. Int. J. Adv. Manuf. Technol. 2021, 113, 3283–3301. [Google Scholar] [CrossRef]
- Varghese, A.; Kulkarni, V.; Joshi, S.S. Tool life stage prediction in micro-milling from force signal analysis using machine learning methods. J. Manuf. Sci. Eng. Trans. ASME 2021, 143, 054501. [Google Scholar] [CrossRef]
- Zhang, H. Tool Cutting Force Prediction Model Based on ALO-ELM Algorithm. Comput. Intell. Neurosci. 2022, 2022, 1486205. [Google Scholar] [CrossRef]
- Bonci, A.; Di Biase, A.; Dragoni, A.F.; Longhi, S.; Sernani, P.; Zega, A. Machine learning for monitoring and predictive maintenance of cutting tool wear for clean-cut machining machines. In Proceedings of the 2022 IEEE 27th International Conference on Emerging Technologies and Factory Automation (ETFA), Stuttgart, Germany, 6–9 September 2022. [Google Scholar] [CrossRef]
- Malagi, R.R.; Barreto, R.; Chougula, S.R. Neural Network Based Model for Estimating Cutting Force During Machining of Ti-6Al-4V Alloy. J. Future Sustain. 2022, 2, 23–32. [Google Scholar] [CrossRef]
- Das, A.; Das, S.R.; Panda, J.P.; Dey, A.; Gajrani, K.K.; Somani, N.; Gupta, N.K. Machine learning-based modeling and optimization in hard turning of AISI d6 steel with advanced altisin-coated carbide inserts to predict surface roughness and other machining characteristics. Surf. Rev. Lett. 2022, 29, 2250137. [Google Scholar] [CrossRef]
- Guo, L.; Yu, Y.; Gao, H.; Feng, T.; Liu, Y. Online Remaining Useful Life Prediction of Milling Cutters Based on Multisource Data and Feature Learning. IEEE Trans. Ind. Inform. 2022, 18, 5199–5208. [Google Scholar] [CrossRef]
- Deng, C.; Tang, J.; Miao, J.; Zhao, Y.; Chen, X.; Lu, S. Efficient stability prediction of milling process with arbitrary tool-holder combinations based on transfer learning. J. Intell. Manuf. 2023, 34, 2263–2279. [Google Scholar] [CrossRef]
- Gao, S.; Duan, X.; Zhu, K.; Zhang, Y. Generic Cutting Force Modeling with Comprehensively Considering Tool Edge Radius, Tool Flank Wear and Tool Runout in Micro-End Milling. Micromachines 2022, 13, 1805. [Google Scholar] [CrossRef] [PubMed]
- Wang, R.; Zhao, M.; Mao, J.; Liang, S.Y. Force Prediction and Material Removal Mechanism Analysis of Milling SiCp/2009Al. Micromachines 2022, 13, 1687. [Google Scholar] [CrossRef]
- Kumar, V.; Dubey, V.; Sharma, A.K. Comparative analysis of different machine learning algorithms in prediction of cutting force using hybrid nanofluid enriched cutting fluid in turning operation. Mater. Today Proc. 2023, Advance online publication. [Google Scholar] [CrossRef]
- Liu, M.; Xie, H.; Pan, W.; Ding, S.; Li, G. Prediction of Cutting Force via Machine Learning: State of the Art, Challenges and Potentials; Springer: Berlin/Heidelberg, Germany, 2023. [Google Scholar] [CrossRef]
- Makhfi, S.; Dorbane, A.; Harrou, F.; Sun, Y. Prediction of Cutting Forces in Hard Turning Process Using Machine Learning Methods: A Case Study. J. Mater. Eng. Perform. 2023, 33, 9095–9111. [Google Scholar] [CrossRef]
- Ho, Q.N.T.; Do, T.T.; Minh, P.S. Studying the Factors Affecting Tool Vibration and Surface Quality during Turning through 3D Cutting Simulation and Machine Learning Model. Micromachines 2023, 14, 1025. [Google Scholar] [CrossRef]
- Liu, P.; Lou, S.; Shen, H.; Wang, M. Machine Learning for Prediction of Energy Consumption and Broken Force in the Chopping Process of Maize Straw. Agronomy 2023, 13, 3030. [Google Scholar] [CrossRef]
- Soori, M.; Arezoo, B.; Dastres, R. Machine learning and artificial intelligence in CNC machine tools, A review. Sustain. Manuf. Serv. Econ. 2023, 2, 100009. [Google Scholar] [CrossRef]
- Kathmore, P.; Bachchhav, B.; Nandi, S.; Salunkhe, S.; Chandrakumar, P.; Nasr, E.A.; Kamrani, A. Prediction of Thrust Force and Torque for High-Speed Drilling of AL6061 with TMPTO-Based Bio-Lubricants Using Machine Learning. Lubricants 2023, 11, 356. [Google Scholar] [CrossRef]
- Lee, S.; Jo, W.; Kim, H.; Koo, J.; Kim, D. Deep learning-based cutting force prediction for machining process using monitoring data. Pattern Anal. Appl. 2023, 26, 1013–1025. [Google Scholar] [CrossRef]
- Djellouli, K.; Haddouche, K.; Belarbi, M.; Aich, Z. Prediction of the cutting tool wear during dry hard turning of AISI D2 steel by using models based on Learning process and GA polyfit. J. Eng. Exact Sci. 2023, 9, 18297. [Google Scholar] [CrossRef]
- Yurtkuran, H.; Korkmaz, M.E.; Gupta, M.K.; Yılmaz, H.; Günay, M.; Vashishtha, G. Prediction of power consumption and its signals in sustainable turning of PH13-8Mo steel with different machine learning models. Int. J. Adv. Manuf. Technol. 2024, 133, 2171–2188. [Google Scholar] [CrossRef]
- Nair, V.S.; Rameshkumar, K.; Saravanamurugan, S. Chatter Identification in Milling of Titanium Alloy Using Machine Learning Approaches with Non-Linear Features of Cutting Force and Vibration Signatures. Int. J. Progn. Health Manag. 2024, 15, 1–15. [Google Scholar] [CrossRef]
- Sharma, M.K.; Alkhazaleh, H.A.; Askar, S.; Haroon, N.H.; Almufti, S.M.; Al Nasar, M.R. FEM-supported machine learning for residual stress and cutting force analysis in micro end milling of aluminum alloys. Int. J. Mech. Mater. Des. 2024, 20, 1077–1098. [Google Scholar] [CrossRef]
- Pashmforoush, F.; Araghizad, A.E.; Budak, E. Physics-informed tool wear prediction in turning process: A thermo-mechanical wear-included force model integrated with machine learning. J. Manuf. Syst. 2024, 77, 266–283. [Google Scholar] [CrossRef]
- Kouguchi, J.; Tajima, S.; Yoshioka, H. Machine-Learning-Based Model Parameter Identification for Cutting Force Estimation. Int. J. Autom. Technol. 2024, 18, 26–38. [Google Scholar] [CrossRef]
- Gross, D.; Spieker, H.; Gotlieb, A.; Knoblauch, R.; Elmansori, M. Efficient Milling Quality Prediction with Explainable Machine Learning. arXiv 2024, arXiv:2409.10203. [Google Scholar] [CrossRef]
- Reeber, T.; Wolf, J.; Möhring, H.C. A Data-Driven Approach for Cutting Force Prediction in FEM Machining Simulations Using Gradient Boosted Machines. J. Manuf. Mater. Process. 2024, 8, 107. [Google Scholar] [CrossRef]
- Colantonio, L.; Equeter, L.; Dehombreux, P.; Ducobu, F. Confidence Interval Estimation for Cutting Tool Wear Prediction in Turning Using Bootstrap-Based Artificial Neural Networks. Sensors 2024, 24, 3432. [Google Scholar] [CrossRef] [PubMed]
- Kim, K.; Islam, M.A.; Lih, S.-S.; Jang, J.-E. Machine learning design of nonlinear elastomeric springs fabricated via additive manufacturing. Addit. Manuf. 2023, 59, 103408. [Google Scholar]
- Ghaderi, R.; Mehrafrooz, B.; Ramamurty, U. Bayesian-based data-driven constitutive modeling of elastomers using experimental stress–strain data. Comput. Mech. 2022, 70, 387–401. [Google Scholar]
- Yan, Q.; Deng, S.; Zhao, H. Dual convolutional neural network model for predicting shape memory polymer performance using BigSMILES. Mater. Today Commun. 2023, 35, 105524. [Google Scholar] [CrossRef]
- Jin, L.; Wang, Z.; Liu, J.; Xu, Y. Optimization of high-performance epoxy resins using artificial neural networks. Polymers 2021, 13, 452. [Google Scholar] [CrossRef]
- Kuenneth, C.; Ramprasad, R. Data-driven polymer dielectrics design: Theory, descriptors, and predictions. Sci. Data 2020, 7, 122. [Google Scholar] [CrossRef]
- Shah, P.; Bhattacharyya, D.; Fang, Q. Machine learning-aided real-time prediction of melt pressure in PLA foam extrusion. Polym. Eng. Sci. 2022, 62, 3029–3042. [Google Scholar] [CrossRef]
- Vincent, A.M.; Jidesh, P. An improved hyperparameter optimization framework for AutoML systems using evolutionary algorithms. Sci. Rep. 2023, 13, 4737. [Google Scholar] [CrossRef]
- Aghaabbasi, M.; Ali, M.; Jasiński, M.; Leonowicz, Z.; Novák, T. On Hyperparameter Optimization of Machine Learning Methods Using a Bayesian Optimization Algorithm to Predict Work Travel Mode Choice. IEEE Access 2023, 11, 19762–19774. [Google Scholar] [CrossRef]
- Ali, Y.A.; Awwad, E.M.; Al-Razgan, M.; Maarouf, A. Hyperparameter Search for Machine Learning Algorithms for Optimizing the Computational Complexity. Processes 2023, 11, 349. [Google Scholar] [CrossRef]

Disclaimer/Publisher’s Note: The statements, opinions and data contained in all publications are solely those of the individual author(s) and contributor(s) and not of MDPI and/or the editor(s). MDPI and/or the editor(s) disclaim responsibility for any injury to people or property resulting from any ideas, methods, instructions or products referred to in the content. |
© 2025 by the authors. Licensee MDPI, Basel, Switzerland. This article is an open access article distributed under the terms and conditions of the Creative Commons Attribution (CC BY) license (https://creativecommons.org/licenses/by/4.0/).