Abstract
This study explores the machinability of Material Extrusion (MEX) printed parts made from carbon fiber-reinforced polylactic acid (PLA). MEX-printed parts typically exhibit high surface roughness, necessitating post-processing to enhance their quality. In this work, milling was used as a post-processing method to improve the surface finish. Response surface methodology (RSM) experimental design was employed to investigate the effects of cutting velocity, feed rate, and depth of cut on the surface quality of the machined surfaces. Results showed that the as-built MEX-printed sample exhibited a high average surface roughness (Sa) of ~7.982 µm, indicating the need for post-processing. Post-processing milling considerably enhances the Sa by reducing it to ~1.621 µm under the optimal condition. Statistical findings showed that all considered factors have significant influence on the Sa, with feed rate as the most influential one, contributing to 47.63% of the total variation. The Sa values varied from 1.834 µm to 4.146 µm due to changes in the considered factors. Increasing feed rate leads to the emergence of cavities and ridges along the deposited filaments associated with brittle removal mechanism, resulting in higher surface roughness.
1. Introduction
Material Extrusion (MEX) is a polymer-based 3D printing technology, where material is selectively dispensed through the nozzle of a 3D printer. MEX is an extrusion-based technique that manufactures parts incrementally, layer by layer. It is simple, affordable, accessible, flexible, and versatile in material terms [1]. It can process a wide variety of materials, from single polymers to advanced reinforced polymer composites [2,3,4]. Hence, it is the most popular among the 3D printing technologies [5]. However, MEX parts typically have lower surface quality than those from stereolithography (SLA) and selective laser sintering (SLS). The surface roughness of MEX-printed components is typically quite high.
Post-processing is typically necessary to improve the surface defects that accompany MEX printing. Machining is a desirable post-processing technique employed to meet end product demands, including surface roughness [6] and dimensional accuracy [7]. It has been employed as a post-processing technique for various additively manufactured components produced by different technologies, including electron beam melting (EBM) [8,9,10], selective laser melting [11,12], SLA [13], etc. Furthermore, it can be helpful to improve mechanical properties alongside surface quality [14].
Research is gaining interest in the machinability of MEX-printed parts fabricated from polymer-based materials, including single polymers and composites. Reported studies evaluated the machinability of MEX-printed components, taking into account various factors, including printing parameters [7,14,15], material types such as single polymers and composite polymers [5,7,16], machining parameters [5,16,17,18], and cutting fluids [19,20]. Dezaki and Ariffin [14] conducted trimming on PLA samples printed with MEX, considering the effects of printing orientation, trimming feed rate, and spindle speed. Results indicated that surface roughness was improved by 97.18% compared to the as-built samples. Enhanced surface roughness can be attained with increased feed rates and increased cutting speeds when samples are printed at a 0° building orientation. Zhou et al. [15] examined the surface quality of machined samples following dry milling of MEX-printed PEEK. The results indicated that both the machining direction and the printing direction affect the quality of the machined surfaces, including surface roughness and delamination. Arnés-Urgellés et al. [17] investigated the effect of milling parameters, including cutting speed, feed rate, and depth of cut, on the surface roughness of ABS samples produced via MEX. The results indicated that postprocessing improved surface roughness, and the feed rate had a significant effect on surface roughness. Furthermore, a comparison of the machinability of 3D-printed parts made using MEX and multiJet printing (MJP) processes revealed that MEX-printed parts were more machinable than MJP. Vallejo et al. [7] studied two milling operations, face milling and peripheral milling, when machining MEX-printed PETG and PETG-CF. The findings demonstrated that integrating CFs into PETG enhanced the surface roughness during face milling. However, integrating CFs into PETG results in a significant increase in surface roughness, especially at higher layer thicknesses. Ferreira et al. [5] explored post-processing face milling on MEX-printed polyamide 12 (PA12) and carbon fiber-reinforced polyamide 12 (PA12-CF). The impact of printing orientation and machining parameters, including tool geometry, machining speed, feed rate, and depth of cut, on surface roughness was evaluated. Results indicated a significant reduction in surface roughness following the machining of both PA12 and PA12-CF. Guo et al. [16] investigated the post-processing dry milling of PEEK and carbon fiber-reinforced PEEK (PEEK-CF) materials fabricated by MEX, focusing on the effects of machining parameters such as depth of cut, spindle speed, and feed rate per tooth. The results indicated that cutting velocity had no significant effect on surface roughness, whereas increased depth of cut and feed rate resulted in greater surface roughness. El Mehtedi et al. [21] investigated post-processing face milling of MEX-printed PLA, PETG, and PETG-CF, evaluating the effects of cutting velocity, feed rate, and cutting depth on surface roughness. The results showed that the influence of milling parameters is dependent on the material, e.g., PLA, PETG, and PETG-CF. Tzotzis et al. [9] examined the post-processing turning of MEX-printed PETG-CF, assessing the impacts of cutting velocity, feed rate, and cutting depth on surface roughness and tool temperature. Findings indicated that increased feed rates and depth of cut substantially increased surface roughness.
Limited research has been conducted on the machining post-processing of MEX-printed parts, particularly those produced using carbon fiber reinforced polymers (CFRPs). CFRPs composites are utilized in various engineering applications owing to their outstanding mechanical characteristics [22]. Machining CFRPs pose challenges due to the possibility of carbon fiber fracture, delamination, burr formation, and surface cavities, leading to surface quality issues. These challenges are not unique to CFRPs. Similar issues also occur when machining other advanced materials, such as metal matrix composites, which necessitate post-processing or hybrid machining methods, such as electrochemical discharge grinding [23], to meet surface quality requirements. To the best of our knowledge, no studies have reported on the post-processing of carbon fiber-reinforced polylactic acid (PLA). In this regard, this study investigates the milling post-processing of carbon fiber-reinforced polylactic acid (PLA-CF) to enhance surface quality. RSM experimental design was employed to investigate the effects of milling parameters, including cutting velocity, feed rate, and depth of cut, on the surface quality of the machined surfaces. Surface roughness was evaluated using a 3D optical profilometer.
2. Materials and Methods
2.1. Materials
Polylactic acid (PLA) reinforced with carbon fibers (CFs) obtained from Sunlu was used [24]. Thermogravimetric (TG) analysis was performed using TA Instruments SDT Q600 (TA Instruments, New Castle, DE, USA) under N2 flow (50 mL/min) with an aluminum crucible, heating from ~25 °C to 450 °C at 15 °C/min heating rate to determine the CFs wt.%. According to the TG test, the CFs content in the filament is 13.74 wt.%. Samples for machining analysis were designed and MEX-printed using a Prusa MK4 3D printer (Prusa Research, Prague, Czech Republic), as depicted in Figure 1a–c. The employed MEX printing parameters are listed in Table 1.
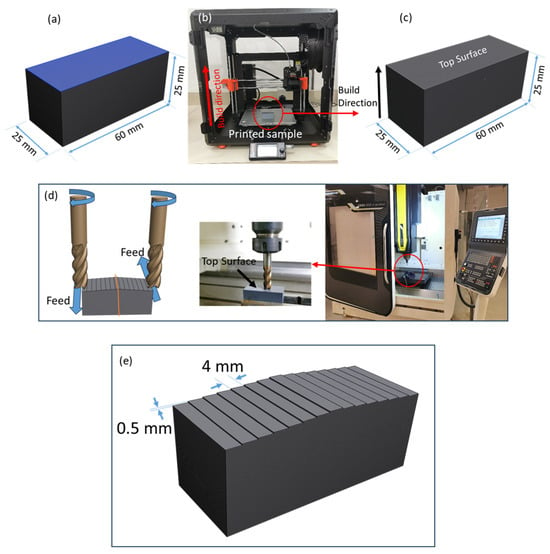
Figure 1.
MEX-printing and machining setup: (a) sample design, (b) MEX-printing, (c) printed sample showing build direction, (d) CNC machine and setup, and (e) prepared sample.

Table 1.
MEX printing parameters.
2.2. Machining Setup
The post-processing milling of PLA-CFs MEX-printed samples was conducted on a DMC 635 V Ecoline CNC machine (DMG Mori, Oelde, Germany), as shown in Figure 1d. A tungsten carbide end mill (12 mm diameter and 4 flutes), coated with TiAlN, was used. The face milling was conducted on the top face of the printed samples with 60 mm × 25 mm × 25 mm dimensions, as shown in Figure 1d. Two samples were 3D printed and the machining experiments were conducted on both samples. Initially, the sample was leveled using a dial gauge, and fine milling, e.g., lower feed rate (0.02 mm/tooth) and lower depth of cut (0.10 mm), was conducted to ensure a precise cutting depth. To prevent tool rubbing against a previously machined surface, step-like fine machining was first carried out before conducting the actual designed experiments with a 0.5 mm step between successive experiments. Then, face milling with a length of 25 mm and a radial depth of 4 mm was used. Experiments were performed using down-milling under flood-cutting conditions using Fuchs ECOCOOL S-HL (Fuchs, Mannheim, Germany), as shown in Figure 1e.
2.3. Experimental Design
Face milling post-processing was employed to investigate the impact of milling parameters, including cutting velocity (v), feed rate (f), and depth of cut (d), on average surface roughness (Sa) of PLA-CFs MEX-printed samples. Response surface methodology (RSM) with face central composite design was used as methodological framework for systematically exploring the effects of various milling post-processing factors on the surface roughness of PLA-CFs MEX-printed. RSM is a collection of statistical and mathematical techniques used to model and optimize the relationship between process variables and responses [25]. The RSM experimental design with the three milling parameters resulted in 19 experiments with a single replication, distributed as follows: 8 cube points, 5 center points in the cube, and 6 axial points. Analysis of variance (ANOVA) was used to analyze the statistical influence of the considered machining parameters. Reduced ANOVA table was conducted using stepwise to enhance the predictability, and then the reduced ANOVA model was used to develop regression model. The statistical significance of each milling parameter was evaluated using ANOVA. Table 2 presents the considered milling parameters and their levels. The range of levels of these milling parameters was based on the literature and preliminary experiments. Optimal settings that minimize the surface roughness were determined using desirability approach. Design Expert 13 software was used for performing statistical analysis.

Table 2.
Machining parameters and their levels for RSM experiment design.
2.4. Surface Characteristics
A 3D optical profilometer (ContourGT-K, Bruker, Billerica, MA, USA) was used to evaluate the surface roughness, namely average surface roughness Sa, of the machined surfaces, as depicted in Figure 2a. The 3D optical profilometer uses vertical scanning interferometry (VSI), which can yield precision in the nanometer range. For each RSM experiment, five measurements across the machined surface were conducted (Figure 2b), and their average were reported. Furthermore, the surface roughness of the MEX-printed samples before machining was also evaluated to assess the effectiveness of the milling post-processing. An area of 2.279 mm × 1.709 mm was scanned using white light with a 0.55× objective lens. Surface morphology was evaluated using an optical microscope, as shown in Figure 2c.
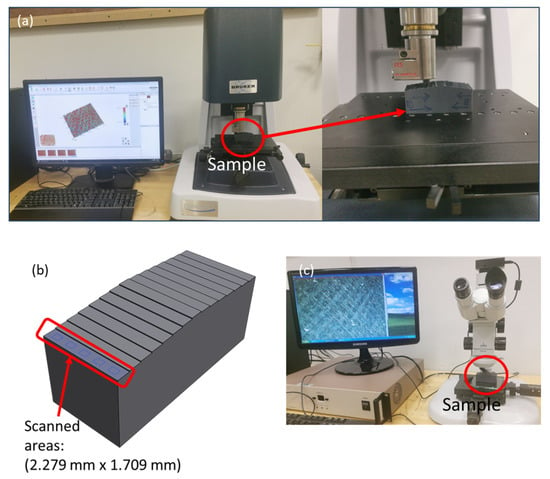
Figure 2.
Surface roughness measurement setup: (a) 3D optical profilometer, (b) scanned areas, and (c) optical microscope.
3. Results and Discussion
3.1. As-Built Surface Characteristics
Figure 3 shows the surface morphology of the as-built sample. It exhibits several surface defects, including voids, ridges, valleys, inconsistent deposition, and track lines, which are common issues associated with the MEX printing of composite polymers. These defects adversely affect the surface texture and increase surface roughness. Before conducting machining, the roughness of the top surface of the as-built sample was measured. The Sa of the MEX-printed samples before machining was found to be 7.982 ± 0.346 µm, highlighting the need for post-processing to enhance the surface roughness.
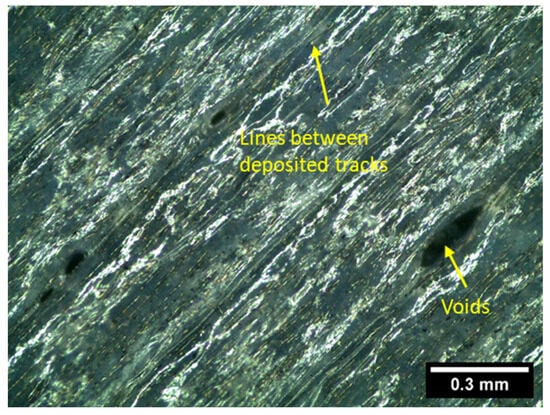
Figure 3.
As-built surface morphology of the top surface of the MEX-printed sample.
Table 3 shows the experimental results of the nineteen experiments based on the RSM design. The experiments were conducted in a randomized order to minimize potential systematic errors such as inconsistencies in MEX-printed samples. The randomized experimental sequence is presented in Table 3 (Run order column). The variation in the five scanned areas is represented by the standard deviation (SD). In general, low variation across the five scanned areas is observed. However, under certain conditions (lower cutting velocity and higher feed rate), as in experiment #3, the variation among the five scanned areas is higher, which can be attributed to the presence of MEX-related defects such as voids and track lines that became more obvious due to the employed milling parameters, as discussed later in Section 3.5.

Table 3.
Sa results of the RSM design.
It is evident from Table 3 that post-processing machining significantly enhances the surface roughness as compared to the non-machined surface. For instance, the minimum Sa was found to be 1.834 µm, which is much lower than that of the non-machined surface (7.982 µm).
3.2. ANOVA Analysis
An analysis of the considered machining parameters and their effects on the surface area (Sa) was carried out using analysis of variance (ANOVA). The fitting parameters are presented in Table 4, showing a good representation of the variation in Sa resulting from the addressed factors (v, f, and d) as evidenced by a high percentage of R2 (97.11%). Table 4 also shows predicted R2 with 91.87% suggesting a good prediction for the Sa. Furthermore, the normality assumption was satisfied, as indicated by Figure 4.

Table 4.
Coefficients of determination for the reduced model of surface roughness (Sa).
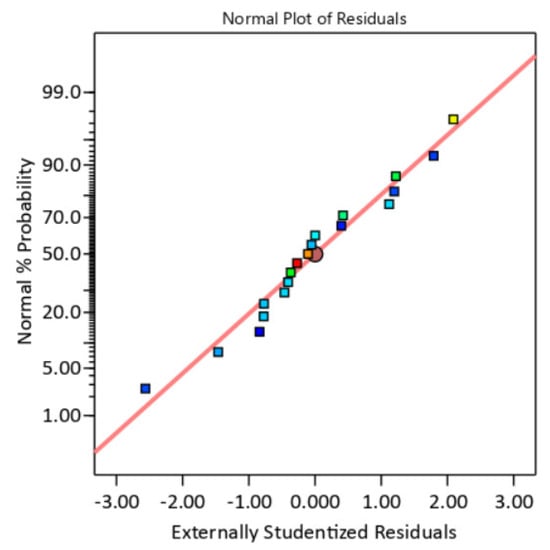
Figure 4.
Normality plot of Sa residuals.
Table 5 presents the reduced ANOVA table of Sa. It is worth mentioning that the “Lack of Fit” p-value (0.05258) shown in Table 5 is greater than 0.05, indicating that the lack of fit is not significant and confirming the adequacy of the developed model. Table 5 shows that all considered factors, including v, f, and d, showed a significant effect on the Sa of the machined surfaces. It, also indicates that feed rate is the most significant milling parameter influencing the Sa, accounting for 47.63% of the total variation. Along with the main effects, the interaction (v and f) and quadratic terms (v2 and d2) were found to have a significant contribution to the Sa (30.14%), indicating the high contribution of v and d on the Sa. The directional influence of the machining parameters, including v, f, and d, on the Sa is shown in Figure 5. It is evident from Figure 5 that the minimum Sa is obtained at medium cutting velocity between 50 m/min and 200 m/min. The effect of feed rate on Sa is directly proportional, meaning that Sa increases as feed rate increases. Regarding the depth of the cut, Figure 5 illustrates that Sa initially rises with an increase in depth of cut to reach its maximum value, after which it slightly declines with further increases in depth of cut. Figure 6 shows the influence of the interaction between cutting velocity and feed rate.

Table 5.
Reduced ANOVA table for the response variable Sa.
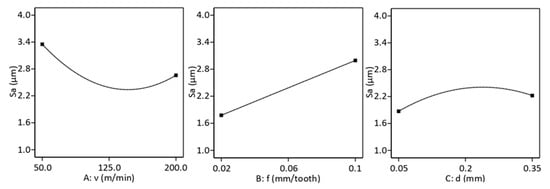
Figure 5.
Main effects plot based on ANOVA analysis.
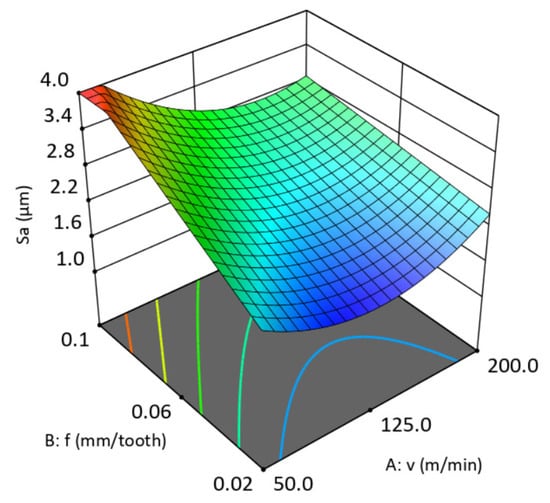
Figure 6.
Cutting velocity and feed rate interaction plot.
3.3. Prediction Modeling
The regression model to predict the surface roughness of the machined surfaces considering v, f, and d milling parameters was developed based on the reduced quadratic model illustrated in the ANOVA table (Table 5). The prediction model is presented in Equation (1). Figure 7 shows the experimental and predicted results of Sa based on the 19 RSM experiments, illustrating good agreement between the experimental and predicted values. The predicted model presented in Equation (1) is limited for predicting the Sa within the considered levels of v, f, and d.
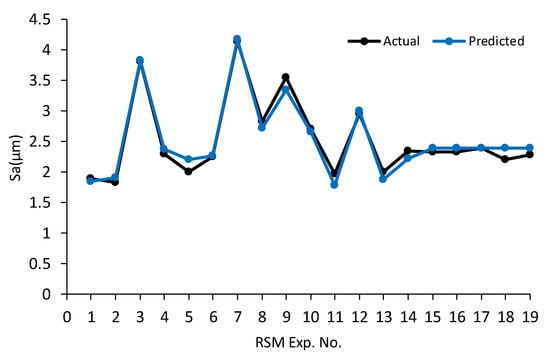
Figure 7.
Experimental (actual) and predicted Sa of the 19 RSM runs.
3.4. Optimization
Selecting the best settings of v, f, and d that minimizing the Sa was performed using desirability approach. The optimal settings of the v, f, and d are reported in Table 6 based on the desirability approach. The optimal settings were validated through two-pass machining. The validated experiments were found to closely match the predicted results, with a 1.95% error between the predicted and experimental values, see Table 6.

Table 6.
Optimal settings of milling parameters.
3.5. Discussions
As-built samples showed rougher surfaces (Sa is 7.982 µm) with visible surface defects, including track lines, surface irregularities, and voids. The surface roughness of the machined surfaces showed enhancements in Sa as it reduced from 7.982 µm to 1.834 µm (Exp. # 2). Results presented in Table 3 showed that the Sa of machined surface varied substantially, ranging from 1.834 µm (Exp. # 2) to 4.146 µm (Exp. # 7), with a range of 2.312 µm due to the variations in the considered factors (v, f, d). This highlights the need to analyze these milling parameters and carefully select their settings to improve surface quality.
Figure 8 shows the 3D scanned images of the machined surfaces of RSM experiments #1–#4, as listed in Table 3, while Figure 9 shows the optical surface morphology of the same experiments. At low feed rate (0.02 mm/tooth), the machined surfaces seemed smooth with the presence of tool marks at both low cutting velocity (50 m/min) as in Figure 8a and Figure 9a and high cutting velocity (200 m/min) as in Figure 8b and Figure 9b, with no detectable deposited filaments. In other words, ridges along the deposited filaments, which were printed at a raster direction of 45°, were not obvious. However, at higher feed rates (0.1 mm/tooth), the machined surfaces at low and high cutting velocities are significantly varied. At higher feed rates (0.1 mm/tooth) and lower cutting velocity (50 m/min), the ridges along the deposited filaments and 3D-printed defects, such as voids (circled in yellow) and deposited/track lines (highlighted in red), are obviously suggesting a brittle removal mechanism, as shown in Figure 8c and Figure 9c, leading to higher Sa. This finding aligns with [16], which reported that a higher feed rate tends to deteriorate the machined surface. Furthermore, apparent gaps and cavities between the deposited filaments were obvious. This could be attributed to the incomplete removal and the absence of the smearing effect at higher feed rate [16]. It should be noted that these defects which are associated with the employing low feed rate are less visible at high cutting velocity (200 m/min) as shown in Figure 8d and Figure 9d. These findings are aligned with the statistical analysis that showed that the interaction between cutting velocity and feed rate is significant with 14.59% contribution, which is also depicted in Figure 6.
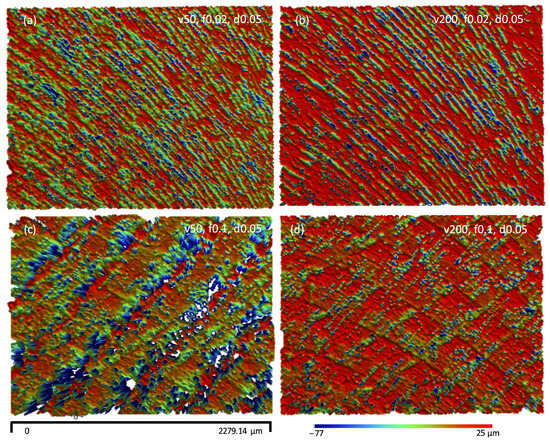
Figure 8.
3D-scanned surface morphology of the experiments: (a) Exp. 1, (b) Exp. 2, (c) Exp. 3, (d) Exp. 4.
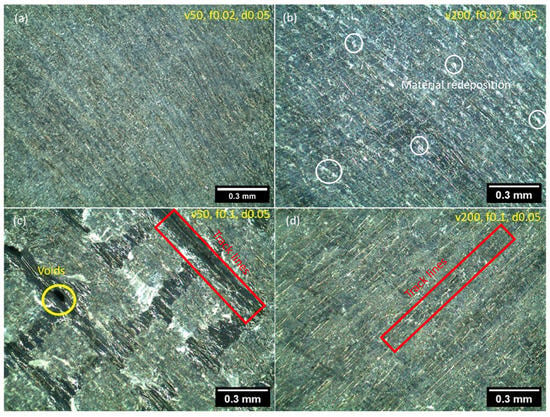
Figure 9.
Optical surface morphology of the experiments: (a) Exp. 1, (b) Exp. 2, (c) Exp. 3, (d) Exp. 4.
According to the statistical analysis discussed earlier, v, f, and d have significant influence on Sa with feed rate as the most significant factor that influences the Sa machined surfaces. Based on the main effect plots depicted in Figure 5, at low cutting velocities, Sa is high and then decreases as the cutting velocity increases. However, further increases in cutting velocity leads to a rise in Sa. This behavior can be attributed to the fact that as cutting velocity increases, the temperature in the cutting zone becomes high leading to softening the PLA-CF composite and covering MEX-printed defects, such as voids and track lines, through material smearing/side flow effect associated with the ductile machining. However, excessively high cutting velocities can generate excessive temperatures, resulting in built-up edges and redeposition of the already cut material on the machined surface. This effect can be seen by comparing the 3D contours of the machined surfaces at lower (e.g., Figure 8a,c) and higher (e.g., Figure 8b,d) cutting speeds. At higher cutting speeds, the dominance of red color (higher level material) between the adjacent feed marks represents the aggressive material site flow and smearing effects, leading to higher surface roughness. Similarly in the optical micrographs, there is a dominance of redeposited materials (e.g., chips), circled in white in Figure 9b, at higher cutting speeds, which contribute to higher surface roughness. The main effect plots also showed that increasing feed rate leads to higher Sa. A higher feed rate increases the chip thickness per revolution, promoting a brittle machining mechanism that produces higher surface roughness due to surface irregularities and the exposure of MEX-printed defects. At higher feed rate of (0.1 mm/tooth), the gap between the feed marks increases and the material side flow remains unable to cover the 3D-printed defects, as shown in Figure 8c and Figure 9c. However, as the cutting speed increase to 200 m/min, excessive temperatures cause material side flow and smearing, which cover most of the 3D-printed defects, as can be observed in (Figure 8d and Figure 9d). Similarly, increasing the depth of cut removes more material, which can create more irregularities on the machined surface.
4. Conclusions
This work was conducted on the post-processing milling of MEX-printed PLA-CFs polymer composites to enhance their surface roughness. The results highlighted the impact of milling parameters, such as cutting velocity, feed rate, and depth of cut, on surface roughness. The following conclusions were drawn from this study:
- The surface roughness of the as-built MEX-printed sample is high (~7.982 µm), indicating the need for post-processing.
- The Sa values of the machined surfaces varied substantially, ranging from 1.834 µm to 4.146 µm, with a range of 2.312 µm due to the variations in the considered factors (v, f, and d).
- Statistical analysis revealed that cutting velocity, feed rate, and depth of cut exhibited significant influence on the average surface roughness, Sa, with feed rate being the most significant one contributing to 47.63% of the total variation in Sa.
- Increasing feed rate leads to the emergence of cavities and ridges along the deposited filaments, resulting in higher surface roughness.
- The interaction between cutting velocity and feed rate, as well as the quadratic effect of cutting velocity and cutting depth, contributes significantly to Sa, accounting for 30.14% of the total variation.
- According to the desirability approach, the lowest Sa (1.621 µm) is obtained at a cutting velocity of 163 m/min, a feed rate of 0.03 mm/tooth, and a depth of cut of 0.058 mm.
This work offers an exploratory framework for evaluating the influence of cutting velocity, depth of cut, and feed during polymer composite milling. Further experiments under MQL and dry machining conditions, supported by thermo-mechanical analysis, are recommended to enhance understanding of the process.
Funding
This research was funded by Ongoing Research Funding program, (ORF-2025-256), King Saud University, Riyadh, Saudi Arabia.
Data Availability Statement
The original contributions presented in this study are included in the article. Further inquiries can be directed to the corresponding author.
Acknowledgments
The author is thankful for the support from Ongoing Research Funding program, (ORF-2025-256), King Saud University, Riyadh, Saudi Arabia.
Conflicts of Interest
The author declares no conflicts of interest.
References
- Liu, Z.; Wang, Y.; Wu, B.; Cui, C.; Guo, Y.; Yan, C. A Critical Review of Fused Deposition Modeling 3D Printing Technology in Manufacturing Polylactic Acid Parts. Int. J. Adv. Manuf. Technol. 2019, 102, 2877–2889. [Google Scholar] [CrossRef]
- Saran, O.S.; Reddy, A.P.; Chaturya, L.; Kumar, M.P. 3D Printing of Composite Materials: A Short Review. Mater. Today Proc. 2022, 64, 615–619. [Google Scholar] [CrossRef]
- Saleh, M.; Anwar, S.; Al-Ahmari, A.M.; AlFaify, A.Y. Prediction of Mechanical Properties for Carbon Fiber/PLA Composite Lattice Structures Using Mathematical and ANFIS Models. Polymers 2023, 15, 1720. [Google Scholar] [CrossRef] [PubMed]
- Saleh, M.; Anwar, S.; AlFaify, A.Y.; Al-Ahmari, A.M.; Abd Elaty, E. Development of PLA/Recycled-Desized Carbon Fiber Composites for 3D Printing: Thermal, Mechanical, and Morphological Analyses. J. Mater. Res. Technol. 2024, 29, 2768–2780. [Google Scholar] [CrossRef]
- Ferreira, I.; Madureira, R.; Villa, S.; de Jesus, A.; Machado, M.; Alves, J.L. Machinability of PA12 and Short Fibre–Reinforced PA12 Materials Produced by Fused Filament Fabrication. Int. J. Adv. Manuf. Technol. 2020, 107, 885–903. [Google Scholar] [CrossRef]
- Dabwan, A.; Anwar, S.; Al-Samhan, A. Effects of Milling Process Parameters on Cutting Forces and Surface Roughness When Finishing Ti6al4v Produced by Electron Beam Melting. Int. J. Mech. Mater. Eng 2020, 14, 324–328. [Google Scholar]
- Vallejo, J.; García-Plaza, E.; Núñez, P.J.; Chacón, J.M.; Caminero, M.A.; Romero, A. Machinability Analysis of Carbon Fibre Reinforced PET-Glycol Composites Processed by Additive Manufacturing. Compos. Part A Appl. Sci. Manuf. 2023, 172, 107561. [Google Scholar] [CrossRef]
- Cozzolino, E.; Astarita, A. Wet and Dry Turning of Ti6Al4V EBM Parts: Implications on the Life Cycle Assessment and Surface Roughness. Mater. Manuf. Process. 2025, 40, 1621–1633. [Google Scholar] [CrossRef]
- Tzotzis, A.; Nedelcu, D.; Mazurchevici, S.-N.; Kyratsis, P. Investigating the Machining Behavior of the Additively Manufactured Polymer-Based Composite Using Adaptive Neuro-Fuzzy Learning. Appl. Sci. 2025, 15, 5373. [Google Scholar] [CrossRef]
- Festas, A.J.; Ramos, A.; Davim, J.P. Machining of a Functional Hip Prosthesis Cone in TI-6AL-4V ELI Titanium Alloy Produced by Electron Beam Melting. J. Braz. Soc. Mech. Sci. Eng. 2024, 46, 182. [Google Scholar] [CrossRef]
- Pal, S.; Velay, X.; Saleem, W.; Rathore, M.F. Investigating the Anisotropic Effects on Machining Behavior and Performance of As-Built Selective Laser Melting Processed Ti6Al4V Alloy. Prog. Addit. Manuf. 2025, 10, 7141–7153. [Google Scholar] [CrossRef]
- Ross, N.S.; Mashinini, P.M.; Mishra, P.; Ananth, M.B.J.; Mustafa, S.M.; Gupta, M.K.; Korkmaz, M.E.; Nag, A. Enhancing Surface Quality and Tool Life in SLM-Machined Components with Dual-MQL Approach. J. Mater. Res. Technol. 2024, 31, 1837–1852. [Google Scholar] [CrossRef]
- Kim, Y.J.; Kim, H.N. A Study on Effects of Curing and Machining Conditions in Post-Processing of SLA Additive Manufactured Polymer. J. Manuf. Process. 2024, 119, 511–519. [Google Scholar] [CrossRef]
- Lalegani Dezaki, M.; Mohd Ariffin, M.K.A. Post-Processing of FDM 3D-Printed Polylactic Acid Parts by CNC Trimming. In Fused Deposition Modeling Based 3D Printing; Springer: Cham, Switzerland, 2021; pp. 195–212. [Google Scholar]
- Zhou, H.; Cheng, X.; Jiang, X.; Zheng, G.; Zhang, J.; Li, Y.; Tang, M.; Lv, F. Green Manufacturing-Oriented Polyetheretherketone Additive Manufacturing and Dry Milling Post-Processing Process Research. Processes 2022, 10, 2561. [Google Scholar] [CrossRef]
- Guo, C.; Liu, X.; Liu, G. Surface Finishing of Fdm-Fabricated Amorphous Polyetheretherketone and Its Carbon-Fiber-Reinforced Composite by Dry Milling. Polymers 2021, 13, 2175. [Google Scholar] [CrossRef] [PubMed]
- Arnés-Urgellés, P.; Bayas, J.; Ramírez, E.A.; Maldonado, F.; Helguero, C.G.; Amaya, J.L. Machinability Study of Polymeric Parts Fabricated by Additive Manufacturing under a Dry Milling Process. In Materials Design and Applications III; Springer: Cham, Switzerland, 2021; pp. 139–148. [Google Scholar]
- El Mehtedi, M.; Buonadonna, P.; Carta, M.; El Mohtadi, R.; Marongiu, G.; Loi, G.; Aymerich, F. Effects of Milling Parameters on Roughness and Burr Formation in 3D-Printed PLA Components. Procedia Comput. Sci. 2023, 217, 1560–1569. [Google Scholar] [CrossRef]
- Cococcetta, N.M.; Pearl, D.; Jahan, M.P.; Ma, J. Investigating Surface Finish, Burr Formation, and Tool Wear during Machining of 3D Printed Carbon Fiber Reinforced Polymer Composite. J. Manuf. Process. 2020, 56, 1304–1316. [Google Scholar] [CrossRef]
- Cococcetta, N.; Jahan, M.P.; Schoop, J.; Ma, J.; Pearl, D.; Hassan, M. Post-Processing of 3D Printed Thermoplastic CFRP Composites Using Cryogenic Machining. J. Manuf. Process. 2021, 68, 332–346. [Google Scholar] [CrossRef]
- El Mehtedi, M.; Buonadonna, P.; El Mohtadi, R.; Loi, G.; Aymerich, F.; Carta, M. Optimizing Milling Parameters for Enhanced Machinability of 3D-Printed Materials: An Analysis of PLA, PETG, and Carbon-Fiber-Reinforced PETG. J. Manuf. Mater. Process. 2024, 8, 131. [Google Scholar] [CrossRef]
- Ge, J.; Catalanotti, G.; Falzon, B.G.; Higgins, C.; McClory, C.; Thiebot, J.-A.; Zhang, L.; He, M.; Jin, Y.; Sun, D. Process Characteristics, Damage Mechanisms and Challenges in Machining of Fibre Reinforced Thermoplastic Polymer (FRTP) Composites: A Review. Compos. Part B Eng. 2024, 273, 111247. [Google Scholar] [CrossRef]
- Liu, J.; Huang, Q.; Wu, M.; Zou, Z.; Lin, Z.; Guo, Z.; He, J.; Chen, X. Electrochemical Discharge Grinding of Metal Matrix Composites Using Shaped Abrasive Tools Formed by Sintered Bronze/Diamond. Sci. Eng. Compos. Mater. 2020, 27, 346–358. [Google Scholar] [CrossRef]
- Materials. Available online: https://3dsunlu.com/pages/materials (accessed on 3 June 2025).
- Rodić, D.; Sekulić, M.; Savković, B.; Madić, M.; Trifunović, M. Integration of RSM and Machine Learning for Accurate Prediction of Surface Roughness in Laser Processing. Appl. Sci. 2025, 15, 7064. [Google Scholar] [CrossRef]
Disclaimer/Publisher’s Note: The statements, opinions and data contained in all publications are solely those of the individual author(s) and contributor(s) and not of MDPI and/or the editor(s). MDPI and/or the editor(s) disclaim responsibility for any injury to people or property resulting from any ideas, methods, instructions or products referred to in the content. |
© 2025 by the author. Licensee MDPI, Basel, Switzerland. This article is an open access article distributed under the terms and conditions of the Creative Commons Attribution (CC BY) license (https://creativecommons.org/licenses/by/4.0/).