Abstract
This study introduces a health-aware fuzzy logic (FL) energy management strategy (EMS) for fuel cell electric commercial vehicles (FCECVs) that aimed to improve energy efficiency and extending fuel cell system (FCS) lifespan. The FL-based EMS was developed using vehicle power demand and battery state of charge (SOC) as inputs, with the FCS power change rate as the output, aiming to mitigate degradation induced by abrupt load transitions. A multi-objective optimization framework was established to optimize the fuzzy logic controller (FLC) parameters, achieving a balanced trade-off between fuel economy and FCS longevity. The non-dominated sorting genetic algorithm-II (NSGA-II) was utilized for optimization across various driving cycles, with average Pareto-optimal solutions employed for real-time application. Performance evaluation under standard and stochastic driving cycles benchmarked the proposed strategy against dynamic programming (DP), charge-depletion charge-sustaining (CD-CS), conventional FL strategies, and a non-optimized baseline. Results demonstrated an approximately reduction in hydrogen consumption (HC) relative to CD-CS and over improvement in degradation mitigation, with performance superior to that of DP. Although the strategy exhibits an average increase in computation time compared to CD-CS, the average single-step computation time is only ms, confirming its practical feasibility for real-time applications.
1. Introduction
The ongoing transformation of the transportation sector toward sustainable energy systems has positioned fuel cell electric commercial vehicles (FCECVs) as an up-and-coming zero-emission solution, particularly for long-haul and heavy-duty applications []. Their high energy density and rapid refueling capability offer distinct advantages over battery electric vehicles (BEVs) regarding operational flexibility and driving range, enabling prolonged missions with minimal downtime []. However, the widespread adoption of FCECVs continues to face significant technical and economic barriers, among which energy management is widely acknowledged as one of the critical technological bottlenecks []. The fuel cell system (FCS), serving as the primary power source and one of the most expensive components within the powertrain, is particularly susceptible to performance degradation under real-world operating conditions—such as frequent load cycling, transient power demands, and suboptimal thermal and humidity control []. Consequently, developing an effective energy management strategy (EMS) capable of simultaneously optimizing hydrogen consumption (HC) and proactively mitigating FCS degradation has become imperative for improving economic performance and operational reliability in practical deployment scenarios [].
Rule-based strategies currently represent the most widely implemented approach for energy management in commercial applications, owing to their practical implementation advantages []. The fundamental concept involves translating engineering expertise into predefined control logic []. These strategies typically employ state-machine architectures or threshold-based control mechanisms, with power distribution decisions determined by real-time vehicle power demand and battery state of charge (SOC). Representative implementations include thermostat control, power-following strategies, and various hybrid formulations []. The principal advantages of these strategies lie in their simplicity of implementation, low computational overhead, and proven reliability, which have contributed to their widespread adoption in first-generation fuel cell electric vehicles (FCEVs) []. However, their inherent limitations include a fixed logical structure that lacks adaptability to dynamic driving conditions and an inability to effectively incorporate component health monitoring and degradation mitigation into the control framework [].
Global optimization methods, particularly Dynamic Programming (DP) and Pontryagin’s Minimum Principle (PMP), provide theoretically optimal solutions for energy management in FCEVs []. By applying the Bellman principle of optimality, DP decomposes multi-stage decision processes into recursive sub-problems, enabling systematic time-domain optimization. When complete driving cycle information is available, DP and PMP can accurately determine globally optimal control trajectories [,]. In the context of FCEVs, these methods typically formulate the optimization objective as a weighted sum of HC and FCS degradation costs, subject to dynamic system constraints and operational boundaries. Studies have demonstrated that DP- and PMP-based approaches can effectively identify high-efficiency operating regions of the fuel cell, offering valuable insights for calibrating rule-based strategies [,]. However, global optimization methods face significant practical limitations. The “curse of dimensionality” severely constrains their applicability in systems with high-dimensional state spaces, leading to exponential growth in computational complexity. Moreover, their reliance on prior knowledge of future driving conditions hinders real-time implementation, restricting their use to offline applications. These methods are also susceptible to model accuracy; performance degradation may occur under model uncertainty or parameter mismatch conditions. As a result, DP and PMP are primarily employed as benchmarks to evaluate the theoretical performance limits of alternative EMSs in research and development settings [].
Model predictive control (MPC) achieves real-time control performance approaching the theoretical optimum through a rolling-horizon optimization framework combined with feedback correction mechanisms []. In FCEVs’ energy management applications, MPC provides three distinct advantages: proactive strategy adaptation through incorporation of preview information—including navigation data and traffic flow predictions; guaranteed operational safety via systematic enforcement of system constraints across the prediction horizon; and robust disturbance rejection and model uncertainty compensation through closed-loop feedback correction [,]. The application of MPC in FCEVs has been progressively refined in recent years. Ref. [] developed a hierarchical MPC-based EMS for FCEVs, integrating wavelet transform and neural network prediction. This method maintained robust control performance while enhancing operational economy, reducing HC by 2.37% and operating costs by 3.52%. In a complementary study, Ref. [] proposed a health-aware predictive strategy for multi-stack FCEVs using a two-layer framework: a rule-based supervisor dynamically manages fuel cell activation. At the same time, an MPC layer with a novel speed predictor optimizes power distribution. The approach ensures real-time capability, significantly lowers operating costs, and delivers near-global optimal performance, surpassing equivalent consumption minimization strategies. Despite these advancements, MPC still faces considerable challenges. The accuracy of the prediction model critically influences control performance; however, high-fidelity models often increase computational complexity, complicating real-time implementation on embedded platforms []. Furthermore, in multi-objective optimization scenarios, expanding decision variables and constraints leads to rapid growth in problem scale, imposing significant demands on onboard computational resources and hindering deployment in resource-constrained environments [].
Machine learning methods, particularly reinforcement learning (RL), provide a fundamentally distinct approach to energy management in FCEVs []. Unlike model-based strategies, RL autonomously learns optimal control policies through direct interaction with the environment, eliminating the reliance on precise analytical system dynamics models []. Deep reinforcement learning (DRL) further enhances this capability by integrating deep neural networks with RL, effectively handling high-dimensional state spaces and facilitating autonomous feature extraction from raw input data. Within the FCEV’s energy management domain, DRL has demonstrated considerable promise. For instance, the deep Q-network (DQN) supports intelligent decision-making by approximating the action-value function in discrete action spaces []. In contrast, algorithms such as the deep deterministic policy gradient (DDPG) excel in continuous control tasks, allowing for the smooth and precise regulation of fuel cell power output []. Ref. [] proposed a heterogeneous deep transfer reinforcement learning strategy for FCEV energy management. By transferring knowledge across different vehicle types and learning tasks, this approach achieves a 90.28% improvement in training efficiency, alongside a 7.93% reduction in HC and 63.21% suppression of fuel cell degradation. Moreover, the strategy requires only 1.26 ms per control step, underscoring its excellent real-time performance. Subsequent studies have further strengthened the generalization capacity of DRL under diverse operating conditions, with advanced architectures exhibiting robust adaptability across varying driving scenarios []. Despite these advances, machine learning-based approaches still face several fundamental challenges. Training typically demands substantial computational resources and large volumes of interaction data, which may hinder scalability and prolong development cycles []. In addition, the “black-box” nature of the learned policies complicates safety verification and regulatory certification—a critical concern in automotive applications []. These strategies are also susceptible to the distribution of training data. They may suffer from performance degradation in real-world environments that differ from training conditions, raising important questions regarding their reliability in practical deployment [].
In practical applications, EMSs for FCECVs must effectively balance control complexity, computational efficiency, and energy-saving performance. Although MPC and machine learning-based methods have demonstrated significant potential, their industrial applicability is often constrained by the requirement for extensive datasets and meticulous calibration. In contrast, rule-based strategies—particularly fuzzy logic control (FLC)—exhibit strong competitiveness due to their computational simplicity, operational reliability, and interpretability, making them well-suited for real-time implementation [,]. By leveraging predefined rule bases and membership functions (MFs), FLC enables smooth parameter adaptation and maintains robust performance under system uncertainties and varying operating conditions. A growing body of research has focused on enhancing FLC performance through evolutionary optimization techniques. In [], an improved genetic algorithm was applied to perform multi-objective optimization of an FLC for a hybrid energy storage system, achieving a balanced trade-off between energy efficiency and component service life. Ref. [] employed a particle swarm optimization algorithm to optimize fuzzy rule weights, effectively reducing battery power fluctuations. In [], a multi-objective genetic algorithm was implemented to simultaneously optimize fuel cell power distribution and transmission shift scheduling, thereby realizing vehicle-level energy management optimization. Despite previous studies showing the promise of using evolutionary-optimized FLC for energy management in FCEVs, several significant gaps still need to be addressed. First, current FLC optimizations mainly focus on enhancing energy efficiency without explicitly considering FCS degradation as a key objective. Second, while some research includes health-aware components, many do not simultaneously utilize a comprehensive degradation model that considers multiple operational stressors—namely high-power operation, low-power operation, and load transients—within the optimization framework. Third, traditional methods typically optimize FLC parameters for specific driving cycles, which may restrict their applicability to various real-world operating conditions. This paper proposes a novel health-aware FL-based EMS for FCECVs, embedded within a multi-objective optimization framework to bridge this gap. The proposed approach integrates the interpretability and computational efficiency of FLC with the global search capability of evolutionary algorithms, aiming to reconcile the inherently conflicting objectives of the hydrogen economy and FCS longevity under real-world driving conditions.
The main contributions of this work are summarized as follows: (1) A specialized FLC is designed, in which FCS health is explicitly incorporated by directly regulating the rate of change in FCS power output to effectively suppress degradation-inducing load transients while maintaining responsiveness to power demands. (2) A comprehensive multi-objective optimization problem is formulated, in which both HC and quantifiable FCS degradation metrics—derived from established electrochemical and mechanical degradation models—are simultaneously minimized. (3) The non-dominated sorting genetic algorithm-II (NSGA-II) optimizes FLC parameters across multiple representative driving cycles, ensuring robustness and generalizability beyond specific operating conditions. (4) Extensive experimental validation is conducted under both standard and stochastic driving cycles, demonstrating consistent performance advantages over conventional energy economy and FCS lifespan extension strategies.
The remainder of this paper is organized as follows: Section 2 provides a comprehensive overview of the investigated FCECV models. Section 3 presents the methodology, including the formulation of the health-aware FL-based EMS, the development of the multi-objective optimization framework, and the implementation details of the NSGA-II algorithm. Section 4 presents the experimental results and comparative analyses against benchmark strategies. Finally, Section 5 concludes the paper and outlines potential directions for future research.
2. System Modeling
This section presents a comprehensive overview of the FCECV’s powertrain system, encompassing the FCS, power battery, and electric motors. Additionally, the vehicle’s dynamic and FCS degradation models are elaborated upon.
2.1. Vehicle Powertrain Model
The schematic diagram of the studied FCECV’s powertrain is illustrated in Figure 1. The FCS serves as the primary energy source, supplying the power required by the electric motor. A DC/DC converter is utilized to regulate the output voltage of the FCS to the desired level. Concurrently, the integrated battery is directly connected to the motor control unit (MCU) to meet high load demands during transient high-power events or load fluctuations and capture regenerative braking energy. Additionally, the battery can be charged through a plug-in connection to the power grid. To enhance the motor’s output torque while improving its operational efficiency, the powertrain is equipped with an automated manual transmission (AMT).
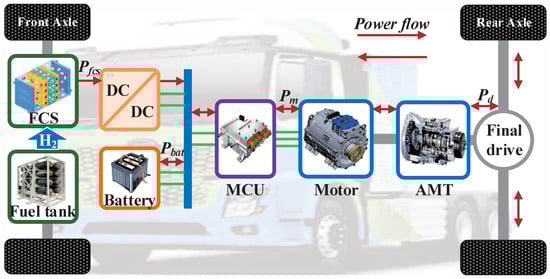
Figure 1.
Schematic of the studied FCECV’s powertrain.
Given that this study focuses on the EMS, the lateral dynamic model of the vehicle has been omitted. The relationship between the vehicle’s power demand () and velocity can be mathematically formulated. Meanwhile, the corresponding power demand at the motor input () is required to be supplied by the FCS and the battery. The formulated expression is presented in Equation (1), whereas the efficiency loss of the MCU is disregarded.
where m and u denote the vehicle’s mass and velocity, respectively, while f is the rolling friction coefficient. , , and denote the aerodynamic drag coefficient, the ambient air density, and the vehicle’s frontal surface area, respectively. represents the correction coefficient of the rotating mass. In addition, and are the output power of the FCS and battery, respectively, while , , and are the efficiency of the AMT, motor, and DC/DC converter. The sign function denotes a mathematical function. It should be noted that this function can yield a positive or negative value depending on , which corresponds to the motor operating in either the driving mode or the energy recovery mode. g and denote the gravitational acceleration and road slope, which are assigned values of 9.81 m·s−2 and zero, respectively.
In this work, proton exchange membrane fuel cells (PEMFCs) were utilized as the primary power source for the FCECV. The manufacturer carefully determined the size configuration of the onboard FCS and battery pack, selecting a PEMFC with a rated power of 120 kW and a battery with a rated capacity of 100 A·h. The specific powertrain system parameters of the FCECV under investigation are presented in Table 1.

Table 1.
Powertrain parameters of the studied FCECV.
2.2. FCS Model
The FCS comprises multiple fuel cell units that generate electricity through electrochemical reactions. Accurate modeling presents significant challenges due to the complexity of its operational principle. Accordingly, this study employs a quasi-static fuel cell efficiency model to achieve a balance between modeling accuracy and computational efficiency. As illustrated in Figure 2a, the efficiency of this model is directly dependent on the output power of the FCS. The FCS model is constructed based on interpolated experimental data obtained from real bench tests conducted by the manufacturer. Subsequently, the investigated FCS’s HC rate, serving as a key indicator for evaluating the vehicle’s energy efficiency, can be calculated using the following equation.
where denotes the HC rate of the FCS (g·s−1), represents the efficiency of FCS (%) and represents the low heating value of hydrogen ( J·g−1).
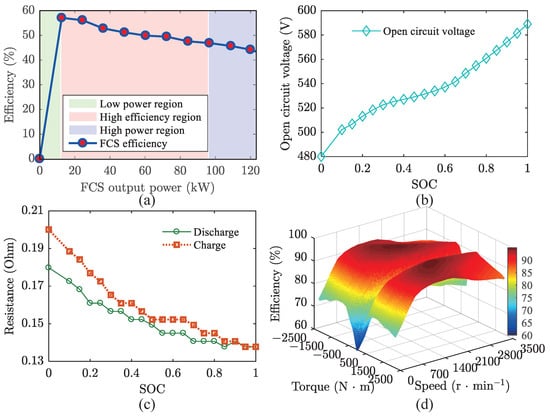
Figure 2.
Model of the studied FCECV. (a) FCS efficiency; (b) Open circuit voltage of the battery; (c) Resistance of the battery; (d) Motor efficiency.
The EMS governs the distribution of power among the components within the hybrid system of FCECVs, directly impacting the operational profile of the FCS. This essential control function significantly influences the degradation rate of the FCS and, consequently, its service longevity. To quantify FCS degradation, researchers have identified four key operational conditions that notably accelerate PEMFC performance deterioration: start/stop cycling, high-power operation, low-power operation, and load transients []. Among these, start/stop cycling has been found to be especially harmful to FCS longevity. In this work, the FCS is maintained in a continuous operational mode to isolate and systematically assess both the individual and combined impacts of the remaining three degradation factors. This focuses the analysis on power smoothing during sustained operation and ensures comparable results across strategies by maintaining consistent conditions. Although start/stop cycling is an important degradation mechanism, excluding it provides a clearer basis for evaluating operational degradation management. The derived empirical degradation model for the FCS is expressed as follows:
where denotes the degradation magnitude of the FCS (%). , , and correspond to the FCS degradation resulting from high-power operation, low-power operation, and load transients, respectively (%). and represent the duration times the FCS operated under high-power and low-power conditions, respectively (h). signifies the extent of load transients experienced by the FCS (kW·s−1). and denote the FCS’s high-power output threshold and the low-power output threshold (kW), respectively. The degradation coefficients (, , , ), as listed in Table 2, are derived from established experimental studies in the literature [,]. Specifically, represents the hourly voltage decay rate during high-power operation (≥80% of rated power), corresponds to the degradation rate under low-power conditions (<10% of rated power), and describes the instantaneous voltage drop per kilowatt during load transients. It should be noted that no independent experimental validation of this model’s accuracy was conducted specifically for the FCS in this study, and its prediction fidelity may vary with stack design and actual operating conditions. A 15% safety margin was incorporated into the degradation constraint during optimization to address the uncertainty associated with the FCS degradation model. Specifically, if the maximum acceptable degradation for the system is , the internal constraint enforced in the optimizer is tightened to .
Table 2.
The degradation coefficients.
2.3. Battery Model
The lithium-ion battery pack serves as a complementary power source in this study, supporting the FCS during high-power demand scenarios and facilitating the capture of regenerative energy during braking phases. For energy management applications, the battery’s dynamic response and operational characteristics are typically modeled using an equivalent circuit approach, consisting of an internal resistance in series with an open-circuit voltage. The mathematical formulation of this model is expressed as follows:
where denotes the battery current (A), and represent the battery’s open-circuit voltage (V) and internal resistance (Ohm), respectively, and signifies the battery’s output power (kW). indicates the SOC variation, and denotes the battery’s nominal capacity, which is designed as 100 A·h. The battery’s internal resistance exhibits dynamic behavior during charging and discharging processes, with its variations being dependent on the battery’s SOC. The open-circuit voltage profile follows a similar pattern (refer to Figure 2b,c). These characteristics can be empirically derived through laboratory tests conducted under controlled cycling conditions.
2.4. Motor and AMT Model
The electric motor functions as the primary propulsion system in FCECVs, delivering tractive force during regular operation while facilitating regenerative energy recovery during deceleration. Considering the intricate electromagnetic properties of electric motors and their critical impact on the overall energy efficiency of FCECVs, this study adopts a quasi-static modeling approach that focuses exclusively on motor efficiency characteristics. The motor efficiency characteristics, as illustrated in Figure 2d, are derived from manufacturer specifications, with permissible torque () and rotational speed () operating within the ranges of [−2200, 2200] N·m and [0, 3400] r·min−1, respectively. The corresponding output power () is calculated using the following expression:
This study integrates a six-speed AMT into the FCECV to enhance output torque while minimizing motor size. The torque transmission characteristics of the AMT are defined by its input-output relationships, with the operational behavior mathematically described by the following formulation:
where and represent the input and output torque respectively, and and correspond to the input and output rotational speeds. The overall transmission performance is governed by the gear ratio and transmission efficiency .
3. Methodology
Traditional FL-based EMSs for FCHEVs typically utilize the vehicle’s instantaneous power demand and battery SOC as inputs to determine the output power of the FCS. However, it often neglects the rate of power change, leading to abrupt power variations that can adversely affect FCS longevity. To mitigate this issue, this study proposes a novel FL-based EMS that explicitly incorporates longevity considerations into the control strategy. Furthermore, to decrease dependence on expert knowledge in the design of the fuzzy system, a multi-objective optimization framework is introduced to automatically adjust the controller’s parameters and rules. As illustrated in Figure 3, the proposed methodology comprises three core components: (1) an FL-based controller designed for smooth power regulation of the FCS, (2) a multi-objective optimization framework incorporating both economic and FCS longevity objectives, and (3) the NSGA-II algorithm employed for automated parameter tuning. This integrated approach effectively addresses the limitations of conventional strategies in component health management, dynamic adaptability, and multi-objective optimization.
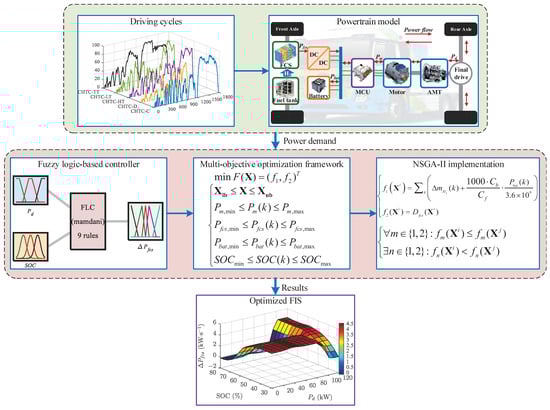
Figure 3.
Schematic framework of the proposed methodology.
3.1. FL-Based EMS for FCS Longevity
In this study, an FLC is designed to enhance the longevity of the FCS. The inputs to the FLC are defined as the vehicle power demand () and the battery SOC, while the output is specified as the variation in the FCS output power (). This design actively suppresses harmful power fluctuations by smoothly regulating the FCS power trajectory. The control strategy is mathematically expressed as:
where represents the discrete time step of the control system. Since the FCS does not operate during vehicle braking, the following operational ranges are defined: power demand ranges from 0 to 120 kW, battery SOC varies between and , and the variation rate of FCS output power is constrained to the interval kW·s−1. To ensure numerical stability and uniform processing, these variables are normalized into a unified discourse universe using the following linear transformations:
Here, represents the normalized power demand, where and correspond to the vehicle’s minimum and maximum power demand, respectively. is the normalized battery SOC, bounded by and . denotes the normalized control output, limited by and , which indicate the minimum and maximum allowable rates of change in FCS power output.
The MFs are systematically designed according to the operational characteristics and physical constraints of each variable. To simplify the FLC structure, the power demand is partitioned into three fuzzy subsets: Small (S), Medium (M), and Large (L). Similarly, the battery SOC is categorized into three fuzzy subsets: Low (L), Medium (M), and High (H). Due to its computational efficiency and intuitive interpretability, a trapezoidal MF is adopted for power demand. In contrast, a Gaussian MF is used for battery SOC to leverage its smooth transitions and continuous differentiability, which are particularly advantageous for capturing acceptable variations near typical operating points. The MF for power demand is defined as:
where , , , and represent the abscissa of the left foot point, left shoulder point, right shoulder point, and right foot point, respectively. At these points, the membership degree increases from 0, reaches a maximum of 1, then decreases to 0. The index corresponds to the three linguistic terms (S, M, L).
The MF for battery SOC is given by:
where represents the center value where the membership degree achieves its maximum value of 1, and represents the standard deviation, controlling the width (spread) of the MF. The index corresponds to the three fuzzy subsets (L, M, H).
Since the FCS output power can either increase or decrease, its rate of change is partitioned into five fuzzy subsets: Negative Large (NL), Negative Small (NS), Zero (Z), Positive Small (PS), and Positive Large (PL). A triangular MF represents these output fuzzy sets, offering a favorable balance between implementation simplicity and functional performance. The corresponding MF is formulated as:
Here, indicates the abscissa of the left foot point (membership degree 0), the abscissa of the peak point (membership degree 1), and the abscissa of the right foot point (membership degree 0). The index corresponds to its five output subsets (NL, NS, Z, PS, PL). Figure 4 illustrates the MFs for power demand, battery SOC, and FCS output power variation, respectively.
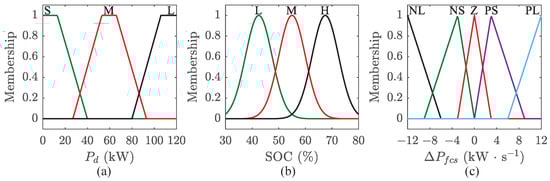
Figure 4.
Membership of the FLC. (a) Power demand; (b) Battery SOC; (c) Variation of the FCS output power.
The Mamdani inference method is utilized to define the fuzzy control rules. With two input variables—each divided into three fuzzy subsets—a total of control rules are generated based on all possible combinations. When the vehicle has low power demand and high battery SOC, it operates primarily in battery-powered mode. In this case, the FLC outputs a negative power variation to gradually reduce the FCS output to zero. Conversely, the vehicle runs mainly in FCS-driven mode when power demand is high and battery SOC is low. The FLC generates a positive power variation to increase FCS output toward its maximum allowable limit. The fuzzy control rules are formally defined as follows: If the power demand is small and the battery SOC is high, then the FLC generates a significant adverse change in the FCS output power. A high SOC enables FCS power reduction to zero, promoting pure electric operation. If power demand is large and battery SOC is low, then the FLC produces a significant positive change in FCS output power. High power demand and low SOC necessitate a rapid FCS power increase to support the load and recharge the battery. If power demand is medium and battery SOC is medium, then FCS output power remains unchanged to avoid unnecessary transients. The complete fuzzy rule base is summarized in Table 3.
Table 3.
Fuzzy logic control rules.
The centroid defuzzification method transforms fuzzy inference results into a precise numerical output. This defines a functional relationship between the FCS power variation rate and the two input variables, as illustrated by the response surface in Figure 5.
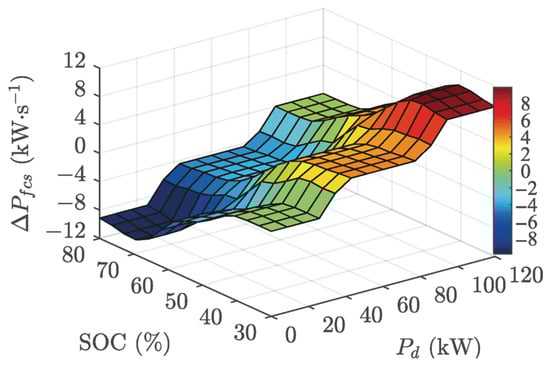
Figure 5.
The response surface of the FLC.
3.2. Multi-Objective Optimization Framework
Conventional FLCs rely heavily on expert knowledge to design MFs and rule bases. However, in real-world operating environments, external disturbances—such as abrupt driving conditions—often lead to performance degradation or even system instability. As illustrated in Figure 6, the proposed health-aware FL-based EMS requires the configuration of 19 parameters for input and output MFs, in addition to the formulation of 9 distinct fuzzy rules. Manually tuning many parameters and rules is methodologically challenging and prone to yielding suboptimal control performance. To address this limitation, this study introduces a multi-objective optimization framework that can automatically optimize both the parameters and the rule base, thereby substantially improving the energy efficiency and operational longevity of FCECVs.
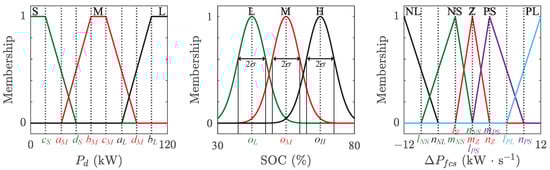
Figure 6.
The parameters of the FLC.
A key contribution of this work lies in developing a systematic multi-objective optimization framework that explicitly addresses the inherent trade-off between economic performance and FCS longevity in FCECV energy management. Recognizing that an effective EMS must simultaneously minimize HC and mitigate FCS degradation, the optimization problem for the health-aware FL-based EMS is formally stated as:
where represents the decision vector comprising 19 parameters derived from the MF parameters and rule base. Here, represents the economic objective function, and represents the FCS longevity objective function.
The economic objective is defined as the total operational cost over a driving cycle, incorporating both HC and battery energy usage:
where and denote the unit costs of hydrogen fuel (CNY kg−1) and battery energy (CNY kW·h−1), respectively.
The FCS longevity objective is quantified as the total degradation of the FCS over the driving cycle, computed using the empirical degradation model established in Equation (3):
Furthermore, the optimization is subject to stringent constraints that ensure the optimized FLC parameters enhance system performance and comply with safety, reliability, and physical feasibility requirements under real-world operating conditions. These constraints are expressed as:
where and represent the lower and upper bounds of the optimization variables, ensuring all parameters remain within physically plausible and logically consistent ranges. , , and denote the output power of the motor, FCS, and battery at time step k, respectively. Each of these power components is subject to corresponding minimum and maximum limits, defined as , , and , respectively. represents the battery’s SOC at each time step k, where and are the predefined lower and upper bounds established to prevent over-discharge and over-charge, thereby safeguarding battery health and ensuring safe operational conditions.
3.3. NSGA-II Implementation
This study employs the NSGA-II to solve the multi-objective optimization problem formulated in Section 3.2. The selection of NSGA-II is justified by its theoretical advantages in handling non-convex Pareto fronts and its ability to maintain population diversity without requiring a priori weight assignments []. These features make it particularly suitable for optimizing the conflicting objectives of economic efficiency and FCS longevity in FCECVs. NSGA-II operates according to three fundamental principles: (1) fast non-dominated sorting, which ranks solutions based on Pareto dominance; (2) crowding distance computation, which enhances solution diversity across the Pareto front; and (3) elitist selection, which ensures the preservation of high-quality solutions throughout successive generations. Notably, the algorithm does not require the pre-weighting of objectives, thereby eliminating subjective bias and enabling an unbiased exploration of the trade-off between HC cost () and FCS degradation (). Figure 7 illustrates the overall optimization framework, highlighting the integration of the FLC simulation within the evolutionary loop and the key steps of non-dominated sorting and computation of crowding distance.
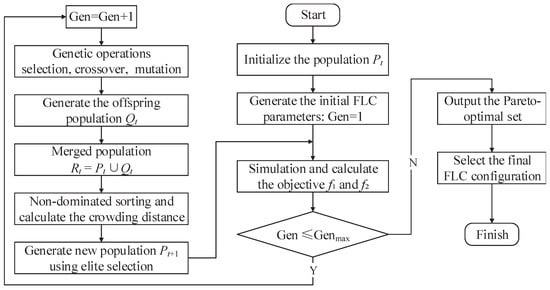
Figure 7.
Optimization process based on NSGA-II.
The optimization process comprises the following seven key steps:
Step 1: Population Initialization
A parent population of size M is initialized using Latin hypercube sampling to ensure uniform coverage of the feasible parameter space.
Step 2: Objective Evaluation
For each individual , the closed-loop vehicle model is simulated over a driving cycle, and the objectives are evaluated as follows:
Step 3: Non-Dominated Sorting
Individuals are assigned to non-dominated fronts (, , …) through a dominance-based sorting procedure. If a solution satisfies the criteria defined in Equation (17), it is considered to dominate another solution , denoted as .
Step 4: Crowding Distance Assignment
Within each front, the crowding distance of a solution is calculated using Equation (18), which measures solution density in the objective space. A larger crowding distance value indicates a lower density of solutions in the vicinity, reflecting better diversity preservation.
Step 5: Selection and Mating
Binary tournament selection is performed based on the non-dominated rank and crowding distance as selection criteria. The selected individuals subsequently undergo variation through simulated binary crossover and polynomial mutation. The simulated binary crossover operation is defined as follows:
where is a spread factor.
Step 6: Environmental Selection
The combined population is truncated to a size of M by first retaining all individuals from the best non-dominated fronts. For solutions residing on the same Pareto front, those with larger crowding distances are given priority for selection, thereby promoting diversity within the population.
Step 7: Termination and Output
The algorithm iterates until a predefined termination criterion is satisfied (e.g., the maximum number of generations is reached). Upon termination, the algorithm returns a Pareto-optimal set . A final solution can be selected from using an appropriate decision-making technique, such as knee-point identification or trade-off analysis.
4. Results and Discussion
This section presents a comprehensive evaluation of the NSGA-II optimization results and the performance of the health-aware fuzzy logic-based energy management strategy (hereafter referred to as health-aware FL) and its optimized variant (denoted as health-aware FL-II), based on a series of simulation experiments. The assessment focuses on the convergence behavior of the multi-objective optimization process, the trade-off characteristics between economic performance and FCS longevity, and the effectiveness of the optimized FLC parameters. Comparative analyses are conducted against conventional strategies, including DP, charge-depletion charge-sustaining (CD-CS), and a traditional FL approach, to demonstrate the superiority of the proposed methodology in achieving a balanced performance between operational economy and system longevity. Furthermore, the robustness of the optimized strategy is evaluated under various driving cycles to validate its practical applicability.
4.1. Optimization Results
To validate the effectiveness of the proposed optimization framework, the China heavy-duty commercial vehicle test cycle for tractor-trailer (CHTC-TT) was employed for simulation studies, as illustrated in Figure 8a. This standardized driving cycle was selected because it provides representative transient operating conditions, enabling a comprehensive evaluation of economic performance () and FCS degradation () under realistic driving scenarios. The NSGA-II algorithm, implemented within the ISIGHT software platform, was employed to solve the multi-objective optimization problem. The algorithm was configured with a population size of 20, a maximum of 50 generations, and crossover and mutation probabilities of 0.9 and 0.01, respectively. The algorithm employed simulated binary crossover and polynomial mutation operators, with distribution indices set to 20 and 100, respectively. A penalty function approach was used to handle constraints. Solutions that violated the operational constraints, as defined in Equation (15), were penalized by adding weighted violation terms to both objective functions. Additionally, a comprehensive statistical analysis was performed to quantify performance variability. The optimization process was repeated 15 times using different random seeds to evaluate the robustness of the NSGA-II algorithm. As detailed in Appendix A, Table A3 and Figure A1, the optimized health-aware EMS consistently achieved an HC of g and a FCS degradation of % (mean ± standard deviation) over the CHTC-TT cycle. The relatively small standard deviations—0.38% of the mean HC and 3.10% of the mean degradation—validate the reliability of our optimization methodology in the face of stochastic variations.
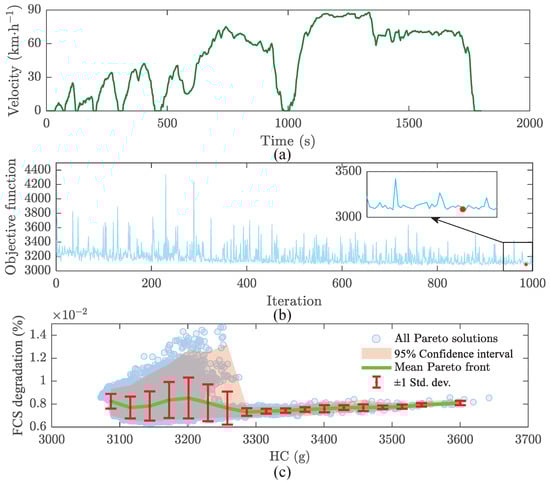
Figure 8.
NSGA-II optimization. (a) Driving cycle; (b) Iterative process; (c) Pareto frontier diagram.
Figure 8b illustrates the iterative convergence behavior of the NSGA-II algorithm over one run. As the number of iterations increases, the objective function displays a downward trend. The algorithm reached convergence to the optimal solution set by the 987th iteration, after which the objective functions stabilized, and no significant improvements were observed in the subsequent iterations. This convergence confirms that the optimization parameter settings were appropriate, indicating that the algorithm effectively conducted a thorough search and successfully identified a stable Pareto-optimal front. This outcome provides a reliable foundation for developing the EMS for FCECVs. Figure 8c depicts the Pareto solution from the multi-objective optimization, illustrating the trade-off between HC and FCS degradation. It displays all 15 runs of non-dominated solutions and assesses result reliability using the mean Pareto front, 95% confidence interval, and ±1 standard deviation. As HC increases from about 3000 g to 3700 g, FCS degradation decreases systematically, indicating that moderate HC increases can reduce aging and extend service life; however, prioritizing the hydrogen economy may accelerate performance decline. Notably, the narrow confidence intervals and standard deviation ranges indicate that the optimization method is robust and stable, with a consistent front position and shape, providing a reliable basis for subsequent energy management applications of the FECEVs.
To ensure the robustness of the optimization results, the FLC parameters were optimized under four additional operating scenarios beyond the standard CHTC-TT. As shown in Figure 9, these conditions included the China heavy-duty commercial vehicle test cycle for coach (CHTC-C), the China heavy-duty commercial vehicle test cycle for dumper (CHTC-D), the China heavy-duty commercial vehicle test cycle for light truck (CHTC-LT), and the China heavy-duty commercial vehicle test cycle for heavy truck (CHTC-HT), representing a range of operational environments typical for FCECVs. The optimization process was conducted for each driving cycle using identical NSGA-II parameter settings, and the resulting FLC configurations were analyzed to identify consistently effective parameter values. The final FLC parameters were determined by computing the average values across all five operating conditions, establishing a generalized control strategy that maintains stable performance across diverse driving scenarios. This averaged parameter set was subsequently implemented for real-time energy management control on the FCECV platform.
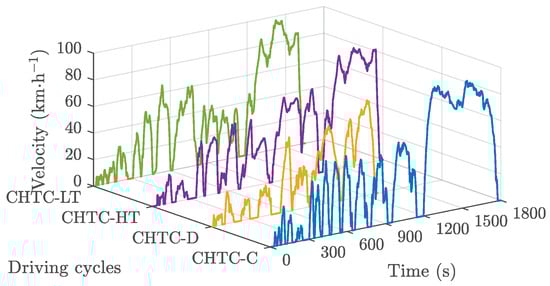
Figure 9.
Additional operating scenarios.
Figure 10 presents a comparative analysis of the MFs for input and output variables before and after optimization, where dashed lines represent the system state before optimization and solid lines depict the state after optimization. Furthermore, the original and optimized parameters for the input and output MFs—including the centers and widths—are detailed in Appendix A, Table A1 and Table A2. The optimized MFs exhibit significant modifications in both shape and distribution, reflecting the algorithm’s enhanced ability to adaptively refine the FL system for improved performance under varying operating conditions. Specifically, the boundaries among the S, M, and L power ranges have been more precisely defined, improving classification accuracy. The demand range for small and medium power has been expanded. In contrast, the large-power demand range has been reduced, effectively mitigating the risk of abrupt increases in FCS output power (Figure 10a). Notably, the Gaussian MFs demonstrate adjusted centers () and spreads (), along with expanded overlap regions that facilitate smoother transitions between operational modes (Figure 10b). For the output MFs, triangular parameters have been recalibrated with particular emphasis on minimizing sudden power shifts within the NS, Z, and PS ranges—thus reducing the likelihood of FCS degradation while maintaining system responsiveness (Figure 10c). These improvements collectively contribute to a more balanced and robust EMS, effectively balancing the competing economic efficiency objectives and long-term system longevity across diverse operational conditions.
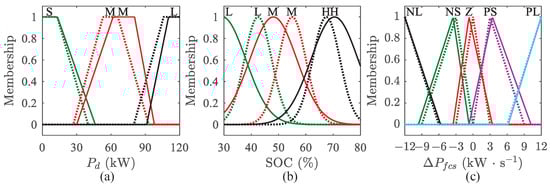
Figure 10.
Membership of the optimized FLC. (a) Power demand; (b) Battery SOC; (c) FCS power changing.
Figure 11 presents the optimized response surface of the FLC, which exhibits markedly different characteristics compared to the initial design shown in Figure 4. First, the output power change rate of the FCS is predominantly positive, indicating a control strategy that sustains continuous operation once the FCS is activated. This approach effectively mitigates performance degradation associated with frequent start-stop cycles. Second, the magnitude of the power change rate is significantly reduced relative to the pre-optimized controller, thereby minimizing stress-induced degradation resulting from abrupt load variations. Third, the distribution of power change rates is more concentrated, enabling stable and consistent FCS operation within the medium-load range. By avoiding prolonged operation at low loads and suppressing high-power transients, the optimized control strategy not only extends the operational lifespan of the FCS but also enhances its efficiency.
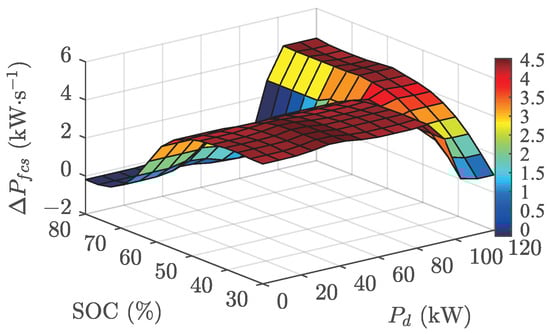
Figure 11.
Optimized response surface for FLC.
4.2. Performance Comparison
In this section, the performance of the proposed health-aware FL-based EMS is evaluated under two additional distinct driving cycles—the Urban Dynamometer Driving Schedule (UDDS) and a stochastic cycle derived from real-world driving data—to rigorously assess its robustness and generalizability across diverse operational conditions. Multiple driving cycles were employed under the verification conditions to ensure complete depletion of battery power, illustrated in Figure 12. For a comprehensive comparison, three benchmark approaches are implemented alongside the proposed method: DP, serving as a globally optimal reference; CD-CS, representing a conventional rule-based approach; and a traditional FL-based EMS, providing a baseline for FL performance relative to the proposed health-aware FL and its optimized version, health-aware FL-II. This comparative framework thoroughly evaluates the strategy’s effectiveness across diverse operating conditions.
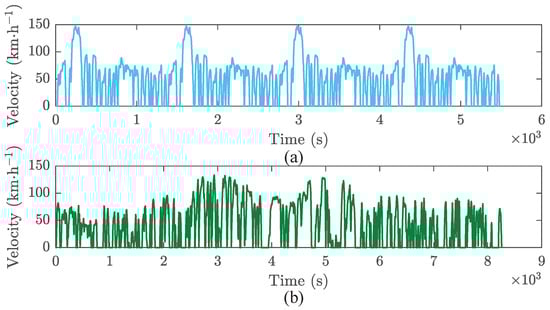
Figure 12.
Test driving cycles. (a) UDDS × 4; (b) Stochastic cycle.
Figure 13 and Figure 14 illustrate the comparative performance of different EMSs under the UDDS and a stochastic real-world driving cycle, respectively. The battery SOC was initialized and constrained to ensure a consistent basis for comparing FCS’s HC across different EMSs. The initial SOC was 0.8 (80%), and the terminal SOC was 0.3 (30%). At this point, the battery entered a charge-sustain mode to prevent over-discharge.
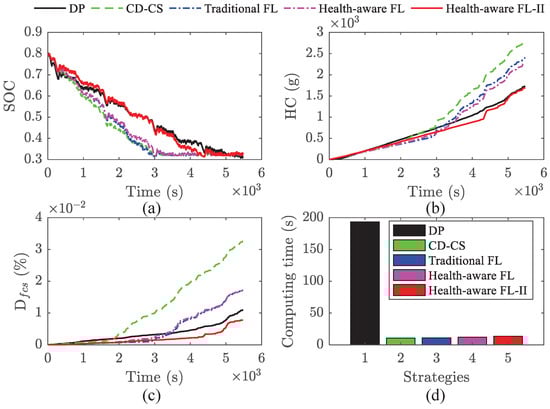
Figure 13.
Results @ UDDS. (a) Battery SOC; (b) HC; (c) FCS degradation; (d) Computing time.
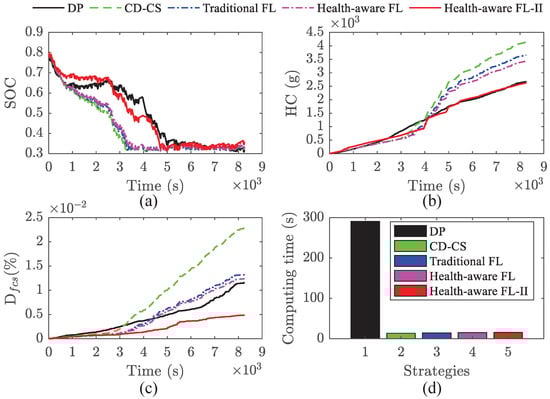
Figure 14.
Results @ Stochastic cycle. (a) Battery SOC; (b) HC; (c) FCS degradation; (d) Computing time.
As observed in Figure 13a,b and Figure 14a,b, the traditional FL strategy exhibits a rapid initial decline in its SOC trajectory, similar to that of the CD-CS strategy. When the battery SOC approaches the predefined lower threshold, the power battery transitions into a charge-sustaining mode, and the FCS predominantly supplies the vehicle propulsion power demand. Consequently, its HC starts at a low level and gradually increases over time. Although the health-aware FL strategy issues a command for incremental FCS power output, suboptimal parameter settings in the FLC lead to a relatively slow power ramp-up. As a result, during the early phase of the simulation, the power battery continues to discharge rapidly, and its SOC profile remains closely aligned with that of the CD-CS. In contrast, the optimized health-aware FL strategy (health-aware FL-II), featuring finely tuned FLC parameters, achieves an SOC trajectory that closely matches the DP. Throughout the simulation, the power battery and FCS operate in a well-coordinated manner, enabling the FCS to maintain consistently lower HC. By the end of the simulation, the HC of the health-aware FL-II strategy is the closest among all evaluated strategies to that of the globally optimal DP solution.
Figure 13c and Figure 14c illustrate the degradation behavior of the FCS under various control strategies. The results indicate that CD-CS has the highest degree of FCS degradation, followed by traditional FL. Although health-aware FL exhibits moderate improvement compared to traditional FL, its FCS degradation level remains significantly higher than that of DP. In contrast, the health-aware FL-II, which integrates multi-objective parameter optimization considering energy consumption and FCS degradation, demonstrates superior performance in both metrics. This approach achieves high energy efficiency and exhibits the lowest FCS degradation among all evaluated control strategies, surpassing even the optimal performance of the DP benchmark.
To evaluate the real-time applicability of the proposed control strategies, the computational times of the five approaches are compared in Figure 13d and Figure 14d. All simulations were conducted on a laptop computer with a 2.6 GHz CPU and 16 GB RAM to ensure consistent benchmarking conditions. The energy management control system used a 1-s time step, ensuring numerical stability and real-time applicability. The results show that the DP strategy requires the longest computation time, rendering it unsuitable for real-time implementation. CD-CS exhibits the best real-time performance among the implementable strategies, followed by traditional FL and the baseline health-aware FL strategy. Although health-aware FL-II incurs the highest computational cost among the four real-time strategies, the increase is marginal compared to the other FL–based approaches, confirming its practical feasibility for real-time energy management applications.
Table 4 summarizes the performance metrics of the five control strategies under two distinct operating conditions, including HC, FCS degradation, and computational time. Building on these results, Table 5 provides a comprehensive comparative analysis between the proposed health-aware FL-II and four benchmark approaches, highlighting its overall performance advantage. It should be noted that the DP strategy adopted in this study considers only energy consumption in its objective function, which may limit its capability to mitigate FCS degradation. For clarity, the total computation time reported herein corresponds to the simulation duration for the complete driving cycle and is influenced by the logical complexity of the control strategy. In contrast, the single-step computation time constitutes the critical metric for real-time implementation, as it reflects the time required to execute the control algorithm once per time step.
Table 4.
Performance of different strategies (SOC boundary: 80%-30%).
Table 5.
Improvements of the proposed strategy (SOC boundary: 80%-30%).
The results reveal that while the health-aware FL shows moderate improvements in economic performance and FCS degradation mitigation compared to the CD-CS and traditional FL strategies, it still falls short of the DP in terms of energy efficiency and FCS degradation mitigation. However, after multi-objective optimization, the health-aware FL-II demonstrates significant enhancements in both objectives. Not only does it achieve a marginal reduction in HC—surpassing the DP by and under the two operating scenarios—but it also substantially suppresses FCS degradation, with degradation rates reduced by and compared to the DP strategy. These results underscore the effectiveness of the health-aware optimization framework in simultaneously improving energy economy and extending FCS service life. Furthermore, in terms of real-time performance, all three FL–based control strategies exhibit longer computation times than the CD-CS, which is expected due to the more computationally intensive nature of fuzzy inference compared to the deterministic rule-based logic employed in CD-CS. Nevertheless, the proposed health-aware FL-II maintains computational overhead within practically acceptable limits, achieving a computation time of only ms per control step. This result underscores its strong potential for real-time implementation, demonstrating the ability to deliver near-optimal control decisions with high efficiency.
4.3. Health-Awareness Analysis
This study evaluates FCS degradation based on three key operational stressors: high-power operation (), low-power operation (), and load transients (). Figure 15 compares the contribution of these degradation factors across the five EMSs, with a quantitative summary presented in Table 6. As illustrated, load transients constitute the most significant contributor to FCS degradation, followed by low-power operation, while high-power operation has the least impact. Regarding strategy performance, the CD-CS has the highest and , although its is lower than that of the traditional FL and the preliminary health-aware FL. The DP strategy significantly and effectively mitigates FCS degradation induced by high-power operation. Remarkably, both FL–based strategies perform significantly better than the CD-CS in reducing transient-induced degradation. Most importantly, following parameter optimization, the proposed health-aware FL-II outperforms even the DP strategy in mitigating this critical degradation mechanism, thereby conclusively demonstrating the effectiveness of the multi-objective optimization framework. It should be noted that these findings assume continuous FCS operation. Start-stop cycling would become a dominant degradation source in urban driving, particularly with frequent stops. Our strategy’s focus on operational stability would minimize these harmful cycles, thereby likely enhancing its longevity advantage in such conditions.
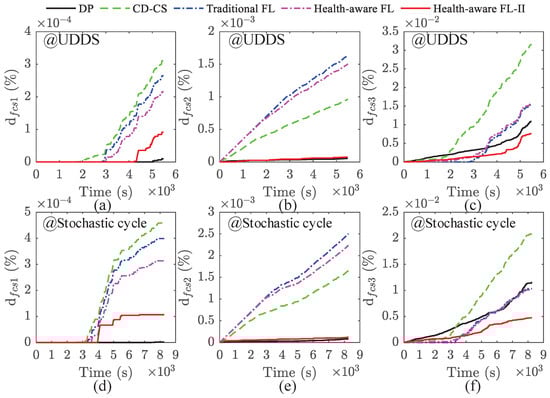
Figure 15.
Degradation analysis. (a) @ UDDS; (b) @ UDDS; (c) @ UDDS; (d) @ Stochastic cycle; (e) @ Stochastic cycle; (f) @ Stochastic cycle.
Table 6.
Degradation component analysis (SOC boundary: 80%-30%).
Table 6 compares the three degradation components—, , and —of the proposed health-aware FL-II against those of the benchmark strategies. The results indicate that while and of the proposed strategy exceed those of the DP, it achieves superior performance in all other aspects. Specifically, in the two operating scenarios considered, is reduced by and , respectively, compared to the DP. Furthermore, compared to the other three strategies, the proposed health-aware FL-II demonstrates average improvement rates of , , and for , , and , respectively.
To further analyze the energy-saving and degradation-mitigation mechanisms of the proposed strategies, Figure 16 and Figure 17 illustrate the FCS power distribution under the five evaluated EMSs, with operating points and corresponding efficiency levels also indicated. The results indicate that under the DP strategy, FCS operating points are primarily concentrated in the high-efficiency region, with minimal presence in the high-power and low-power ranges. Although approximately one-third of the operating points under the CD-CS strategy fall within the high-efficiency zone, the substantial number of points distributed across both high-power and low-power regions may lead to increased energy consumption and accelerated FCS degradation. The health-aware FL exhibits a similar operating point distribution to the traditional FL, with most points located in the low-power region due to extended FCS idle operation. Notably, the health-aware FL-II demonstrates a significant increase in the frequency of operation within the high-efficiency zone. Although some operating points remain in low- and high-power zones, its high-efficiency operating points are more concentrated than those of DP, with most clustered near the optimal efficiency point, thereby significantly improving vehicle fuel economy.
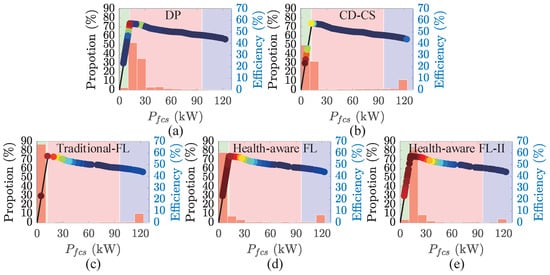
Figure 16.
FCS power distribution @ UDDS. (a) DP; (b) CD-CS; (c) Traditional FL; (d) Health-aware FL; (e) Health-aware FL-II.
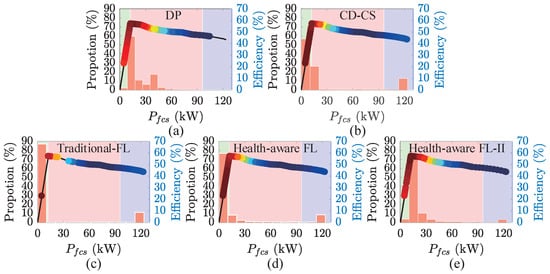
Figure 17.
FCS power distribution @ Stochastic cycle. (a) DP; (b) CD-CS; (c) Traditional FL; (d) Health-aware FL; (e) Health-aware FL-II.
Table 7 provides a detailed summary of the relevant data. Furthermore, the performance improvement achieved by the proposed health-aware FL-II was benchmarked against the other strategies. The results demonstrate its superiority over the CD-CS strategy, the traditional FL controller, and the pre-optimized health-aware FL. Specifically, the health-aware FL-II significantly reduces operating points in high-power and low-power regions by an average of and , respectively, while markedly increasing points in the high-efficiency region by an average of . Although the health-aware FL-II does not suppress high-power and low-power operation as effectively as the DP, its ability to maintain operation within the high-efficiency region is comparable, with reductions of only in the first scenario and in the second. Notably, although the health-aware FL-II exhibits a higher number of operating points in non-optimal regions than DP, its design—incorporating the FCS power change rate as a control output prior to optimization—enables it to achieve substantially lower degradation induced by load transients. Consequently, the health-aware FL-II demonstrates stronger overall degradation suppression capability. Moreover, despite having fewer high-efficiency operating points than DP, their distribution is more concentrated near the optimal efficiency point, allowing the FCS to operate longer at peak efficiency, thereby effectively reducing HC.
Table 7.
Comparison of FCS power distribution.
4.4. Application Prospects in the Internet of Vehicles Scenario
To demonstrate the applicability of our strategy in future intelligent transportation systems, we examine its implementation within an Internet of Vehicles (IoV) architecture integrated with edge computing []. The conceptual data flow is illustrated in Figure 18. This implementation comprises four key components: (1) The vehicle transmits real-time operational data to a roadside edge server, including battery SOC and power demand. At the same time, the server receives cloud-based updates, such as digital twin models and macroscopic traffic predictions. (2) The onboard electronic control unit (ECU) executes an optimized FLC to enable millisecond-level power distribution. Periodically, the edge server conducts computationally intensive parameter optimization using the NSGA-II. The optimized parameters are then returned to the vehicle for integration into its control system. (3) To ensure real-time control performance and system safety, the total end-to-end latency—from data transmission to control execution—is maintained below 100 ms. In the event of communication disruptions, the ECU reverts to the most recent valid control output or switches to a predefined conservative control rule, ensuring continued safe operation. (4) This strategy aligns closely with the goals of connected transportation systems. It effectively minimizes fleet-wide hydrocarbon emissions and average component degradation during coordinated cruising. Additionally, leveraging vehicle-to-everything (V2X) communication for foresight applications—such as predicting congestion or signal timing—facilitates proactive FCS power smoothing. This approach mitigates harmful load transients caused by abrupt driving events and significantly extends the FCS lifespan through anticipatory energy management.
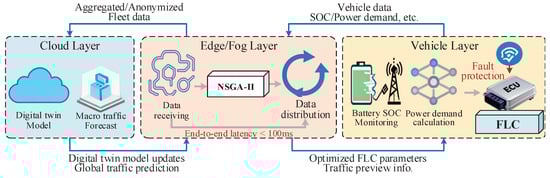
Figure 18.
Conceptual data-flow diagram for the proposed EMS in the IoV scenario.
4.5. Integration of Security, Privacy, and Resource Efficiency
Implementing the proposed energy management system within an IoV environment requires a comprehensive approach that addresses security, privacy, and resource efficiency []. The proposed framework can utilize an integrated strategy, outlined as follows. First, potential threats are identified, including data interception, unauthorized access, and false data injection. Security functions are distributed throughout the architecture: lightweight intrusion detection is implemented at vehicle ECUs, while edge servers manage authentication and secure data aggregation. Advanced threat analysis is conducted at the cloud center. Second, privacy protection is achieved through three primary methods: (1) pseudonymous authentication is utilized to safeguard identities; (2) end-to-end encryption is employed for the transmission of sensitive data; and (3) data anonymization occurs prior to cloud transmission. Third, the key efficiency metrics considered include control latency and bandwidth utilization. The proposed design effectively balances inherent trade-offs by employing lightweight cryptography for real-time data processing, reserving more robust encryption schemes for parameter updates. Following the taxonomy established in previous research, this integrated perspective ensures that security and privacy measures can be enacted without compromising the real-time performance critical to vehicle energy management. A summary of the fundamental relationships between design choices and their impacts on the three key aspects is provided in Table 8.
Table 8.
Security, privacy, and resource efficiency considerations.
5. Conclusions
In this study, a health-aware FL-based strategy is developed for energy management in FCECVs, with the dual objectives of enhancing fuel economy and mitigating FCS degradation. A health-aware FL-based EMS is designed, using vehicle demand power and battery SOC as inputs to regulate the change rate of FCS power output. A multi-objective optimization framework is subsequently established, considering both vehicle economic benefits and FCS degradation simultaneously. The NSGA-II algorithm is employed to optimize the controller parameters across five characteristic driving cycles (CHTC-C, CHTC-D, CHTC-LT, CHTC-HT, and CHTC-TT), with the resulting averaged optimal parameters applied to real-time energy management.
Results demonstrate that the proposed integration of health-aware FL with multi-objective optimization effectively addresses the challenge of multi-objective parameter tuning while maintaining strong real-time performance. Compared to the CD-CS strategy, the proposed health-aware FL-II strategy reduces HC by approximately , achieving energy efficiency comparable to the DP. In terms of FCS degradation mitigation, the proposed strategy outperforms CD-CS by over and surpasses DP by an average of across diverse driving scenarios. Although an average performance gap of exists relative to CD-CS in real-time operation, the single-step computation time of only ms confirms its practical feasibility for real-time implementation.
Future research will advance the proposed EMS through three principal directions. First, the optimized health-aware FLC will undergo hardware-in-the-loop validation to assess real-time performance and robustness. Second, a comprehensive health management framework will be developed by integrating high-fidelity FCS models with start/stop mechanisms, incorporating detailed battery aging models, and establishing degradation-weighted DP as an enhanced benchmark—enabling concurrent optimization of HC, FCS degradation, and battery health. Finally, cloud-based fleet learning will be implemented within the IoVs’ architecture, leveraging aggregated operational data to facilitate continuous refinement of the digital twin and adaptive strategy updates through over-the-air programming.
Author Contributions
Conceptualization, J.D. and X.L.; methodology, J.D. and X.L.; software, X.Z. and S.W.; validation, J.D., X.Z. and S.W.; writing—original draft preparation, J.D. and X.Z.; writing—review and editing, J.D. and X.L. All authors have read and agreed to the published version of the manuscript.
Funding
This research was funded in part by the Innovation Capability Enhancement Initiative for Technology-Oriented SMEs of Shandong Province 2024PDJH38/K24LB9601, and in part by the Doctoral Scientific Research Foundation of Liaocheng University 318052058.
Data Availability Statement
The original contributions presented in this study are included in the article. Further inquiries can be directed to the corresponding author.
Conflicts of Interest
The authors declare no conflicts of interest.
Abbreviations
The following abbreviations are used in this manuscript:
| Acronyms | |
| AMT | Automated Manual Transmission |
| BEV | Battery Electric Vehicle |
| CD-CS | Charge-Depletion Charge-Sustaining |
| CHTC-C | China Heavy-duty Commercial Vehicle Test Cycle for Coach |
| CHTC-D | China Heavy-duty Commercial Vehicle Test Cycle for Dumper |
| CHTC-HT | China Heavy-duty Commercial Vehicle Test Cycle for Heavy Truck |
| CHTC-LT | China Heavy-duty Commercial Vehicle Test Cycle for Light Truck |
| CHTC-TT | China Heavy-duty Commercial Vehicle Test Cycle for Tractor-trailer |
| DDPG | Deep Deterministic Policy Gradient |
| DP | Dynamic Programming |
| DQN | Deep Q-Network |
| DRL | Deep Reinforcement Learning |
| EMS | Energy Management Strategy |
| ECU | Electronic Control Unit |
| FCECV | Fuel Cell Electric Commercial Vehicle |
| FCEV | Fuel Cell Electric Vehicle |
| FCS | Fuel Cell System |
| FL | Fuzzy Logic |
| FLC | Fuzzy Logic Controller |
| HC | Hydrogen Consumption |
| HIL | Hardware-In-the-Loop |
| IoV | Internet of Vehicles |
| MCU | Motor Control Unit |
| MF | Membership Function |
| MPC | Model Predictive Control |
| NSGA-II | Non-dominated Sorting Genetic Algorithm–II |
| PEMFC | Proton Exchange Membrane Fuel Cell |
| PMP | Pontryagin’s Minimum Principle |
| RL | Reinforcement Learning |
| SOC | State of Charge |
| UDDS | Urban Dynamometer Driving Schedule |
| V2X | Vehicle-to-Everything |
| Symbols | |
| m | Vehicle mass (kg) |
| f | Rolling friction coefficient |
| Aerodynamic drag coefficient | |
| Air density (kg·m−3) | |
| Frontal surface area (m2) | |
| g | Gravitational acceleration (m·s−2) |
| u | Vehicle velocity (m·s−1) |
| Road slope (°) | |
| Battery power (kW) | |
| Vehicle power demand (kW) | |
| Fuel cell system power (kW) | |
| Motor output power (kW) | |
| Hydrogen consumption rate of the FCS (g·s−1) | |
| Lower heating value of hydrogen (J·g−1) | |
| Degradation magnitude of the FCS (%) | |
| The SOC variation | |
| Change rate of FCS power (kW·s−1) |
Appendix A
Appendix A.1. Original Parameters for Membership Functions
Table A1.
Original parameters for membership functions.
Table A1.
Original parameters for membership functions.
| Variable | Linguistic Term | MF Type | Parameters | |||
|---|---|---|---|---|---|---|
| (kW) | Small (S) | Trapezoidal | ||||
| Medium (M) | Trapezoidal | |||||
| Large (L) | Trapezoidal | |||||
| (%) | Low (L) | Gaussian | o = 42.5 | = 5.0 | ||
| Medium (M) | Gaussian | o = 55.0 | = 5.0 | |||
| High (H) | Gaussian | o = 67.5 | = 5.0 | |||
| (kW·s−1) | NL | Triangular | – | |||
| NS | Triangular | – | ||||
| Z | Triangular | – | ||||
| PS | Triangular | – | ||||
| PL | Triangular | – | ||||
Appendix A.2. Optimized Parameters for Membership Functions
Table A2.
Optimized parameters for membership functions.
Table A2.
Optimized parameters for membership functions.
| Variable | Linguistic Term | MF Type | Parameters | |||
|---|---|---|---|---|---|---|
| (kW) | Small (S) | Trapezoidal | ||||
| Medium (M) | Trapezoidal | |||||
| Large (L) | Trapezoidal | |||||
| (%) | Low (L) | Gaussian | o = 29.4 | = 8.6 | ||
| Medium (M) | Gaussian | o = 48.1 | = 8.6 | |||
| High (H) | Gaussian | o = 70.5 | = 8.6 | |||
| (kW·s−1) | NL | Triangular | – | |||
| NS | Triangular | – | ||||
| Z | Triangular | – | ||||
| PS | Triangular | – | ||||
| PL | Triangular | – | ||||
Note: For trapezoidal MFs: a (left foot), b (left shoulder), c (right shoulder), d (right foot). For triangular MFs: l (left foot), m (peak), n (right foot). For Gaussian MFs: o (center) and (Standard deviation) parameters.
Appendix A.3. Performance Metrics Summary from 15 Independent Optimization Runs
Table A3.
Performance metrics summary from 15 independent optimization runs.
Table A3.
Performance metrics summary from 15 independent optimization runs.
| Run No. | Random Seed | HC (g) | FCS Degradation ( %) | Computational Cost (s) |
|---|---|---|---|---|
| 1 | 1761967757220 | 3107.16 | 0.662 | 8727 |
| 2 | 1761995017584 | 3109.63 | 0.667 | 9249 |
| 3 | 1762040927082 | 3123.86 | 0.684 | 8622 |
| 4 | 1762049752763 | 3114.42 | 0.672 | 8948 |
| 5 | 1762062904723 | 3127.58 | 0.651 | 9368 |
| 6 | 1762090143209 | 3091.71 | 0.693 | 8410 |
| 7 | 1762130543976 | 3107.45 | 0.687 | 7492 |
| 8 | 1762141244196 | 3138.49 | 0.628 | 8229 |
| 9 | 1762151887229 | 3120.09 | 0.650 | 8206 |
| 10 | 1762161868396 | 3123.22 | 0.712 | 8235 |
| 11 | 1762214081936 | 3113.12 | 0.654 | 9757 |
| 12 | 1762228799314 | 3106.01 | 0.689 | 10,349 |
| 13 | 1762240416420 | 3104.83 | 0.656 | 8240 |
| 14 | 1762250194158 | 3128.79 | 0.671 | 11,069 |
| 15 | 1762301649461 | 3108.14 | 0.668 | 7194 |
| Mean | – | 3115 | 0.67 | 8806 |
| Std. | – | 11.90 | 0.021 | 1028 |
| C.V. (%) | – | 0.38 | 3.10 | 11.67 |
Note: HC = Hydrogen Consumption; FCS = Fuel Cell System; Std. = Standard Deviation; C.V. = Coefficient of Variation. The random seed values are exemplary and should be replaced with the actual seeds used in the experiments.
Appendix A.4. Statistical Distribution of Performance Metrics from 15 Optimization Runs

Figure A1.
Statistical distribution of performance metrics from 15 optimization runs.
References
- Zhou, Y.; Yang, F.; Guo, Y.; Chen, B.; Jiang, W.; Ma, R.; Gao, F. Adaptive Energy Management for Fuel Cell Heavy Trucks Based on Wavelet Neural Network Speed Predictor and Real-Time Weight Distribution. IEEE Trans. Transp. Electrif. 2025, 11, 5069–5083. [Google Scholar] [CrossRef]
- Geng, C.; Mei, S.; Liu, L.; Ma, W.; Xue, Q. Simulation and Experimental Research on Energy Management Control Strategy for Fuel Cell Heavy-Duty Truck. Int. J. Hydrogen Energy 2024, 69, 1305–1318. [Google Scholar] [CrossRef]
- Zhang, J.; Xun, Q.; Liserre, M.; Yang, H. Health-Aware Bi-level Optimization of Component Sizing and Real-Time Energy Management in Fuel Cell Hybrid Electric Trucks. IEEE Trans. Ind. Appl. 2024, 60, 7279–7290. [Google Scholar] [CrossRef]
- KoteswaraRao, K.V.; Srinivasulu, G.N.; Rahul, J.R.; Velisala, V. Optimal Component Sizing and Performance of Fuel Cell—Battery Powered Vehicle over World Harmonized and New European Driving Cycles. Energy Convers. Manag. 2024, 300, 117992. [Google Scholar] [CrossRef]
- Alyakhni, A.; Boulon, L.; Vinassa, J.M.; Briat, O. A Comprehensive Review on Energy Management Strategies for Electric Vehicles Considering Degradation Using Aging Models. IEEE Access 2021, 9, 143922–143940. [Google Scholar] [CrossRef]
- Song, K.; Li, F.; Hu, X.; He, L.; Niu, W.; Lu, S.; Zhang, T. Multi-mode Energy Management Strategy for Fuel Cell Electric Vehicles Based on Driving Pattern Identification Using Learning Vector Quantization Neural Network Algorithm. J. Power Sources 2018, 389, 230–239. [Google Scholar] [CrossRef]
- Sulaiman, N.; Hannan, M.A.; Mohamed, A.; Ker, P.J.; Majlan, E.H.; Daud, W.R.W. Optimization of Energy Management System for Fuel-Cell Hybrid Electric Vehicles: Issues and Recommendations. Appl. Energy 2018, 228, 2061–2079. [Google Scholar] [CrossRef]
- Pramuanjaroenkij, A.; Kakac, S. The Fuel Cell Electric Vehicles: The Highlight Review. Int. J. Hydrogen Energy 2023, 48, 9401–9425. [Google Scholar] [CrossRef]
- Kumar, S.; Bhattacharjee, A. A Comprehensive Review on Energy Management Strategies for Fuel-Cell-Based Electric Vehicles. Energy Technol. 2024, 13, 2401341. [Google Scholar] [CrossRef]
- Hu, X.; Zou, C.; Tang, X.; Liu, T.; Hu, L. Cost-Optimal Energy Management of Hybrid Electric Vehicles Using Fuel Cell/Battery Health-Aware Predictive Control. IEEE Trans. Power Electron. 2020, 35, 382–392. [Google Scholar] [CrossRef]
- Liu, X.; Du, J.; Ma, J.; Liu, G.; Xiong, Y. An Adaptive Co-State Design Method for PMP-based Energy Management of Plug-in Hybrid Electric Vehicles Based on Fuzzy Logical Control. J. Energy Storage 2024, 102, 114118. [Google Scholar] [CrossRef]
- Lu, X.; Wu, Y.; Lian, J.; Zhang, Y.; Chen, C.; Wang, P.; Meng, L. Energy management of hybrid electric vehicles: A review of energy optimization of fuel cell hybrid power system based on genetic algorithm. Energy Convers. Manag. 2020, 205, 112474. [Google Scholar] [CrossRef]
- Lin, X.; Huang, H.; Xu, X.; Xie, L. Dynamic Programming Solutions Extracted SOC-trajectory Online Learning Generation Algorithm Based Approximate Global Optimization Control Strategy for a Fuel Cell Hybrid Electric Vehicle. Energy 2024, 295, 130728. [Google Scholar] [CrossRef]
- Liu, Y.; Liu, J.; Qin, D.; Li, G.; Chen, Z.; Zhang, Y. Online Energy Management Strategy of Fuel Cell Hybrid Electric Vehicles Based on Rule Learning. J. Clean. Prod. 2020, 260, 121017. [Google Scholar] [CrossRef]
- Yamchi, H.B.; Kandidayeni, M.; Kelouwani, S.; Boulon, L. Constrained Exploration Method for Optimal Energy Management in Hybrid Multi-Stack Fuel Cell Vehicles. Energy Convers. Manag. 2024, 316, 118841. [Google Scholar] [CrossRef]
- Zhou, S.; Walker, P.; Yang, W.; Nguyen, C.T.; Zhang, N. Energy Management Strategy Design and Fuel Consumption Analysis for a Parallel Hydraulic Hybrid Vehicle. Int. J. Heavy Veh. Syst. 2024, 31, 187–209. [Google Scholar] [CrossRef]
- Huang, Y.; Wang, H.; Khajepour, A.; He, H.; Ji, J. Model predictive control power management strategies for HEVs: A review. J. Power Sources 2017, 341, 91–106. [Google Scholar] [CrossRef]
- Mohammed, A.S.; Atnaw, S.M.; Salau, A.O.; Eneh, J.N. Review of Optimal Sizing and Power Management Strategies for Fuel Cell/battery/super Capacitor Hybrid Electric Vehicles. Energy Rep. 2023, 9, 2213–2228. [Google Scholar] [CrossRef]
- Abdelghany, M.B.; Shehzad, M.F.; Mariani, V.; Liuzza, D.; Glielmo, L. Two-stage Model Predictive Control for a Hydrogen-Based Storage System Paired to a Wind Farm Towards Green Hydrogen Production for Fuel Cell Electric Vehicles. Int. J. Hydrogen Energy 2022, 47, 32202–32222. [Google Scholar] [CrossRef]
- Yao, Y.; Wang, J.; Zhou, Z.; Li, H.; Liu, H.; Li, T. Hierarchical Predictive Control-Based Economic Energy Management for Fuel Cell Hybrid Construction Vehicles. Energy 2023, 262, 117327. [Google Scholar] [CrossRef]
- Moghadari, M.; Kandidayeni, M.; Boulon, L.; Chaoui, H. Predictive Health-Conscious Energy Management Strategy of a Hybrid Multi-Stack Fuel Cell Vehicle. IEEE Trans. Veh. Technol. 2024, 74, 5542–5557. [Google Scholar] [CrossRef]
- Jia, C.; Qiao, W.; Cui, J.; Qu, L. Adaptive Model-Predictive-Control-Based Real-Time Energy Management of Fuel Cell Hybrid Electric Vehicles. IEEE Trans. Power Electron. 2023, 38, 2681–2694. [Google Scholar] [CrossRef]
- Oladosu, T.L.; Pasupuleti, J.; Kiong, T.S.; Koh, S.P.J.; Yusaf, T. Energy management strategies, control systems, and artificial intelligence-based algorithms development for hydrogen fuel cell-powered vehicles: A review. Int. J. Hydrogen Energy 2024, 61, 1380–1404. [Google Scholar] [CrossRef]
- Ming, W.; Sun, P.; Zhang, Z.; Qiu, W.; Du, J.; Li, X.; Zhang, Y.; Zhang, G.; Liu, K.; Wang, Y.; et al. A Systematic Review of Machine Learning Methods Applied to Fuel Cells in Performance Evaluation, Durability Prediction, and Application Monitoring. Int. J. Hydrogen Energy 2023, 48, 5197–5228. [Google Scholar] [CrossRef]
- Deng, P.; Wu, X.; Yang, J.; Yang, G.; Jiang, P.; Yang, J.; Bian, X. Optimal Online Energy Management Strategy of a Fuel Cell Hybrid Bus Via Reinforcement Learning. Energy Convers. Manag. 2024, 300, 117921. [Google Scholar] [CrossRef]
- Zhang, Y.; Zhang, C.; Fan, R.; Huang, S.; Yang, Y.; Xu, Q. Twin Delayed Deep Deterministic Policy Gradient-Based Deep Reinforcement Learning for Energy Management of Fuel Cell Vehicle Integrating Durability Information of Powertrain. Energy Convers. Manag. 2022, 274, 116454. [Google Scholar] [CrossRef]
- Tang, X.; Shi, L.; Zhang, Y.; Li, B.; Xu, S.; Song, Z. Degradation Adaptive Energy Management Strategy for FCHEV Based on the Rule-DDPG Method: Tailored to the Current SOH of the Powertrain. IEEE Trans. Transp. Electrif. 2025, 11, 993–1003. [Google Scholar] [CrossRef]
- Huang, R.; He, H.; Zhao, X.; Gao, M. Longevity-aware Energy Management for Fuel Cell Hybrid Electric Bus Based on a Novel Proximal Policy Optimization Deep Reinforcement Learning Framework. J. Power Sources 2023, 561, 232717. [Google Scholar] [CrossRef]
- Yu, S.; Peng, J.; Zhou, J.; Ren, T.; Wu, J.; Fan, Y. Durability-enhanced decision-making with style awareness for autonomous hydrogen fuel cell vehicle based on integrated reinforcement learning approaches. Energy 2025, 336, 138314. [Google Scholar] [CrossRef]
- Tang, X.; Zhou, H.; Wang, F.; Wang, W.; Lin, X. Longevity-conscious Energy Management Strategy of Fuel Cell Hybrid Electric Vehicle Based on Deep Reinforcement Learning. Energy 2022, 238, 121593. [Google Scholar] [CrossRef]
- Su, Q.; Huang, R.; Zhang, Z.; Shou, Y.; He, H. Uncertainty-aware Deep Reinforcement Learning for Trainable Equivalent Consumption Minimization Strategy of Fuel Cell Hybrid Electric Tracked Vehicle. IEEE Trans. Transp. Electrif. 2025, 11, 10310–10321. [Google Scholar] [CrossRef]
- Nie, Z.; Song, H.; Lian, Y.; Shi, Z. Hierarchical Optimization of SAC-driven Speed Planning and Energy Management in Intelligent Fuel Cell Hybrid Vehicle Platoons under Complex Traffic Environments. Energy 2025, 334, 137625. [Google Scholar] [CrossRef]
- Hemi, H.; Ghouili, J.; Cheriti, A. A Real Time Fuzzy Logic Power Management Strategy for a Fuel Cell Vehicle. Energy Convers. Manag. 2014, 80, 63–70. [Google Scholar] [CrossRef]
- Shen, Y.; Xie, J.; He, T.; Yao, L.; Xiao, Y. CEEMD-Fuzzy Control Energy Management of Hybrid Energy Storage Systems in Electric Vehicles. IEEE Trans. Energy Convers. 2024, 39, 555–566. [Google Scholar] [CrossRef]
- da Silva, S.F.; Eckert, J.J.; Correa, F.C.; Silva, F.L.; Silva, L.C.A.; Dedini, F.G. Dual HESS Electric Vehicle Powertrain Design and Fuzzy Control Based on Multi-Objective Optimization to Increase Driving Range and Battery Life Cycle. Appl. Energy 2022, 324, 119723. [Google Scholar] [CrossRef]
- Omakor, J.; Alzayed, M.; Chaoui, H. Particle Swarm Optimized Fuzzy Logic Energy Management of Hybrid Energy Storage in Electric Vehicles. Energies 2024, 17, 2163. [Google Scholar] [CrossRef]
- Ahmadi, S.; Bathaee, S.M.T.; Hosseinpour, A.H. Improving Fuel Economy and Performance of a Fuel-Cell Hybrid Electric Vehicle (Fuel-Cell, Battery, and Ultra-Capacitor) Using Optimized Energy Management Strategy. Energy Convers. Manag. 2018, 160, 74–84. [Google Scholar] [CrossRef]
- Li, Y.; Lu, X.; Kar, N.C. Rule-Based Control Strategy with Novel Parameters Optimization Using NSGA-II for Power-Split PHEV Operation Cost Minimization. IEEE Trans. Veh. Technol. 2014, 63, 3051–3061. [Google Scholar] [CrossRef]
- Xie, J.; Wu, G.; Zhou, X.; Deng, S. Future Perspectives on Internet of Vehicles Resource Management: Digital Twin-Enabled Edge Computing Frameworks. J. Eng. Appl. Sci. 2025, 72, 119. [Google Scholar] [CrossRef]
- Javanmardi, S.; Nascita, A.; Pescapè, A.; Merlino, G.; Scarpa, M. An Integration Perspective of Security, Privacy, and Resource Efficiency in IoT-Fog Networks: A Comprehensive Survey. Comput. Netw. 2025, 270, 111470. [Google Scholar] [CrossRef]
Disclaimer/Publisher’s Note: The statements, opinions and data contained in all publications are solely those of the individual author(s) and contributor(s) and not of MDPI and/or the editor(s). MDPI and/or the editor(s) disclaim responsibility for any injury to people or property resulting from any ideas, methods, instructions or products referred to in the content. |
© 2025 by the authors. Licensee MDPI, Basel, Switzerland. This article is an open access article distributed under the terms and conditions of the Creative Commons Attribution (CC BY) license (https://creativecommons.org/licenses/by/4.0/).