Abstract
Accurate forecasting of springback continues to pose a significant challenge in sheet metal forming processes. The present paper presents a numerical model designed for the precise prediction of springback, allowing for a deeper understanding of plasticity behavior during cold forming operations in sheet metals. The key contribution of this model is the introduction of a non-associated anisotropic constitutive model featuring nonlinear mixed isotropic–kinematic hardening. This model is derived from Hill’48 quadratic function and it was implemented into ABAQUS 6.13 software environment through the user defined UMAT subroutine. For improved precision, kinematic hardening parameters specific to 5083 aluminum sheet metal were meticulously derived from cyclic shear experiments. Our results demonstrate the model’s strong capability in predicting springback during the U-bending operation, achieving remarkable accuracy. The design of experiments DOE is used as a statistical method to optimize the number of experiments and analyze the effects of key input factors. In this study, sheet thickness, punch speed, and sampling angle relative to the rolling direction (RD) are examined at different levels to assess their impact on folding force and springback. The strong agreement between experimental results and theoretical predictions confirms the accuracy and reliability of the proposed models in estimating folding force and springback.
1. Introduction
Sheet metals inherently exhibit initial plastic anisotropy, primarily driven by their crystallographic texture. This anisotropy significantly influences the mechanical response of sheet materials in forming processes. As a result, accurate and computationally efficient anisotropic elasto-plastic constitutive models are essential for computer simulation codes that use the FE method in the design of sheet forming processes.
To enhance the accuracy of finite element method (FEM) simulations, it is imperative to employ the most precise yield function available, capable of capturing all pertinent anisotropic effects.
Many anisotropic yield functions have been introduced in the field of sheet metal forming, which are primarily based on the associated flow rule hypothesis (AFR). Hill’s 48 quadratic yield criterion, as introduced by Hill [1], is a foundational model that captures the anisotropic behavior of materials under different loading conditions. Later, researchers expanded on this foundation, with notable contributions including Barlat’s yield criteria, which includes a more complex description of plastic anisotropy using a linear transformation approach to characterize yield surfaces [2]. The work of Jung et al. [3] advances the understanding of anisotropy in metallic materials by developing a tailored yield function for advanced high-strength steels, validating the hypothesis of the yield anisotropy criterion in predicting the behavior of materials. In addition, recent advances in computational methods have facilitated the application of these anisotropic yield functions in industrial settings, thereby optimizing sheet metal forming processes [4,5].
In recent decades, there has been growing interest in the development and application of non-associated flow rule (AFR) models. These models utilize two separate functions: the yield function, which delineates the elastic limit of the material, and the plastic potential function, which governs the direction of the plastic strain rate [1,6,7,8,9,10,11]. During the elastoplastic deformation of a sheet metal workpiece in forming processes, several defects can arise. Experimental and numerical studies were elaborated in order to predict and minimize main defaults in sheet metal forming processes [12,13,14]. These studies focus on tooling design, forming process parameters, influence of lubricants and control of material properties. The main defaults include the wrinkling, which is the formation of unwanted wrinkles [15]. This occurrence typically takes place when compressive stresses surpass a critical threshold, leading to local material buckling. In addition, variation in sheet metal thickness can occur due to inconsistent material flow during the forming process [16,17]. Thickness variation can lead to structural weaknesses, dimensional inaccuracies, or difficulties in subsequent assembly processes.
During the sheet metal forming process, the removal of tooling can lead to changes in the final geometry, resulting in an undesirable deformation phenomenon known as springback, as addressed in references [18,19,20]. Springback presents a major challenge in the design of automotive parts such as car bodies, especially if a lightweight material such as aluminum is used. These materials pose a distinct challenge because of their significant springback characteristics. Research has demonstrated that the final geometry of the sheet following springback is affected by a variety of factors, both physical and numerical. The physical parameters encompass process variables such as friction conditions, sheet holding force, thickness, tool shape, and sheet dimensions [21,22], along with material properties like Young’s modulus, yield strength, and the Bauschinger effect [23]. On the numerical side, factors that affect springback include the type, order, and integration scheme used in the FE model, as well as the mesh shape, size, and refinement [24,25].
A range of experimental geometries has been examined to effectively characterize and benchmark the springback phenomenon, with simple bending [21,25] and draw-bending [26] being among the most commonly used methods. One of the primary objectives of the research has been to improve the accuracy of springback predictions. Numerous studies have investigated the effects of work-hardening models on these predictions [26,27,28]. For instance, L-bending tests have been conducted numerically, with springback angles being recorded in various studies such as [22,29]. Oliveira et al. [25] focused on the effect of work hardening models on springback simulation for the Numisheet’05 Benchmark #3 using an in-house implicit code, concentrating on DP600 material and a specific drawbead penetration. Additionally, numerical predictions of springback in [30] were compared with experimental results from the U-bending test (NUMISHEET’93) for AA5754-O sheet, demonstrating the efficacy of the associated flow rule model in scenarios involving moderate strains.
On the other hand, some researchers have investigated the influence of various factors in forming processes, and several approaches have been developed to optimize these operations, notably Design of Experiments (DOE), Response Surface Methodology (RSM), and other optimization techniques. These tools aim to enhance process outcomes through the systematic and efficient selection of process parameters. DOE and RSM, in particular, are widely applied to reduce the number of required experiments, especially in complex forming operations where experimental costs and time are considerable. For instance, Satonkar and Gopalan [31] employed DOE and RSM to analyze the influence of geometric parameters in perforated sheet forming, providing valuable insights into how design features affect process performance. Tang et al. [32] reviewed development trends in forming process optimization and highlighted the usefulness of RSM in handling experimental data with inherent variability. They also emphasized the increasing role of intelligent optimization algorithms in controlling mechanical performance during forming operations. Moreover, Zhang et al. [33] focused on optimizing stamping process parameters using a combination of finite element analysis and experimental design. Their study aimed to predict and minimize common forming defects, such as springback, by analyzing the effects of variables such as blank holder force and friction coefficient.
In this paper, the accuracy of the non-associated anisotropic constitutive model, combined with nonlinear mixed isotropic–kinematic hardening, for predicting springback in the U-bending process is experimentally validated. The mathematical model has been streamlined to only two equations, which are tackled through the iterative Newton-Raphson method. The non-associated model is based on the Hill quadratic function for both the yielding function and the plastic potential. The anisotropic plasticity of Hill combined with mixed isotropic–kinematic hardening model is considered, in the numerical simulations, for modeling material behavior. The implementation of this model has been carried out in the ABAQUS software using a user-defined UMAT subroutine. Firstly, the model’s reliability is established by contrasting numerical outcomes with experimental data obtained from cyclic shear tests, enabling the determination of kinematic hardening parameters. Secondly, the model’s precision is affirmed by comparing the numerically predicted springback angle with the experimental measurement in U-bending tests. Then, DOE statistical method is used to optimize the number of experiments and analyze the effects of key input factors such as sheet thickness, punch speed, and sampling angle relative to the rolling direction examined at different levels to assess their impact on folding force and springback. The optimization presented in this work could be used by manufacturers in the city of Hail and elsewhere in the world to make the process more efficient and accurate.
2. Materials and Methods
2.1. Shear Test
A simplified shear test was introduced by [34], utilizing a configuration with two distinct shear zones, as depicted in Figure 1. The specimen consists of three bars, all securely clamped and interconnected through the sections representing the shear zones. By subjecting the middle bar to a tensile load, shear deformation is induced in the connecting regions. In fact, the shear zone rotations are efficiently minimized with this geometric design during loading.
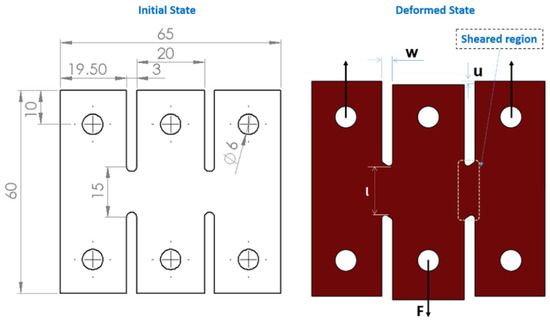
Figure 1.
Sample intended for a pure shear test.
This section focuses on the 5083-aluminum alloy, which has a sheet thickness of 2 mm. The experimental setup, depicted in Figure 2, ensures that the specimen is securely positioned across three bars, aligned with the thickness direction of the blank sheet. The fixture design permits direct observation of the specimen’s surface, facilitating precise measurement of surface strains in the shear zones using a comparator. The machine operates at a speed of 1 mm/min.
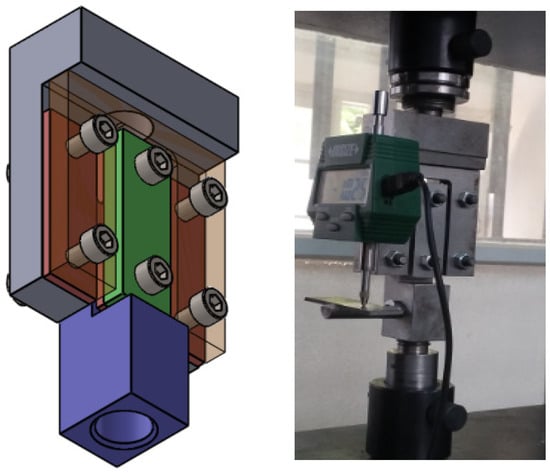
Figure 2.
Device for the experimental pure shear test.
The specimen used for cyclic hardening testing is depicted in Figure 3, highlighting both its initial and deformed states. The main objective of this experimental phase is assessing the cyclic hardening behavior of the 5083-aluminum alloy under cyclic loading, specifically with a shear strain amplitude of 0.22. In fact, as illustrated in Figure 4 in the work of Bouhamed et al. [35], the maximum strain at fracture is approximately 0.25 for all orientations (0°, 45°, and 90°), indicating that the forming process studied involves moderate plastic deformations. During the cyclic shear test, a shear strain amplitude of 0.22 is chosen to prevent the specimen from breaking at the start of the test. Having the aim to derive the kinematic hardening parameters for the material under examination.
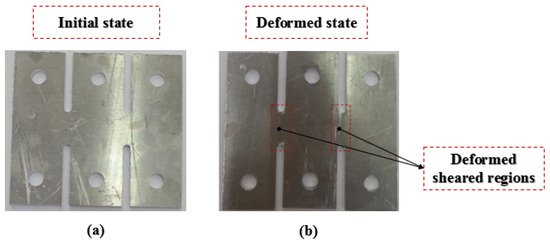
Figure 3.
Specimen for a cyclic shear test (a) Initial state (b) Deformed state.
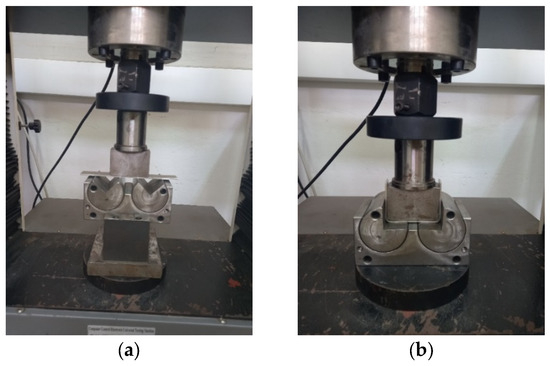
Figure 4.
Experimental setup of U-bending process: (a) Initial state (b) Deformed state.
Shear stress and shear strain can be determined as follows:
In this context, F represents the shear force, l refers to the length of the sheared area (illustrated in Figure 1), e indicates the thickness of the sheet plate, u represents the displacement of the drawn portion of the sample, and w denotes the sheared area width.
2.2. U-Bending Test
U-bending experiments are conducted using a tensile test machine and executed through the experimental setup depicted in Figure 4 to assess the precision of predicting springback (the angular difference between the state of the specimen at the end of loading and after unloading). In this application, the blank refers to a 5083-aluminum sheet metal strip measuring 140 mm in length and 20 mm in width, positioned centrally on the tool. The punch descends and returns after reaching 16 mm. The dimensional specifications of the various tools are shown in Figure 5, along with the geometric tolerances required for successful bending. The experimental data comprises punch force plotted against punch displacement, recorded through sensors on the tensile machine. The deformed specimen is depicted in Figure 6, in which the angle after springback is estimated.
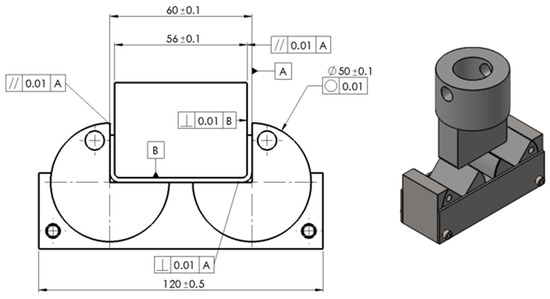
Figure 5.
Dimensional specifications of the tools.
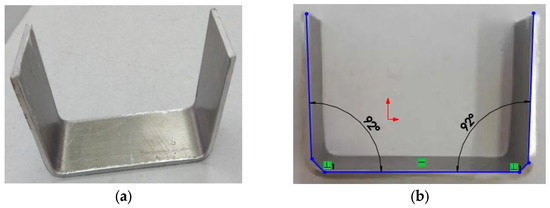
Figure 6.
Deformed specimen: (a) Final part and (b) angle after springback.
3. Anisotropic Plasticity with Nonlinear Isotropic–Kinematic Hardening Model
In this study, the Hill’48 quadratic yield function was adopted within a non-associated plasticity framework to accurately describe both the stress and strain anisotropy of the AA5083-aluminum alloy. The choice of Hill’48 was motivated by its well-established formulation, its suitability for rolled aluminum sheets exhibiting planar anisotropy, and its ability to be effectively implemented in a non-associated form to distinguish between the yield surface and the plastic potential surface.
3.1. Elasto-Plastic Constitutive Model
Elastoplastic behavior is defined by the presence of irreversible strains that occur upon the removal of the applied load. This is represented by the standard decomposition of the strain tensor ε into an elastic (reversible) component and a plastic (irreversible) component as written in the following equation:
where the elastic strain is related to the stress tensor through the elastic stiffness matrix D, formulated as follows:
The yield criterion can be expressed in a generic form as:
: Effective stress tensor,
: Initial yield stress,
: Equivalent stress,
: Back-stress tensor,
R: Drag stress associated with isotropic hardening.
In this study, Voce law is considered to model the isotropic hardening function
: Isotropic hardening parameter,
Q1, Q2, β1 and β2: material parameters.
Chaboche (1986) [36] proposed a method for modeling the back-stress tensor in Equation (4) by superimposing multiple components as follows:
In the current non-associated elastoplastic model, the plastic potential function is selected as described in [30].
and : Material parameters,
: Back-stress tensors,
: Equivalent stress,
The equivalent stresses, and , can take various forms, including quadratic or non-quadratic, isotropic or orthotropic. For this work, the quadratic anisotropic function based on Hill’s 48 model is applied to both and .
In the previous equation, is a fourth-order tensor defining the yield criterion . In 3D case, the Hill Yield criterion is derived by taking:
: Material constants computed after testing the material in various orientations. In the same Equation (8), is also a fourth order tensor. In three-dimensional case, it is defined as:
where , : Material constants.
It is important to mention that in the particular case of , the associated flow rule is recovered.
The proposed model is developed for anisotropic sheet metals produced by the rolling process, where the mechanical response depends strongly on the material orientation. Several yield criteria, such as those proposed by Hosford (1972) [37] and Barlat et al. (2003) [2], have been formulated to describe anisotropic plasticity using quadratic or non-quadratic yield functions. In this work, the focus is placed on the Hill (1948) quadratic yield criterion, widely recognized for its simplicity and robustness in representing the plastic anisotropy of rolled aluminum sheets. The Hill’48 model requires only six anisotropy parameters (F, G, H, L, M, N), which can be identified experimentally, making it both efficient and practical for engineering applications [35]. Its non-associated plasticity formulation allows differentiation between the yield surface and the plastic potential surface, leading to improved accuracy in simulating complex forming behavior.
The equivalent stress according to the Hill (1948) quadratic criterion is expressed as:
The evolution equations for the current problem are then presented as follows:
: Plastic multiplier, which aligns with the loading/unloading conditions:
Equation (6), along with the flow rule in Equations (12) and (13), provides:
3.2. Integration Algorithm
This section develops the mathematical formulation of the used algorithm that deals with the fully implicit backward Euler integration scheme. This numerical method is commonly used in elastoplastic problems due to its unconditional stability. The algorithm is strain-driven, meaning that the stress history is derived from the strain history. The total strain is updated using the following formula:
: Symmetric gradient
: Displacement increment along a time step .
The evolution equations in (12) and (13) can then be integrated to obtain:
By applying the elasticity relation in Equation (3) and the strain decomposition in Equation (2), the stress tensor is then:
where is the elastic trial stress. By applying Equations (18) and (19), the effective stress tensor is given by:
and finally
From Equations (4), (8), and (21), enforcing the consistency condition and ensuring the accuracy of the equivalent stress function simplifies the system to two scalar equations:
The plastic multiplier and the equivalent stress function are the unknowns of this system of equations.
The system of equations given in Equation (22) is solved using the Newton–Raphson iterative method. The governing equations for a single iteration step of this scheme are summarized in Table 1.

Table 1.
Local iteration: determination of by Newton’s method.
The rate form of the constitutive equations (Equations (12)–(15)) is integrated over the time increment using a fully implicit backward Euler scheme to obtain the incremental relations (Equations (16)–(22)). This numerical integration ensures a consistent transition from the continuum rate formulation to the discrete finite element implementation. The stress update follows an elastic predictor–plastic corrector approach (see Figure 7 and Table 2), where the trial stress is first computed elastically and then corrected by the return-mapping procedure to satisfy the yield surface at . The plastic potential and plastic multiplier are implicitly determined through the consistency condition, guaranteeing the stability and accuracy of the integration algorithm.
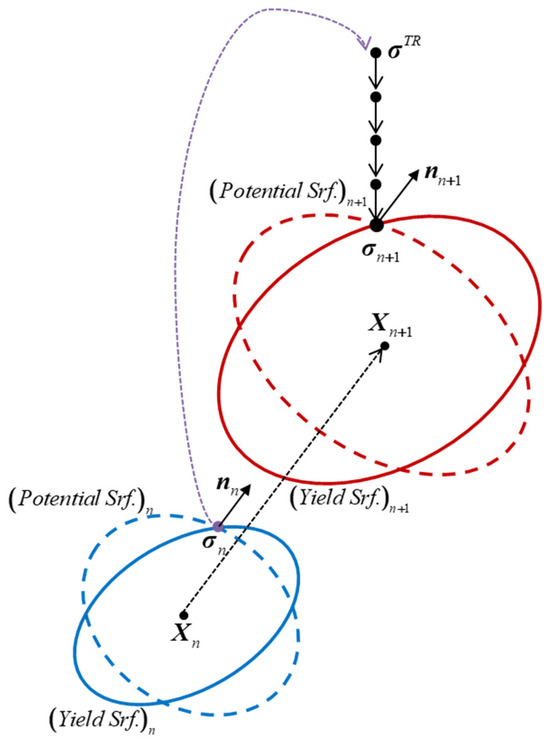
Figure 7.
Non-associated model with nonlinear isotropic–kinematic hardening.
Table 2.
Implicit integration of a non-associated anisotropic plasticity with nonlinear isotropic–kinematic hardening.
The mathematical formulations of the constitutive equations, including the yield function, plastic potential, flow rule, and mixed isotropic–kinematic hardening laws, are presented in detail in our previous works [30,35]. In the present study, these equations were implemented into the ABAQUS environment through a user-defined UMAT subroutine to capture the anisotropic elastoplastic behavior of the AA5083-aluminum alloy. The UMAT code integrates the constitutive relations at the material level using an incremental stress-update algorithm. For improved understanding and reproducibility, Figure 8 presents a flowchart summarizing the implementation methodology, outlining the key computational steps (initialization, stress prediction, return mapping, plastic correction, and update of internal variables) used during the finite element analysis.
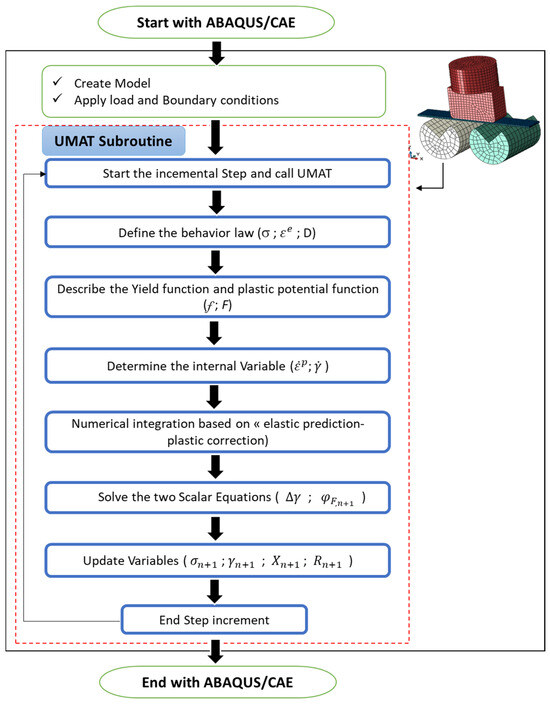
Figure 8.
Flow-chart illustrating material implementation methodology using the UMAT subroutine.
4. Accuracy of Numerical Model
The previously developed model has been integrated into ABAQUS using a user-defined subroutine known as UMAT. This section focuses on creating a numerical analysis to validate the anisotropic plasticity model, incorporating both nonlinear isotropic and kinematic hardening. Numerical examples used to demonstrate the effectiveness and accuracy of the proposed algorithm will be presented.
4.1. Cyclic Uniaxial Tension-Compression Loading
In this example, we perform a comparative analysis of linear versus nonlinear kinematic hardening models. We examine the behavior of a cubic sample with a side length of 5 units in a uniaxial tension-compression test. A uniform displacement is applied to the specimen’s top boundary, with appropriate boundary conditions imposed on the opposite side, following the test procedure outlined in [38]. The sample is represented by a single element, specifically C3D8, and the results are consistent across all integration points within the element. The material chosen for this numerical test is X5CrNi 18∙9, a chromium-nickel stainless steel material, as described in [38]. The plasticity model employed is J2 plasticity with kinematic hardening.
The simulation involves applying a loading program that subjects the specimen to tension-compression while gradually increasing the mean stress. Figure 9 illustrates the vertical displacement imposed on the top boundary of the specimen. Figure 10 presents stress–strain curves, providing a comparative analysis between linear kinematic hardening (LKH) behavior (b = 0) and nonlinear kinematic hardening (NLKH) behavior. The differences between these two kinematic hardening rule assumptions are clearly depicted. The idea here is to verify the accuracy of our model in reproducing results similar to those of other models such as that which was used in the work of Angelis [38]. It is worth noting that the results obtained using the proposed algorithm closely align with those reported in [38].
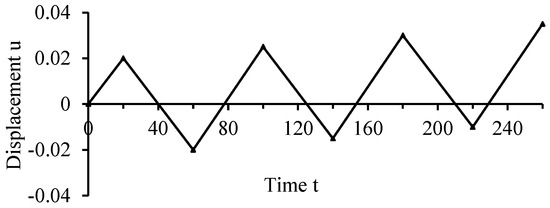
Figure 9.
Prescribed vertical displacement on the top boundary.
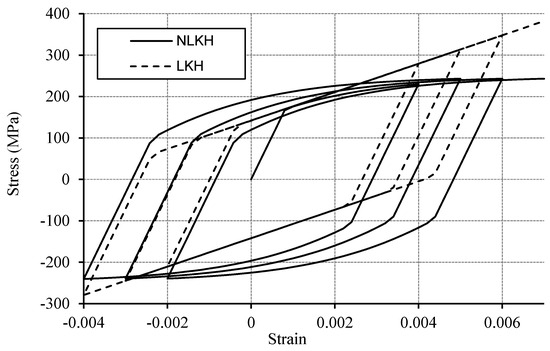
Figure 10.
Stress–strain curves for LKH and NLKH models for X5CrNi 18-9 steel.
4.2. Comparison of the Numerical and Experimental in a Cyclic Shearing Test
This section aims to evaluate the model’s precision in simulating the behavior of a shear sample under cyclic loading by comparing its predictions with experimental findings. The numerical simulations are carried out using FE method applied on ABAQUS 6.13 software, with the help of user-material subroutine UMAT used to implement the material behavior using the mathematical modeling presented in Section 3. These simulations focus on cyclic shearing to compute the kinematic hardening parameters of the 5083-aluminum alloy. The material properties and the isotropic hardening parameters are determined in [35]. Table 3 illustrates the elastoplastic and anisotropic parameters of 5083-aluminum alloy.
Table 3.
Elastoplastic and anisotropic parameters of 5083-aluminum alloy [35].
Table 4 presents the identified kinematic hardening parameters for the 5083-aluminum alloy. Figure 11 compares the experimental and numerical shear stress–shear strain curves obtained under tension–compression cyclic loading. The close agreement between the experimental measurements and the model predictions demonstrates the accuracy and reliability of the identified kinematic hardening parameters. It is important to note that the cyclic shear simulations shown in this section were conducted exclusively to calibrate the nonlinear kinematic hardening parameters (a and b) of the material, which were subsequently employed as input data for the U-bending simulations.
Table 4.
Predicted values of kinematic hardening parameters for 5083-aluminum alloy.
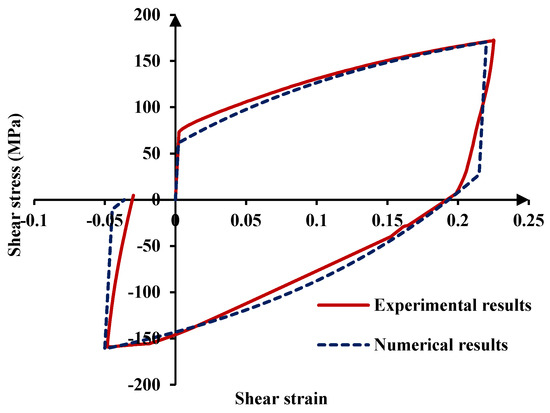
Figure 11.
Shear stress–shear strain curves of 5083 alloy.
4.3. Comparison of the Numerical and Experimental in U-Bending Test
To assess the current model’s performance under moderate strain, we conducted a U-bending test (refer to Figure 12) using a 5083-aluminum sheet. It should be noted that in the present simulation, an anisotropic material model based on a non-associated flow rule and nonlinear mixed isotropic–kinematic hardening was employed to accurately capture the elastoplastic behavior of the 5083-aluminum alloy. Consequently, the springback phenomenon was modeled as a nonlinear unloading process, inherently governed by the constitutive equations of the adopted model. The sheet dimensions were: thickness 2 mm, length 140 mm (in the rolling direction), and width 20 mm (in the transverse direction). The friction coefficient in the contact zone is assumed to be 0.1, and the total traveled punch stroke is 16 mm.
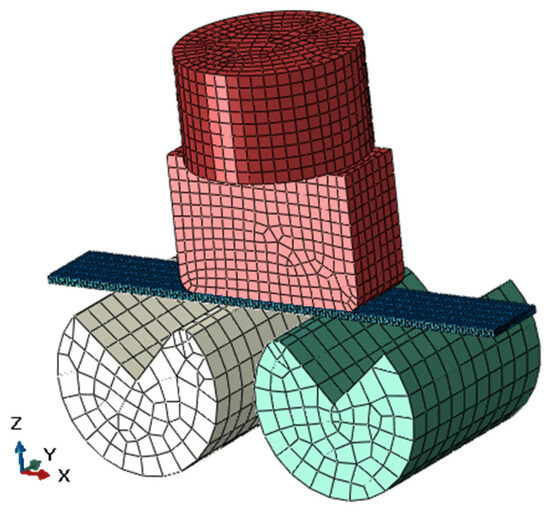
Figure 12.
Numerical assembly model of U-bending test.
The numerical simulations were carried out using ABAQUS/Standard, with the proposed anisotropic constitutive model incorporating nonlinear mixed isotropic–kinematic hardening, implemented through a user-defined UMAT subroutine. A mesh sensitivity analysis was performed to determine the optimal element size that ensures a balance between computational efficiency and solution accuracy. The AA5083 aluminum sheet was discretized using C3D8 elements, which are 8-node linear brick elements with reduced integration, providing reliable accuracy in capturing local stress and strain gradients while avoiding locking effects. The final mesh configuration consisted of 140 × 5 × 5 elements, verified to yield mesh-independent results (see Figure 13).
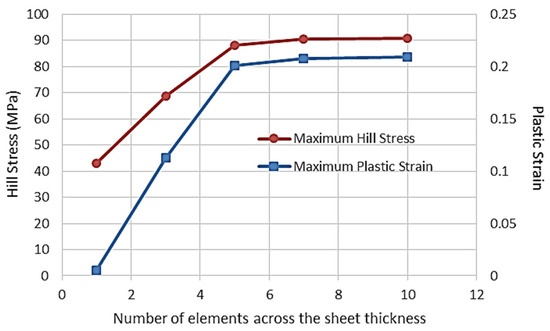
Figure 13.
Mesh sensitivity analysis.
The modeled sheet dimensions were 140 mm in length (rolling direction), 20 mm in width (transverse direction), and 2 mm in thickness, while the total punch stroke was set to 16 mm. The contact interactions between the forming tools and the sheet in the U-bending operation were modeled using a surface-to-surface contact formulation in ABAQUS with a penalty contact algorithm and a friction coefficient of 0.1. This method accurately represents contact pressure and sliding behavior without inducing artificial stress fluctuations. Detailed mechanical properties of the 5083-aluminum sheet are drawn in Table 3 and Table 4, while both the die and the punch were treated as rigid bodies.
As the punch descends, the blank undergoes elastic-plastic bending. Springback occurs when the tools are withdrawn. We compared the final shapes after springback, as determined by the present formulation, with the experimental results.
Figure 14 depicts the post-springback deformation and displays the springback angle in the sheet, as calculated using the combined nonlinear isotropic–kinematic hardening model. A comparison was made between the experimentally measured springback angle (2°) and the numerically derived angle (1.84°), which was obtained through the combined application of the Hill yield criterion and mixed isotropic–kinematic hardening. The results indicate that the numerical springback angle closely matches the experimental value.
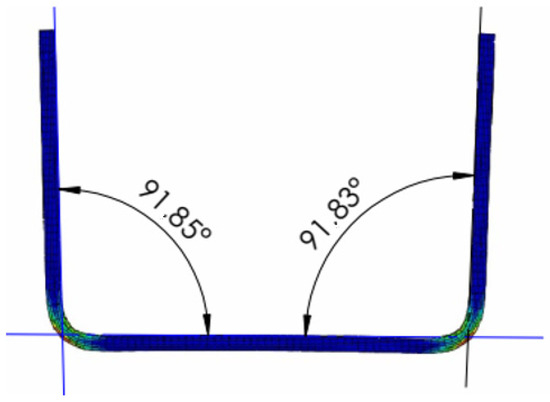
Figure 14.
Numerical deformed sheet after springback.
To evaluate the accuracy of the presented model, Figure 15 depicts and compares the force-displacement curves obtained from both experimental and numerical data. The force-displacement curves exhibit three distinct zones: the first zone demonstrates a sharp increase in force, reaching 2.6 kN, which causes deformation in the aluminum sheet; the second zone shows a stabilization of the punch force until the sheet is completely bent; and then the final zone begins with a rapid force increase. There was a strong correlation between the force-displacement curves, demonstrating the efficiency of the presented anisotropic model combined with nonlinear isotropic–kinematic hardening in simulating U-bending tests.

Figure 15.
Experimental and numerical Punch forces during U-bending test.
Figure 16 illustrates different steps of the U-bending test with Hill stress distributions and plastic strain fields.
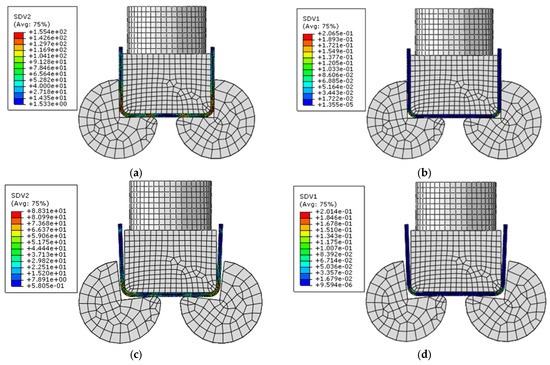
Figure 16.
Computed U-bending test. (a) Hill stress distribution at the end of the U-bending test; (b) Plastic strain field at the end of the U-bending test; (c) Hill stress distribution after the release phase of the U-bending test; (d) Plastic strain field after the release phase of the U-bending test.
4.4. Statistical Analysis and Optimization
DOE (Design of Experiments), developed as a systematic approach to planning experiments, is used to identify the influence of multiple variables on a response variable efficiently. It provides a structured method to evaluate the effects of input factors and their interactions, optimizing the experimental process and reducing the number of trials needed. In this study, sheet thickness (Th), punch speed (V), and sampling angle relative to the rolling direction (θ) are examined at different levels to assess their impact on folding force (F) and springback (SB). The strong agreement between experimental results and theoretical predictions confirms the accuracy and reliability of the proposed models in estimating folding force and springback.
Three U-bending factors are used at different levels as drawn in Table 5: sheet thickness, punch speed, and sampling angle relative to the rolling direction.
Table 5.
Input factors in U-bending tests.
To develop a comprehensive full factorial Design of Experiments (DOE) plan, a total of 27 tests were designed. Furthermore, these experiments are conducted twice to guarantee the reproducibility of the results. A designed experimental array, as presented in Table 6 and Table 7, was used to analyze the effects of these three parameters on springback and maximum folding force. The average (mean) value of the springback or folding force, denoted as Y, represents the sum of the observed response values obtained from the experiments, divided by the total number of experimental trials. This value is determined using Equation (23), which provides a quantitative measure of the central tendency of the response variable across all conducted experiments. We denote the yi: the outcome on the i-th specimen.
where n is the number of springback values per experiment (which is 3 in this case for each experiment).
Table 6.
DOE results for springback using full factorial design.
Table 7.
DOE results for folding force F using full factorial design.
For minimization of springback, or folding force the S/N ratio is typically calculated using the “smaller-the-better” criterion. Lower springback or folding force generally corresponds to a higher S/N ratio for the “smaller-the-better” case:
where
n is the number of experiments
yi is the springback or folding force value for the i-th experiment.
Figure 17 and Figure 18 illustrate the mean effect of input factors on springback and folding force, respectively. These figures are crucial for understanding how sheet thickness, orientation angle, and punch speed influence the outcomes of the bending process. The figures demonstrate that sheet thickness has a direct and significant impact on both springback (decreasing with thickness) and folding force (increasing with thickness). The orientation angle shows an inverse relationship with folding force and a direct relationship with springback. Punch speed generally leads to a slight increase in both springback and folding force. These findings are critical for optimizing U-bending processes, especially when aiming to minimize springback or manage forming forces.
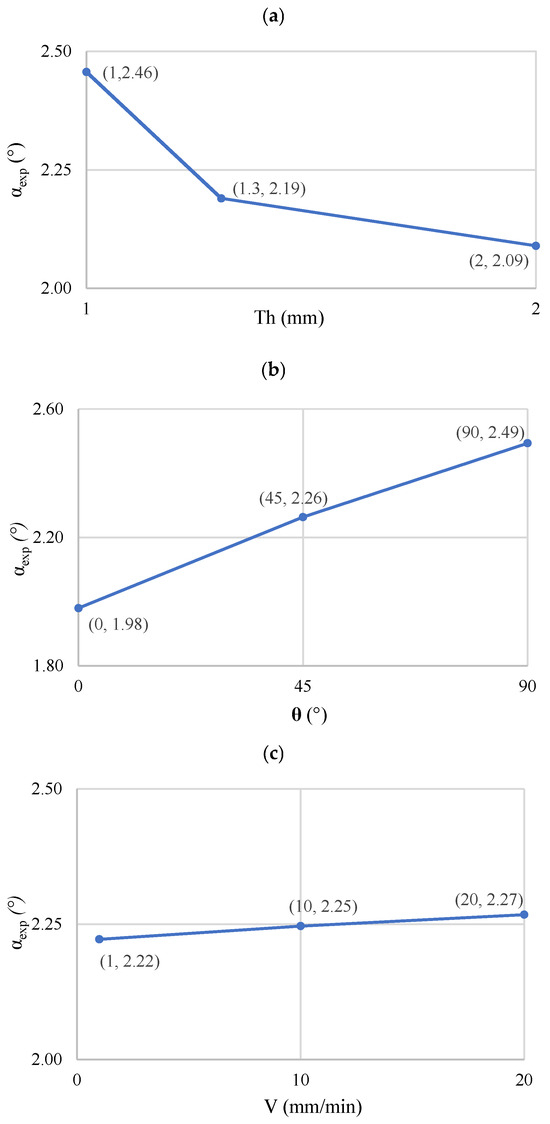
Figure 17.
Springback as function of (a) thickness; (b) orientation angle; and (c) punch speed.
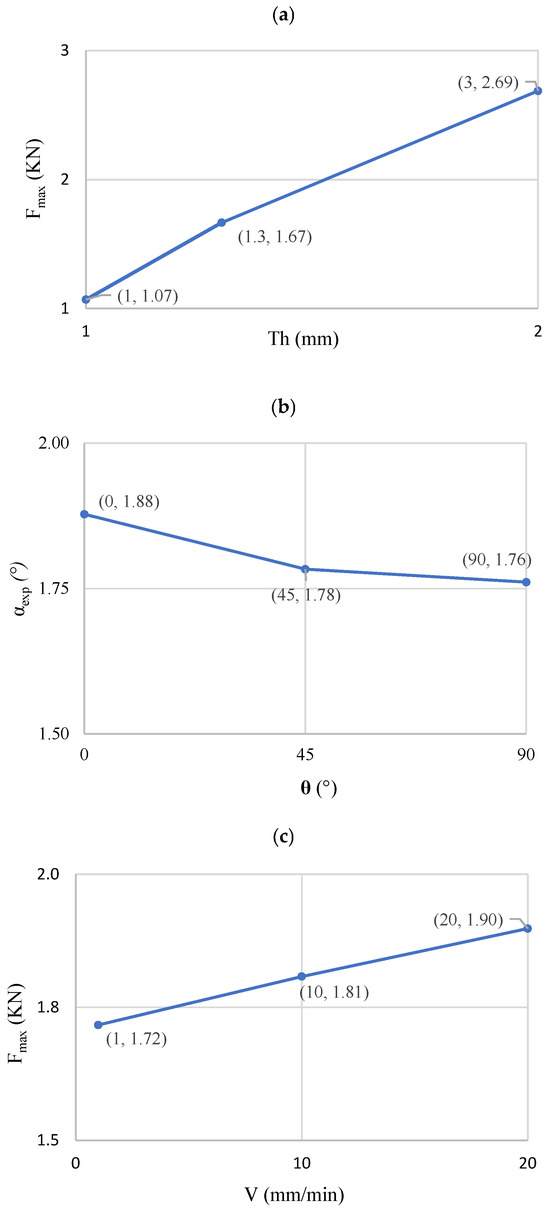
Figure 18.
Folding force as function of (a) thickness; (b) orientation angle; and (c) punch speed.
Figure 19 and Figure 20 present the surface plot of springback and folding force as function of thickness, orientation angle, and punch speed. One can note from the figures that the lowest springback is presented in the lower values of orientation angle and punch speed, and the highest sheet thickness. However, the folding force has the maximum reading when all the parameters are at their highest values.
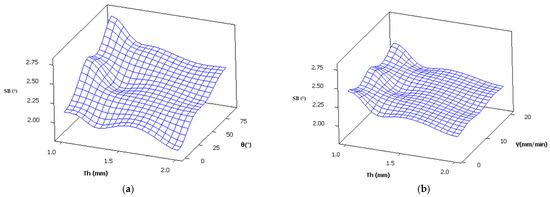
Figure 19.
Surface plot of springback vs. thickness, orientation angle, and punch speed. (a): V =10 mm/min; (b): θ = 45°.
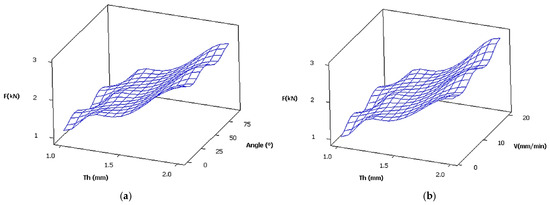
Figure 20.
Surface plot of folding force vs. thickness, orientation angle, and punch speed. (a): V = 10 mm/min; (b): θ = 45°.
The relationship between the factors and the performance measures is modeled by the following regression equations.
Experiment 3 has the highest S/N ratio of −5.2 with the lowest mean value of 1.95, indicating that this combination of factor levels (θ = 0°, Th = 2 mm, V = 1 mm/min) leads to the best performance in terms of minimizing springback. So, the best factor combinations corresponding to the highest S/N ratio (lowest springback) would be considered the optimal condition. Based on this, we would want to choose θ = 0°, Th = 2 mm, and V = 1 mm/min for the optimal result.
However, the better condition to reduce the forming force is for θ = 90°, Th = 1 mm, and V = 1 mm/min.
From this statistical analysis, it can be concluded that both the variation in sheet thickness and the orientation angle significantly influence springback. In contrast, the impact of punch speed on springback is minimal. Nevertheless, it is important to note that only the variation in sheet thickness has a substantial effect on the folding force, while the effects of punch speed and orientation angle are deemed negligible.
5. Conclusions
In the present work, an anisotropic constitutive model for sheet metal forming integrating the AFR method is presented. From the Hill’48 quadratic formulation, the yield and plastic potential functions were obtained. Furthermore, nonlinear mixed isotropic–kinematic hardening is incorporated into the model to better depict material behavior during deformation. UMAT subroutine in ABAQUS was used to develop the model, which allows accurate predictions of plasticity behavior and springback in sheet forming procedures.
The following are the research’s main conclusions:
- The suggested plasticity model under a non-associated flow rule shows good agreement with experimental results acquired under cyclic shear loading conditions; cyclic shear experiments have precisely established the kinematic hardening parameters for the 5083-aluminum alloy.
- A numerical analysis that assessed the springback angle using the U-bending test showed that the hardening and elastoplastic model could accurately predict springback in the U-bending process.
- The presented design of forming tools used in the U-bending process are efficient in avoiding the excessive springback highlighted in conventional bending processes using rigid U-die-punch tools. This new design for forming tools will benefit the sheet metal industry in the city of Hail and elsewhere around the world.
In conclusion, while the proposed model demonstrates strong predictive capability and provides promising results in accurately capturing the springback phenomenon in sheet metal forming, particularly for the U-bending process, several limitations warrant further investigation. The model’s reliance on the Hill’48 yield criterion may restrict its applicability to materials exhibiting different or more complex anisotropic behaviors. Therefore, exploring alternative anisotropic formulations could enhance accuracy, especially under non-proportional or multi-directional loading paths. Moreover, the current formulation, based on the Swift hardening law, does not explicitly account for strain rate sensitivity or temperature-dependent effects, which may become significant in high-speed or warm forming processes. Although the model performs well in U-bending and cyclic shear experiments, its validity should be further assessed under multiaxial stress states, cyclic load reversals, and thermomechanical conditions. Overall, the present work contributes valuable insights into anisotropic plasticity modeling and provides a promising framework for improving springback prediction in sheet metal forming. Future research will focus on extending the model to incorporate strain rate and temperature effects, validating it across a broader range of materials and forming configurations to ensure its robustness and industrial applicability.
Author Contributions
L.B.S.: Conceptualization, Methodology, Writing—Original Draft Preparation, Finding Acquisition. A.B.: Investigation, Writing—Original Draft. M.W.: Supervision, Writing—Review and Editing. T.K.: Software, Visualization. M.A.: Data Curation, Investigation. B.A.: Conceptualization, Methodology. S.A.: Writing—Original Draft, Investigation. W.R.: Software, Investigation, Visualization. All authors have read and agreed to the published version of the manuscript.
Funding
This research has been funded by Scientific Research Deanship at University of Ha’il-Saudi Arabia through project number IRP-24 003.
Institutional Review Board Statement
The article follows the guidelines of the Committee on Publication Ethics (COPE) and involves no studies on human or animal subjects.
Informed Consent Statement
Not applicable. The article involves no studies on humans.
Data Availability Statement
The original contributions presented in this study are included in the article. Further inquiries can be directed to the corresponding author.
Conflicts of Interest
The authors declare no conflicts of interest.
References
- Hill, R. A theory of the yielding and plastic flow of anisotropic metals. J. Mech. Phys. Solids 1948, 1, 19–30. [Google Scholar] [CrossRef]
- Barlat, F.; Yoon, S.; Huh, H.; Choi, S. A six-component yield function for metallic sheets. Int. J. Plast. 2003, 19, 529–554. [Google Scholar] [CrossRef]
- Jung, J.; Jun, S.; Lee, H.-S.; Kim, B.-M.; Lee, M.-G.; Kim, J.H. Anisotropic Hardening Behaviour and Springback of Advanced High-Strength Steels. Metals 2017, 7, 480. [Google Scholar] [CrossRef]
- Wang, C.; Li, D.; Meng, B.; Wan, M. Effect of Anisotropic Yield Functions on Prediction of Critical Process Window and Deformation Behavior for Hydrodynamic Deep Drawing of Aluminum Alloys. Metals 2020, 10, 492. [Google Scholar] [CrossRef]
- Ben Said, L.; Allouch, M.; Wali, M.; Dammak, F. Numerical Formulation of Anisotropic Elastoplastic Behavior Coupled with Damage Model in Forming Processes. Mathematics 2023, 11, 204. [Google Scholar] [CrossRef]
- Wu, B.; Wang, H.; Taylor, T.; Yanagimoto, J. A non-associated constitutive model considering anisotropic hardening for orthotropic anisotropic materials in sheet metal forming. Int. J. Mech. Sci. 2020, 169, 105320. [Google Scholar] [CrossRef]
- Zhang, Y.; Duan, Y.; Fu, P.; Qi, S.; Zhao, J. Constitutive modeling based on non-associated flow rule for anisotropic sheet metals forming. Mater. Today Commun. 2023, 37, 107086. [Google Scholar] [CrossRef]
- He, J.; Han, G.; Guo, C. Non-associated anisotropic plasticity of metal sheets based on the distortional concept. Thin-Walled Struct. 2021, 161, 107523. [Google Scholar] [CrossRef]
- Wu, B.; Ito, K.; Mori, N.; Oya, T.; Taylor, T.; Yanagimoto, J. Constitutive equations based on non-associated flow rule for the analysis of forming of anisotropic sheet metals. Int. J. Precis. Eng. Manuf.-Green Technol. 2020, 7, 465–480. [Google Scholar] [CrossRef]
- Hou, Y.; Min, J.; Lee, M.G. Non-associated and non-quadratic characteristics in plastic anisotropy of automotive lightweight sheet metals. Automot. Innov. 2023, 6, 364–378. [Google Scholar] [CrossRef]
- Hou, Y.; Min, J.; Lin, J.; Lee, M.G. Modeling stress anisotropy, strength differential, and anisotropic hardening by coupling quadratic and stress-invariant-based yield functions under non-associated flow rule. Mech. Mater. 2022, 174, 104458. [Google Scholar] [CrossRef]
- Hou, Y.; Du, K.; Abd El-Aty, A.; Lee, M.G.; Min, J. Plastic anisotropy of sheet metals under plane strain loading: A novel non-associated constitutive model based on fourth-order polynomial functions. Mater. Des. 2022, 223, 111187. [Google Scholar] [CrossRef]
- Song, Y.J.; Oh, I.S.; Hwang, S.H.; Choi, H.; Lee, M.-G.; Kim, H.J. Numerically Efficient Sheet Metal Forming Simulations in Consideration of Tool Deformation. Int. J. Automot. Technol. 2021, 22, 69–79. [Google Scholar] [CrossRef]
- Trzepiecinski, T.; Lemu, H.G. Effect of Computational Parameters on Springback Prediction by Numerical Simulation. Metals 2017, 7, 380. [Google Scholar] [CrossRef]
- Won, C.; Kim Hg Lee, S.; Kim, D.; Park, S.; Yoon, J. Wrinkling prediction for GPa-grade steels in sheet metal forming process. Int. J. Adv. Manuf. Technol. 2019, 102, 3849–3863. [Google Scholar] [CrossRef]
- Ben Said, L.; Wali, M. Accuracy of Variational Formulation to Model the Thermomechanical Problem and to Predict Failure in Metallic Materials. Mathematics 2022, 10, 3555. [Google Scholar] [CrossRef]
- Li, J.-C.; Li, C.; Zhou, T.-G. Thickness distribution and mechanical property of sheet metal incremental forming based on numerical simulation. Trans. Nonferrous Met. Soc. China 2012, 22, 54–60. [Google Scholar] [CrossRef]
- Spathopoulos, S.C.; Stavroulakis, G.E. Springback Prediction in Sheet Metal Forming, Based on Finite Element Analysis and Artificial Neural Network Approach. Appl. Mech. 2020, 1, 97–110. [Google Scholar] [CrossRef]
- Kut, S.; Pasowicz, G.; Stachowicz, F. On the Springback and Load in Three-Point Air Bending of the AW-2024 Aluminium Alloy Sheet with AW-1050A Aluminium Cladding. Materials 2023, 16, 2945. [Google Scholar] [CrossRef]
- Serier, M.; Bendaoudi, S.-E.; Mansour, D.-L.B.; Tabti, A. Numerical modelling of springback behavior in folding process. Adv. Mater. Res. 2019, 8, 75–81. [Google Scholar] [CrossRef]
- Wasif, M.; Fatima, A.; Ahmed, A.; Iqbal, S.A. Investigation and Optimization of Parameters for the Reduced Springback in JSC-590 Sheet Metals Occurred During the V-Bending Process. Trans. Indian Inst. Met. 2021, 74, 2751–2760. [Google Scholar] [CrossRef]
- Ling, Y.E.; Lee, H.P.; Cheok, B.T. Finite element analysis of springback in L-bending of sheet metal. J. Mater. Process. Technol. 2005, 168, 296–302. [Google Scholar] [CrossRef]
- Chatti, S. Effect of the elasticity formulation in finite strain on springback prediction. Comput. Struct. 2010, 88, 796–805. [Google Scholar] [CrossRef]
- Laurent, H.; Greze, R.; Oliveira, M.C.; Menezes, L.F.; Manach, P.Y.; Alves, J.L. Numerical study of springback using the split-ring test for an AA5754 aluminum alloy. Finite Elem. Anal. Des. 2010, 46, 751–759. [Google Scholar] [CrossRef]
- Oliveira, M.C.; Alves, J.L.; Chaparro, B.M.; Menezes, L.F. Study on the influence of work-hardening modeling in springback prediction. Int. J. Plast. 2007, 23, 516–543. [Google Scholar] [CrossRef]
- Lee, M.G.; Kim, D.; Kim, C.; Wenner, M.L.; Wagoner, R.H.; Chung, K. A practical twosurface plasticity model and its application to spring-back prediction. Int. J. Plast. 2007, 23, 1189–1212. [Google Scholar] [CrossRef]
- Yoon, J.W.; Barlat, F.; Chung, K.; Pourboghrat, F.; Yang, D.Y. Earing prediction based on asymmetric non-quadratic yield function. Int. J. Plast. 2000, 16, 1075–1104. [Google Scholar] [CrossRef]
- Vladimirov, I.N.; Pietryga, M.P.; Reese, S. Prediction of springback in sheet forming by a new finite strain model with nonlinear kinematic and isotropic hardening. J. Mater. Process. Technol. 2009, 209, 4062–4075. [Google Scholar] [CrossRef]
- Toros, S.; Polat, A.; Ozturk, F. Formability and springback characterization of TRIP800 advanced high strength steel. Mater. Des. 2012, 41, 298–305. [Google Scholar] [CrossRef]
- Wali, M.; Chouchene, H.; Ben Said, L.; Dammak, F. One-equation integration algorithm of a generalized quadratic yield function with Chaboche non-linear isotropic/kinematic hardening. Int. J. Mech. Sci. 2015, 92, 223–232. [Google Scholar] [CrossRef]
- Satonkar, N.; Gopalan, V. Simulation of Electromagnetic Forming Process and Optimization of Geometric Parameters of Perforated Al Sheet Using RSM. Mathematics 2023, 11, 1983. [Google Scholar] [CrossRef]
- Tang, X.; Wang, Z.; Deng, L.; Wang, X.; Long, J.; Jiang, X.; Jin, J.; Xia, J. A Review of the Intelligent Optimization and Decision in Plastic Forming. Materials 2022, 15, 7019. [Google Scholar] [CrossRef] [PubMed]
- Zhang, H.; Wei, W.; Long, S.; Zhou, M.; Li, C. Optimization of Stamping Process Parameters for Sustainable Manufacturing: Numerical Simulation Based on AutoForm. Sustainability 2025, 17, 341. [Google Scholar] [CrossRef]
- Miyauchi, K. A proposal for a planar simple shear test in sheet metals. Sci. Pap. Inst. Phys. Chem. Res. 1984, 78, 27–40. [Google Scholar]
- Bouhamed, A.; Mars, J.; Jrad, H.; Wali, M.; Dammak, F. Experimental and numerical methodology to characterize 5083-aluminium behavior considering non-associated plasticity model coupled with isotropic ductile damage. Int. J. Solids Struct. 2021, 229, 111139. [Google Scholar] [CrossRef]
- Chaboche, J.L. Time-independent constitutive theories for cyclic plasticity. Int. J. Plast. 1986, 2, 149–188. [Google Scholar] [CrossRef]
- Hosford, W.F. A generalized isotropic yield criterion. J. Appl. Mech. 1972, 39, 607–609. [Google Scholar] [CrossRef]
- Angelis, F.D. A Comparative Analysis of Linear and Nonlinear Kinematic Hardening Rules in Computational Elastoplasticity. Tech. Mech. 2012, 32, 164–173. [Google Scholar]
Disclaimer/Publisher’s Note: The statements, opinions and data contained in all publications are solely those of the individual author(s) and contributor(s) and not of MDPI and/or the editor(s). MDPI and/or the editor(s) disclaim responsibility for any injury to people or property resulting from any ideas, methods, instructions or products referred to in the content. |
© 2025 by the authors. Licensee MDPI, Basel, Switzerland. This article is an open access article distributed under the terms and conditions of the Creative Commons Attribution (CC BY) license (https://creativecommons.org/licenses/by/4.0/).