Abstract
The difficulty in precisely extracting single-fault signatures from hydraulic pump composite faults, which stems from structural complexity and coupled multi-source vibrations, is tackled herein via a new diagnostic technique based on underdetermined blind source separation (UBSS). Utilizing sparse component analysis (SCA), the proposed method achieves blind source separation without relying on prior knowledge or multiple sensors. However, conventional SCA-based approaches are limited by their reliance on a predefined number of sources and their high sensitivity to noise. To overcome these limitations, an adaptive source number estimation strategy is proposed by integrating information–theoretic criteria into density peak clustering (DPC), enabling automatic source number determination with negligible additional computation. To facilitate this process, the short-time Fourier transform (STFT) is first employed to convert the vibration signals into the frequency domain. The resulting time–frequency points are then clustered using the integrated DPC–Bayesian Information Criterion (BIC) scheme, which jointly estimates both the number of sources and the mixing matrix. Finally, the original source signals are reconstructed through the minimum L1-norm optimization method. Simulation and experimental studies, including hydraulic pump composite fault experiments, verify that the proposed method can accurately separate mixed vibration signals and identify distinct fault components even under low signal-to-noise ratio (SNR) conditions. The results demonstrate the method’s superior separation accuracy, noise robustness, and adaptability compared with existing algorithms.
1. Introduction
The hydraulic system is extensively employed in industrial applications, and as its core component, the hydraulic pump plays a vital role in determining overall system performance. The axial piston pump features a complex structure in which vibration signals are simultaneously influenced by mechanical and hydraulic excitations. Most existing studies on hydraulic pump fault diagnosis focus primarily on single-fault conditions. However, when compound faults occur, the measured vibration signals become a superposition of multiple fault sources. The strong coupling among these sources complicates the accurate extraction of individual fault features, leading to diagnostic uncertainty. Conventional frequency- and envelope-spectrum analysis methods depend on identifying characteristic fault frequencies in the spectral domain. When fault intensities differ significantly, weak fault signatures are easily masked by dominant components or noise, thereby reducing diagnostic accuracy.
As a contemporary signal processing technique, Blind Source Separation (BSS) recovers original sources from their mixtures without requiring prior knowledge of the sources or mixing process [1]. Compared with other approaches such as blind deconvolution, envelope analysis, and cyclic spectral analysis, BSS requires no predefined assumptions regarding the mixing model or feature distributions [2,3,4]. This characteristic makes it particularly effective in compound fault scenarios characterized by multiple overlapping sources, strong coupling, and unknown transfer paths. In this study, a Sparse Component Analysis (SCA)-based BSS approach is employed, which leverages the sparsity of impulsive fault features in time–frequency (TF) domain to separate the single-fault vibration component effectively. This enables the independent extraction of fault-related signatures from complex mixed signals.
BSS has been widely investigated and applied across various fields, including speech enhancement [5], image processing [6], and fault diagnosis [7]. Independent Component Analysis (ICA) ranks among the most prevalent algorithms within the conventional BSS framework. ICA effectively separates statistically independent signals within a mixture. However, it is limited to situations where the number of observed signals is greater than or equal to the number of sources [8]. In practical engineering applications, sensor deployment is often constrained by space and cost, while the number of vibration sources typically exceeds the number of sensors, forming an Underdetermined Blind Source Separation (UBSS) problem. Furthermore, the number of vibration sources is often unknown, making it challenging for conventional BSS methods to achieve accurate separation [9]. Therefore, there is an urgent need for advanced algorithms capable of solving the UBSS problem with a limited number of sensors.
In recent years, SCA has garnered increasing research interest for its capacity to directly determine the mixing matrix and reconstruct the original sources solely from the observed mixture, eliminating the need for any prior information. By exploiting signal sparsity, SCA has demonstrated superior performance compared with traditional BSS techniques, particularly in modal identification [10]. Most approaches for solving UBSS problems follow a two-step SCA framework [11], where the mixing matrix is first estimated from the observed signals, followed by source signal reconstruction. Unlike conventional BSS methods that rely on statistical independence, SCA utilizes signal sparsity in the time or transformed domains for separation.
For signals exhibiting sparsity in the time domain, the acquired mixed observations become amenable to direct processing [12]. This means that only a few time points contain nonzero source contributions, while most remain inactive. However, many real-world signals do not satisfy this sparsity assumption in the time domain, making sparsity enhancement essential for SCA-based UBSS. To address this limitation, Xie et al. applied a wavelet transform to enhance signal sparsity before separation, though the method performs effectively only under additive white Gaussian noise [13]. Owing to the strong dependence of UBSS on sparsity, the observed signals are commonly transformed into the time–frequency domain using the Short-Time Fourier Transform (STFT), a method favored for its computational efficiency and robustness [14]. To achieve higher sparsity, researchers have explored advanced TF analysis techniques. For example, Li et al. employed the Synchro Extracting Transform (SET) to enhance sparsity for rolling bearing fault diagnosis, which effectively separates complex signals but may introduce artificial TF components or overlook transient features [15]. Similarly, Ding et al. used the Synchro Squeezing S-Transform (SSST) to increase sparsity, but its performance depends strongly on signal modulation modes and remains sensitive to noise [16]. Another critical procedure within the UBSS framework involves precisely determining the mixing matrix. Hassan et al. proposed an adaptive TF thresholding method to improve estimation accuracy, but their approach cannot automatically determine the number of sources [17].
A Single Source Point (SSP) refers to a TF point dominated by a single source component. Reju et al. introduced an SSP identification method that assesses the directional consistency between the real and imaginary components within Fourier transform coefficient vectors derived from observed signals, thereby reducing dependence on overall signal sparsity [18]. SSPs exhibit strong clustering behavior, corresponding to the columns of the mixing matrix. Once a sufficient number of SSPs are identified, clustering them enables accurate estimation of the mixing matrix. Since source recovery depends on the first-stage output, precise mixing matrix estimation is essential for reliable separation [19]. However, in practical applications, noise and environmental uncertainty can cause useful SSPs to be discarded or false SSPs to be introduced [20]. To improve robustness, Zhu et al. developed a two-stage SSP selection approach combining a cosine angle algorithm with L1-norm optimization, which enhances SSP extraction accuracy and noise tolerance [21]. Likewise, Zhen et al. utilized pairwise relationships among TF mixture representations to identify SSPs, achieving strong noise robustness [22]. These studies have significantly advanced the precision and stability of mixing matrix estimation in UBSS.
However, a critical prerequisite implicit in most advanced SCA methods is prior knowledge of the number of sources. Inaccurate estimation of this number typically leads to erroneous mixing matrix estimation [23]. Several researchers have attempted to address this issue. Zhong et al. developed an approach that integrates ensemble empirical mode decomposition, correlation coefficients, and adaptive singular value decomposition for the joint estimation of source quantity [24]. However, the precision of this technique is partially influenced by the specific signal decomposition method used. Wang et al. developed a sparse component analysis method based on linear clustering for UBSS of rolling bearing vibration signals [25], while another study by Wang et al. proposed a two-stage clustering approach combining hierarchical and K-means clustering for composite fault diagnosis in reciprocating compressors [26]. Although K-means is computationally efficient, its sensitivity to initial cluster centers limits its applicability in UBSS. In practical applications, employing these clustering algorithms to estimate the mixing matrix typically presupposes that the source count is known, or alternatively, depends on supplementary techniques for source number estimation. Ma et al. proposed estimating the source number by calculating the angular probability distribution of scatter points and the energy sum in the TF domain based on sparsity [27]. However, their method depends on subjectively identifying “small peaks” in these metrics, which restricts its practical utility. Gao et al. attempted to mitigate K-means’ sensitivity to initialization by integrating the Quantum Archimedes Optimization Algorithm [28]. While this approach alleviates initialization issues, it introduces significant computational cost and additional hyperparameter tuning. In contrast, Rodriguez and Laio proposed the DPC algorithm—a simple yet effective method capable of identifying arbitrarily shaped clusters without pre-specifying the number of classes [29]. DPC can intuitively determine the number of clusters, is robust to outliers, and operates with minimal parameter tuning, making it particularly suitable for UBSS tasks.
This study presents a novel mixing matrix estimation technique that synergistically integrates the Bayesian Information Criterion (BIC) with DPC. The proposed approach enables the simultaneous and automatic determination of both the source count and the mixing matrix, effectively reducing dependency on manually configured parameters. The proposed UBSS framework first transforms dual-channel observation signals into the TF domain and extracts high-energy SSPs. These points are then clustered using the DPC–BIC combination to jointly estimate the source count and mixing matrix. Finally, source signals are recovered in the TF domain via L1-norm minimization and transformed back to the time domain using the inverse short-time Fourier transform (ISTFT). The effectiveness of the proposed method is validated through both signal simulation and composite fault experiments on an axial piston pump.
The main contributions of this work are as follows:
- (1)
- This work develops an adaptive UBSS framework through the integration of DPC and BIC. This synergy facilitates the automatic and simultaneous identification of both the source count and mixing matrix, eliminating the necessity for prior knowledge.
- (2)
- The proposed approach enhances the robustness of SCA under noisy and underdetermined conditions.
- (3)
- The method is successfully applied to composite fault diagnosis of axial piston pumps, effectively separating multiple fault sources and providing a reliable basis for further fault identification.
2. UBSS
2.1. SCA
BSS refers to the process of using the observed signal x(t) to recover each component of the source signal when the source signal s(t) and transmission channel parameter A are unknown according to the statistical characteristics of the source signal. According to the mixing mode of source signals, it can be divided into linear instantaneous mixing, convolution mixing and nonlinear mixing. In this paper, BSS based on linear instantaneous mixing mode is studied, and its mathematical model is as follows:
where is N source signals, represents the sampling point of the ith source signal at time t, and is M mixing signals. Matrix is the transfer function matrix of , and is the ith column vector. The primary objective of SCA is to recover underlying source signals from their mixtures under the constraint of sparsity, without prior knowledge of either the mixing matrix or the source signals themselves. Georgiev et al. established and validated two key hypotheses, demonstrating that SCA can achieve complete signal reconstruction within the BSS framework [30]:
- (1)
- Any submatrix of size m × m in mixing matrix A is of full rank.
- (2)
- The source signal matrix sparsity is at least n − m + 1, and some TF points (t, f) in each source signal are only dominant, such as ,.
This paper focuses on addressing the UBSS scenario, characterized by a greater number of source signals than available observed mixtures. Although BSS generally suffers from permutation and scaling ambiguities—leading to inconsistencies in the order and amplitude between the estimated and original source signals—meaningful characteristic information of each source can still be extracted from the waveform of the separated signals.
2.2. Sparse Domain Transform
The sparsity of the signal can be improved by transferring the observed signal from the time domain to the TF domain. Equation (1) can be expressed as follows:
where and are the coefficients after the STFT of x(t) and s(t), respectively.
Selecting SSPs from the TF domain serves to linearize the scatter plot, thereby enhancing the precision of the mixing matrix estimation. At a certain time, only one source signal plays a major role, while other source signals are zero or close to zero, such a TF interval is called a single-source TF point. At any TF point , if only the nth source signal is active, then Equation (2) can be written as follows:
By opening the real and imaginary parts of Equation (3), we obtain the following:
Furthermore, from Equation (4), the following can be obtained:
where represents the element in the nth column of the ith row of the mixing matrix A.
From Equation (5), it can be observed that at the TF points, only the nth source signal is active. The absolute directions of the real and imaginary parts of the mixing signal are equal and are denoted as , corresponding to the column direction of the mixing matrix. The core idea of SCA for mixing matrix estimation is to leverage the linear clustering behavior of mixed signals in the TF domain and apply clustering algorithms to estimate these directional slopes, thereby recovering each column of the mixing matrix and ultimately reconstructing the full matrix.
The detection of SSPs relies on two key assumptions:
- (1)
- For every source, there exists a sufficient number of TF points where its energy is dominant.
- (2)
- All columns of the mixing matrix exhibit distinct absolute directions.
In the TF domain, point of a mixing signal is an SSP only when the absolute directions of and are the same, otherwise it is a multi-source point. But in practice, the ideal probability of SSP is very low. Therefore, if the conditions of SSP are relaxed, the point where the proportion of one source component is significantly higher than that of other source components on the TF domain plane is considered an SSP when the difference between the absolute directions of and is less than , the point is considered an SSP. The SSP discrimination method is shown as follows:
where . The was adjusted to ensure a balance between reliable source sparsity estimation and noise suppression. Reference [26] suggested .
In the scatter plot of observed signals, each directional cluster is uniquely associated with a specific column vector from the mixing matrix. In general, these column vectors align with the directions of high-energy data points in the observed signal, whereas low-energy points are more susceptible to noise, introducing significant interference into the estimation process. To mitigate this, low-energy TF points are excluded based on Equation (7). The energy-based threshold is determined according to the statistical characteristics of the signal energy distribution, effectively suppressing the influence of weak noise components on separation accuracy. The parameter ε is typically chosen within the range of 0.05 to 0.2 [16,21].
According to Equation (5), at TF points dominated by a single source, the real and imaginary parts of the observed signal share the same absolute direction. In this study, only the real part of the signal is used for scatter plot clustering. The mixed signal is normalized and mapped to the right semicircle using the following formula:
where represents the TF point of the first observed signal of , and represents the Euclidean norm.
2.3. DPC
Under sparsity assumptions, the observed signal data in the frequency domain form linear clusters that radiate from the origin. The directional vector characterizing each such line aligns with a specific column in the mixing matrix. Following normalization onto a unit circle, these scatter points are amenable to clustering. The centroid of each resulting group then serves as an estimator for a corresponding column of the mixing matrix. To accomplish this clustering task, the DPC algorithm is employed in this study.
DPC operates based on two fundamental assumptions:
- (1)
- Cluster centers are identified by their significantly higher local density relative to their surrounding neighbors.
- (2)
- Different cluster centers are sufficiently distant from each other.
Set as a set of K single source points normalized to the unit circle:
The DPC steps are as follows:
- (1)
- Calculate the distance between and . Since this paper aims to cluster points on the unit circle, the distance calculation method is chosen as follows:
- (2)
- Calculate the local density for eachwhere if ; otherwise, . is the critical value. In fact, corresponding to is equal to the number of points whose distance is smaller than . The robustness of DPC to has been studied in the literature [29], and its average number of near neighbors’ accounts for about 1–2% of the total number. In this paper, the value at 2% of the total number after the ascending order of distance is taken.
- (3)
- Arrange the local density values of all points in descending order, and calculate the minimum distance between point and a point with a higher density than it:
- (4)
- A decision graph is drawn with local density and minimum distance as horizontal and vertical coordinates. The local density and the minimum distance can be obtained from each point according to the distance, and the two-dimensional scatter plot can be made to intuitively obtain the point with relatively large and as the cluster center.
- (5)
- Allocate the remaining points. Each remaining point is assigned to the cluster of data points that are closest neighbors and denser than it.
2.4. Mixing Matrix Estimation
Correctly determining the source count is essential, as this parameter critically influences the accuracy of both the mixing matrix derivation and the ensuing signal separation process. In the application of DPC for source number estimation, although the point and are relatively large in the decision graph can be manually selected as the clustering center, it cannot be automatically identified. In [31], a new decision graph is constructed by using Weibull distribution function, so that only one threshold value is needed to obtain the cluster center. In this paper, we integrate DPC with the BIC to jointly and automatically estimate the number of sources and clusters, effectively overcoming the common limitation of DPC and similar clustering methods that require prior knowledge of the cluster count. Furthermore, reference [29] introduced an additional decision index γ, defined as follows:
where and are the local density and minimum distance obtained via Equations (11) and (12), respectively.
When the number of clusters is K, there will be K values of that are far greater than other values, but the threshold still needs to be set manually. To prevent a small number of discrete points from forming their own class, is introduced. is the maximum local density. The influence of discrete values is eliminated as follows:
The Minka Bayesian Selection (MIBS) model is a more effective real dimension estimation model. The goal of th MIBS based on BIC is to find a number that maximizes the cost function:
BIC can analyze non-Gaussian signals [32], and MIBS can be approximated by the BIC:
where , , is the ith eigenvalue, and is the number of non-zero eigenvalues.
The of each eigenvalue is calculated, and the value corresponding to the maximum BIC value is the estimate of the source number. After the cluster center is obtained and all SSPS are assigned to each cluster, the index of single source points in the ith cluster is , and the center of the ith cluster is expressed as follows:
The resulting cluster center is the mixing matrix:
2.5. Source Signal Recovery
The mixing matrix can be obtained by clustering method, but the mixing matrix A is irreversible in UBSS, so it is not possible to invert A directly according to formula and then obtain the source signal. However, the source signal recovery is still very difficult. For the case of sparse signals, the minimum L1-norm solution can be found, which can be decomposed into solving linear programming problems:
Assuming that the mixing matrix A is -dimensional, define D to be the set of all -dimensional submatrices of A:
where is the ith submatrix and is the jth column vector in A. Calculate the minimum basis vector for each TF point :
Assuming that is the result of Equation (21), the source signal at TF point can be constructed as follows:
where . is the inverse of . After obtaining the source signal TF vector of each TF point, it is transferred from TF domain to time domain through ISTFT, and the source signal is finally obtained. The complete procedure for recovering source signals from sensor-measured mixtures is illustrated in Figure 1.
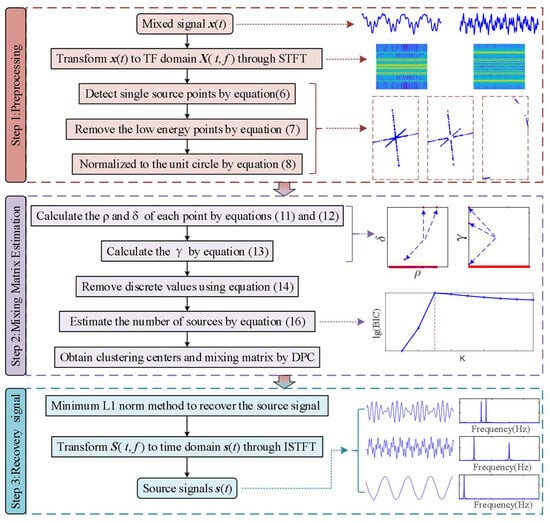
Figure 1.
Flow chart of proposed algorithm.
3. Simulation Experiment
The computer used in this paper is configured as follows: Intel(R) Core (TM) i9-10900KF CPU @3.70GHz, 64GB RAM, Windows 10 OS, MATLAB R2023a. The constructed simulation signal s(t) is shown in Equation (23), which contains 6 independent source signals. Set the sampling frequency to 1024 Hz and sampling number to 1024.
A random mixing matrix A is constructed, as shown in Equation (24), and mixing signal x(t) is obtained through . Finally, the mixture was contaminated with 0dB SNR additive white Gaussian noise. Figure 2 shows the time domain waveform diagram and spectrum diagram of two mixing signals and . Characteristic frequencies and the quantity of source signals are not directly accessible through frequency domain analysis.
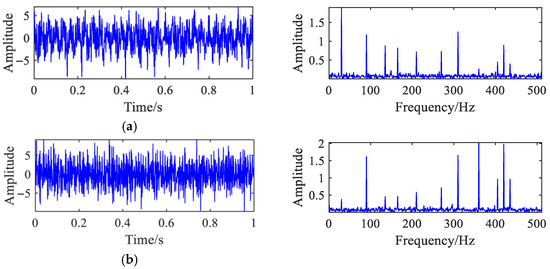
Figure 2.
Mixing signal waveform diagram and spectrum diagram. (a) Mixing signal . (b) Mixing signal .
The proposed method was employed for signal separation. As shown in Figure 3a, which displays the time domain scatter plot of the mixed signals, no distinct directional clusters can be discerned. The mixed signals and were transformed from the time domain to the TF domain via the STFT, resulting in TF representations and . A Hanning window of length 256 with an overlap of 250 samples was used for the STFT. Figure 3b displays the TF scatter plot of the mixed signals, in which some directional patterns emerge, albeit with limited clarity. Subsequently, SSP detection and low-energy point removal were performed using Equations (6) and (7), with the SSP detection threshold set to and the low-energy threshold set to . Figure 3c shows the TF scatter plot after these processing steps. The directional characteristics in the TF domain are notably enhanced. The scatter points were then normalized onto a semicircle, as illustrated in Figure 3d. DPC was further employed to group the normalized TF points. The resulting decision graph is shown in Figure 3e. However, the standard DPC algorithm does not automatically select points with high values of both and . To address this, the top 10 values obtained from Equation (13) were substituted into Equation (16) as candidate values for . The corresponding source number estimation graph is presented in Figure 3f. The value of K corresponding to the maximum log-likelihood of the BIC was selected as the estimated number of sources. Once the number of sources (i.e., clusters) was determined by BIC, the final clustering result was obtained, as shown in Figure 3g. The red points denote the cluster centers, which correspond to the columns of the estimated mixing matrix.
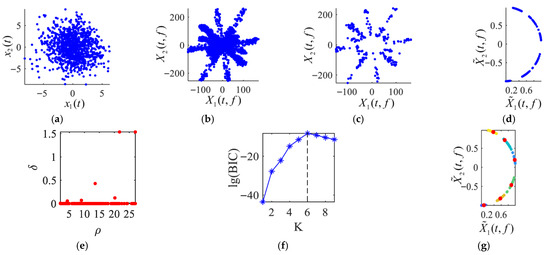
Figure 3.
Process diagram of mixing matrix estimation. (a) Time domain scatter plot; (b) TF scatter plot; (c) scatter plot after preprocessing; (d) normalized scatter plot; (e) decision graph; (f) source number estimation graph; (g) clustering result graph.
Table 1 shows the maximum 10 values obtained by this algorithm when 6 source signals are mixed. The BIC is employed to automatically determine the source count, thereby validating the efficacy of the source number estimation method introduced in this work. The number of sources in Equation (23) is selected as 3, 4 and 5, respectively. A random mixing matrix A is constructed to mix the source signals and obtain two mixing signals. Figure 4 shows the source number estimation when the source number is 3–5. The K value at the maximum lg(BIC) represents the source number estimate. All the sources are correctly counted.

Table 1.
Value of when number of sources is 6.

Figure 4.
Source number estimation graph. (a) The source signal is . (b) The source signal is . (c) The source signal is .
When the number of sources is 6, the mixing signal is separated by using the algorithm presented in this paper. Firstly, the mixing matrix is estimated, and then the source signal is recovered by the minimum L1-norm method according to the mixing matrix. The estimated source signal time domain waveform and spectrum are shown in Figure 5, where represents the estimate of the source signal .
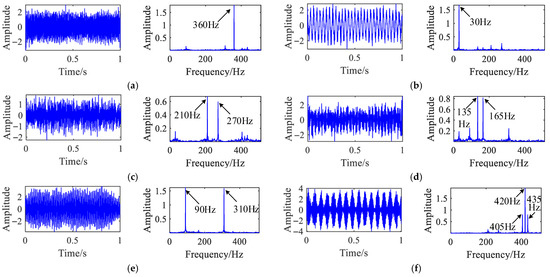
Figure 5.
Time domain waveform and spectrum diagram of recovery signal. (a) The first separated signal. (b) The second separation signal. (c) The third separation signal. (d) The fourth separation signal. (e) The fifth separation signal. (f) The sixth separation signal.
The Pearson correlation coefficient is defined as follows:
The correlation coefficients between the recovered and original source signals are computed, yielding the following matrix:
Matrix entries highlighted in bold indicate the correlation values between each of the six original sources and their corresponding separated signals. These values quantitatively demonstrate the superior performance of the proposed method in underdetermined blind source separation, indicating a strong correlation between the recovered and source signals. The proposed algorithm not only accurately estimates the number of sources but also successfully separates all six source signals. By integrating BIC with DPC, our clustering approach effectively overcomes the limitation of conventional clustering methods that require prior knowledge of the source count.
The normalized mean square error (NMSE) serves as the performance criterion to assess the accuracy of mixing matrix estimation across varying SNRs. Considering the inherent permutation ambiguity in blind source separation, all possible column permutations of the estimated mixing matrix are examined, and the minimum NMSE value is selected as the final result:
where denotes the true mixing matrix and represents the Frobenius norm. The permutation yielding the minimum NMSE is regarded as the optimal column alignment between and .
A comparative analysis with the algorithm from Reference [22] was performed to demonstrate the superior performance of the proposed method. The reference method was implemented using the authors’ publicly available code, with all parameters retained at their default settings. Table 2 summarizes the NMSE values, expressed in dB, for both the proposed method and the method from Reference [22] under different SNR conditions. Each value represents the average of ten independent trials at each noise level, ensuring statistical reliability.

Table 2.
NMSE Comparison Under Different SNRs.
The proposed method consistently achieves lower NMSE values across all tested SNR levels, with performance gains being particularly pronounced under low-SNR conditions. For example, at 0 dB SNR, the proposed method attains a NMSE of –13.59 dB, significantly outperforming the reference method, which yields –9.54 dB. These results confirm that the proposed approach offers enhanced robustness and effectiveness in blind source separation, especially in challenging noisy environments.
4. Compound Fault Diagnosis Experiment of Axial Piston Pump
4.1. Introduction to Experimental Equipment
This paper introduces a blind source separation algorithm grounded in SCA to resolve the difficulty of isolating distinct fault characteristics in hydraulic pumps under compound fault conditions. The methodology is specifically implemented on vibration data acquired from an axial piston pump. The fault data were collected using a dedicated hydraulic pump fault simulation test bench. Vibration signals were simultaneously acquired in the X-, Y-, and Z-directions using sensors mounted magnetically on the pump casing. The experimental setup and sensor arrangement are illustrated in Figure 6.
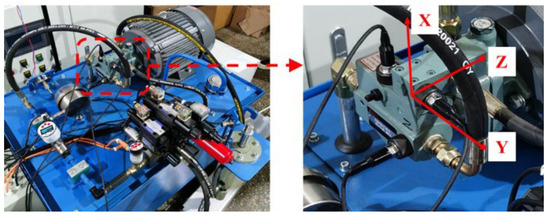
Figure 6.
Hydraulic pump failure simulation test bench.
The tested hydraulic pump was a P08-B3-F-R-01 model (Xuhong, Taiwan, China) with a pressure adjustment range of 3–21 MPa and a rotational speed range of 500–2000 r/min. The driving motor (model C07-43BO, Qunce, Taiwan, China) had a rated speed of 1440 r/min and a rated power of 5.5 kW.
The experimental system was equipped with a FM120-010DCA3KQ flow meter (Catu, Kunshan, China; measurement range: 0.2–1.2 m3/h) and a PS300-B250G1/2MA3P pressure sensor (Catu, Kunshan, China; measurement range: 0–250 bar).
Vibration signals were acquired using a PCB M603C01 accelerometer (PCB Piezotronics, Depew, NY, USA; measurement range of ±50 g, a sensitivity of 100 mV/g, and a frequency response range of 0.5 Hz–10 kHz).
The data acquisition system employed a NI PXIe-6363 analog signal acquisition card (sampling rate: 2 MS/s, number of channels: 16, resolution: 16 bit) controlled by a NI PXIe-8135 data acquisition controller (CPU: 2.3 GHz quad-core Intel Core i7-3610QE, RAM: 4 GB).
All vibration signals were synchronously collected using a LabVIEW 2019-based data acquisition program to ensure accurate multi-channel synchronization and reliable data analysis.
The axial piston pump operates at an actual speed of 1494 rpm, resulting in a shaft rotation frequency of . With seven pistons installed, the fundamental frequency of impact vibration generated by the slipper contacting the swash plate is . The main bearing, model 6205, was artificially seeded with an outer ring fault by creating a through groove of 1 mm width and 1 mm depth via electric discharge machining. The specifications of the bearing are listed in Table 3, and the damaged bearing is illustrated in Figure 7.

Table 3.
Bearing parameter.
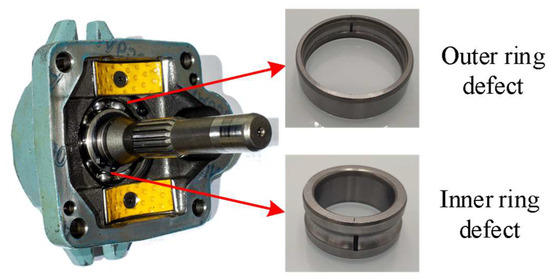
Figure 7.
Piston pump bearing fault diagram.
The failure frequencies of the outer ring and the inner ring are 89.26 Hz and 134.83 Hz, respectively, calculated by Equations (28) and (29).
where is the outer ring failure frequency, is the inner ring failure frequency, and is the rotation frequency.
The hydraulic system test rig is schematically depicted in Figure 8. During testing, the pump outlet pressure was maintained at 5 MPa by adjusting the relief valve, and the flow rate was set to 6 L/min via the throttle valve opening. Vibration signals were recorded using a sampling rate of 20 kHz.
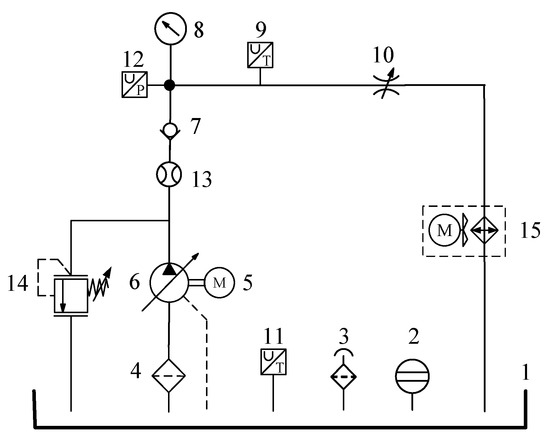
Figure 8.
Hydraulic system schematic diagram of test bench. 1. Oil tank; 2. liquid level gauge; 3. air filter; 4. oil absorption filter; 5. electric motor; 6. constant-pressure variable-displacement axial plunger pump; 7. check valve; 8. pressure gauge; 9, 11. temperature sensor; 10. throttle valve; 12. pressure sensor; 13. flow meter; 14. proportional relief valve; 15. air-cooled unit.
4.2. Artificial Mixed-Fault Separation Experiment
Vibration data from the X-direction were selected, with 10,000 sampling points extracted for envelope power spectrum analysis. Figure 9 presents the time domain waveforms and corresponding envelope spectra under three operating states: normal condition, inner ring bearing fault, and outer ring bearing fault. In the normal state, the characteristic impact frequency of the slipper contacting the swash plate (174 Hz) is clearly visible. The inner ring fault frequency (135 Hz) and outer ring fault frequency (90 Hz) are also distinctly identified in their respective states, confirming prominent fault-related features.
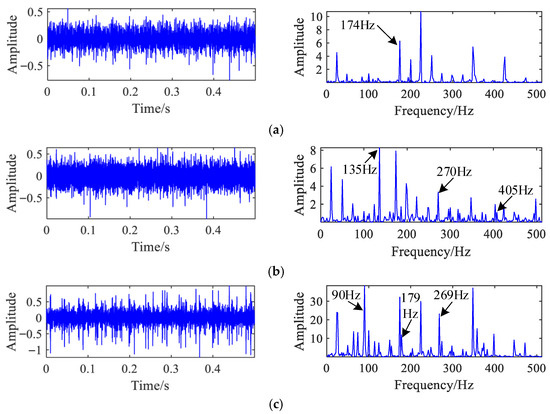
Figure 9.
Time domain waveform and power spectrum of vibration signals in X-direction of three states. (a) Normal; (b) inner ring fault; (c) outer ring fault.
The X-direction vibration signals from these three states were synthetically mixed using the mixing matrix defined in Equation (29), resulting in the composite signals shown in Figure 10. In the envelope spectrum of mixed signal 1, only the outer ring fault frequency remains discernible, while the inner ring fault frequency is obscured by noise. In mixed signal 2, both the inner and outer ring fault frequencies are clearly observable, demonstrating the variation in fault feature separability under different mixing conditions.
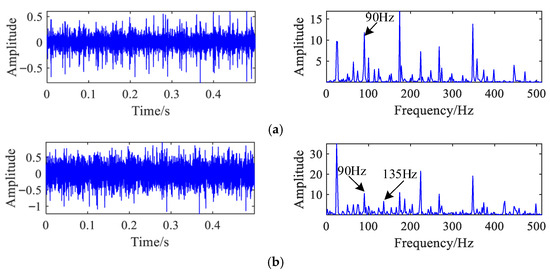
Figure 10.
Time domain waveform and power spectrum of vibration signal of mixed-fault signal. (a) First mixed signal; (b) second mixed signal.
After mixing, each resulting signal contains 10,000 sampling points, with a sampling frequency of 20 kHz. The time–frequency transformation is performed using a rectangular window of length 1024 and an overlap of 950 samples, generating a highly redundant time–frequency representation that preserves temporal resolution of transient impacts by avoiding window-induced smoothing. The thresholds for SSP detection and low-energy point removal are set to and , respectively.
As shown in Figure 11, the proposed source number estimation algorithm correctly identifies three source signals by combining statistical analysis of the mixed signals with the BIC. Based on the estimated source count, the mixing matrices obtained using the proposed method and the reference [22] method are given in Equations (31) and (32), respectively. The NMSE values for the two methods are –30.24 dB and −25.68 dB, respectively, confirming that the proposed approach achieves higher estimation accuracy.
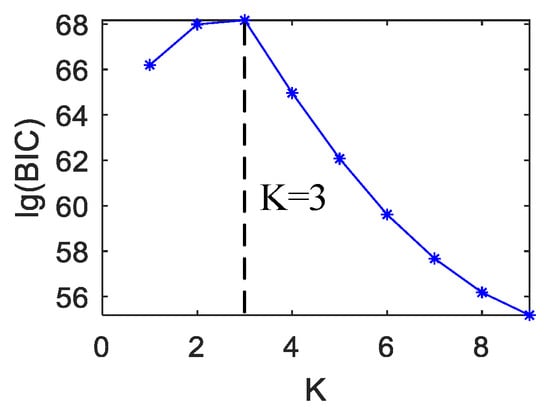
Figure 11.
Source number estimation diagram.
The three source signals successfully reconstructed by the proposed methodology are depicted in Figure 12. In Figure 12a, the first separated signal distinctly exhibits the bearing inner race fault characteristic frequency at 135 Hz and its second harmonic, confirming successful extraction of the inner race fault component. In Figure 12b, the second separated signal clearly shows the outer race fault frequency at 90 Hz and its harmonic at 179 Hz, validating effective isolation of the outer race fault. In Figure 12c, the third separated signal primarily contains the hydraulic pump’s rotational characteristic frequency at 174 Hz, corresponding to the normal operating condition. Critically, none of the separated signals exhibit overlapping fault frequencies, demonstrating that the proposed method cleanly discriminates between different fault types.
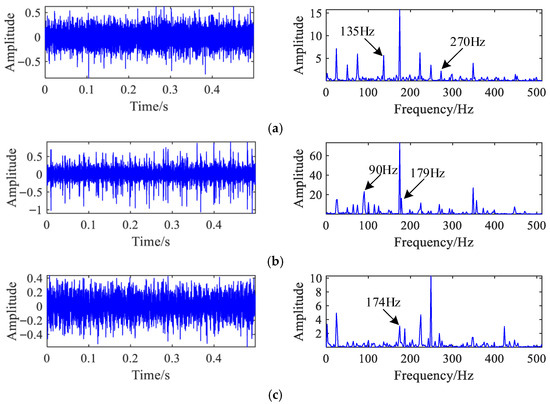
Figure 12.
The waveform and power spectrum of separated signals for the inner ring and outer ring compound fault of the bearing obtained by using the proposed method. (a) The first separated signal; (b) the second separated signal; (c) the third separated signal.
For further comparison, the same mixed signals were processed using the method from Reference [22], with results shown in Figure 13. Although the first separated signal accurately identifies the characteristic frequency of the inner race fault along with its harmonic components, the second and third signals continue to exhibit significant spectral content associated with the 90 Hz outer race fault frequency and its harmonics. This indicates that the reference method does not fully isolate fault components, leading to residual cross-mixing in the separated outputs.
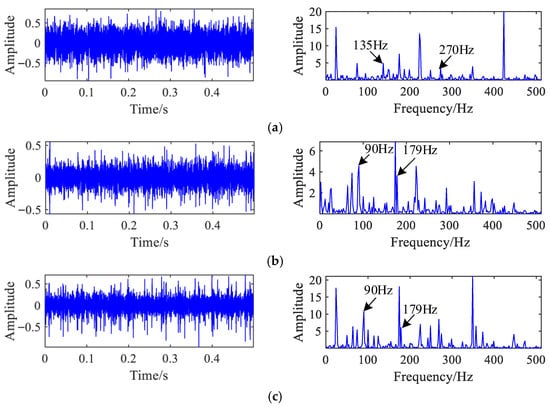
Figure 13.
Waveform and power spectrum of separated signals for the inner ring and outer ring compound fault of the bearing obtained by using method in reference [22]. (a) First separated signal; (b) second separated signal; (c) third separated signal.
These experimental results confirm that the proposed separation algorithm more accurately recovers source signals and cleanly segregates distinct fault features, demonstrating superior robustness and precision in underdetermined blind source separation.
4.3. Compound Fault Separation Experiment
The loose slipper fault is a common failure mode in axial piston pumps, characterized by excessive clearance caused by wear in the slipper-piston ball joint. This clearance induces additional impact vibrations under periodic operational loads. The fundamental frequency of this impact is expressed as follows:
where n is the motor speed and z is the number of pistons. The amplitude of this characteristic frequency and its harmonics serves as a key indicator for diagnosing both the presence and severity of the slipper fault.
A compound fault condition integrating a loose slipper with a bearing outer race fault was established to assess the method’s efficacy in complex operational environments. The slipper fault is simulated by artificially increasing the slipper clearance to 0.36 mm. Figure 14 displays the piston assembly under both normal operating conditions and in the presence of a loose slipper fault.
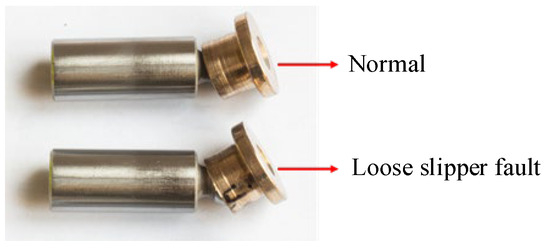
Figure 14.
Normal and loose slipper fault diagram.
This experiment adopts the same operating conditions and algorithm parameter settings as those described in Section 4.2. Vibration data from both the X- and Y-directions are acquired to form dual-channel observation signals. Figure 15 displays the corresponding time domain waveforms and power spectra. The signal in the X-direction distinctly exhibits a 90 Hz spectral component and its harmonics, indicative of a bearing outer race fault, accompanied by a piston impact signature at 174 Hz. Similarly, the Y-direction signal exhibits the 90 Hz outer race fault component and its harmonics, in addition to the 174 Hz piston frequency and its harmonics.
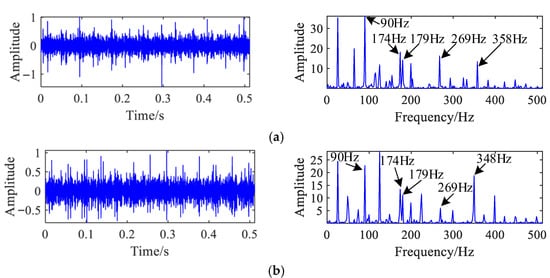
Figure 15.
Waveforms and power spectrum of compound fault (bearing outer ring fault and loose slipper): (a) X-direction; (b) Y-direction.
The source signals were separated using the proposed algorithm, and the three recovered signals are shown in Figure 16. The successful extraction of the outer race fault is evidenced in the first separated signal, which distinctly shows the 90 Hz characteristic frequency and its harmonics associated with this bearing defect. The second recovered signal exhibits relatively stable vibration with a disordered spectrum and no distinct fault frequencies, suggesting it corresponds to background noise or normal operational vibration. The third separated signal shows clear periodic impacts, with the slipper fault frequency at 174 Hz and its second harmonic at 348 Hz prominently present, confirming effective isolation of the slipper fault. These results confirm the method’s capability to effectively isolate and identify the bearing outer race and loose slipper fault components by leveraging their distinct spectral signatures. The composite fault experiment conducted on the hydraulic piston pump further validates the high performance of the developed methodology, confirming its accuracy and robustness in separating complex multi-fault signals.

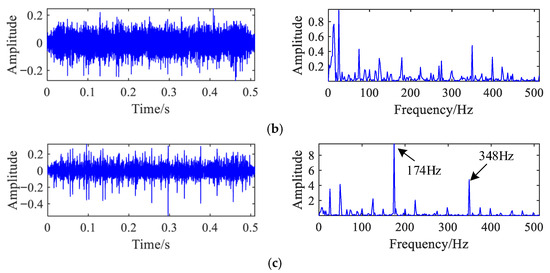
Figure 16.
Waveform and power spectrum of separated signals for the loose slipper and bearing outer ring compound fault obtained by using proposed method. (a) First separated signal; (b) second separated signal; (c) third separated signal.
To further evaluate the relative performance of the proposed approach, the same mixed signals were processed using the method from Reference [22], with the results shown in Figure 17. While the first separated signal successfully captures the outer race fault frequency and its harmonics, the second signal contains only the slipper fault frequency at 174 Hz, with no other relevant components. More notably, the third signal shows overlapping spectral content, including both the 90 Hz outer race fault frequency and the 174 Hz slipper fault frequency along with their harmonics. This indicates incomplete separation of fault components using the reference method, whereas the proposed approach cleanly isolates each fault without frequency overlap, demonstrating clear superiority in handling complex fault scenarios.
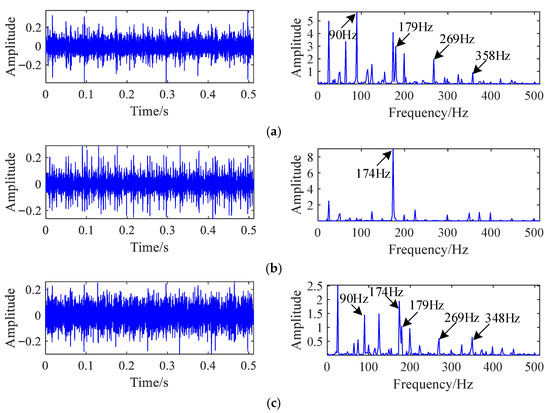
Figure 17.
Waveform and power spectrum of separated signals for the loose slipper and bearing outer ring compound fault obtained by using method in reference [22]. (a) First separated signal; (b) second separated signal; (c) third separated signal.
At the final stage of validation, a comparative experiment was carried out using the Variational Mode Decomposition (VMD) algorithm, which is a widely adopted adaptive signal decomposition technique. Unlike UBSS-based methods, VMD decomposes a signal into a predefined number of band-limited intrinsic mode functions (IMFs) without estimating the mixing matrix. This enables a clear identification of characteristic frequency components within each mode. Therefore, VMD serves as an appropriate benchmark for evaluating the decomposition capability under compound fault conditions.
In this experiment, the vibration signal along the X-axis of the hydraulic pump was selected for analysis. The VMD algorithm was implemented using the official MATLAB toolbox with default parameters. The penalty factor α and tolerance ε were kept at default values to ensure fair comparison. Since the decomposition result of VMD is highly sensitive to the number of modes (K), two configurations—K = 2 and K = 3—were investigated to assess their impact on fault feature extraction.
When the mode number was set to K = 2, the decomposed waveforms and their power spectra are shown in Figure 18. Both components contained the outer-race fault frequency (90 Hz) and its harmonics. The first component also exhibited the slipper looseness fault frequency (174 Hz) and its second harmonic, while the second component contained a more prominent 174 Hz component but an indistinct second harmonic. These results indicate that when K = 2, VMD fails to effectively separate the compound fault components—both fault sources coexist in the decomposed signals, leading to mutual interference.
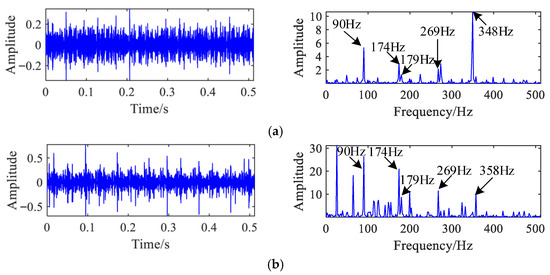
Figure 18.
Waveforms and power spectra of separated signals obtained by VMD (number of modes = 2). (a) First separated signal; (b) second separated signal.
The results in Figure 19. correspond to when the number of modes was increased to K = 3. The first and second components predominantly contain the outer-race fault frequency (90 Hz) and its harmonics, whereas the third component mainly represents the loose slipper fault frequency (174 Hz). However, the second harmonic of 174 Hz (348 Hz) is missing in all three components, suggesting that part of the fault information was lost during the decomposition. Moreover, the outer-race fault signal appears to be over-decomposed, leading to spectral leakage and feature redundancy.
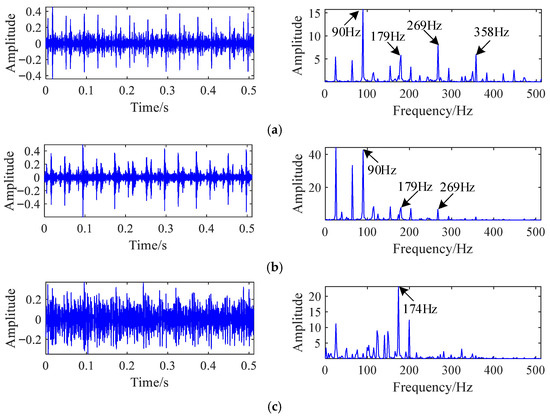
Figure 19.
Waveforms and power spectra of separated signals obtained by VMD (number of modes = 3). (a) First separated signal; (b) second separated signal; (c) third separated signal.
The comparison reveals that although VMD can partially decompose compound vibration signals, its performance is highly dependent on the predefined mode number. An insufficient mode number leads to under-decomposition, while an excessive mode number results in redundant components or feature loss. In addition, VMD lacks a mechanism for mixing matrix estimation and cannot achieve source-level separation, making it difficult to isolate physically meaningful fault sources in compound fault conditions.
In contrast, the proposed SCA-based UBSS method does not require prior knowledge of the number of sources, effectively utilizes the signal sparsity in the TF domain, and adaptively separates independent fault components with better feature preservation and noise robustness. Consequently, the proposed approach provides more interpretable and accurate results for hydraulic pump compound fault diagnosis.
5. Conclusions
In practical applications, conventional BSS methods are often inadequate due to limitations in the number of available sensors and the unknown number of vibration sources. To address this challenge, this paper proposes a UBSS strategy and validates it through compound fault simulation on an axial piston pump. The proposed approach effectively overcomes the limitations of traditional BSS methods in scenarios where the number of sources is unknown. The main contributions of this work are summarized as follows:
- (1)
- A hybrid framework integrating DPC and the BIC is introduced, enabling automatic estimation of the number of sources during mixing matrix estimation. This eliminates the dependency of conventional clustering-based UBSS methods on prior knowledge of the source count or on external source number estimation.
- (2)
- The proposed sparse component analysis framework with adaptive source number estimation is successfully applied to compound fault diagnosis in axial piston pumps.
- (3)
- By effectively isolating individual fault-related source signals from mixed measurements, this method provides a reliable foundation for subsequent fault analysis and condition monitoring tasks.
Author Contributions
Conceptualization, X.W.; methodology, X.W. and P.X.; software, X.W.; validation, X.W., P.X. and S.S.; formal analysis, S.Z.; investigation, P.X.; resources, S.S.; data curation, S.Z.; writing—original draft preparation, J.W.; writing—review and editing, P.X.; visualization, J.W.; supervision, S.S.; project administration, S.S.; funding acquisition, P.X. All authors have read and agreed to the published version of the manuscript.
Funding
This research was funded by the Science Research Project of Hebei Education Department (Grant No.: QN2025398) and the Doctoral Research Startup Fund Project of Tangshan University (Grant No.: BC202315).
Data Availability Statement
The data presented in this study are available on request from the corresponding author.
Conflicts of Interest
The authors declare no conflicts of interest.
References
- Xie, Y.; Zou, T.; Yang, J.; Sun, W.; Xie, S. SA-UCBSS: Sparsity-based adaptive underdetermined convolutive blind source separation. Knowl. Based Syst. 2024, 300, 112224. [Google Scholar] [CrossRef]
- McDonald, G.L.; Zhao, Q.; Zuo, M.J. Maximum correlated Kurtosis deconvolution and application on gear tooth chip fault detection. Mech. Syst. Signal Process. 2012, 33, 237–255. [Google Scholar] [CrossRef]
- Smith, W.A.; Borghesani, P.; Ni, Q.; Wang, K.; Peng, Z. Optimal demodulation-band selection for envelope-based diagnostics: A comparative study of traditional and novel tools. Mech. Syst. Signal Process. 2019, 134, 106303. [Google Scholar] [CrossRef]
- Chen, B.; Cheng, Y.; Allen, P.; Wang, S.; Gu, F.; Zhang, W.; Ball, A.D. A product envelope spectrum generated from spectral correlation/coherence for railway axle-box bearing fault diagnosis. Mech. Syst. Signal Process. 2025, 225, 112262. [Google Scholar] [CrossRef]
- Wei, S.; Zhang, R. Underdetermined Blind Source Separation Based on Spatial Estimation and Compressed Sensing. Circuits Syst. Signal Process. 2024, 43, 2428–2453. [Google Scholar] [CrossRef]
- Sun, X.; Xu, J.; Ma, Y.; Zhao, T.; Ou, S.; Peng, L. Blind image separation based on attentional generative adversarial network. J. Ambient. Intell. Humaniz. Comput. 2022, 13, 1397–1404. [Google Scholar] [CrossRef]
- Zhao, X.; Qin, Y.; He, C.; Jia, L. Underdetermined blind source extraction of early vehicle bearing faults based on EMD and kernelized correlation maximization. J. Intell. Manuf. 2022, 33, 185–201. [Google Scholar] [CrossRef]
- Jian, J.; Wang, L.; Lu, Z.R. Enhancing second-order blind identification for underdetermined operational modal analysis through bandlimited source separation. J. Sound Vib. 2024, 572, 118179. [Google Scholar] [CrossRef]
- Yu, G. An underdetermined blind source separation method with application to modal identification. Shock. Vib. 2019, 2019, 1637163. [Google Scholar] [CrossRef]
- Lu, J.; Cheng, W.; Zi, Y. A novel underdetermined blind source separation method and its application to source contribution quantitative estimation. Sensors 2019, 19, 1413. [Google Scholar] [CrossRef]
- Zhen, L.; Peng, D.; Yi, Z.; Xiang, Y.; Chen, P. Underdetermined blind source separation using sparse coding. IEEE Trans. Neural Netw. Learn. Syst. 2016, 28, 3102–3108. [Google Scholar] [CrossRef]
- Xu, P.; Jia, Y.; Wang, Z.; Jiang, M. Underdetermined blind source separation for sparse signals based on the law of large numbers and minimum intersection angle rule. Circuits Syst. Signal Process. 2020, 39, 2442–2458. [Google Scholar] [CrossRef]
- Xie, Y.; Xie, K.; Xie, S. Underdetermined blind source separation of speech mixtures unifying dictionary learning and sparse representation. Int. J. Mach. Learn. Cybern. 2021, 12, 3573–3583. [Google Scholar] [CrossRef]
- Fu, W.; Bai, X.; Shi, F.; Zhou, C.; Liu, Y. Mixing matrix estimation algorithm for underdetermined blind source separation. IEEE Access 2021, 9, 136284–136291. [Google Scholar] [CrossRef]
- Li, Y.; Wang, J.; Zhao, H.; Wang, C.; Ma, Z. Unraveling Mixtures: A Novel Underdetermined Blind Source Separation Approach via Sparse Component Analysis. IEEE Access 2024, 12, 14949–14963. [Google Scholar] [CrossRef]
- Ding, T.; Chen, H.; Chen, L.; Shi, J.; Zhou, Y. Improved sparse component analysis for multi-point harmonic contribution evaluation under incomplete measurements. IEEE Trans. Power Deliv. 2022, 37, 4019–4031. [Google Scholar] [CrossRef]
- Hassan, N.; Ramli, D.A. Sparse component analysis (SCA) based on adaptive time—Frequency thresholding for underdetermined blind source separation (UBSS). Sensors 2023, 23, 2060. [Google Scholar] [CrossRef]
- Reju, V.G.; Koh, S.N.; Soon, Y. An algorithm for mixing matrix estimation in instantaneous blind source separation. Signal Process. 2009, 89, 1762–1773. [Google Scholar] [CrossRef]
- Wang, Y.; Li, Y.; Sun, Q.; Li, Y. A novel underdetermined blind source separation algorithm of frequency-hopping signals via TF analysis. IEEE Trans. Circuits Syst. II Express Briefs 2023, 70, 4286–4290. [Google Scholar] [CrossRef]
- Li, Y.; Ramli, D.A. Research on mixed matrix estimation algorithm based on improved sparse representation model in underdetermined blind source separation system. Electronics 2023, 12, 456. [Google Scholar] [CrossRef]
- Zhu, Z.; Chen, X.; Lv, Z. Underdetermined Blind Source Separation Method Based on a Two-Stage Single-Source Point Screening. Electronics 2023, 12, 2185. [Google Scholar] [CrossRef]
- Zhen, L.; Peng, D.; Zhang, H.; Sang, Y.; Zhang, L. Underdetermined mixing matrix estimation by exploiting sparsity of sources. Measurement 2020, 152, 107268. [Google Scholar] [CrossRef]
- Pan, W.; Jiao, J.; Zhou, X.; Xu, Z.; Gu, L.; Zhu, C. Underdetermined Blind Source Separation of Audio Signals for Group Reared Pigs Based on Sparse Component Analysis. Sensors 2024, 24, 5173. [Google Scholar] [CrossRef] [PubMed]
- Zhong, H.; Ding, Y.; Qian, Y.; Wang, L.; Wen, B. Rolling Bearing Fault Diagnosis Based on Nonlinear Underdetermined Blind Source Separation. Machines 2022, 10, 477. [Google Scholar] [CrossRef]
- Wang, H.C.; Du, W.L. A sparse underdetermined blind source separation method and its application in fault diagnosis of rotating machinery. Complexity 2020, 2020, 2428710. [Google Scholar] [CrossRef]
- Wang, J.; Chen, X.; Zhao, H.; Li, Y.; Liu, Z. Fault feature extraction for reciprocating compressors based on underdetermined blind source separation. Entropy 2021, 23, 1217. [Google Scholar] [CrossRef]
- Ma, B.; Zhang, T. Underdetermined blind source separation based on source number estimation and improved sparse component analysis. Circuits Syst. Signal Process. 2021, 40, 3417–3436. [Google Scholar] [CrossRef]
- Gao, H.; Zhang, Z.; Wang, S.; Sun, H. Underdetermined blind source separation method based on quantum Archimedes optimization algorithm. Appl. Intell. 2023, 53, 13763–13800. [Google Scholar] [CrossRef]
- Rodriguez, A.; Laio, A. Clustering by fast search and find of density peaks. Science 2014, 344, 1492–1496. [Google Scholar] [CrossRef]
- Georgiev, P.; Theis, F.; Cichocki, A. Sparse component analysis and blind source separation of underdetermined mixtures. IEEE Trans. Neural Netw. 2005, 16, 992–996. [Google Scholar] [CrossRef]
- Lu, J.; Cheng, W.; He, D.; Zi, Y. A novel underdetermined blind source separation method with noise and unknown source number. J. Sound Vib. 2019, 457, 67–91. [Google Scholar] [CrossRef]
- Li, G.; Tang, G.; Luo, G.; Wang, H. Underdetermined blind separation of bearing faults in hyperplane space with variational mode decomposition. Mech. Syst. Signal Process. 2019, 120, 83–97. [Google Scholar] [CrossRef]
Disclaimer/Publisher’s Note: The statements, opinions and data contained in all publications are solely those of the individual author(s) and contributor(s) and not of MDPI and/or the editor(s). MDPI and/or the editor(s) disclaim responsibility for any injury to people or property resulting from any ideas, methods, instructions or products referred to in the content. |
© 2025 by the authors. Licensee MDPI, Basel, Switzerland. This article is an open access article distributed under the terms and conditions of the Creative Commons Attribution (CC BY) license (https://creativecommons.org/licenses/by/4.0/).