Abstract
This article presents an experimental investigation and statistical analysis of the effects of cutting conditions on the machining performance of AISI 1045 steel using a wiper-shaped insert. Experimental findings are used to compare the machining performance obtained using wiper inserts with those obtained using conventional round-nose inserts as recently reported in the literature. In addition, the effects of process conditions, namely cutting speed, feed rate, and depth of cut, are analyzed in order to obtain optimum conditions for both types of inserts. The goal is to achieve the optimal machining outcomes: minimum surface roughness, resultant cutting force, and cutting temperature, but maximum material removal rate. A full factorial design was followed to conduct the experimental trials, while ANOVA was utilized to estimate the effect of each factor on the process responses. A desirability function optimization tool was used to optimize the studied responses. The results reveal that the optimum material removal rate for wiper-shaped inserts is 67% more than that of conventional inserts, while maintaining a 0.7 µm surface roughness value. The superior results obtained with wiper-shaped inserts allow wiper tools to use higher feed rates, resulting in larger material removal rates while obtaining the same surface quality.
1. Introduction
Machining has been considered a prime choice for processing a wide range of engineering materials. This can mainly be explained through its high ability to produce complex features with a tight tolerance and high accuracy [1]. However, machining is considered a complex multiphysics process entailing mechanical, thermal, and even chemical regimes [2]. The effect of the process conditions on different performance indicators of the process, such as material removal rate, surface quality, life of cutting tool, cutting forces, and consumed thermal energy, has been widely examined by a number of researchers [1,2].
To examine the effects of nanofluid-based advanced cooling on the performance of machining of AISI1045, Abbas et al. conducted a comparative study of this type of cooling when compared with conventional dry and flood cooling strategies, considering aspects of the product, i.e., surface quality, and aspects of the process, such as energy consumption, in machining AISI1045 steel. Based on the developed mathematical models for the machining responses, the results showed that nanofluid minimum quantity lubrication, with an overall weighted sustainability index of 0.7, exhibited the most sustainable performance and produced the lowest surface roughness and energy consumption. The optimum results (with desirability of 0.9050) were speed of cut = 116 m/min, cutting depth = 0.25 mm, and feeding rate = 0.06 mm/rev. Moreover, lowering the feeding rate was suggested to improve surface quality. To lower power consumption, lowering control factors were recommended [3].
Brown et al. [4] compared and de-convoluted the effects of surface quality resulting from the relations between geometric parameters during the turning process. They concluded that employing large stones for cutting edge geometries reduces the roughness of the machined surface for cases of high values of kinematic roughness. On the other hand, for cases with low values of predicted kinematic roughness, using large stones results in increases in surface roughness, since ploughing occurs in this case. Moreover, instability and side flow dominate conditions and result in larger surface roughness at low kinematic roughness. Process stability and smaller tip size produce better surface roughness at higher kinematic roughness parameters.
Khidhir et al. experimentally evaluated the resultant surface finish and wear of the tool tip when turning nickel-based Hastelloy C-276 under different turning conditions and with two different ceramic cutting inserts. The authors concluded that the interaction between cutting depth and cutting speed produced a built-up edge at low to medium speeds, which affected surface roughness and tool wear. Additionally, examination of SEM images demonstrated that the wear of the nose radius was responsible for the generated high surface roughness values. On the other hand, conventional round inserts resulted in improved surface roughness with a reduction in depth of cut and higher cutting speed [5].
Rodrigues et al. [6] studied the machinability of hardened ASTM H13 steels (50 HRC) at both mild speeds and high speeds of cutting (also known as HSC). Dry tests were conducted on seven different geometries of chip breakers of carbides coated with titanium nitride. The study included evaluation of surface roughness and the process of chip formation. It was reported that a reduction in the specific cutting energy of 15.5% was achieved as a result of sharply increasing the cutting speed for very high values approaching 700%. A mere increment of one degree (1°) in the chip breaker bevel angle resulted in a 28.6% reduction in the specific cutting energy for normal speeds. The reduction becomes 13.7% for high-speed cutting (HSC). Values of workpiece roughness determined under various test conditions were very low so as to correspond to values resulting from conventional grinding operations, with a typical value around one fifth of a micrometer, or 0.2 μm.
In machining operations, the edge geometry of the cutting inserts has a great influence on process responses such as cutting forces, temperature, and surface roughness. There are two main geometries for cutting edges: conventional round-nose and wiper. The latter, wiper inserts, have been recently utilized to achieve a good surface quality in order to eliminate the need for further grinding process. Nevertheless, machining with wiper inserts could exhibit some negative impact in terms of higher cutting force and cutting temperature [7].
Mourão et al. [8] determined factors that significantly affect specific cutting energy (SCE) during face milling of aluminum alloys using wiper inserts. They reported that SCE is inversely proportional to the square of the cutter’s cutting speed, indicating high sensitivity to changes in cutting speed. Additionally, SCE decreased as the depth of cut and feed per tooth increased, with the effect of the former more prominent than the latter.
Khan et al. [9] investigated the influence of microscopic geometry of wiper inserts on the resulting material hardness. They used two different geometries for the edge of wiper insert tools, the chamfer (0.15 mm × 25°) and the chamfer plus hone (0.15 mm × 25°-25 μm), in a hard-turning process of an AISI D2 steel alloy in dry conditions, i.e., without cutting fluid. They concluded that the role of wiper macro-geometry was somewhat suppressed in tool life as well as surface roughness. In particular, the hardness of the workpiece was the major factor affecting tool life (with a PCR value of 70.11%). With regard to surface roughness, the insert type (with wiper inserts showing significantly better effects than conventional tools) and feed rate played a larger role.
Dogra et al. [10] conducted a review of tool geometry variation entailing the radius of the tool nose, rake angle, rake face groove, variation of geometry of cutting edge geometry, geometry of wiper, and curved edge tools and their effects on tool wear/life, surface roughness, and also the integrity of machined surfaces. Moreover, the review included discussion of numerical approaches using modeling and simulation in tool geometry analysis, including an approach to variable micro-geometry tools developed in a recent study.
In another work, Abbas et al. [11] performed a comparative analysis between conventional and wiper inserts to investigate surface quality though a set of criteria (Ra, Rt, and Rz) in high-strength steel turning. The study highlighted the significance of the depth of cut and feed rate in improving surface roughness. An approach using the desirability function was employed to investigate the machining conditions leading to optimum surface roughness for the range of experimental results, in order to optimize multiple parameters of the response. The results revealed that the use of a wiper carbide insert produced significantly better surface quality than that produced using the conventional carbide insert. The improvement of the wiper insert over the conventional insert, which reached a maximum of 3.5-fold, was possible at a machining speed of 75 m/min. The improvements became lower as the speed was reduced, so were 3, 2.5, and 2 times at machining speeds of 100, 125, and 150 m/min, respectively.
In a following study, Abbas et al. [7] carried out an experimental evaluation of the surface quality produced during the precision turning process of the alloy steel AISI 4340 with conventional round and wiper inserts under various cutting conditions. An experimental design of full factorial with three parameters, each of them with four levels, was employed. The parameters are the feeding rate, the cutting speed, and the cutting depth. The resulting average roughness (Ra) is used to characterize the finished surface quality. The results showed that for the intended range of cutting conditions, wiper inserts produced lower surface roughness values, as opposed to conventional inserts, resulting in better surfaces. When the type of insert was included as a qualitative factor using ANOVA, it was found to be the most important factor for best surface roughness and metal removal rate. The feeding rate was the next factor of influence. Then, there came the interaction between feeding rate and insert type. Using wiper inserts made it possible to achieve a concurrent increase in feed rate, cutting depth, and cutting speed, and at the same time a superior quality of the resulting surface was obtained with a lower Ra value, as compared to surface roughness results when using normal cutting inserts. The improvements obtained through using wiper inserts over conventional ones reached up to ten times higher than metal removal rates. This is a clear indication of the enormous improvement in productivity achieved by wiper inserts over conventional inserts in precision hard turning of the alloy steel AISI 4340.
Processing AISI 1045 alloy steel samples by face milling was studied by Pimenov et al. to find the best processing conditions [12]. The study was inclusive of various parameters that included the cost of cutting tool components, consumption of energy, cutting tool wear, material removal rate, and, importantly, the resulting surface quality. Various experiments were conducted with variations in cutting length, after which the results were statistically studied in order to choose the optimum conditions of cutting. A multi-layer regression analysis was performed on the results of the experiments, which resulted in a nonlinear set of mathematical equations with a coefficient of determination of R2 = 0.98. The correlations considered in the study included the effects of the parameters feed per tooth (fz), speed of cut (vc), flank wear (VB) on surface roughness (Rz), material removal rate (MRR), sliding distance (ls), cutting performance (Pc), and last but not, least life of tool (T’). The overall results, estimated using Gray’s relation analysis (GRA), showed that the optimum performance in fly milling for fast manufacturing (the first case) is obtained for feed per tooth fz = 0.25 mm/tooth, cutting speed vc = 392.6 m/min, and machined length l = 5 mm. In the second case, the optimal parameters for saving resources (mainly tools) were a feed per tooth of 0.125 mm/tooth, a cutting speed of 392.6 m/m, and a machined length of 5 mm.
Szczotkarz et al. [13] performed an assessment of the surface topography resulting from a turning process of the alloy steel AISI 1045 using carbide inserts with respect to the applied titanium-based coatings. The work presented the results of three-dimensional parameters, isometric views, contour maps, and material ratio curves. Analysis of the topography of the resulting surfaces revealed that for the TiAlN-coated insert at low cutting speeds and large feed rates, surface roughness parameters were low. In contrast, lower values of the selected 3D parameters resulted from the insert with TiC coating at higher cutting speeds. It was also reported that the TiC-coated insert produced the most uniform distribution of valleys and ridges in the machined surface. These results were used to determine the best ranges of cutting parameters, which allow appropriate selection of the type of titanium-based coating when machining this type of alloy.
D’Addona et al. [14] studied the surface roughness during hard turning with a wiper insert geometry. In the analysis, the surface roughness of wiper inserts and traditional inserts with a radius were compared. The analysis employed tools such as ANOVA, surface plots, and AOM. The conclusions of the study are as follows: wiper inserts produce better surface finish than traditional inserts with comparable surface finish during grinding. The feed rate proved to be the most important factor affecting the surface roughness. Additionally, feed rate then depth of cut and type of insert have statistically significant effects on surface roughness. The study concluded that the best processing conditions to produce high surface quality are as follows: a wiper nose radius of 1.2 mm, a speed of 1200 RPM, a feed rate of 0.08 mm/rev, and a depth of cut of 0.1 mm.
Patil et al. used the response surface method (RSM) to predict the process parameters in order to optimize the VMC-five axis milling of D3 steel. The responses selected for optimization in this study were the surface roughness and MRR. The multi-objective teaching learning-based optimization (MTLBO) technique was used to optimize the two combined responses. It was found that the machining conditions predicted by the hybrid RSM-MTLBO improved the studied responses significantly [15].
Jumare et al. used RSM to investigate the effects of three process parameters on the surface roughness (Ra) and tool wear in the diamond turning process of single-crystal silicon. ANOVA was used to examine the significance of the parameters (cutting speed, feed rate, and depth of cut) on the two responses. A desirability function multi-objective optimization approach was used to minimize both Ra and the tool wear, and to maximize MRR. The results showed that while the three parameters were significant, the feed rate had the largest effect on both responses [16].
Benkhelifa et al. built a mathematical model to optimize surface roughness and tool flank wear in the turning of AISI 316L stainless steel. The experiments were designed using the Taguchi L27 matrix. Both ANOVA and RSM techniques were applied to estimate the significance of the studied turning parameters, and to build a mathematical model for optimization. Multi-objective optimization using the desirability function was utilized in this study. The results showed that the feed rate was the main factor affecting both surface roughness and tool flank wear [17].
Rudrapati studied the individual and combined effects of grinding processing conditions on the surface quality of glass fiber reinforced epoxy composite. A full factorial design was used to plan the experimental work, and ANOVA was used to estimate the significance of each factor and interaction on the response. The desirability function was applied to predict the surface quality level as a function of quality level [18].
Looking at the reviewed literature, there has been a large number of investigations into the effect of different process parameters entailing the geometry of cutting inserts on individual or even a number of responses. Nevertheless, comprehensive studies of a wide range of parameters on several responses have not been fully covered. Therefore, the goal of this work is to perform an overall evaluation of the machinability performance of AISI1045 when machined with a wiper in terms of the resulting surface, the cutting forces, and cutting temperature, and to compare these responses with those reported in the work of Abbas et al. [1] when conventional round-nose inserts were used.
2. Materials and Methods
As previously stated, this is a useful extension of the work reported by Abbas et al. in [1], in which the surface roughness, cutting force, and cutting temperature obtained when turning AISI1045 using conventional round-nose inserts were presented. AISI 1045 has played a key role as a reliable material for a number of applications such as gears, shafts, spindles, rollers, and crankshafts [1]. In this work, AISI 1045 samples are machined under uniform cutting conditions but with a different insert type with wiper geometry for the goal of assessing the machining performance of AISI1045 using different tool geometries. In addition, statistical analyses of the results for both cases are conducted and discussed.
2.1. Workpiece Materials
The material samples considered in the experiments are made from AISI 1045 steel, which is used in a wide range of applications in heavy industries where high strength and resistance to wear are desired. The specific elemental content of this alloy is shown in Table 1. The mechanical properties are provided in Table 2.

Table 1.
Chemical content of AISI 1045 steel alloy [1].

Table 2.
Mechanical properties of AISI 1045 steel alloy [1].
An optical microscope (OM) manufactured by Olympus, model: BX51-M, was used for the metallographic investigations. The samples were prepared according to the standard procedures for metallographic sample preparation. This includes grinding with SiC abrasive paper, subsequent polishing with a diamond paste of 1.0 and 0.05 µm, and final etching by immersion for 10 s in 5% Nital to visualize the microstructure of the sample. Figure 1a shows the optical micrograph, where the microstructure contains pearlite grains (light) in a ferrite matrix (dark). Pearlite grains consist of alternating lamellae of proeutectoid ferrite (Fe)/cementite (Fe3C) of random orientations, as shown in higher magnification in Figure 1b. The pearlite phase accounted for 43% of the volume, while the ferrite fraction was 57%.
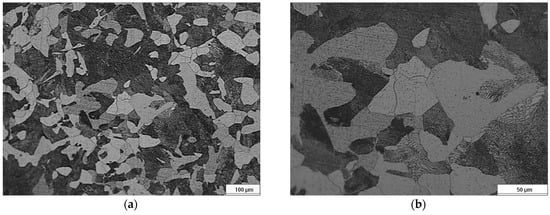
Figure 1.
Microstructure of AISI 1045 at two magnification levels, (a) 100 μm and (b) 50 μm.
2.2. Experimental Setup
A conventional lathe machine was used (type: EMCOMAT- 20D, from Emco Co., Salzburg, Austria) for machining test samples, see Figure 2. The machine specifications were 5.3 kw drive motor, with electronic speed control 40 to 3000 rpm, a longitudinal feed of 0.045 to 0.787 mm/rev, and stepless speeds.
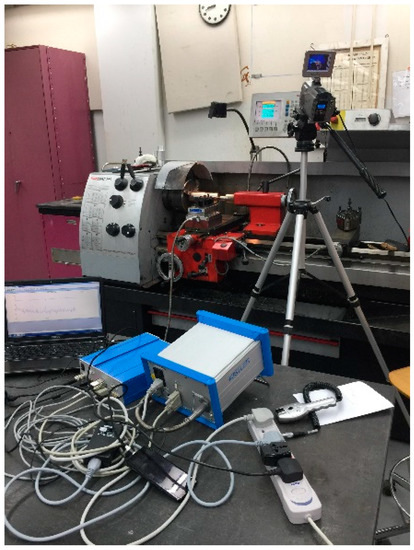
Figure 2.
Apparatus for machining the test samples and measuring the cutting forces and temperature.
The turning machine is a product of Sandvik (Stockholm, Sweden), with a holder of the type SDJCR 2020K 11 and an insert of the type DCMX11 T304- WF 4315 for the wiper cutting insert. This is compared to the conventional type insert used in the work reported in [1] with type number DCMT11 T304-PF 4315. The insert specifications were as follows: shape angle = 55°, clearance angle = 7°, rake angle = 6°, and tool nose radius = 0.4 mm. Optical microscope images of edge geometry for both conventional and wiper insert types are shown in Figure 3a,b. With design specifications for efficient material removal, this turning machine is utilized for various materials including stainless steel and aluminum and titanium alloys. The workpiece sample was 120 mm in length and 70 mm in diameter, with a cutting length of 30 mm for each round of experiments.

Figure 3.
Optical microscope images of edge geometry: (a) conventional insert (b) wiper insert [7].
2.3. Design of Experiments
Full factorial design, with three factors, each of which had three levels, was used to build the experiment matrix. Specifically, the experimental plan was set with 27 test runs as follows: three levels of cutting speed 80, 120, and 160 m/min, three levels of cutting depth 0.5, 0.75, and 1.0 mm, and three levels of feed rate 0.045, 0.09, and 0.135 mm/revolution. Table 3 summarizes the factors and their levels. The full matrix is illustrated in the next section with the measured responses. Minitab 18 was used to check the significance of the three factors, and their interactions, on the responses through analysis of variance (ANOVA). ANOVA is a widely used technique to test the significance of factors and their interactions when more than two factors and/or interactions are examined. A 95% confidence level was set for the analysis, i.e., p-values below 0.05 prove the factor is significant and those above 0.05 show non-significance [19]. Backward elimination was applied to remove the non-significant items from ANOVA one at a time. Least squares multiple regression was utilized to build a model representing the three responses.

Table 3.
Experimental cutting parameters with different levels for each parameter.
2.4. Characterization
For force measurement and calculation, a test stand of the type number Kistler 5070 was used with the software Dynoware 2825A (Liechtenstein, Switzerland) for data processing to calculate cutting force components: the main cutting force (), the radial force (), the feed force (), and cutting force (Fc), see Figure 4. The resultant force () is evaluated using the standard relationship:

Figure 4.
Cutting forces Fr, Ff, and Fc for (a) conventional and (b) wiper inserts.
The unit used in measurement of forces is Newton (N).
The material removal rate (MRR) is evaluated using the equation
where represents the surface speed (m/min.), is the feed rate (mm/rev.), and is the depth of cut (mm), and MRR is measured in (mm3/min).
Thermal images were obtained with a ThermoPro-TP8 thermographic camera produced by Guide Co. (Wuhan, China). The camera must be stable and pointed at the target whose temperature is to be measured. In this case, the target is the contact between the cutting face of the insert tool and the surface of the sample during turning. The specifications of this camera are as follows: thermal sensitivity: ≤0.08 °C at 30 °C, measurement range: −20–1000 °C, detector type: micro-bolometer UFPA384 × 288 pixels, spectral range: 8∼14 μm, accuracy: ±2 °C. The parameters that must be specified include the distance of the target object from the camera lens and the emissivity, which must be specified according to the type of material, surface condition, temperature, and other factors. It is determined using a reference table in the camera manual. Care must be taken during calibration because although the camera performs automatic calibration, manual calibration must be performed before each exposure to achieve maximum sensitivity.
The test apparatus assembly for the machining process and measurements of cutting forces and temperature is shown in Figure 5.

Figure 5.
Thermal image for (a) conventional and (b) wiper inserts.
For surface roughness (Ra) measurement, a Rugosurf 90-G type surface testing device from Tesa (Bugnon, Switzerland) was utilized. The measurement parameters were set as follows: cut-off length 0.8, cut-off number 15, and measurement speed 1 mm/s, and the measurements were performed on the curved surfaces.
3. Results and Discussion
3.1. Experimental Results
Figure 6 shows the obtainable surface roughness measurements for the swiper inserts versus the conventional inserts used under similar set conditions of cutting. The graph demonstrates the significant influence of the type of inserts used on the generated surface finish, which indicates the superiority of the wiper insert, resulting in a much lower surface roughness with a reduction percentage that varies between 31% and 60% in contrast to the results obtained from the case of conventional round-nose inserts under the same cutting parameters. To explain the superior performance of wiper inserts when compared with conventional round-nose ones, one should refer to the geometry of the wiper insert as presented in Figure 3. Specifically, while a conventional insert is composed of a single round nose, the wiper geometry consists of small radii that are well connected to the conventional nose. Therefore, the wiper edge geometry results in a nose with an effective straight section of minimal cutting nose. Therefore, with the aid of the straight section of the small cutting edge, when applying relatively small feed rates, the generated surface contains moderate peaks with a significantly reduced profile texture, resulting in improved surface quality [7].
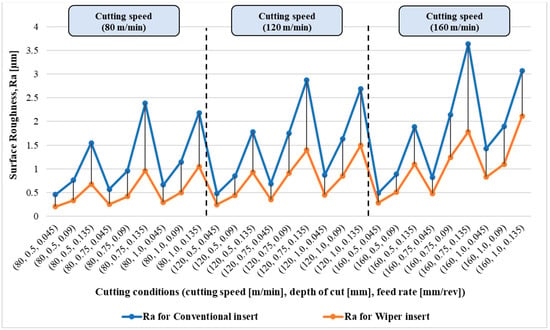
Figure 6.
Resultant surface roughness, Ra in μm for both cases, of conventional and wiper inserts under a range of cutting conditions.
It is also not so difficult to see that the increase in the feed rate leads to a dramatic increase in the resulting surface roughness in both cases of tools, wiper and conventional round-nose inserts. In addition, looking at the surface roughness measurements achieved, one can say that higher cutting speeds have a noticeable negative effect on the final surface roughness for both insert types, wiper and conventional round-nose ones.
Figure 7 presents a comparison of the cutting forces obtained for the cases of wiper and conventional round-nose inserts for the full range of cutting conditions. The effects of cutting parameters on the resultant cutting forces can be summarized in two trends. Firstly, the resultant cutting force is directly proportional to both feed rate and depth of cut. However, the cutting speed effect on the cutting force has a different trend. Specifically, for the wiper insert, the resultant cutting force is inversely proportional to the cutting speed, while for the conventional round-nose insert, the middle-range cutting speed of 120 m/min results in a higher cutting force when compared with other values of high and low cutting speeds. When looking at the effect of the insert type on the generated cutting force, a complex relationship can be concluded. In particular, the high and medium values of cutting speeds of the wiper inserts lead to the generation of less cutting force. However, at low cutting speeds, unclear trends are observed, where the resultant cutting forces for both cases are overlapping with minor deviations and flipping for different values of depth of cut. The results presented in Figure 7 show the nonlinear behavior of the turning process due to the effect of the cutting parameters or because of the type of cutting insert used.
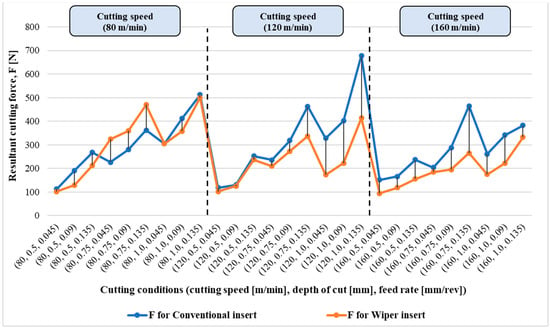
Figure 7.
Resultant cutting force, F in N for both cases, of conventional and wiper inserts under a range of cutting conditions.
Figure 8 illustrates the cutting temperatures measured for both types of inserts under the entire range of cutting parameters. For the wiper insert, it is quite clear that cutting speed has a noticeable proportional effect on the detected thermal behavior of the process. Nevertheless, this is not the case for the conventional round-nose insert, where, except for the effect on feed and depth of cut at low cutting speed, there is no clear influence of the process parameters on the cutting temperature observed. The results also show the overlapping trend of the cutting temperature for both types of insert tools at low and medium values of cutting speeds, and a substantial difference is presented at high cutting speed, where the wiper inserts exhibit a higher thermal response of the process as opposed to the round-nose inserts.
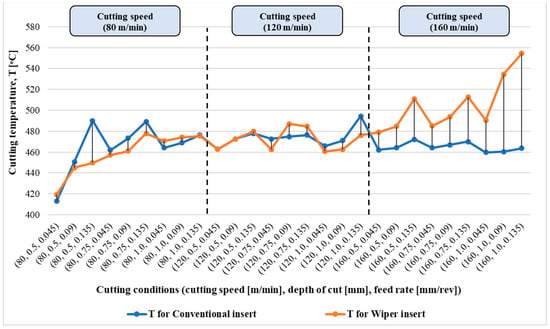
Figure 8.
Cutting temperature, T in °C for both cases, of conventional and wiper inserts under a range of cutting conditions.
Looking at the results presented in Figure 6, Figure 7 and Figure 8, it is not so difficult to see the contradicting effect of the type of insert, whether it is wiper or conventional round-nose inserts, on the three responses examined in this study. In particular, while surfaces produced with wiper inserts exhibit much less surface roughness compared to those from the conventional round-nose ones for the entire range of cutting conditions, the cutting forces resulting for the case of wiper inserts are higher than those associated with the round-nose ones, especially at high speeds of cutting. Furthermore, unclear and overlapping trends of the effect of the type of insert on the resultant cutting forces, particularly at low cutting speed, can be detected. However, even more crossed trends can be observed for the effect of the insert type on the obtainable cutting temperature at low and medium cutting speeds. Again, the aforementioned observation points out the need for an in-depth statistical analysis of the various effects of cutting parameters for each type of insert to elaborate further their effect and identify the optimal working window and cutting parameters for the best achievable process performance.
3.2. Statistical Analysis
3.2.1. Conventional Edge
Table 4 summarizes ANOVA results for Ra using the conventional round-nose cutting edge. The results show that the three investigated factors have significant effects on Ra. It is also shown that there is no significant interaction between these factors. Figure 9 illustrates the main effect plots of the three factors. The graph shows that the most significant effect on Ra comes from the feed rate, which is expected in turning processes.

Table 4.
ANOVA analysis results for parameter Ra using conventional cutting edge.
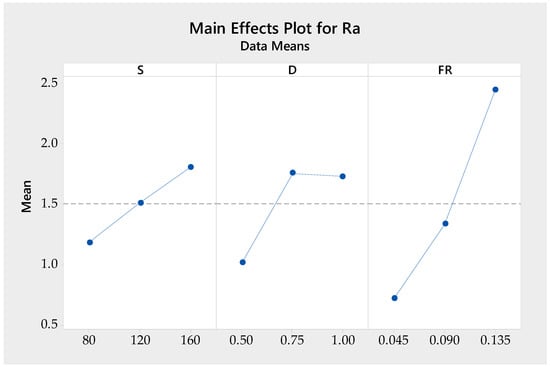
Figure 9.
Main effect plots for Ra using conventional edge.
Table 5 shows ANOVA analysis for the resultant force using the conventional edge. The results show that only the feed rate and the cutting depth have a significant effect on the force. Again, this is expected in turning processes. The main effect plots of these two significant factors are depicted in Figure 10. The resultant force varies in almost the same pattern with both factors.

Table 5.
ANOVA results for F using conventional cutting edge.
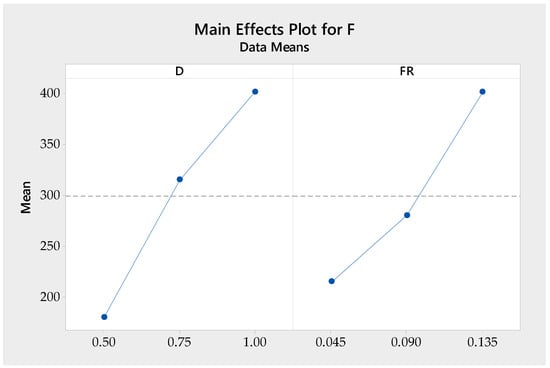
Figure 10.
Main effect plots for F using conventional edge.
Table 6 presents the ANOVA results for the temperature of cutting using the conventional round-nose insert. The three studied factors affect the measured temperature significantly. Additionally, there is a significant interaction between the cutting speed and the cutting depth, and between the cutting speed and feed rate. Figure 11 shows the interaction and the contour plots for temperature vs. cutting speed and depth of cut. While the temperature increases continuously with increasing feed rate, it presents a different pattern to that of the cutting depth. The measured temperature increases for cutting depth values between 0.5 and 0.75 mm, after which it decreases slightly between 0.75 and 1.00 mm with cutting speeds of 80 and 120 m/min. Additionally, the rate of temperature increase with feed rate is steeper at the speed of 80 m/min than the other two speeds. The contour plot shows that the maximum temperature occurs at the maximum depth of cut and minimum cutting speed, while the minimum temperature occurs at minimum depth of cut and minimum cutting speed. It also presents a nonlinear distribution of temperature over the studied range of both factors.

Table 6.
ANOVA results for T using conventional cutting edge.
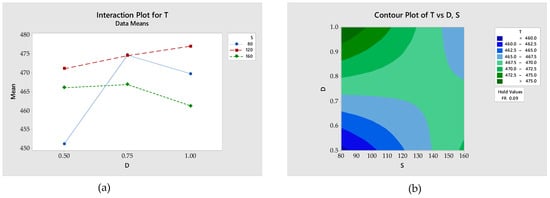
Figure 11.
(a) Interaction plot and (b) contour plot for T using conventional edge.
Table 7 summarizes the mathematical equations representing the measured outputs. These equations were constructed by regression using the least squares method. They could be used in predicting these responses under different machining conditions.

Table 7.
Mathematical equations for the measured responses.
The desirability function optimization tool in Minitab 18 was used to minimize Ra, F, and T, and to maximize MRR. The priority was given to keeping Ra below 0.8 µm (with a target of 0.7 µm), then to maximize MRR and minimize T. The lowest priority was given to minimizing F. Individual desirability (d) and composite desirability (D) have a range of 0.0 to 1.0. One denotes the ideal case and zero illustrates the case when the response is outside its acceptable limits. The optimum values for the factors were calculated to be S = 160 m/min, D = 0.52 mm, and FR = 0.05 mm/rev. The expected optimum responses were calculated to be Ra = 0.7 µm, F = 114 N, T = 468 °C, and MRR = 3726 mm3/min. The optimization plot is shown in Figure 12. For both force and surface roughness, d equals 1.0, proving that these two responses will be optimized with perfection. For temperature, d equals 0.84, and for MRR, d equals 0.7. These numbers show that the temperature and material removal rate will be optimized to a good extent, but not with perfection. For the combined responses, D, equals 0.87, proving that the combined optimization is well achieved.
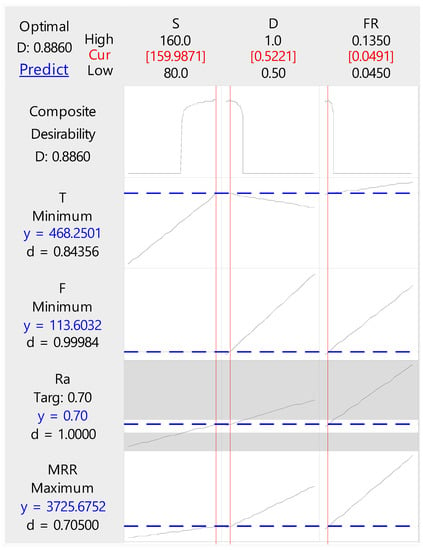
Figure 12.
Optimization plot for responses using conventional cutting edge.
3.2.2. Wiper Edge
Table 8 summarizes the ANOVA results for Ra using the wiper cutting edge. The results show that the investigated three factors have significant effects on Ra, in a similar pattern to that of the conventional edge. Figure 13 illustrates the main effect plots of the three factors. It is clear that the wiper cutting edge results in higher surface roughness, with almost half of the conventional cutting edge values.

Table 8.
ANOVA results for Ra using wiper cutting edge.
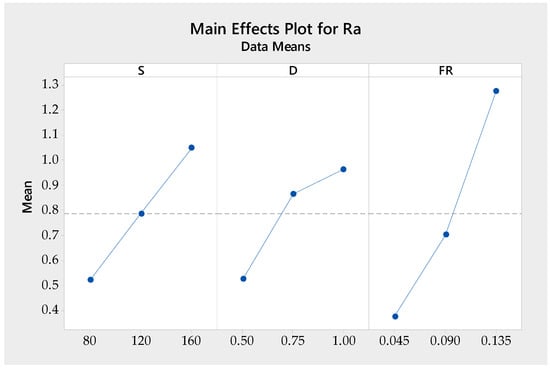
Figure 13.
Main effect plots for Ra using wiper cutting edge.
The results from ANOVA analysis for resultant force using the wiper cutting edge tool are displayed in Table 9. It is clear from the table that all three factors have significant effects on the resultant force. These results are different from the conventional cutting edge, in which the cutting speed effect on the resultant force was not significant. The main effect plots of the three factors are shown in Figure 14.

Table 9.
ANOVA results for F using wiper cutting edge.
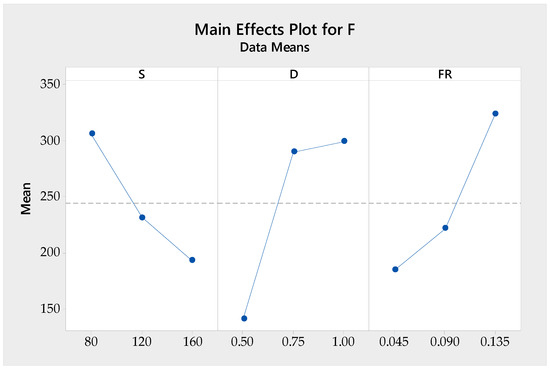
Figure 14.
Main effect plots for F using wiper edge.
Table 10 summarizes the ANOVA results for the measured temperature with the wiper cutting edge. The three factors have significant effects with no interaction, in contrast to the conventional edge. Figure 15 shows the main effect plots for the temperature.

Table 10.
ANOVA results for T using wiper cutting edge.
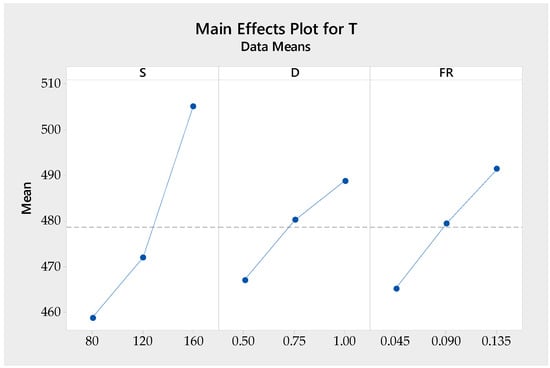
Figure 15.
Main effect plots for T using wiper cutting edge.
Table 11 summarizes the mathematical equations representing the measured outputs. These equations were constructed by regression using the least squares method. They could be used in predicting these responses under different machining conditions.

Table 11.
Mathematical equations for the measure responses.
The desirability function optimization tool was used to minimize Ra, F, and T, and to maximize MRR with the same optimizing conditions used with the conventional edge. The optimum values for the factors were calculated to be S = 160 m/min, D = 0.52 mm, and FR = 0.075 mm/rev. The expected optimum responses were calculated to be Ra = 0.7 µm, F = 93.7 N, T = 487.5 °C, and MRR = 6163 mm3/min. Figure 16 shows the optimization plot.
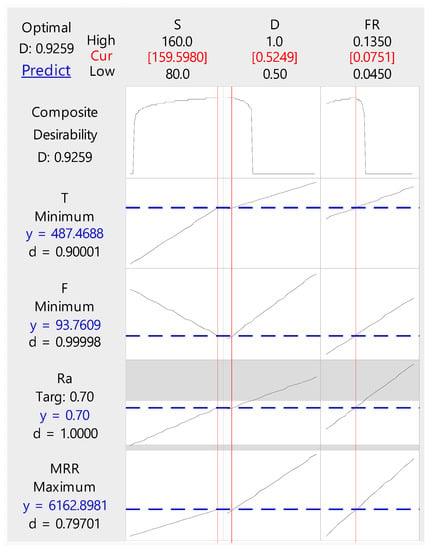
Figure 16.
Optimization plot for responses using wiper cutting edge.
For both force and surface roughness, d equals 1.0, proving that these two responses will be optimized with perfection. For temperature, d equals 0.9, and for MRR, d equals 0.79. These numbers show that the temperature and material removal rate will be optimized to a good extent, but not with perfection. For the combined responses, D, equals 0.93, proving that the combined optimization is well achieved. The results show that the same value of Ra could be achieved with the wiper edge at a higher removal rate than the conventional edge, which gives an advantage for the wiper edge in machining.
4. Conclusions
This manuscript presented an experimental investigation and statistical analysis of the dry turning of the AISI 1045 steel alloy for two cases of tools inserts used in machining: the wiper type insert and the conventional round-nose insert. The experimental results for the performance of the wiper inserts are compared with the results recently reported by the authors in [1] and obtained under similar cutting conditions. In particular, the following is concluded:
- For conventional inserts, the optimal process conditions to be applied are cutting speed: 160 m/min, cut depth: 0.52 mm, and feed rate: 0.05 mm/rev. These parameters produce a surface roughness of 0.7 µm, a cutting force of 114 N, a cutting temperature of 468 °C, and a material removal rate of 3726 mm3/min.
- For a wiper-shaped insert, the optimal parameters are a cutting speed of 160 m/min, depth of cut 0.52 mm, and feed rate 0.075 mm/rev, which produce the following optimum responses: surface roughness: 0.7 µm, cutting force: 93.7 N, cutting temperature: 487.5 °C, and material removal rate: 6163 mm3/min.
- One can conclude that cutting inserts with a wiper edge prove to provide lower surface roughness than inserts with a conventional cutting edge under the same set of cutting conditions. This advantage allows wiper tools to use higher feed rates, resulting in a greater material removal rate, while obtaining the same value of surface roughness, which gives an advantage for the wiper edge in machining.
- There are no notable differences between the resultant cutting forces of both cutting edges at low cutting speeds. However, for higher cutting speeds, wiper inserts outperform the conventional round inserts with regard to obtainable cutting forces, which demonstrates the superiority of wiper inserts not only in terms of surface roughness but for less cutting force.
- At high cutting speeds, wiper inserts exhibit higher values of cutting temperature and, thus, conventional round-nose inserts are recommended at such high levels of cutting speeds.
- For conventional round-nose inserts, the feed rate was found to be the most significant parameter affecting the generated surface roughness, cutting force, and temperature. For wiper inserts, the feed rate was found to be the most significant parameter affecting surface roughness and cutting speed, while for cutting temperature, cutting speed was the most effective factor.
Author Contributions
Concept, A.T.A. and A.E; methodology, A.T.A. and A.E.; software, A.A.A.-A. and F.B.; validation, A.A.A.-A., M.M.E.R. and A.E.R.; formal analysis, A.E., A.E.R. and A.T.A.; investigation, A.E., A.E.R., A.A.A.-A. and F.B.; resources, A.T.A.; data curation, A.T.A., A.E.R., M.M.E.R. and A.A.A.-A.; original draft preparation, A.E.R., A.T.A. and A.E.; writing—review and editing, A.A.A.-A., F.B. and A.E.; visualization, F.B., A.E. and A.A.A.-A.; supervision, A.E. and A.T.A.; project administration, A.A.A.-A. and F.B.; funding acquisition, A.T.A. All authors have read and agreed to the published version of the manuscript.
Funding
This research received no external funding.
Data Availability Statement
Not applicable.
Acknowledgments
The authors acknowledge the funding of the Deanship of Scientific Research at King Saud University through research group No. RG-1439-020 with appreciation.
Conflicts of Interest
The authors declare no conflict of interest.
References
- Abbas, A.T.; Al-Abduljabbar, A.A.; El Rayes, M.M.; Benyahia, F.; Abdelgaliel, I.H.; Elkaseer, A. Multi-Objective Optimization of Performance Indicators in Turning of AISI 1045 under Dry Cutting Conditions. Metals 2023, 13, 96. [Google Scholar] [CrossRef]
- Abbas, A.T.; Al-Abduljabbar, A.A.; Alnaser, I.A.; Aly, M.F.; Abdelgaliel, I.H.; Elkaseer, A. A Closer Look at Precision Hard Turning of AISI4340: Multi-Objective Optimization for Simultaneous Low Surface Roughness and High Productivity. Materials 2022, 15, 2106. [Google Scholar] [CrossRef] [PubMed]
- Abbas, A.T.; Gupta, M.K.; Soliman, M.S.; Mia, M.; Hegab, H.; Luqman, M.; Pimenov, D.Y. Sustainability assessment associated with surface roughness and power consumption characteristics in nanofluid MQL-assisted turning of AISI 1045 steel. Int. J. Adv. Manuf. Technol. 2019, 105, 1311–1327. [Google Scholar] [CrossRef]
- Brown, I.; Schoop, J. The effect of cutting edge geometry, nose radius and feed on surface integrity in finish turning of Ti-6Al4V. Procedia CIRP 2020, 87, 142–147. [Google Scholar] [CrossRef]
- Khidhir, B.A.; Mohamed, B. Analyzing the effect of cutting parameters on surface roughness and tool wear when machining nickel based hastelloy—276. Mater. Sci. Eng. 2011, 17, 012043. [Google Scholar] [CrossRef]
- Rodrigues, A.R.; Coelho, R.T. Influence of the Tool Edge Geometry on Specific Cutting Energy at High Speed Cutting. J. Braz. Soc. Mech. Sci. Eng. 2007, 29, 279–283. [Google Scholar] [CrossRef]
- Abbas, A.T.; El Rayes, M.M.; Luqman, M.; Naeim, N.; Hegab, H.; Elkaseer, A. On the Assessment of Surface Quality and Productivity Aspects in Precision Hard Turning of AISI 4340 Steel Alloy: Relative Performance of Wiper vs. Conventional Inserts. Materials 2020, 13, 2036. [Google Scholar] [CrossRef] [PubMed]
- Mourão, A.; Slătineanu, L.; Gonçalves-Coelho, A.M. The effect of wiper edge inserts on the specific cutting energy in face milling of aluminium alloys. Int. J. Mod. Manuf. Technol. 2010, 2, 71–77. [Google Scholar]
- Khan, S.A.; Umar, M.; Saleem, M.Q.; Mufti, N.A.; Raza, S.F. Experimental investigations on wiper inserts’ edge preparation, workpiece hardness and operating parameters in hard turning of AISI D2 steel. J. Manuf. Process. 2018, 34, 187–196. [Google Scholar] [CrossRef]
- Dogra, M.; Sharma, V.S.; Dureja, J. Effect of tool geometry variation on finish turning—A Review. J. Eng. Sci. Technol. Rev. 2011, 4, 1–13. [Google Scholar] [CrossRef]
- Abbas, A.T.M. Comparative Assessment of Wiper and Conventional Carbide Inserts on Surface Roughness in the Turning of High Strength Steel. J. Mater. Sci. Res. 2016, 5, 32. [Google Scholar]
- Pimenov, D.Y.; Abbas, A.T.; Gupta, M.K.; Erdakov, I.N.; Soliman, M.S.; El Rayes, M.M. Investigations of surface quality and energy consumption associated with costs and material removal rate during face milling of AISI1045 steel. Int. J. Adv. Manuf. Technol. 2020, 107, 3511–3525. [Google Scholar] [CrossRef]
- Szczotkarz, N.; Maruda, R.W.; Debowski, D.; Leksycki, K.; Wojciechowski, S.; Khanna, N.; Królczyk, G.M. Formation of Surface Topography During Turning of AISI 1045 Steel Considering the Type of Cutting Edge Coating. Adv. Sci. Technol. Res. J. 2021, 15, 253–266. [Google Scholar] [CrossRef]
- D’Addona, D.M.; Raykar, S.J. Analysis of surface roughness in hard turning using wiper insert geometry. Procedia CIRP 2016, 41, 841–846. [Google Scholar] [CrossRef]
- Patil, A.; Rudrapati, R.; Poonawala, N.S. Examination and prediction of process parameters for surface roughness and MRR in VMC-five axis machining of D3 steel by using RSM and MTLBO. Mater. Today Proc. 2021, 44, 2748–2753. [Google Scholar] [CrossRef]
- Jumare, A.I.; Abou-El-Hossein, K.; Abdulkadir, L.N.; Liman, M.M. Predictive modeling and multiobjective optimization of diamond turning process of single-crystal silicon using RSM and desirability function approach. Int. J. Adv. Manuf. Technol. 2019, 103, 4205–4220. [Google Scholar] [CrossRef]
- Benkhelifa, O.; Cherfia, A.; Nouioua, M. Modeling and multi-response optimization of cutting parameters in turning of AISI 316L using RSM and desirability function approach. Int. J. Adv. Manuf. Technol. 2022, 122, 1987–2002. [Google Scholar] [CrossRef]
- Ramesh, R. Prediction of surface roughness in cylindrical grinding of glass fiber reinforced epoxy composite. Int. J. Mach. Mach. Mater. 2022, 24, 405–418. [Google Scholar]
- Phanphet, S.; Bangphan, S. Application of Full Factorial Design for Optimization of Production Process by Turning Machine. J. Tianjin Univ. Sci. Technol. 2021, 54, 35–55. [Google Scholar]
Disclaimer/Publisher’s Note: The statements, opinions and data contained in all publications are solely those of the individual author(s) and contributor(s) and not of MDPI and/or the editor(s). MDPI and/or the editor(s) disclaim responsibility for any injury to people or property resulting from any ideas, methods, instructions or products referred to in the content. |
© 2023 by the authors. Licensee MDPI, Basel, Switzerland. This article is an open access article distributed under the terms and conditions of the Creative Commons Attribution (CC BY) license (https://creativecommons.org/licenses/by/4.0/).