Abstract
Today, over 80% of global trade is seaborne. In a world of global supply chains and complex industrial development processes, seaports and port operators play an integral role of utmost importance and act as an incentive to the development of the marine economy and particularly, the national economy in general. Most importantly, the supply chain and demand shocks of Covid-19 on container ports and the container shipping industry have intensified competition among terminal operators. Thus, it is imperative that managers evaluate competitiveness by measuring their past and current performance efficiency indexes. In so doing, we present a hybrid data envelopment analysis (DEA) model that combines the DEA Malmquist method and the epsilon-based measure (EBM) for the first time to address the issue of performance evaluation of seaport terminal operators. The applicability of the proposed hybrid approach is illustrated with a case study of the top 14 seaport companies in Vietnam. First, the Malmquist model is used to assess the total productivity growth rates of the companies, and its decomposition into technical efficiency change (catch-up) and technological investment (frontier-shift). Second, the EBM model is used to calculate the efficiency and inefficiency score of each company. Besides indicating the best-performing companies from certain aspects during the research period (2015–2020), the results reflect that the gap of applying the EBM method in the field of the maritime industry was successfully addressed, and together with the Malmquist model, the integrated framework can be an effective and equitable evaluation model for any area. Furthermore, the managerial implication provides a useful guideline for practitioners in the maritime sector in improving their operational efficacy and helps customers in selecting the best seaport companies in the outsourcing strategy.
Keywords:
decision-making; efficiency; inefficiency; seaport terminal operators; data envelopment analysis; Malmquist; epsilon-based measure MSC:
90B50; 62-07; 62P20; 90B06; 68M20
1. Introduction
Maritime transport remains the backbone of the ever-increasing globalized economy and international trade system, supporting significantly the ongoing and complex processes of global supply chains. Today, over 80% of world merchandise trade by volume is carried by sea and handled by ports [1]. Seaport terminals form vital links in the overall trading chain, acting as an incentive to the development of the marine economy and a key contributor to a nation’s international competitiveness. In supporting economic activities in the hinterland, seaport terminal and terminal operators play a role of utmost importance as a crucial connection between sea and land transport. Port activities are no longer limited to just cargo handling. In an international context, they have become a core part of the businesses and economic markets. An increasing number of port terminals, serving either cargoes or passengers, are managed by operators maintaining an international portfolio. Each terminal function as a crucial node in the maritime/land interface, allowing maritime and inland systems to interact. The balance between market demand, ship capacity and frequency, and hinterland distribution requires a variety of footprints and design considerations [2].
Given the abovementioned significance of the maritime industry, seaport terminal operators play the role of facilitator and partner, being capable of huge impact on the shipping networks to global and national economies. For each nation concerning the exploitation of seaports, there are certain difficulties and challenges that terminal operators need to overcome to keep pace with the sustainability and resilience of the maritime transport sector. In so doing, terminal operators must decide whether and how to invest in infrastructures and technology whereby to enhance port efficiency and service quality, ensure full functionality of supply chains [3], and respect for the protection of public health, while maximizing profit and minimizing pollution in transportation [4]. However, there has been little attention paid as to the operators were which assure and strengthen the sustainability and resilience of the port operation efficiency and maritime transport sector in general [5]. Within this perspective, an evaluation model for measuring technical/operational efficiency, technological capacity and advancement, and performance productivity of the seaport operators is a necessity, whereby their trend of development can be reflected.
Although there are numerous studies on efficiency evaluation in various industries, there is still limited literature conducted on the maritime industry in general, seaport operators in particular, especially in developing countries context [6,7,8,9,10,11,12,13]. Developing countries have made remarkable progress in international seaborne transport, taking Vietnam as a good example. As a coastal country, an enormous share of domestic cargo in Vietnam is moved via sea transport due to the cost-effectiveness compared to road transports. Internationally, Vietnam has become globally recognized as a regional trade hub, ranking seventh in liner shipping connectivity in Asia [14]. The country has 320 ports, of which 163 are international ports, named as the keys to economic development [15]. Its sea is spacious and includes many peninsulas, seas, and wind-tight, deep bays in proximity to the international navigation routes between the Indian Ocean and the Pacific Ocean. Ships from Vietnam’s seaports in the East Sea could sail to the Strait of Malacca, Indian Ocean, Middle East, Europe, and Africa while crossing the Bashi Strait into the Pacific Ocean for seaports of Japan, Russia, and America. Therefore, seaports are known as a paramount gateway for import and export goods and as a hub to convert modes of transport from sea transport to rail, road, and inland waterway transport. In Vietnam, the seaport system passes up to 90% of import and export goods year on year, contributing to the driving force of the country’s economic development, helping Vietnam to accordingly actualize the goal of expediting and developing seaports to become a prosperous nation. Within this context, terminal operators are playing a critical role in marine logistics in respect of domestic and international supply chains in Vietnam. In the last ten years, rapid economic expansion in Vietnam has driven up shipping demand, highlighting the importance of ports. In effect, the roles of seaport terminal operators have become much stronger in the port industry over the last decade. Vietnam’s seaport terminal operator, also called port companies, are thriving with the strategy of building and developing a sustainable on three pillars: exploitation of seaports, logistics service, and inland marine transport service, based on three platforms: top-quality service, advanced management for high-quality human resources, military discipline-corporate culture, associated with community responsibility [16].
To evaluate the efficiency of seaport terminal operators, the data envelopment analysis (DEA) methods have appeared to be promising for this task. DEA has been used to evaluate the relative performance of organizational units called decision-making units (DMUs), which convert multiple inputs into multiple outputs. The aim of the DEA approach is to select a set of efficient and inefficient units. In this paper, a novel hybrid DEA model using the DEA Malmquist and the epsilon-based measure (EBM) models is proposed to solve a case study of performance evaluation of seaport terminal operators in Vietnam. The Malmquist model is a very useful approach to evaluate the efficiency change of the DMUs over time. Malmquist productivity index (MPI) is calculated as a product of the product of catch-up (or recovery) and frontier-shift (or innovation) terms, both coming from the DEA technologies. This feature makes it a suitable approach that reflects the overall picture of an industry, for example, to investigate how the involved organizations perform in terms of technical efficiency, technological innovation, and total productivity. Proposed by Tone and Tsutsui [17], EBM is an epsilon-based DEA model that examines the DMUs’ efficiency and inefficiency in a unified framework that combines radial and non-radial models. The radical measures of efficiency are considered in cases where the inputs or outputs may change proportionally, while the non-radial model relaxes the proportionality and allows independent changes of associated slacks in the inputs or outputs. Thus, the EBM model is used to consider the radial and non-radial inputs and outputs simultaneously, therefore, provides a more robust solution.
By using the prescribed approach, the author considered 14 potential port companies of Vietnam in respect of efficiency evaluation. Based on the importance of financial indicators, four input variables are listed, which are total assets, owner’s equity, liabilities, and operation expense, whereas revenue and net profit are chosen as output variables. The dataset is collected in the Vietnamese stock market for the period 2015–2020. The main contributions of this paper are three-fold: (1) the EBM method is proposed for the first time in the performance evaluation problem of the maritime industry, combining with the Malmquist DEA model; (2) a case study of 14 seaport companies in Vietnam is used to illustrate the applicability of the proposed hybrid approach; (3) the results reflect that the gap of applying the EBM method in the field of the maritime industry is successfully addressed, and together with the Malmquist model, the integrated framework can be a more robust evaluation model. With respect to practical contributions, the current study provides holistic insights for management and policymakers of port operators with different levels of technical efficiency and technological advancement. In so doing, we endeavor to help relevant organizations optimize their performances with efficiency. Additionally, the proposed approach can be a significant guideline for efficiency evaluation in any industry.
The paper unfolds as follows. In Section 2, the authors present a review of the relevant literature in DEA models and their applications in the maritime sector. Section 3 provides the research procedure and discussion regarding the theory of the Malmquist and EBM models. In Section 4, we present the case study of Vietnam to exhibit the efficacy of the procedures and to demonstrate the applicability of the proposed method to the performance evaluation problem in the maritime industry. In Section 5, we present our concluding remarks, contributions, and shortcomings of the study and provide future search directions.
2. Research Process and Literature Review
2.1. Research Process
In this paper, an integrated DEA Malmquist and EBM model are applied for efficiency assessment of the Vietnamese’s top 14 seaport terminal companies for the period 2015–2020. The research process consists of two main phases, as can be seen in Figure 1. In the first phase, the DEA Malmquist model is used to assess the total productivity change through technical efficiency change (catch-up) and technological investment (frontier-shift) based on the selected inputs (total assets, owner’s equity, liabilities, operation expense) and outputs (revenue, net profit). Before applying the DEA Malmquist model, Pearson correlation is checked to ensure the homogeneity and isotonicity of the dataset. In the second phase, the EBM model is used to calculate the efficiency and inefficiency score of DMUs. The indexes of diversity and affinity coefficient are verified before using the EBM model.
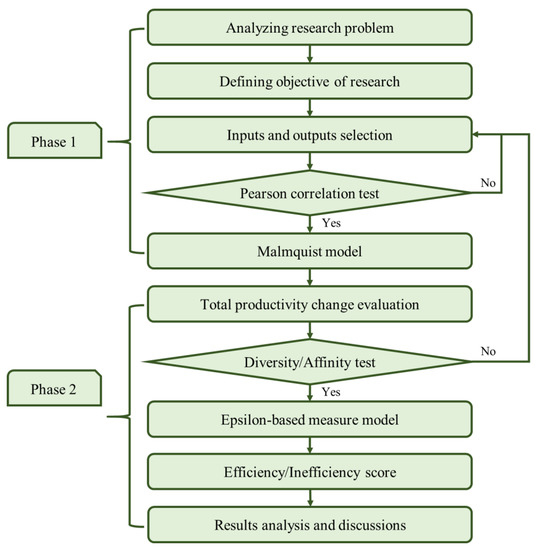
Figure 1.
Research process.
2.2. Literature Review
There are various notable studies that implemented the efficiency evaluation problems of seaport and seaport terminal operators. For example, Cruz et al. [12] evaluated Iberian seaport competitiveness using the data envelopment analysis (DEA) approach. Min et al. [13] proposed an integrated terminal operating system using the structural equation model (SEM) for enhancing the efficiency of seaport terminal operators. The authors suggested some key performance indicators of terminal operations that measure the comparative performances of both integrated and non-integrated groups of terminal operators. In research considering 91 countries with seaports, Munim and Schramm [18] conducted an empirical inquiry into the broader economic contribution of seaborne trade from a port infrastructure quality and logistics performance perspective. In the case of Vietnam, Pham and Yeo [8] proposed the consistent fuzzy preference relation (CFPR) method in order to examine the service quality of transshipment container terminals in Vietnam from the perspective of shipping companies. Dong et al. [19] expounded the significance of the environmental performance of a container port that has a great impact on its competitiveness and sustainable development. The authors applied the DEA model with slack-based measure (SBM) to evaluate and compare the environmental performance and operational efficiency of 10 major container ports along the Maritime Silk Road, including the ports of Shanghai, Hong Kong, Singapore, Kelang, Laem Chabang, Colombo, Dubai, Barcelona, Antwerp, and Hamburg.
In terms of methodologies, multi-criteria decision making (MCDM) has become a crucial practice in the assessment process of seaport operators’ potential and competitiveness. In constructing an effective performance evaluation mechanism, many researchers have applied ranking MCDM methods such as technique for order preference by similarity to ideal solution (TOPSIS), vlseKriterijumska optimizacija i kompromisno resenje (VIKOR), complex proportional assessment (COPRAS), and preference ranking organization method for enrichment of evaluations (PROMETHEE II), to mention just a few. Despite the large number of methods, it is noteworthy that no method is perfect and cannot be considered suitable for use in every decision-making situation or for solving every decision problem. Comparative studies have been conducted to analyze the similarity of rankings obtained by some of the abovementioned methods, as well as to recommend suitable methods based on the problems’ characteristics [20,21]. Moreover, it is also worth noting that the identification of relevant criteria set in the constructed decision-making model play a crucial role in the next stage of modeling the decision maker’s preferences (criteria weighting or evaluation of alternatives) [22,23].
In addition, the use of data envelopment analysis (DEA) as a tool for MCDM has widely used for the performance evaluation problem in various industries. Developed by Charnes et al. [24] in 1978, DEA is a powerful data processing and analysis tool for measuring the efficiency of a set of peer business units, which are referred to as DMUs. Their efficiency performance indexes are defined by the output-to-input ratio of a system. The ease with which DEA can handle multiple inputs and multiple outputs makes it an attractive choice of technique for measuring the efficiency of the DMUs. In the performance evaluation problem for the port industry, DMUs relate to a collection of seaports, terminal operators, warehouses, shipping companies, to name a few, which participate in the processes or systems. Many research studies have been conducted around the world utilizing DEA and DEA-based modeling approaches with respect to the assessment of various relevant areas in the maritime sector: container port [25,26,27,28], logistics [29,30,31], warehouse [32], and shipping [33]. In terms of proposed models, the applications of CCR (Charnes–Cooper–Rhodes) and BCC (Banker–Charnes–Cooper), the first and basic models of DEA have been highlighted in various studies on the maritime sector [25,29,30,31,32]. The concept of the CCR model is to identify the overall inefficiency, whereas the BCC model differentiates between technical efficiency and scale efficiency. Based on the traditional DEA model, the super slack-based measure (super SBM) model is used in [28,33], aiming to eliminate the slack problem while accurately ranking the effectiveness of DMUs, further optimizing the shortcomings to obtain reasonable metrics. As an extension of the initial DEA model, the DEA Malmquist model is a very useful approach for measuring DMUs’ productivity, whereby the Malmquist productivity index (MPI) is the product of technical efficiency and frontier-shift (technological efficiency change) indexes [34]. Applications of DEA Malmquist models in maritime areas are discussed in [26,31,33]. Other methodologies used are the analytic hierarchy process (AHP) and linear programming (LP) [30], regression model [26], and principal components analysis (PCA) [27]. Table 1 summarizes some relevant studies and discusses in each one the inputs and criteria, outputs and responses, methodologies, and applied areas.

Table 1.
Summary of methodologies and problem characteristics in previous studies.
As discussed above, the literature on the evaluation problem in the seaport industry, especially the efficiency assessment of seaport terminal operators, is still limited. There has also been no research implemented for the case of Vietnam that looks into evaluating the performance of the country’s seaport terminal operators. Hence, this lack led to our research motivation. In this paper, the authors aim to fill the gap in the existing literature by solving a case study for evaluating the efficiency of 14 seaport terminal operators (port companies) in Vietnam. Additionally, from our literature review, the proposed evaluation approach that combines the DEA Malmquist and the epsilon-based measure (EBM) models in the seaport industry has never been reported. As can be seen from Table 1, CCR, BCC, SBM, and the Malmquist model are commonly used in relevant problems. However, it is evident that the EBM model has almost been missed in the literature review of the maritime sector’s decision-making and evaluation. The advantage of the EBM method is that it appears to solve the weaknesses of the CCR, BCC, and SBM models. CCR and BCC are radial approaches, it only focuses on the proportionate change of input or output and ignores the appearance of slacks. In the meantime, SBM (non-radial) was improved by CCR and BCC, which faces with slacks directly but does not concern a proportionate of input/output’s changing. Thus, the EBM model was invented as a solution for those shortcomings, which combines both radial and non-radial features [17]. In the EBM model, a scalar measures epsilon that represents the diversity or the scattering of the observed dataset. Additionally, slack represents the potential improvement in the input and output variables for the inefficiency units compared to the benchmark target. In summary, we adopt the combinational approach in order to take the advantages offered by the abovementioned methods from the proposed research procedure and hope that it can be a robust evaluation model in any area.
3. Materials and Methods
3.1. Theory of Malmquist Model
Before applying the DEA Malmquist model, it is very critical to verify that all the variables used to analyze must have a positive correlation. Therefore, the Pearson correlation test is first used to ensure that this prerequisite is met. The higher the correlation coefficient, the closer the relationship between the two variables, and the lower the correlation coefficient, the lower the relationship. The correlation coefficient is always between −1 and +1. When the correlation coefficient is close to ±1, this means that the two groups are close to an ideal linear relationship [35]. The Pearson ( is shown in Equation (1).
where n is sample size; and are individual sample indexed with .
The operational efficiency of DMUs is measured from period to period , consisting of technical efficiency (catch-up, ), technological effect (frontier-shift, ), and total productivity (), as can be seen in Equations (2)–(4) [36,37].
where denotes decreasing in operational efficiency, denotes increasing in operational efficiency, and denotes no change in operational efficiency.
3.2. Theory of Epsilon-Based Measure Efficiency
DEA can deal with multiple input and output variables in efficiency evaluation [38]. Charnes–Cooper–Rhodes (CCR) is a basic model which focuses on the proportionate change of input and output but ignores the appearance of slacks (i.e., radial approach). While slack-based measure (SBM) faces with slacks directly but does not concern a proportionate of the change in input and output (non-radial approach). In the EBM model, a scalar measures epsilon that represents the diversity or the scattering of the observed dataset (i.e., input dispersion). Many relevant studies have considered slacks as the potential improvement in the variables for the inefficiency units [39,40].
Throughout the EBM model, the list of symbols and notations is applied. The model considers DMUs () including inputs () and outputs (). and represent input and output matrices, respectively. The and matrices are non-negative. The input-oriented model with a constant return to scale (EBM-I-C) is shown, as can be seen in model (5).
where denotes the intensive vector of DMU, the subscript “” denotes the DMU is under evaluation, and denote the amount of slack and weight in the input, a parameter which depends on the degree of dispersion of inputs, and denotes the radial properties.
Figure 2 shows the scattering of the observed dataset with low dispersion () that implies the EBM model is changed to the CCR model. Meanwhile, Figure 3 shows the scattering of the observed dataset with low dispersion (), which implies that the EBM model is changed to the SBM model. Before applying the EBM model, the affinity index, which is used for measuring the similarity among input and output variables, is checked. Let and denote diversity index and affinity index between two variables, respectively. The EBM model need to satisfy the conditions, which are , and , according to Tone and Tsutsui [17].
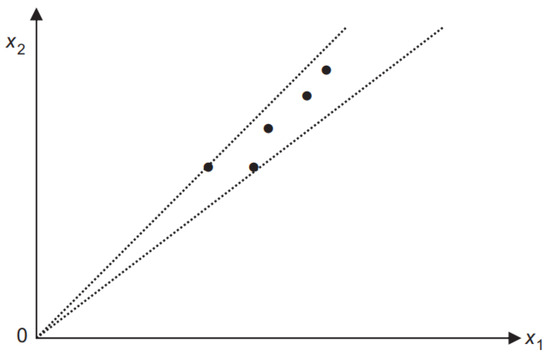
Figure 2.
The scattering of the observed dataset with low dispersion ().
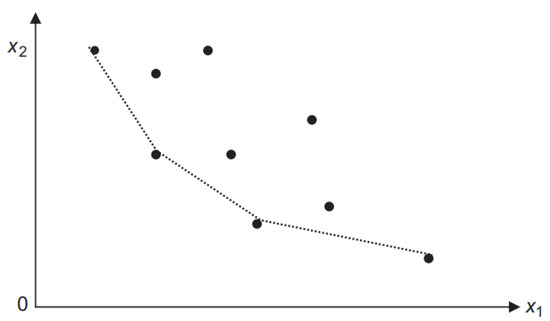
Figure 3.
The scattering of the observed dataset with high dispersion ).
4. Results and Discussions
4.1. Data Collection
This paper assesses the productivity and ranks the efficiency of the top 14 seaport terminal companies in Vietnam for the 6-year period 2015–2020. The dataset for the study was collected from the Vietnamese stock market [41]. Table 2 shows the list of DMUs and their profit in 2020.
Table 2.
List of DMUs and their profit in 2020.
In the DEA Malmquist model, inputs and outputs play an important role in measuring DMU’s performance. The authors reviewed many relevant studies in the past few decades to support the selection of the financial variables in the paper’s model. After a thorough study, the authors consider four inputs, namely total assets, owner’s equity, liabilities, and operating expense, while revenue and profit are considered as output variables. The statistics description on input and output data is presented in Table 3. Moreover, the correlation coefficient on input and output data from 2015 to 2020 is shown in Table A1 Appendix A, which all are positive and high correlation with the values range from 0.462 to 0.927. Hence, the dataset can be used for the DEA Malmquist model in the next step.
Table 3.
Statistical description of input and output data (2015–2020).
4.2. Results of Malmquist Model
4.2.1. Technical Efficiency Change
The technical efficiency changes of the DMUs over time are expressed by the catch-up index shown in Table 4 and Figure 4. Figure 4 depicts the evolution of the catch-up indexes for all port companies and Table 4 reports the detailed catch-up values. Catch-up index, with scores >1 and <1, respectively, corresponds to the progress and regress in technical efficiency of DMUs. According to Table 4, all of the DMUs achieved progressive technical efficiency on average (average catch-up indexes >1) over the entire period 2015–2020, leading to the overall average catch-up = 1.1414. Among these, port-14 (1.6325), port-12 (1.3641), and port-10 (1.2387) are the three DMUs with the best technical efficiency improvement on average during 2015–2020. In the meantime, port-04 (1.0040), port-02 (1.0206), and port-06 (1.0251) are the least effective operators on average. From Figure 4, we note that port-14 and port-12 show the most fluctuating performances during the research period, as does port-13. Specifically, port-13 and port-14 reached their peaks in technical efficiency during the 2016–2017 period, with catch-up indexes of 2.3894 and 2.8818, respectively. Moreover, port-14 experienced a slump in technical efficiency during 2018–2019 at a catch-up index of 1.3342. The technical efficiency of port-13 plummeted to only 0.5416 in 2017–2018, being the worst-performing operator during this period. Port-12 tremendously increased its catch-up score from only 0.7377 in 2015–2016 to 2.0892 in 2016–2017, then achieving its highest efficiency at 2.5855 in 2017–2018, but ending up having by far the worst catch-up index in 2019–2020 (0.2974). The technical efficiency evolutions of the remaining DMUs show almost stable patterns.
Table 4.
Technical efficiency change for the period 2015–2020.
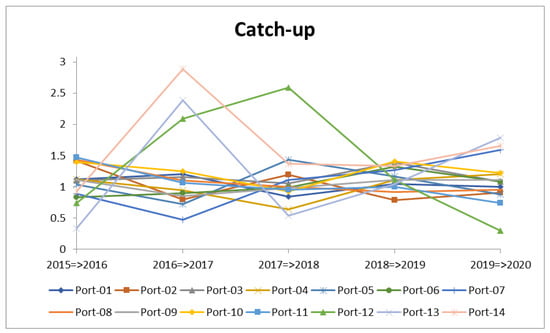
Figure 4.
Technical efficiency change (catch-up).
4.2.2. Technological Change
Frontier-shift indexes express the technological change (efficiency-frontiers) of the DMUs between two periods, reflecting their performance in light of various circumstances such as competition, technological change, innovations, regulatory and political environment, to mention a few. Table 5 reports the detailed frontier-shift values of the DMUs, and Figure 5 plots the technological efficiencies’ evolution paths for all DMUs. From Table 5, more than one-third of the DMUs failed to achieve the progressive average frontier-shift scores, including port-02 (0.9602), port-08 (0.9981), port-09 (0.9840), port-11 (0.9840), and port-14 (0.9510). In the meantime, port-07 (1.0401), port-10 (1.0613), port-12 (1.0839) are the best technological performers. As the majority of DMUs (nine out of 14 DMUs) have progressive average frontier-shift indexes, the overall average frontier-shift score = 1.0127 (efficiency gain) during the research period. In comparison to Figure 4 (catch-up), Figure 5 displays more fluctuate patterns of the DMUs that represent the evolution of their technological performances, namely port-02, port-03, port-05, port-07, port-10, port-12, port-13, port-14. Among these, port-13 had the least-stable technological efficiency performance during 2015–2020. This DMU reached a maximum of 1.7014 in 2017–2018 that was markedly higher than other companies, but then experienced a slump to the extremely worst score (0.5851) in 2019–2020.
Table 5.
Technological change for the period 2015–2020.
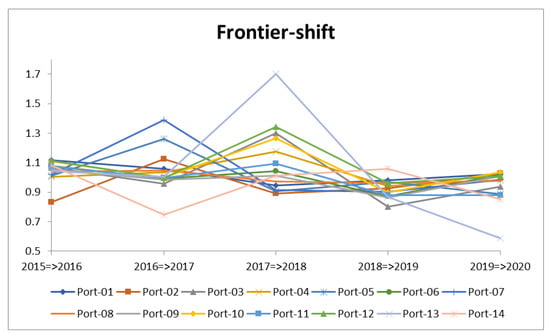
Figure 5.
Technological change (frontier-shift).
4.2.3. Total Productivity Change
We solve Equation (4) to obtain the Malmquist Productivity Indexes (MPIs) of the DMUs. Table 6 reports the detailed MPI values while Figure 6 depicts the evolution of the MPIs for all companies. We note that MPI = 1 indicates a status quo in efficiency, MPI > 1 represents efficiency gain, and MPI < 1 corresponds to efficiency loss. As in Table 6, all DMUs achieved efficient performance on average, except for port-02 (0.9600). This result is conspicuous since port-02 performed the worst in both technical and technological efficiency, with the worst catch-up and frontier-shift scores discussed in 4.2.1 and 4.2.2. Regardless of that, the average MPI of all DMUs higher than 1 (1.1359) indicates a progression in the total productivity growth of the companies during the research period. Port-10 (1.2979), port-12 (1.5475), and port-14 (1.4730) are the three companies with the biggest efficiency gain. This can be expounded by that these DMUs obtained good performance in both technical and technological efficiency. Figure 6 displays almost the same trends of the DMUs compared to those in Figure 4 (catch-up). In particular, port-12, port-13, and port-14 exhibit the least stable performance over 2015–2019, having the exact same patterns as their trends of catch-up efficiency displayed in Figure 4 (catch-up).
Table 6.
Total productivity change for the period 2015–2020.
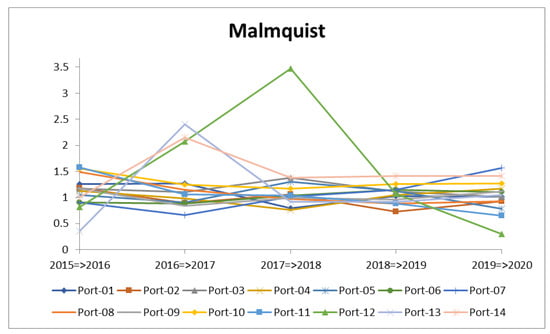
Figure 6.
Total productivity change (Malmquist).
4.3. Results of Epsilon-Based Measure Efficiency
After analyzing the total productivity through technical efficiency change (catch-up index) and technological investment effects (frontier-shift index), the results of the DEA Malmquist model show the current operational picture of the top 14 seaport terminal companies in Vietnam. In this phase, EBM model is used to rank the efficiency and inefficiency scores of 14 DMUs for the period 2015–2020.
In this paper, the input-oriented model with a constant return to scale (EBM-I-C) is applied. According to EBM’s procedures, the diversity of production possibility set by means of the affinity matrix derived from the observed input and output variables is measured. Table A2 and Table A3 present the matrices of diversity index and affinity index in the EBM model for the period 2015–2020, respectively. Based on the results, the values of the diversity matrix and affinity matrix range from 0 to 0.2995 and from 0.4011 to 1, respectively. These values are satisfying the model’s conditions. Hence, EBM can be applied for ranking efficiency/inefficiency of DMUs. Following that, the weight to input/output and epsilon for the EBM model is calculated (Table 7). It shows that the epsilon for the EBM model, which is a key parameter in combining radial and non-radial aspects, is positive during the considered period 2015–2020 (i.e., the values range from 0.3795 to 0.4827).
Table 7.
Weight to input/output and epsilon for EBM model (2015–2020).
Based on the epsilon for the EBM model and weight to input/output, the relative ranking efficiency and inefficiency of 14 DMUs in 2015–2020 are calculated, as can be seen in Table 8 and Figure 7. From the results, port-02 (Dinh Vu) achieves a strong efficiency as the score is 1, and its slacks is 0 for the whole period 2015–2020 as well. Additionally, port-01 (Cat Lai), Tan Cang (port-04), An Giang (port-05) also obtain a strong efficiency score in the 5-year period, with 2016–2020, 2015–2017, and 2019–2020, 2015–2016, and 2018–2020, respectively. Following that, port-06 (Da Nang), port-09 (Hai Phong), port-10 (Cam Ranh), port-11 (Chan May) show a weak efficiency score. In particular, port-09 (Hai Phong), port-10 (Cam Ranh), port-11 (Chan May) have the lowest efficiency scores for the whole considered period from 2015 to 2020. It is important to show that the seaport companies with EBM efficiency score less than 1 (especially the top three ports with the lowest score) should proactively monitor by improving the technical efficiency, i.e., maximize their resource such as capital, labor, equipment supplies, and/or technological investment effect, i.e., focus on technology development. For port companies whose EBM efficiency score reaches 1, this shows the potential for more profitable investment.
Table 8.
Efficiency score of EBM model (2015–2020).
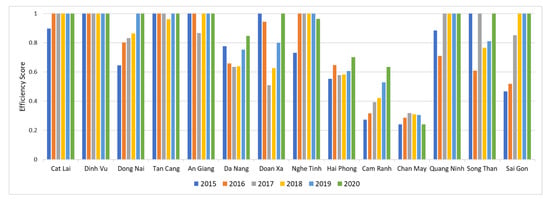
Figure 7.
Ranking of seaport terminal companies.
4.4. Discussions
Taking the results from the Malmquist model into account, it can be observed that there are just a few fluctuating patterns in efficiency evolutions of seaport terminal operators over the years, which can be seen in Figure 6 (Malmquist productivity indexes). However, it is noteworthy that the technological evolutions have more fluctuate trends that reflect how technology innovation impacts seaport’s performance as well as the global network logistics in a digital world [42,43]. From the EBM model’s findings, there is a large majority of the companies that achieved their utmost performance over the years, as shown in Table 6. Most notably, most companies obtained perfect efficiency scores in 2020 (nine out of 14 DMUs), despite the global economic recession caused by Covid-19. As a matter of fact, Vietnamese trade has been growing steadily since the beginning of 2020. According to Vinamarine [44], total international cargo throughput through Vietnamese seaports increased by 9.8% in 2020, of which international container throughput rose by 9% to 14.4 million twenty-foot equivalent units (TEUs), thanks to a 5% growth in trade value. Businesses were assumed to be slumped by declining global demand. However, due to being less affected by the pandemic than many other exporting countries, Vietnam benefits from a healthy production chain. Domestic container throughput even surged by 20.6% compared to the previous period. Notably, seaport organizations of the world in general and Vietnam, in particular, are constantly updating technology to optimize port operations and connectivity. Technology is not only revolutionizing ports to speed up and simplify the flow of trade but also cutting carbon footprints [45]. Consequently, it can be a pivotal factor in the competitiveness of seaport organizations.
5. Conclusions and Future Studies
The main purpose of the current study is to provide a viable and complete framework for the efficiency assessment process of seaport terminal operators, aiming to focus on two outlooks that reflect two pictures in the performance evaluation of port companies. Methodologically, the hybrid approach took the abovementioned advantages of the DEA Malmquist and the epsilon-based measure (EBM) methods compared to classical models. The proposed method was applied to a sample of 14 seaport companies in Vietnam during 2015–2020, with the data obtained from the Vietnamese stock market covering financial indicators: total assets, owner’s equity, liabilities, operation expense (input variables); and revenue and net profit (output variables). The paper used the DEA Malmquist model to uncover the pattern of efficiency change over time by deriving the Malmquist indexes, i.e., providing the picture with respect to the productivity growth rates of the operators once every two periods during the 2015–2020 period. To pin down the cause of efficiency change, MPIs were decomposed into two components that reflect an individual company’s change driven by its own efforts and the entire group’s change driven by certain common trends. On the other picture, the EBM model calculates the efficiency and inefficiency scores for each company each and every year during a five-year period. As a result, this integrated approach offers a more effective and equitable evaluation framework for assessing the performance and development of the companies from all perspectives.
The research presented contributes knowledge and practical applications in the context of performance measurement in the maritime industry. The findings are significant for enabling seaport operators to have a better understanding and determining of critical indicators in port operations and development. Consequently, the operators may enhance their performance concerning technical and technological aspects. Owing to the increasing competition in maritime logistics, technology has become dominant [45]. With digital technology and artificial intelligence taking care of physical tasks, such as moving containers, seaport operators are concentrating on more complex roles. Most importantly, the seaports are in an indispensable position in the fight against the unprecedented Covid-19 crisis, i.e., facilitating the transport of goods and vital products [46]. Thus, the managerial implications of this research can help practitioners devise long-term strategies in order, in particular, to actively contribute to a wider systemic resilience.
To conclude, the main contributions of this research can be summarized as follows: (1) the paper conducted a new comparative evaluation in the seaport terminal operators by combining DEA Malmquist and EBM model. This approach can measure the relative total productivity of DMUs in multiple periods, multiple input and output variables through technical and technological assessment, and also can calculate the terms of efficiency/inefficiency of DMUs in considering both proportional changes of inputs/outputs, i.e., represents the diversity or scattering of the observed dataset, and the appearance of slacks, i.e., represents the potential improvement in the input variables for the inefficiency units compared to the benchmark target; (2) the results of a case study in Vietnam provide comprehensive and practical insights into the top 14 seaport companies in recent years; (3) the authors expect that the model’s results will reflect the current picture of seaport industry through the performance of some successful seaport companies. Hence, this paper can offer a useful guideline for decision-makers, investors, and customers, not only in Vietnam, but also in any organization around the world, in improving their operational efficiency toward sustainability development.
To extend quantitative and qualitative criteria, future studies should consider more input and outputs variables with respect to today’s aspect (i.e., post Covid-19 pandemic) such as the number of containers, container shortages, and labor force, to name a few, in order to provide more accurate and robust results. Moreover, future studies should solve this problem under uncertain conditions, i.e., targeting other fuzzy multiple criteria decision-making (MCDM) techniques (i.e., AHP, TOPSIS, VIKOR, PROMETHEE II) for ranking business units [47] and compare the results using ranking similarity reference coefficients [48] to obtain more effective solutions.
Author Contributions
Conceptualization, C.-N.W., H.-P.F. and T.-T.D.; Data curation, T.-T.D.; Formal analysis, N.-A.-T.N.; Funding acquisition, C.-N.W.; Investigation, H.-P.H. and N.-A.-T.N.; Methodology, C.-N.W. and T.-T.D.; Project administration, H.-P.F. and H.-P.H.; Software, T.-T.D.; Validation, C.-N.W. and H.-P.H.; Writing—original draft, T.-T.D. and N.-A.-T.N.; Writing—review and editing, C.-N.W., H.-P.F. and N.-A.-T.N. All authors have read and agreed to the published version of the manuscript.
Funding
This research was partly supported by the project number of 110G02 from National Kaohsiung University of Science and Technology, and project number MOST 109-2622-E-992-026 from the Ministry of Sciences and Technology in Taiwan.
Acknowledgments
The authors appreciate the support from the National Kaohsiung University of Science and Technology, Ministry of Sciences and Technology in Taiwan.
Conflicts of Interest
The authors declare no conflict of interest.
Appendix A
Table A1.
Correlation coefficient on input and output data (2015–2020).
Table A1.
Correlation coefficient on input and output data (2015–2020).
| Correlation Coefficient | TOA | OWE | LIA | OPE | REV | NEP | |
|---|---|---|---|---|---|---|---|
| Total assets (TOA) | Pearson correlation | 1 | 0.927 ** | 0.841 ** | 0.775 ** | 0.673 ** | 0.822 ** |
| Sig. (2-tailed) | 0.000 | 0.000 | 0.000 | 0.000 | 0.000 | ||
| Sample | 84 | 84 | 84 | 84 | 84 | 84 | |
| Owner’s equity (OWE) | Pearson correlation | 0.927 ** | 1 | 0.576 ** | 0.822 ** | 0.527 ** | 0.921 ** |
| Sig. (2-tailed) | 0.000 | 0.000 | 0.000 | 0.000 | 0.000 | ||
| Sample | 84 | 84 | 84 | 84 | 84 | 84 | |
| Liabilities (LIA) | Pearson correlation | 0.841 ** | 0.576 ** | 1 | 0.502 ** | 0.704 ** | 0.462 ** |
| Sig. (2-tailed) | 0.000 | 0.000 | 0.000 | 0.000 | 0.000 | ||
| Sample | 84 | 84 | 84 | 84 | 84 | 84 | |
| Operation expense (OPE) | Pearson correlation | 0.775 ** | 0.822 ** | 0.502 ** | 1 | 0.569 ** | 0.722 ** |
| Sig. (2-tailed) | 0.000 | 0.000 | 0.000 | 0.000 | 0.000 | ||
| Sample | 84 | 84 | 84 | 84 | 84 | 84 | |
| Revenue (REV) | Pearson correlation | 0.673 ** | 0.527 ** | 0.704 ** | 0.569 ** | 1 | 0.484 ** |
| Sig. (2-tailed) | 0.000 | 0.000 | 0.000 | 0.000 | 0.000 | ||
| Sample | 84 | 84 | 84 | 84 | 84 | 84 | |
| Net profit (NEP) | Pearson correlation | 0.822 ** | 0.921 ** | 0.462 ** | 0.722 ** | 0.484 ** | 1 |
| Sig. (2-tailed) | 0.000 | 0.000 | 0.000 | 0.000 | 0.000 | ||
| Sample | 84 | 84 | 84 | 84 | 84 | 84 | |
Note: ** represents correlation is significant at the 0.01 level (2-tailed).
Table A2.
Diversity matrix in EBM model (2015–2020).
Table A2.
Diversity matrix in EBM model (2015–2020).
| Period | Inputs | Total Assets | Owner’s Equity | Liabilities | Operation Expense |
|---|---|---|---|---|---|
| 2015 | Total assets | 0 | 0.2003 | 0.2285 | 0.2052 |
| Owner’s equity | 0.2003 | 0 | 0.2198 | 0.1677 | |
| Liabilities | 0.2285 | 0.2198 | 0 | 0.2493 | |
| Operation expense | 0.2052 | 0.1677 | 0.2493 | 0 | |
| 2016 | Total assets | 0 | 0.1932 | 0.2232 | 0.1370 |
| Owner’s equity | 0.1932 | 0 | 0.2162 | 0.1161 | |
| Liabilities | 0.2232 | 0.2162 | 0 | 0.2628 | |
| Operation expense | 0.1370 | 0.1161 | 0.2628 | 0 | |
| 2017 | Total assets | 0 | 0.2783 | 0.2995 | 0.2149 |
| Owner’s equity | 0.2783 | 0 | 0.2914 | 0.1478 | |
| Liabilities | 0.2995 | 0.2914 | 0 | 0.2309 | |
| Operation expense | 0.2149 | 0.1478 | 0.2309 | 0 | |
| 2018 | Total assets | 0 | 0.2123 | 0.2675 | 0.1528 |
| Owner’s equity | 0.2123 | 0 | 0.2429 | 0.1425 | |
| Liabilities | 0.2675 | 0.2429 | 0 | 0.1845 | |
| Operation expense | 0.1528 | 0.1425 | 0.1845 | 0 | |
| 2019 | Total assets | 0 | 0.2253 | 0.2633 | 0.1477 |
| Owner’s equity | 0.2253 | 0 | 0.2402 | 0.1396 | |
| Liabilities | 0.2633 | 0.2402 | 0 | 0.1775 | |
| Operation expense | 0.1477 | 0.1396 | 0.1775 | 0 | |
| 2020 | Total assets | 0 | 0.2518 | 0.2808 | 0.1234 |
| Owner’s equity | 0.2518 | 0 | 0.2684 | 0.1313 | |
| Liabilities | 0.2808 | 0.2684 | 0 | 0.1553 | |
| Operation expense | 0.1234 | 0.1313 | 0.1553 | 0 |
Note: calculated by the authors.
Table A3.
Affinity matrix in EBM model (2015–2020).
Table A3.
Affinity matrix in EBM model (2015–2020).
| Period | Inputs | Total Assets | Owner’s Equity | Liabilities | Operation Expense |
|---|---|---|---|---|---|
| 2015 | Total assets | 1 | 0.5995 | 0.5431 | 0.5897 |
| Owner’s equity | 0.5995 | 1 | 0.5604 | 0.6646 | |
| Liabilities | 0.5431 | 0.5604 | 1 | 0.5015 | |
| Operation expense | 0.5897 | 0.6646 | 0.5015 | 1 | |
| 2016 | Total assets | 1 | 0.6136 | 0.5537 | 0.7259 |
| Owner’s equity | 0.6136 | 1 | 0.5677 | 0.7678 | |
| Liabilities | 0.5537 | 0.5677 | 1 | 0.4745 | |
| Operation expense | 0.7259 | 0.7678 | 0.4745 | 1 | |
| 2017 | Total assets | 1 | 0.4433 | 0.4011 | 0.5702 |
| Owner’s equity | 0.4433 | 1 | 0.4172 | 0.7045 | |
| Liabilities | 0.4011 | 0.4172 | 1 | 0.5381 | |
| Operation expense | 0.5702 | 0.7045 | 0.5381 | 1 | |
| 2018 | Total assets | 1 | 0.5754 | 0.4651 | 0.6944 |
| Owner’s equity | 0.5754 | 1 | 0.5142 | 0.7150 | |
| Liabilities | 0.4651 | 0.5142 | 1 | 0.6311 | |
| Operation expense | 0.6944 | 0.7150 | 0.6311 | 1 | |
| 2019 | Total assets | 1 | 0.5493 | 0.4734 | 0.7047 |
| Owner’s equity | 0.5493 | 1 | 0.5196 | 0.7209 | |
| Liabilities | 0.4734 | 0.5196 | 1 | 0.6450 | |
| Operation expense | 0.7047 | 0.7209 | 0.6450 | 1 | |
| 2020 | Total assets | 1 | 0.4965 | 0.4384 | 0.7532 |
| Owner’s equity | 0.4965 | 1 | 0.4633 | 0.7373 | |
| Liabilities | 0.4384 | 0.4633 | 1 | 0.6894 | |
| Operation expense | 0.7532 | 0.7373 | 0.6894 | 1 |
Note: calculated by the authors.
References
- UNCTAD. Review of Maritime Transport 2018. Available online: https://unctad.org/webflyer/review-maritime-transport-2018 (accessed on 20 February 2021).
- Rodrigue, J.-P.; Debrie, J.; Fremont, A.; Gouvernal, E. Functions and actors of inland ports: European and North American dynamics. J. Transp. Geogr. 2010, 18, 519–529. [Google Scholar] [CrossRef]
- Wang, C.-N.; Nhieu, N.-L.; Chung, Y.-C.; Pham, H.-T. Multi-objective optimization models for sustainable perishable intermodal multi-product networks with delivery time window. Mathematics 2021, 9, 379. [Google Scholar] [CrossRef]
- Wang, C.-N.; Dang, T.-T.; Le, T.Q.; Kewcharoenwong, P. Transportation optimization models for intermodal networks with fuzzy node capacity, detour factor, and vehicle utilization constraints. Mathematics 2020, 8, 2109. [Google Scholar] [CrossRef]
- Karam, A.; Eltawil, A.; Hegner, B.; Reinau, K. Energy-efficient and integrated allocation of berths, quay cranes, and internal trucks in container terminals. Sustainability 2020, 12, 3202. [Google Scholar] [CrossRef]
- Sayareh, J.; Iranshahi, S.; Golfakhrabadi, N. Service quality evaluation and ranking of container terminal operators. Asian, J. Shipp. Logist. 2016, 32, 203–212. [Google Scholar] [CrossRef]
- Hemalatha, S.; Dumpala, L.; Balakrishna, B. Service quality evaluation and ranking of container terminal operators through hybrid multi-criteria decision making methods. Asian J. Shipp. Logist. 2018, 34, 137–144. [Google Scholar] [CrossRef]
- Pham, T.Y.; Yeo, G.T. Evaluation of transshipment container terminals’ service quality in Vietnam: From the shipping com-panies’ perspective. Sustainability 2019, 11, 1503. [Google Scholar] [CrossRef]
- Da Cruz, M.R.P.; Ferreira, J.J.; Azevedo, S.G. Key factors of seaport competitiveness based on the stakeholder perspective: An Analytic Hierarchy Process (AHP) model. Marit. Econ. Logist. 2013, 15, 416–443. [Google Scholar] [CrossRef]
- Heejung, Y.E.O. Participation of private investors in container terminal operation: Influence of global terminal operators. Asian J. Shipp. Logist. 2015, 31, 363–383. [Google Scholar]
- Yeo, G.T.; Thai, V.V.; Roh, S.Y. An analysis of port service quality and customer satisfaction: The case of Korean container ports. Asian J. Shipp. Logist. 2015, 31, 437–447. [Google Scholar] [CrossRef]
- da Cruz, M.R.P.; de Matos Ferreira, J.J. Evaluating Iberian seaport competitiveness using an alternative DEA approach. Eur. Transp. Res. Rev. 2016, 8, 1–9. [Google Scholar] [CrossRef]
- Min, H.; Ahn, S.-B.; Lee, H.-S.; Park, H. An integrated terminal operating system for enhancing the efficiency of seaport terminal operators. Marit. Econ. Logist. 2017, 19, 428–450. [Google Scholar] [CrossRef]
- Statista. Maritime Industry in Vietnam. Available online: https://www.statista.com/topics/5936/maritime-industry-in-vietnam/ (accessed on 20 February 2021).
- Statista. Leading Sea Ports in Vietnam in 2018. Available online: https://www.statista.com/statistics/1045072/vietnam-leading-sea-ports-by-throughput/#:~:text=Vietnam%20has%20320%20ports%20of,in%20Ho%20Chi%20Minh%20City (accessed on 20 February 2021).
- Tan Cang Logistics; Stevedoring JSC. TCL—Sustainable Development. Available online: http://tancanglogistics.com/en/introduction/Pages/tcl-sustainable-development-140420170403.aspx (accessed on 20 February 2021).
- Tone, K.; Tsutsui, M. An epsilon-based measure of efficiency in DEA—A third pole of technical efficiency. Eur. J. Oper. Res. 2010, 207, 1554–1563. [Google Scholar] [CrossRef]
- Munim, Z.H.; Schramm, H.-J. The impacts of port infrastructure and logistics performance on economic growth: The mediating role of seaborne trade. J. Shipp. Trade 2018, 3, 1. [Google Scholar] [CrossRef]
- Dong, G.; Zhu, J.; Li, J.; Wang, H.; Gajpal, Y. Evaluating the environmental performance and operational efficiency of container ports: An application to the maritime silk road. Int. J. Environ. Res. Public Health 2019, 16, 2226. [Google Scholar] [CrossRef]
- Sałabun, W.; Wątróbski, J.; Shekhovtsov, A. Are MCDA methods benchmarkable? A comparative study of TOPSIS, VIKOR, COPRAS, and PROMETHEE II methods. Symmetry 2020, 12, 1549. [Google Scholar] [CrossRef]
- Shekhovtsov, A.; Sałabun, W. A comparative case study of the VIKOR and TOPSIS rankings similarity. Procedia Comput. Sci. 2020, 176, 3730–3740. [Google Scholar] [CrossRef]
- Kizielewicz, B.; Wątróbski, J.; Sałabun, W. Identification of relevant criteria set in the MCDA process—Wind farm location case study. Energies 2020, 13, 6548. [Google Scholar] [CrossRef]
- Shekhovtsov, A.; Kozlov, V.; Nosov, V.; Sałabun, W. Efficiency of methods for determining the relevance of criteria in sus-tainable transport problems: A comparative case study. Sustainability 2020, 12, 7915. [Google Scholar] [CrossRef]
- Charnes, A.; Cooper, W.W.; Rhodes, E. Measuring the efficiency of decision making units. Eur. J. Oper. Res. 1978, 2, 429–444. [Google Scholar] [CrossRef]
- Barros, C.P. A Benchmark analysis of Italian seaports using data envelopment analysis. Marit. Econ. Logist. 2006, 8, 347–365. [Google Scholar] [CrossRef]
- Ding, Z.-Y.; Jo, G.-S.; Wang, Y.; Yeo, G.-T. The relative efficiency of container terminals in small and medium-sized ports in China. Asian J. Shipp. Logist. 2015, 31, 231–251. [Google Scholar] [CrossRef]
- Périco, A.E.; Ribeiro da Silva, G. Port performance in Brazil: A case study using data envelopment analysis. Case Stud. Transp. Policy 2020, 8, 31–38. [Google Scholar] [CrossRef]
- Quintano, C.; Mazzocchi, P.; Rocca, A. Examining eco-efficiency in the port sector via non-radial data envelopment analysis and the response based procedure for detecting unit segments. J. Clean. Prod. 2020, 259, 120979. [Google Scholar] [CrossRef]
- Zhou, G.; Min, H.; Xu, C.; Cao, Z. Evaluating the comparative efficiency of Chinese third-party logistics providers using data envelopment analysis. Int. J. Phys. Distrib. Logist. Manag. 2008, 38, 262–279. [Google Scholar] [CrossRef]
- Falsini, D.; Fondi, F.; Schiraldi, M.M. A logistics provider evaluation and selection methodology based on AHP, DEA and linear programming integration. Int. J. Prod. Res. 2012, 50, 4822–4829. [Google Scholar] [CrossRef]
- Park, H.G.; Lee, Y.J. The efficiency and productivity analysis of large logistics providers services in Korea. Asian J. Shipp. Logist. 2015, 31, 469–476. [Google Scholar] [CrossRef]
- Hamdan, A.; Rogers, K. Evaluating the efficiency of 3PL logistics operations. Int. J. Prod. Econ. 2008, 113, 235–244. [Google Scholar] [CrossRef]
- Wang, G.; Li, K.X.; Xiao, Y. Measuring marine environmental efficiency of a cruise shipping company considering corporate social responsibility. Mar. Policy 2019, 99, 140–147. [Google Scholar] [CrossRef]
- Bjurek, H. The Malmquist Total Factor Productivity Index. Scand. J. Econ. 1996, 98, 303. [Google Scholar] [CrossRef]
- Wang, C.-N.; Dang, T.-T.; Tibo, H.; Duong, D.-H. Assessing renewable energy production capabilities using DEA window and fuzzy TOPSIS model. Symmetry 2021, 13, 334. [Google Scholar] [CrossRef]
- Wang, C.-N.; Dang, T.-T.; Nguyen, N.-A.-T.; Le, T.-T.-H. Supporting better decision-making: A combined grey model and data envelopment analysis for efficiency evaluation in e-commerce marketplaces. Sustainability 2020, 12, 10385. [Google Scholar] [CrossRef]
- Tone, K. A slacks-based measure of efficiency in data envelopment analysis. Eur. J. Oper. Res. 2001, 130, 498–509. [Google Scholar] [CrossRef]
- Wang, C.-N.; Nguyen, T.-L.; Dang, T.-T. Analyzing operational efficiency in real estate companies: An application of GM (1,1) and DEA malmquist model. Mathematics 2021, 9, 202. [Google Scholar] [CrossRef]
- Tavana, M.; Mirzagoltabar, H.; Mirhedayatian, S.M.; Saen, R.F.; Azadi, M. A new network epsilon-based DEA model for supply chain performance evaluation. Comput. Ind. Eng. 2013, 66, 501–513. [Google Scholar] [CrossRef]
- Cui, Q.; Arjomandi, A. Airline energy efficiency measures based on an epsilon-based Range-Adjusted Measure model. Energy 2021, 217, 119354. [Google Scholar] [CrossRef]
- IET Stock. Vietstock Market. Available online: https://finance.vietstock.vn/VNM/tai-chinh.htm (accessed on 20 February 2021).
- Barykin, S.; Kapustina, I.; Kirillova, T.; Yadykin, V.; Konnikov, Y. Economics of digital ecosystems. J. Open Innov. Technol. Mark. Complex. 2020, 6, 124. [Google Scholar] [CrossRef]
- Barykin, S.Y.; Kapustina, I.V.; Sergeev, S.M.; Yadykin, V.K. Algorithmic foundations of economic and mathematical modeling of network logistics processes. J. Open Innov. Technol. Mark. Complex. 2020, 6, 189. [Google Scholar] [CrossRef]
- Logistics Vietnam in 2021. Available online: https://www.bsc.com.vn/tin-tuc/tin-chi-tiet/747986-ssi-research-trien-vong-nganh-cang-bien-va-logistics-nam-2021-ky-vong-phuc-hoi-toan-cau (accessed on 22 March 2021).
- Raconteur. How Technology Is Creating the Digital Ports of the Future. Available online: https://www.raconteur.net/technology/technology-digital-port/ (accessed on 22 March 2021).
- WorkBoat. Maritime Industry Plays Key Role in Covid-19 Response. Available online: https://www.workboat.com/coastal-inland-waterways/maritime-industry-plays-key-role-in-covid-19-response (accessed on 20 February 2021).
- Wang, C.-N.; Dang, T.-T.; Nguyen, N.-A.-T. Outsourcing reverse logistics for e-commerce retailers: A two-stage fuzzy optimization approach. Axioms 2021, 10, 34. [Google Scholar] [CrossRef]
- Sałabun, W.; Urbaniak, K. A new coefficient of rankings similarity in decision-making problems. In Computational Science—ICCS 2020, Proceedings of the 20th International Conference, Amsterdam, The Netherlands, 3–5 June 2020; Krzhizhanovskaya, V.V., Závodszky, G., Lees, M.H., Dongarra, J.J., Sloot, P.M.A., Brissos, S., Teixeira, J., Eds.; Springer International Publishing: Cham, Switzerland, 2020; Volume 12138. [Google Scholar] [CrossRef]


Publisher’s Note: MDPI stays neutral with regard to jurisdictional claims in published maps and institutional affiliations. |
© 2021 by the authors. Licensee MDPI, Basel, Switzerland. This article is an open access article distributed under the terms and conditions of the Creative Commons Attribution (CC BY) license (https://creativecommons.org/licenses/by/4.0/).