Abstract
Grain breakage occurs in sand specimens subjected to high stress levels; however, the magnitude and characteristics of the resulting deformation remain insufficiently quantified. This study investigates particle-scale fracture behavior in a standardized quartz sand subjected to controlled mechanical loading. Rapid, unconsolidated–undrained (UU) direct shear box tests were performed under normal stresses of 700, 800, and 900 kPa to induce grain breakage. The mechanical loading procedure was applied as a controlled stress induction mechanism to promote particle fragmentation rather than to determine conventional geotechnical parameters. A uniformly prepared quartz sand containing no additional mineral phases was used to ensure material consistency. Post-test specimens were examined through systematic visual and image-based analysis. The sample obtained from the 900 kPa test, where breakage was most pronounced, was analyzed in detail to characterize quartz fracture behavior under compressive and shear stress conditions using advanced image processing techniques. A deep learning-based mineral segmentation framework was developed using a ResNet50 architecture with transfer learning. A custom dataset consisting of high-resolution mineral images and corresponding pixel-level segmentation masks was constructed. The proposed model achieved 86.21% overall accuracy, a Dice coefficient of 91.35%, and an Intersection-over-Union (IoU) score of 84.07%. Validation results demonstrated strong generalization capability, with validation accuracy, Dice score, and IoU of 87.47%, 90.07%, and 81.96%, respectively. The high-precision segmentation performance enabled a comprehensive fracture analysis of 3333 quartz mineral images obtained from specimens exposed to systematic stress conditions.
1. Introduction
In geotechnical engineering, particularly in liquefaction research, various laboratory tests are conducted on sand specimens. Existing studies have extensively examined the influence of sand morphology on mechanical behavior, highlighting the role of surface texture, particle shape, roundness, and sphericity in controlling shear response and strength characteristics [1,2]. To evaluate the mechanical response of soils under controlled and reproducible conditions, laboratory experiments are commonly performed on specially prepared and standardized specimens rather than natural soils [3].
The shear strength of sandy soils is governed by multiple factors, including particle shape, grain-size distribution, relative density, mineralogical composition, and water content. In conventional geotechnical laboratories, the shear strength of sand is commonly evaluated either by direct shear box tests (DST) or by determining the friction angle from triaxial compression tests [4].
Direct shear box tests are widely employed in geotechnical practice due to their operational simplicity, reproducibility, and capability to apply relatively high normal stresses. The resulting shear strength parameters, namely cohesion and friction angle, depend on sand type, particle morphology and size, as well as the presence of water or of fines [5].
During loading, particle breakage may significantly influence the mechanical deformation behavior of granular soils. The friction angle generally increases with median particle size. Similarly, the peak friction angle tends to increase with increasing particle size [6]. The effective internal friction angle is also affected by particle size, with tests conducted on coarser particles typically yielding higher friction angles and greater shear strength. In contrast, overall soil deformability tends to decrease as particle size increases [7].
One of the earliest laboratory methods for evaluating the shear behavior of soils is the direct shear box test (DST). Regardless of whether loading is applied under drained or undrained conditions, fines content significantly influences the shear response of sandy soils. In addition, the particle morphology of the coarse and fine fractions is an important controlling factor.
When the fines content remains below a critical threshold, soil behavior is primarily governed by the sand grain skeleton. In this regime, fine particles act as passive fillers and contribute minimally to shear strength. However, once the fines’ content exceeds this limiting value, the fines begin to dominate the soil structure, and sand grains behave as floating particles embedded within a fine-grained matrix.
Based on a comprehensive literature review, Mahmudi and Erdoğan [8] identified three principal perspectives regarding the relationship between shear strength and fines content. The first perspective suggests that shear strength decreases monotonically with increasing fines content. The second opposing view proposes that shear strength increases continuously with fines content. A third, more recent interpretation indicates a non-monotonic trend: shear strength decreases with increasing fines content up to a threshold, beyond which it increases as fines content increases further.
Soil particles exhibit a wide range of morphologies depending on various geological and mechanical factors. In the literature, particle shapes are commonly described using three primary descriptors: particle form (or sphericity), roundness (or angularity), and surface texture (or roughness). These parameters facilitate quantitative characterization of particle geometry and enable the interpretation of individual soil grains through computational modeling approaches. Form represents a measure of the overall three-dimensional geometry of a particle. Traditionally, simplified two-dimensional estimates have been employed; however, advances in image analysis techniques now allow the efficient incorporation of more complex shape descriptors into analytical models [9]. Furthermore, machine learning approaches have been utilized to train soil image classifiers capable of automatically evaluating the sharpness of particle edges in three-dimensional sand assemblies [10].
Particle breakage plays a critical role in governing the strength and deformation characteristics of sandy soils. At high stress levels, the breakage process typically begins with damage to surface asperities and progresses through successive stages, ultimately reducing particles to finer fragments or powderlike material [11]. Over the past decade, growing interest in grain breakage mechanics has been driven by the need to develop realistic micro-scale numerical models capable of capturing granular behavior more accurately. Although laboratory-based micromechanical investigations of particle breakage are challenging, they remain feasible and continue to provide valuable insights into granular response [12]. Despite extensive research on particle damage, identifying the strain levels at which breakage becomes mechanically significant remains a complex and unresolved issue [13].
Traditional approaches for investigating mineral fracture have largely relied on manual observations, mechanical testing, and empirical correlations. While these methods have contributed substantially to the understanding of granular behavior, they are inherently limited in scope, resolution, and efficiency. Advances in digital imaging and computer vision have introduced new opportunities for material characterization; however, their full potential has only recently begun to be realized with the rapid development of deep learning and artificial intelligence techniques. The ability to automatically analyze large-scale mineral image datasets, detect fracture patterns, and quantitatively relate microstructural changes to mechanical behavior represents a significant advancement in materials science methodologies [14].
Recent advances in deep learning have fundamentally transformed grain-scale analysis. Convolutional neural networks (CNNs) have demonstrated strong performance across a wide range of material characterization tasks, including structural analysis, deformation detection, mineral distribution mapping, and particle shape and size estimation. The ability of CNNs to automatically extract relevant features directly from raw image data has overcome many of the limitations associated with conventional image-processing techniques [15,16,17,18,19,20].
The implementation of transfer learning techniques has proven particularly effective in materials science applications, where large labeled datasets are often limited. Pre-trained models developed on large-scale general image datasets have been successfully adapted to domain-specific material characterization tasks, frequently outperforming models trained from scratch. This strategy has demonstrated value in mineral identification and classification problems [16,17,18,19].
The application of deep learning to mineral fracture analysis is a relatively recent, rapidly expanding, and promising research area. To date, however, studies have largely focused on specific material types and limited fracture-related tasks, such as crack detection and fracture classification [15,18,19]. The success of ResNet architectures in image classification has led to their increasing adoption in materials science applications [16,18,20]. The underlying concept of transfer learning involves leveraging knowledge acquired from one dataset to improve performance on a related but distinct dataset. This approach is especially advantageous for sand grain analysis, where acquiring large, well-annotated image datasets is often challenging and resource-intensive [15,18].
The application of deep learning to mineral fracture analysis remains limited, with most studies focusing on mineral identification and classification rather than on fracture behavior. This represents a significant gap in the literature. The present study addresses this gap by developing and implementing a deep learning-based framework specifically optimized for mineral fracture characterization under controlled laboratory loading conditions [17,19,20].
Although ResNet50-based approaches combined with classical machine learning methods such as support vector machines (SVM) and random forest classifiers have introduced promising strategies for material classification, these hybrid models often require substantial manual intervention for feature selection and parameter tuning. In previous implementations, each mineral image—totaling 3333 samples—was processed and curated individually. Such workflows, while effective, remain labor-intensive and limit scalability.
In contrast, the sand used in this study consists exclusively of quartz, allowing for a controlled investigation of fracture behavior without mineralogical variability. All specimens were prepared using standardized procedures to ensure consistency in particle size, morphology, and surface quality. The primary focus of this research is to evaluate the influence of experimentally induced particle breakage on sand behavior and to establish a visual and quantitative fracture identification methodology based on deep learning.
The experimental program emphasizes controlled high-stress conditions, particularly 900 kPa normal stress, where particle breakage is expected to be most pronounced. This targeted approach enables the establishment of systematic baseline measurements and the validation of automated fracture detection capabilities. By integrating direct shear box testing with deep learning-based image segmentation and fracture quantification, this study represents a significant step toward bridging traditional material characterization techniques and modern computational analysis frameworks.
2. Materials and Methods
An experimental program was conducted to investigate the evolution of particle breakage in sand under controlled loading conditions. Direct shear box tests were performed on dry silica sand composed exclusively of a single mineral phase (quartz), thereby eliminating mineralogical variability and enabling a focused assessment of fracture behavior.
Given that the primary objective of the study was to generate and analyze mechanically induced particle breakage, unconsolidated rapid direct shear box tests were carried out following standard laboratory procedures. Normal stresses of 700, 800, and 900 kPa were applied to evaluate the influence of increasing stress levels on particle fragmentation.
To quantify breakage-induced changes in particle-size distribution, a sieve set (1.0, 0.5, 0.25, 0.125, and 0.063 mm) with a pan was used. Representative samples were collected both before and after testing, and high-resolution images were obtained for each sieve fraction.
Based on the comparative evaluation of experimental results, the specimen tested under 900 kPa normal stress exhibited the most pronounced particle breakage. Consequently, this specimen was selected for detailed fracture analysis using deep learning–based image segmentation techniques.
Representative sand images obtained before and after the direct shear box tests are presented in Figure 1. An optical microscope was used to examine samples collected from each sieve fraction. Microstructural images were acquired at a magnification of 60× with a resolution of 0.80 µm (Figure 2). The images of fractured particles obtained after testing were systematically compared with the pre-test images to identify breakage-induced morphological changes.
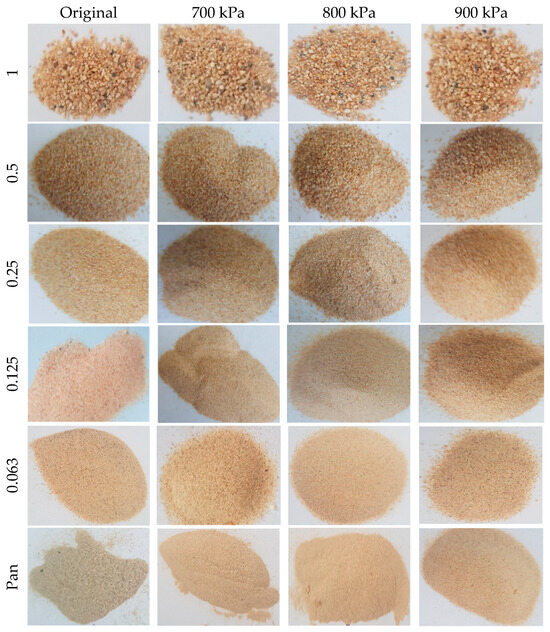
Figure 1.
Images of sand samples after sieve classification under different normal stress levels.
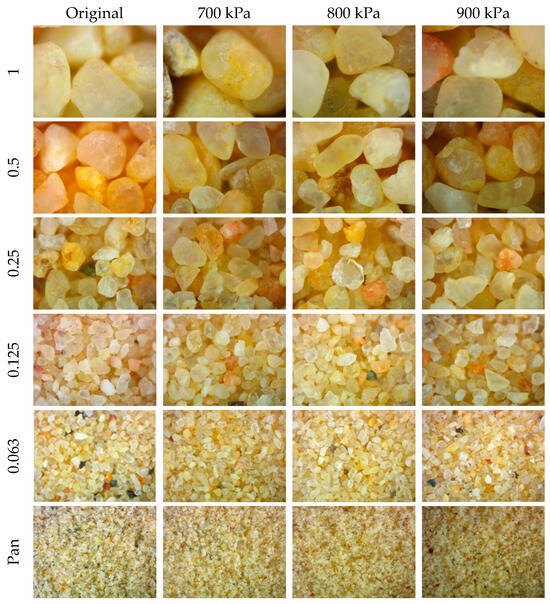
Figure 2.
Representative optical microscope images of sand samples separated by sieve size and exposed to different normal stress conditions. The columns correspond to the original sample and to loading levels of 700, 800, and 900 kPa, whereas the rows represent particle-size fractions.
In this study, optical microscope images were analyzed using deep learning techniques to detect and quantify particle breakage. Image annotation was performed using the Labelme software (5.10.1), a Python-based open-source image annotation tool, locally installed and executed within an Anaconda environment (Python v3.9, Anaconda v4.1.0). Three distinct image datasets were constructed. The first dataset consisted of unsieved and unclassified sand samples collected prior to mechanical testing. The second dataset was obtained from sand specimens sieved through a 0.5 mm mesh (medium-sized fraction) before testing. The third dataset was derived from the residual material obtained after direct shear box testing under 900 kPa normal stress (Figure 3).
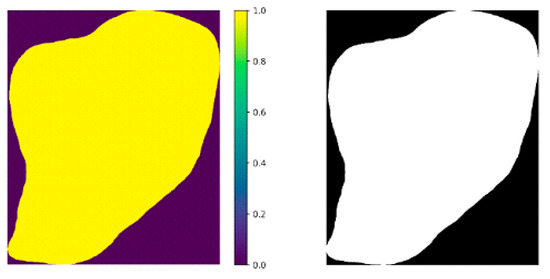
Figure 3.
Example of image masking and segmentation applied to a single mineral grain. The left images show the masked mineral grains superimposed on the original background, while the right images present the corresponding binary masks used for image analysis.
From each dataset, 1111 images were collected, resulting in a total of 3333 images used for deep learning-based analysis. This structured dataset enabled comparative evaluation of particle morphology before and after breakage induced by high stress.
A total of 3333 images were systematically divided into three subsets for the development and evaluation of the deep learning model. The dataset was partitioned using stratified random sampling to ensure balanced representation across the three experimental conditions: original unsieved sand, 0.5 mm-sieved sand prior to testing, and sand subjected to a 900 kPa direct shear box test.
The data were allocated as follows: 70% for training (2333 images), 15% for validation (500 images), and 15% for testing (500 images). This partitioning strategy was adopted to provide sufficient data for model training while maintaining independent validation and test sets for reliable performance assessment and control of overfitting.
To enhance the model’s generalization capability and address the limited size of the dataset, data augmentation techniques were applied exclusively to the training set. The augmentation pipeline included random horizontal flipping (probability = 0.5), random vertical flipping (probability = 0.5), random rotation (±15°), random brightness adjustment (factor range: 0.8–1.2), random contrast adjustment (factor range: 0.8–1.2), and the addition of Gaussian noise (mean = 0, standard deviation = 0.01).
These augmentations were applied online during training, effectively increasing the diversity of the training dataset by approximately threefold. The validation and test sets were left unaltered to ensure unbiased performance evaluation.
The model employed a ResNet50 architecture pre-trained on ImageNet as the encoder backbone. The encoder weights were initialized using ImageNet pre-training. To preserve low-level feature extraction capabilities, the first 100 layers were frozen during the initial training phase.
The decoder was constructed following the U-Net architectural principle and consists of four upsampling blocks with skip connections from the corresponding encoder layers. Each decoder block consisted of a 2 × 2 transposed convolutional layers for upsampling, a concatenation with the corresponding encoder feature maps via skip connections, batch normalization, and two 3 × 3 convolutional layers with ReLU activation. A dropout layer (rate = 0.3) was included for regularization.
The input images were resized to 512 × 512 pixels with three color channels (RGB). The batch size was set to 8 due to GPU memory constraints.
Model optimization was performed using the Adam optimizer implemented in PyTorch (v1.13, Meta Platforms, Menlo Park, CA, USA) with an initial learning rate of 0.0001, β1 = 0.9, β2 = 0.999, and ε = 1 × 10⁻⁷. A ReduceLROnPlateau learning rate scheduler, implemented within the same PyTorch framework, was employed with a patience of 10 epochs, a reduction factor of 0.5, and a minimum learning rate of 1 × 10⁻⁷. The loss function consisted of a composite loss defined as 0.5 × Binary Cross-Entropy (BCE) + 0.5 × Dice Loss. This combination integrates pixel-wise classification accuracy (BCE) with region overlap optimization (Dice), thereby improving segmentation performance.
The maximum number of training epochs was set to 100, with early stopping applied (patience = 20 epochs) based on monitoring the validation Dice coefficient.
Encoder weights were initialized with ImageNet-pretrained parameters, while decoder layers used He-normal initialization. Gradient clipping was applied with a maximum norm of 1.0 to prevent exploding gradients.
Dropout regularization (rate = 0.3) was applied after each decoder block to reduce overfitting.
Batch normalization was implemented after each convolutional layer with a momentum of 0.99 and ε = 0.001 to stabilize and accelerate training.
L2 weight decay (1 × 10⁻⁵) was applied to all trainable parameters to further improve generalization.
Early stopping was employed by monitoring the validation Dice coefficient with a patience of 20 epochs.
The model was trained on a system equipped with an NVIDIA Tesla V100 GPU (32 GB VRAM), 64 GB of system RAM, and a 16-core CPU. The implementation was carried out using the PyTorch framework (v1.13, Meta Platforms, Menlo Park, CA, USA) with CUDA 11.7 and cuDNN 8.5.Training required approximately 6 h to complete 85 epochs, at which point early stopping was triggered. Model checkpointing was performed by saving the model with the highest validation Dice coefficient.
Model performance was evaluated using Pixel Accuracy, Dice Coefficient, and Intersection over Union (IoU).
Pixel Accuracy was calculated as:
The Dice Coefficient was computed as:
Intersection over Union (IoU) was defined as:
Here, TP denotes true positives, TN true negatives, FP false positives, and FN false negatives.
For binary segmentation, a threshold value of 0.5 was applied, which was optimized based on validation set performance.
Training metrics were recorded at each epoch, including loss, accuracy, Dice coefficient, and IoU.
Validation metrics were computed at each epoch and included validation loss, validation accuracy, validation Dice coefficient, and validation IoU.
Final evaluation on the test set was performed once using the model corresponding to the best validation checkpoint.
The foundation of this research lies in the development of a comprehensive dataset specifically designed for mineral fracture analysis. The dataset construction process involved several carefully structured stages to ensure data quality, consistency, and direct relevance to the research objectives.
Quantitative analysis of morphological variation under a normal stress of 900 kPa revealed systematic patterns of shape evolution associated with particle breakage. The automated segmentation framework successfully tracked changes in particle geometry, surface area, and volumetric attributes, enabling detailed characterization of deformation mechanisms across a dataset comprising more than 300 representative samples. The analysis identified consistent shape-evolution trends correlated with material properties and fracture mechanisms, providing quantitative insight into stress-induced morphological transformation in quartz sand.
Representative examples of randomly selected and annotated images used during the masking process are presented in Figure 4. Following segmentation, both pre-test and post-test images were converted to a binary (black-and-white) format to facilitate quantitative analysis.
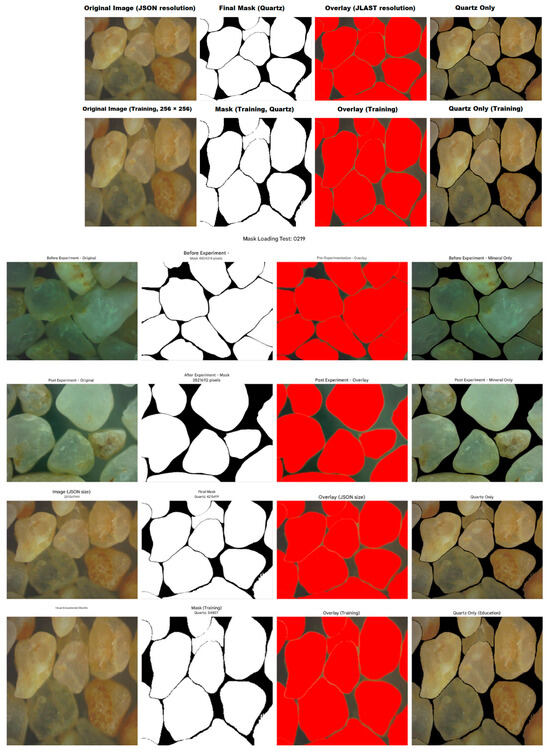
Figure 4.
Image masking and segmentation workflow applied to sand samples at different processing stages. Columns show the original optical images, the corresponding binary masks, the overlay images, and the extracted mineral grains. Rows represent different stages of the dataset preparation, including pre-experiment images, post-experiment images, resized images, and training samples.
The data obtained from the sieve analysis were used to construct the grain size distribution (granulometric) curve. From this curve, the characteristic particle sizes , , and were determined using the graphical interpolation method. Based on these values, the coefficient of uniformity and the coefficient of curvature were calculated using Equations (1) and (2), respectively.
The coefficient of uniformity () was calculated as follows:
where is the particle size at which 60% of the sample is finer on the grain size distribution curve, and is the particle size at which 10% of the sample is finer.
The coefficient of curvature () was calculated using the following equation:
where , , and represent the particle sizes corresponding to 10%, 30%, and 60% finer on the grain size distribution curve, respectively.
The binarized masks enabled consistent extraction of particle boundaries and geometric descriptors for subsequent comparative evaluation.
3. Results
In this study, both experimental measurements and visual data were utilized to reveal deformation and particle breakage occurring in sand specimens before and after testing. A specially prepared natural silica sand composed predominantly of quartz (Mohs hardness = 7) was used to ensure mechanical consistency and minimize mineralogical variability.
During testing, morphological changes were observed in the sand samples. The specimen subjected to 900 kPa normal stress—where particle breakage was most pronounced—was selected for detailed image processing analysis. In addition, material retained on the 0.5 mm sieve, representing the medium-sized fraction, was included in the comparative evaluation.
Prior to testing, the sand grains were predominantly rounded to subangular, as confirmed by macroscopic and microscopic observations. Following testing, the grains exhibited increased angularity, indicating stress-induced fragmentation and damage to surface asperities (Figure 5). Original and microscopic images of the sand were systematically acquired before testing to establish baseline morphological characteristics.
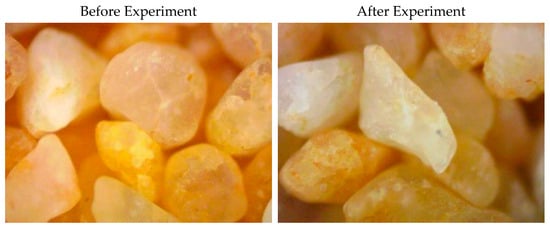
Figure 5.
Optical microscope images of sand grains before and after the direct shear box test, illustrating changes in particle morphology induced by the applied loading conditions.
Representative examples of randomly selected annotated images used during the masking process are presented in Figure 5. After segmentation, pre-test and post-test images were converted to binary format to enable consistent quantitative comparisons of particle geometry.
The tested quartz sand consisted of approximately 50% coarse-grained, 40% medium-grained, and 10% fine-grained fractions. The particle-size distribution analysis indicated that the effective grain diameters D10, D30, D50, and D60 were 0.141, 0.188, 0.250, and 0.372 mm, respectively. The coefficient of uniformity (Cu) was 2.631, and the coefficient of curvature (Cc) was 0.674.
Based on gradation characteristics, the material was classified as a poorly graded sand (SP) according to the Unified Soil Classification System (USCS) under ASTM standards. The maximum and minimum dry densities were determined in accordance with ASTM procedures and were found to be 0.690 g/cm3 and 0.455 g/cm3, respectively. The specific gravity of the sand particles was 2.696. A summary of the physical properties of the tested sand is presented in Table 1.

Table 1.
Physical properties of the tested silica sand sample.
The analysis revealed distinct fracture patterns and size reduction features that varied significantly across different pressure ranges in quartz, providing unique insights into the mechanical behavior of crystalline materials. Our findings demonstrate that brittle minerals like quartz exhibit predictable fracture patterns with sharp-edged fragments.
The methodology successfully established quantitative relationships between applied pressure and resulting fracture properties, including particle size distributions, surface area changes, and fracture pattern evolution. These relationships have contributed to the fundamental understanding of mineral behavior under stress. A fundamental challenge in mineral fracture analysis stems from the complexity and variability of fracture patterns, which are influenced by numerous factors such as crystal structure, grain size, defects, and loading conditions. Traditional analysis methods are often subjective, time-consuming, and limited in their ability to capture the full complexity of fracture behavior. Furthermore, the increasing demand for high-throughput materials characterization in industrial applications necessitates the development of automated analysis techniques that can provide consistent and reproducible results. Specific objectives of this research include developing an automated mineral segmentation system capable of identifying and isolating individual minerals from complex images; generating a comprehensive database linking mineral morphology to fracture behavior under various pressure conditions; quantifying single-mineral size-reduction patterns across pressure ranges; and establishing a robust analytical framework for understanding pressure-induced fracture mechanisms.
In the study, 3333 images were analyzed; the results were compared, and an evaluation was conducted on 300 images (Figure 6). This graph demonstrates a change in mineral size.
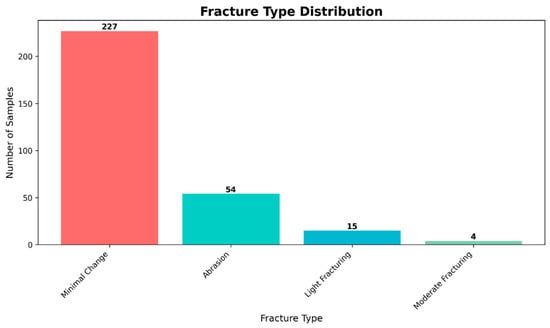
Figure 6.
Distribution of fracture types observed in mineral grains after the direct shear box test.
ResNet50 (50-layer Residual Network), introduced by He et al. [16], is a deep convolutional neural network architecture that revolutionized deep learning by addressing the vanishing gradient problem through residual connections. The architecture consists of 50 weighted layers—including convolutional, batch normalization, and fully connected layers—and is organized into five stages with progressively increasing feature depths: 64, 256, 512, 1024, and 2048 channels.
The fundamental innovation of ResNet lies in the residual block, which implements skip (shortcut) connections, allowing gradients to flow directly through the network. Instead of learning a direct mapping H(x), residual blocks learn a residual function defined as F(x) = H(x) − x, where x represents the input. . The final output is then computed as follows .
This formulation facilitates learning identity mappings when necessary and enables the network to become arbitrarily deep without suffering degradation.
In the research, the graph in Figure 7 was prepared to determine whether the grains became smaller due to abrasion or breakage during the experiment.
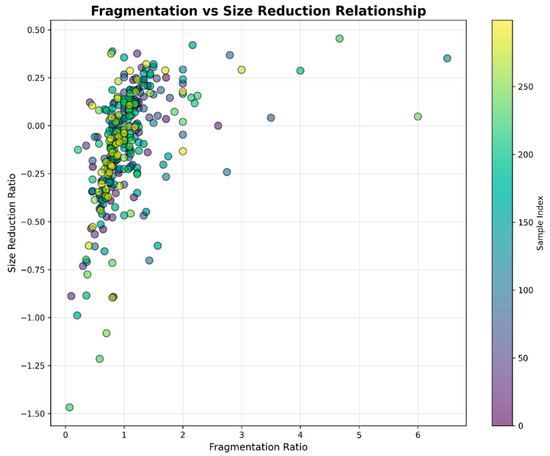
Figure 7.
Scatter plot showing the fragmentation ratio versus size reduction ratio of mineral grains obtained from image analysis.
The ResNet50 architecture is organized into five main stages.
Stage 1 (Initial stage) consists of a 7 × 7 convolutional layer with 64 filters and a stride of 2, followed by a 3 × 3 max pooling layer.
Stage 2 (conv2_x) comprises three residual blocks, each containing three convolutional layers with 64, 64, and 256 filters (1 × 1, 3 × 3, and 1 × 1, respectively).
Stage 3 (conv3_x) comprises four residual blocks, each containing three convolutional layers with 128, 128, and 512 filters, respectively.
Stage 4 (conv4_x) consists of six residual blocks with 256, 256, and 1024 filters.
Stage 5 (conv5_x) contains three residual blocks with 512, 512, and 2048 filters.
Within each residual block, the spatial dimensions are preserved while the number of filters increases across stages. The first block of each stage performs downsampling using stride-2 convolutions.
Transfer learning leverages knowledge acquired from one task (source domain) to improve performance on a related but distinct task (target domain). In this study, we utilized ResNet50 pre-trained on ImageNet, a large-scale dataset containing approximately 1.2 million natural images across 1000 object categories.
Although ImageNet consists of everyday objects rather than mineral particles, the learned low- and mid-level features—such as edges, textures, shapes, and patterns—are highly transferable and particularly relevant for mineral segmentation tasks.
To determine the relationship between crack density and fracture, the graphs in Figure 8 and Figure 9 were prepared to show changes in size distribution.
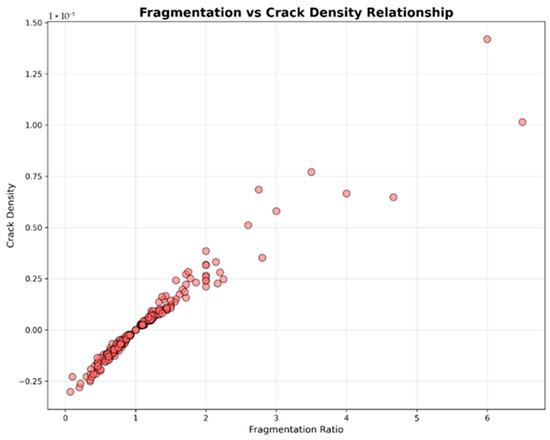
Figure 8.
Scatter plot of crack density versus fragmentation ratio for mineral grains obtained from image analysis.
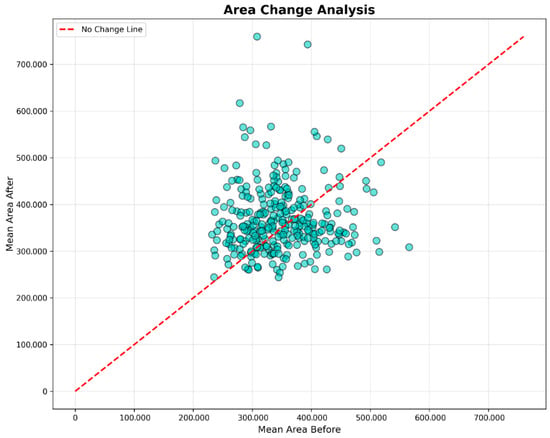
Figure 9.
Scatter plot comparing the mean particle area before and after the experiment, derived from image analysis. The dashed line represents the no-change reference line. Most data points fall below the reference line, indicating a systematic reduction in particle area after the shear test. This trend confirms that increasing shear stress leads to particle breakage and size reduction in quartz grains.
Figure 10 shows the area covered by the grain before and after the experiment. Figure 11 shows the changes in the areas covered by minerals in the masked images before and after the experiment.
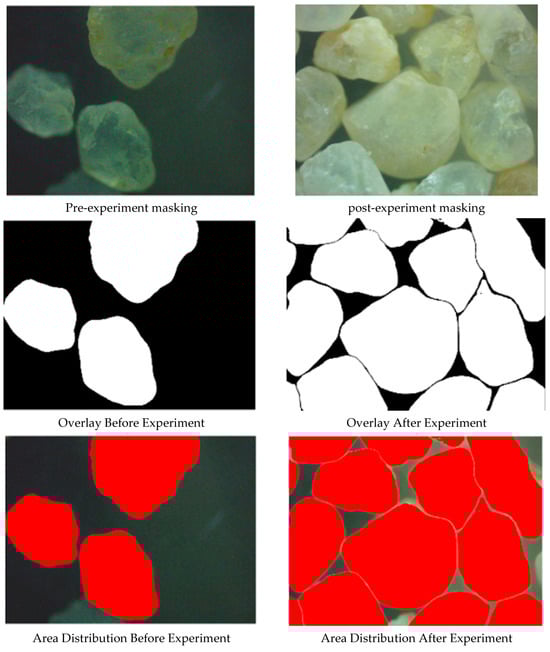
Figure 10.
Comparison of the areas covered by mineral grains in the masked images obtained before and after the experiment.
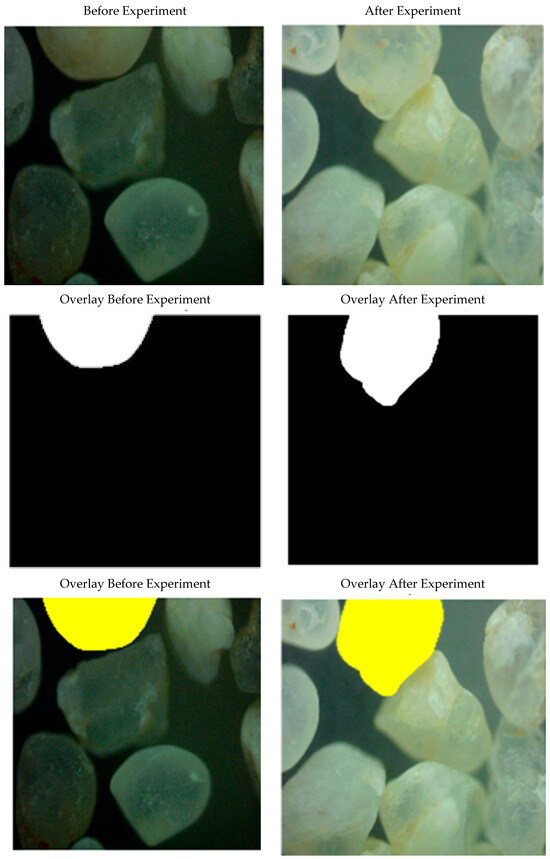
Figure 11.
Overlay comparison of optical images of representative mineral grains before and after the direct shear box test.
The relatively limited size of the dataset represents a critical constraint. Training deep neural networks from scratch typically requires millions of labeled images; therefore, our dataset of 3333 images is likely to lead to severe overfitting without pre-training.
Feature reusability further justifies the use of transfer learning. In convolutional neural networks (CNNs), the early layers learn universal features—such as edges, corners, and textures—that are transferable across domains, whereas deeper layers progressively capture task-specific representations.
From a computational perspective, pre-trained weights provide a strong initialization, significantly reducing training time from weeks to hours. Moreover, transfer learning acts as an implicit regularization mechanism, enhancing the model’s ability to generalize to previously unseen data.
For the segmentation task, ResNet50 was adapted to an encoder–decoder architecture like U-Net. The ResNet50 backbone functioned as the encoder, progressively downsampling the input image while extracting hierarchical feature representations.
A custom decoder network was designed to upsample these features back to the original image resolution, enabling pixel-wise prediction of segmentation masks.
The input to the network consisted of RGB images of mineral samples with dimensions of 512 × 512 × 3.
A layer-freezing strategy was adopted during training. The first 100 layers (corresponding approximately to Stages 1–3) were frozen during the initial training phase to preserve the low-level feature extractors learned from ImageNet pre-training. Layers 101–175 (approximately Stages 4–5) were fine-tuned using a reduced learning rate of 0.00001, which was set to one-tenth of the decoder learning rate.
To enable skip connections within the encoder–decoder framework, feature maps were extracted from multiple stages of the backbone network. Specifically, the extracted feature representations were as follows:
- −
- Stage 2 output: 128 × 128 × 256 feature maps.
- −
- Stage 3 output: 64 × 64 × 512 feature maps.
- −
- Stage 4 output: 32 × 32 × 1024 feature maps.
- −
- Stage 5 output: 16 × 16 × 2048 feature maps.
The decoder comprised four upsampling blocks, each doubling the spatial resolution of the feature maps.
Block 1 (16 × 16→32 × 32):
A 2 × 2 transposed convolutions with stride of 2 and 512 filters were applied, followed by concatenation with the Stage 4 encoder features (1024 channels), resulting in 1536 channels. This was followed by two 3 × 3 convolutional layers, each with 512 filters and accompanied by batch normalization and ReLU activation. Dropout (rate = 0.3) was applied for regularization.
Block 2 (32 × 32→64 × 64):
A 2 × 2 transposed convolution (stride = 2) with 256 filters was used, followed by concatenation with the Stage 3 encoder features (512 channels), yielding 768 channels. Two 3 × 3 convolutional layers with 256 filters, batch normalization, ReLU activation, and dropout (0.3) were subsequently applied.
Block 3 (64 × 64→128 × 128):
A 2 × 2 transposed convolution (stride = 2) with 128 filters was applied, followed by concatenation with the Stage 2 encoder features (256 channels), resulting in 384 channels. Two 3 × 3 convolutional layers with 128 filters, batch normalization, ReLU activation, and dropout (0.3) were used.
Block 4 (128 × 128→256 × 256):
A 2 × 2 transposed convolution (stride = 2) with 64 filters was applied, followed by two 3 × 3 convolutional layers, each with 64 filters and followed by batch normalization, ReLU activation, and dropout (rate = 0.3).
Final Upsampling (256 × 256→512 × 512):
The feature maps were upsampled to the original input resolution using 2× bilinear interpolation. A 1 × 1 convolution was then applied to generate a single-channel output, followed by a sigmoid activation function for binary segmentation.
The skip connections between the encoder and decoder serves multiple purposes.
First, they preserve spatial information. As deeper encoder layers progressively downsample feature maps, fine spatial details are lost; skip connections help restore this information during decoding.
Second, they facilitate gradient flow by providing additional pathways for backpropagation, thereby improving training stability.
Third, they enable multi-scale feature fusion. Low-level features extracted from early encoder stages (e.g., edges and textures) are combined with high-level semantic features from deeper stages.
Concatenation, rather than element-wise summation, was adopted to retain all feature information from both pathways, allowing the decoder to selectively utilize the most relevant representations.
A two-stage training strategy was adopted.
Stage 1—Decoder Pre-training (30 epochs):
During the initial phase, the encoder was fully frozen (all 175 layers), and only the decoder was trained using a learning rate of 0.0001. The objective of this stage was to allow the decoder to learn appropriate feature combinations without disrupting the pre-trained encoder weights.
Stage 2—Fine-tuning (55 epochs):
In the second phase, the higher-level encoder layers (Stages 4–5; layers 101–175) were unfrozen and fine-tuned. The encoder learning rate was set to 1 × 10⁻⁵ (one-tenth of the decoder learning rate, 1 × 10⁻⁴). The aim was to adapt high-level encoder representations to the mineral domain while preserving low-level feature extractors.
CNN architectures exhibit a hierarchical layer structure. In ResNet, the early layers capture universal features such as edges, corners, and basic textures, which are generally transferable across domains. Intermediate layers learn more complex, partially transferable patterns, including shapes and object parts. In contrast, the deeper layers encode task-specific high-level representations that typically require domain adaptation.
Selective fine-tuning leverages this hierarchy. By freezing the early layers and fine-tuning only the deeper layers, the model retains universal feature representations while adapting task-specific features to mineral particle characteristics.
The parameter smooth = 1 is introduced to prevent division by zero. Dice Loss directly optimizes the Dice coefficient (a segmentation quality metric), is less sensitive to class imbalance, and emphasizes region-level accuracy.
The combined loss function was defined as:
This formulation balances pixel-level accuracy (BCE) with region-level consistency (Dice), promoting both precise classification and coherent segmentation masks.
4. Discussion
This study aims to systematically investigate the mechanical and microstructural changes occurring in a sand sample during laboratory testing through both experimental and visual analyses. The extent and nature of these changes are governed by the applied load magnitude and the type of mechanical test conducted.
To ensure controlled mineralogical conditions and isolate particle breakage behavior, mineralogically pure quartz sand (Mohs hardness of 7) was selected as the test material. For detailed visual fracture analysis, the specimen subjected to a 900 kPa direct-shear load was selected, as this loading condition produced the maximum particle breakage among all tested scenarios.
Changes in grain size before and after testing were systematically examined, and the effects of the applied loading conditions were evaluated through visual analyses. Following the experiments, the samples were prepared for grain-size distribution analysis enabling quantitative assessment of particle breakage processes.
A direct shear box apparatus, a 0.5 mm sieve, and an optical microscope were used to determine the deformation characteristics of the samples. Deep learning techniques were employed for image-based analysis of particle deformation and fracture. Particular attention was given to ensuring that the initial samples were free from fine materials such as silt and clay, thereby representing clean sand conditions. All experiments were conducted under dry conditions on laboratory-prepared, poorly graded medium–fine sand samples.
During testing, particle breakage occurred, and the formation of fines was observed in some specimens. The results indicate that brittle minerals such as quartz produce sharp-edged fragments with distinct fracture surfaces, whereas ductile minerals exhibit gradual deformation until critical stress thresholds are exceeded.
The segmentation performance demonstrates a high level of accuracy and robustness across all evaluation metrics. The achieved Pixel Accuracy of 86.21% indicates that the majority of pixels—both mineral and background—were correctly classified across the entire image domain. While pixel accuracy reflects overall prediction correctness, it does not fully capture region-level overlap quality. More importantly, the Dice coefficient reached 91.35%, indicating excellent agreement between predicted and ground-truth mineral regions. Dice values exceeding 0.90 are generally considered outstanding in medical-image and materials-image segmentation tasks, suggesting that the proposed architecture provides highly reliable mineral boundary delineation. Similarly, the Intersection over Union (IoU) score of 84.07% confirms strong segmentation consistency. As IoU is a more conservative metric than Dice, penalizing both false positives and false negatives more strictly, an IoU value greater than 0.80 indicates high-quality segmentation suitable for quantitative mineral analysis. Collectively, these results demonstrate that the proposed encoder–decoder framework effectively captures mineral morphology and boundary characteristics, supporting its applicability to the assessment of fracture and particle breakage.
The validation metrics further confirm the robustness of the proposed framework. The validation accuracy reached 87.47%, slightly exceeding the training accuracy, indicating the absence of overfitting. Similarly, the validation Dice coefficient achieved 90.07%, only 1.28% lower than the training value, demonstrating excellent generalization capability. The validation IoU of 81.96%, representing a marginal decrease of 2.11% relative to training, remains well within the acceptable range for high-quality segmentation. The close agreement between training and validation metrics suggests that transfer learning, combined with appropriate regularization strategies, effectively mitigated overfitting despite the relatively limited dataset size. Achieving an overall accuracy of 86.21% using only 3333 images demonstrates strong data efficiency; training a comparable model from scratch would typically require 10–100 times more labeled samples. From a computational perspective, the model converged in approximately 6 h, whereas random initialization would likely require 2–3 weeks of training to achieve similar performance. This substantial reduction in training time underscores the efficiency benefits of leveraging pre-trained representations. Moreover, the improved generalization performance indicates that pre-trained features act as an implicit regularization mechanism, enabling stable performance on previously unseen mineral samples. ImageNet pretraining appears to have provided robust edge and texture detectors, which are particularly well suited to identifying mineral grain boundaries and fracture surfaces. Overall, the results demonstrate that transfer learning can effectively bridge knowledge from natural image recognition to specialized materials science applications. This approach enables automated, high-throughput analysis of mineral fracture behavior that would otherwise be impractical with conventional manual methods.
Funding
This study was supported by the Scientific Research Projects (BAP) Coordinatorship of Kırşehir Ahi Evran University under project number “MMF.A4.22.015” titled “Determination of the Behavior of Sands Before and After the Oedometer Test”. I would like to thank the Scientific Research Projects (BAP) Coordinatorship for its support.
Data Availability Statement
The data that support the findings of this study are available from the corresponding author upon reasonable request.
Acknowledgments
I thank Berk Küçük for his valuable support with deep learning and ResNet-50 techniques. I deeply appreciate his dedication, his generous allocation of time to me, and his willingness to share his expertise. He provided training on the subject, contributed significantly to this study, and carried out the analyses using the ResNet-50 architecture. I am grateful for his guidance, efforts, and meaningful contributions to my work. I would also like to extend my special thanks to him for his support beyond this study, as his guidance has contributed greatly to my professional and academic development.
Conflicts of Interest
The author declares no conflicts of interest.
Abbreviations
The following abbreviations are used in this manuscript:
| Cu | Coefficient of uniformity |
| Cc | Coefficient of curvature |
| SP | Poorly Graded Sand |
| Gs | Specific gravity |
References
- Alshibli, K.A.; Cil, M.B. Influence of Particle Morphology on the Friction and Dilatancy of Sand. J. Geotech. Geoenviron. Eng. 2018, 144, 04017118. [Google Scholar] [CrossRef]
- Korkmaz, Y. Experimental Investigation on Internal Friction and Dilatation Angles of Uniform Silica Sands Based on Relative Density. Master’s Thesis, Zonguldak Bülent Ecevit University, Zonguldak, Turkey, 2019. [Google Scholar]
- Yin, K.; Liu, J.; Vasilescu, A.R.; Di Filippo, E.; Othmani, K. A procedure to prepare sand–clay mixture samples for soil–structure interface direct shear tests. Appl. Sci. 2021, 11, 5337. [Google Scholar] [CrossRef]
- Motahari-Tabari, S.A.; Shooshpasha, I. Evaluation of coarse-grained mechanical properties using small direct shear test. Int. J. Geotech. Eng. 2021, 15, 667–679. [Google Scholar] [CrossRef]
- Boudia, A.; Berga, A. Effect of Grain Size and Distribution on Mechanical Behavior of Dune Sand. Civ. Eng. J. 2021, 7, 1355–1377. [Google Scholar] [CrossRef]
- Wang, W.; Li, W. Particle Breakage of Coral Sand in Direct Shear Test. In IOP Conference Series: Materials Science and Engineering; IOP Publishing: Bristol, UK, 2020; Volume 794, p. 012044. [Google Scholar] [CrossRef]
- Zhang, X.; Pejman, T. Effects of Grain Size on Deformation in Porous Media. Transp. Porous Media 2019, 129, 321–341. [Google Scholar] [CrossRef]
- Mahmudi, M.; ve Erdoğan, D. İnce Dane İçeriğinin Siltli Kum Zeminlerin Drenajsız Kayma Dayanımı Davranışı ve Durağan Durum Çizgisi Üzerindeki Etkisi. BEÜ Fen Bilim. Derg. BEU 2021, 10, 507–520. [Google Scholar]
- Cabalar, A.F.; Isik, H. A shape parameter for soil particles using a computational method. Arab. J. Geosci. 2022, 15, 581. [Google Scholar] [CrossRef]
- Zheng, J.; Zhang, Z.; Li, C.; Li, Z.; Gao, L. Laboratory-on-a-smartphone for estimating angularity of granular soils. Acta Geotech. 2022, 17, 2651–2674. [Google Scholar] [CrossRef]
- Suescun-Florez, E.; Iskander, M.; Bless, S. Evolution of particle damage of sand during axial compression via arrested tests. Acta Geotech. 2020, 15, 95–112. [Google Scholar] [CrossRef]
- Sandeep, C.S.; Todisco, M.C.; Nardelli, V.; Senetakis, K.; Coop, M.R.; Lourenco, S.D.N. A micromechanical experimental study of highly/completely decomposed tuff granules. Acta Geotech. 2018, 13, 1355–1367. [Google Scholar] [CrossRef]
- Xiao, Y.; Meng, M.; Daouadjie, A.; Chen, Q.; Wu, Z.; Jiang, X. Effect of particle size on crushing and deformation behaviors of rockfill materials. Geosci Front. 2019, 11, 375–388. [Google Scholar] [CrossRef]
- Li, L.; Iskander, M. Use of machine learning for classification of sand particles. Acta Geotech. 2022, 17, 4739–4759. [Google Scholar] [CrossRef]
- LeCun, Y.; Bengio, Y.; Hinton, G. Deep learning. Nature 2015, 521, 436–444. [Google Scholar] [CrossRef] [PubMed]
- He, K.; Zhang, X.; Ren, S.; Sun, J. Deep residual learning for image recognition. In Proceedings of the IEEE Conference on Computer Vision and Pattern Recognition (CVPR), Las Vegas, NV, USA, 27–30 June 2016; pp. 770–778. [Google Scholar] [CrossRef]
- Long, J.; Shelhamer, E.; Darrell, T. Fully convolutional networks for semantic segmentation. In Proceedings of the IEEE Conference on Computer Vision and Pattern Recognition (CVPR), Boston, MA, USA, 7–12 June 2015; pp. 3431–3440. [Google Scholar] [CrossRef]
- Yosinski, J.; Clune, J.; Bengio, Y.; Lipson, H. How transferable are features in deep neural networks? Adv. Neural Inf. Process. Syst. 2014, 27, 3320–3328. [Google Scholar]
- Cecen, A.; Dai, H.; Yabansu, Y.C.; Kalidindi, S.R.; Song, L. Material structure–property linkages using three-dimensional convolutional neural networks. Acta Mater. 2018, 146, 76–84. [Google Scholar] [CrossRef]
- Yang, Z.; Yu, C.H.; Buehler, M.J. Deep learning model to predict complex stress and strain fields in hierarchical composites. Sci. Adv. 2021, 7, eabd7416. [Google Scholar] [CrossRef] [PubMed]


Disclaimer/Publisher’s Note: The statements, opinions and data contained in all publications are solely those of the individual author(s) and contributor(s) and not of MDPI and/or the editor(s). MDPI and/or the editor(s) disclaim responsibility for any injury to people or property resulting from any ideas, methods, instructions or products referred to in the content. |
© 2026 by the author. Licensee MDPI, Basel, Switzerland. This article is an open access article distributed under the terms and conditions of the Creative Commons Attribution (CC BY) license.