Article

Differential Organic Matter Enrichment in Middle Ordovician Shales of the Wulalike Formation, Western Margin of the Ordos Basin

1
College of Geosciences, Yangtze University, Wuhan 430100, China
2
National Key Laboratory of Petroleum Resources and Engineering, College of Geosciences, China University of Petroleum (Beijing), Beijing 102249, China
3
Key Laboratory of Petroleum Geochemistry, Research Institute of Petroleum Exploration and Development, China National Petroleum Corporation, Beijing 100083, China
*
Author to whom correspondence should be addressed.
Minerals 2026, 16(3), 234; https://doi.org/10.3390/min16030234
Submission received: 13 January 2026 / Revised: 19 February 2026 / Accepted: 23 February 2026 / Published: 25 February 2026

Abstract

Marine shales of the Middle Ordovician Wulalike Formation in the Ordos Basin constitute a key target for shale gas exploration. However, the sedimentary environments associated with different shale lithofacies vary significantly, and the mechanisms controlling the organic matter enrichment remain incompletely understood. To address this issue, this study conducts a comprehensive analysis of the factors influencing organic matter enrichment in distinct lithofacies. Based on mineralogical and elemental geochemical data, Wulalike Formation shales can be grouped into three lithofacies associations (i.e., siliceous shales, calcareous shales, and mixed shales). Results indicate that the siliceous shale, with the highest TOC (avg. 1.05%), was deposited under a warm and humid climate with relatively high productivity and anoxic to euxinic bottom waters, promoting preservation. In contrast, the calcareous and mixed shales, formed under semihumid to semiarid climates with lower productivity and variable terrigenous input, exhibit lower TOC. Comprehensive analysis shows that, against the background of generally low organic matter abundance, organic matter enrichment were primarily associated with redox conditions and paleoclimate, with terrigenous input playing a dual role, while paleoproductivity had a limited effect. The overall lower TOC, compared to typical marine shales, may be attributed to deposition in a nutrient-limited, restricted, stagnant basin distal from volcanic sources. This study provides new insights into the organic matter enrichment mechanisms of Ordovician source rocks in the western Ordos Basin.

1. Introduction

In the context of the global hydrocarbon resource strategy shifting from conventional to unconventional resources, significant breakthroughs have been achieved in the development of marine shale gas [1]. Commercial development has been successfully achieved in several marine shale sequences worldwide, notably in the Upper Ordovician–Lower Silurian Wufeng–Longmaxi Formation shales in the Sichuan Basin and the Middle–Upper Ordovician Saergan Formation in the Tarim Basin [2,3,4]. More recently, the Lower Paleozoic Wulalike Formation (O2w), a marine source rock exclusively developed in the northwestern margin of the Ordos Basin, has yielded high-productivity commercial gas flows from multiple wells including ZP1, ZP4 [4,5]. These exploration successes confirm the favorable geological conditions for marine shale gas accumulation in northern China [5].
The enrichment of organic matter in shales is governed by variety of depositional environmental factors (e.g., terrigenous input, volcanic activity, paleoclimate, redox conditions, and paleoproductivity) [6,7,8]. Variations in paleoenvironmental conditions influence the mineral composition and shale lithofacies development, resulting in distinct mechanisms of organic matter enrichment [9,10,11,12]. Recent studies, based on whole-rock and trace-element geochemistry, have proposed two primary enrichment models: a preservation-dominant type and a productivity-dominant type [13]. While these binary models provide a useful framework, they risk oversimplifying the complex interplay of multiple geological processes that characterize organic matter enrichment [14,15,16]. In particular, such dichotomous categorization may obscure how different lithofacies within the same formation respond to paleoenvironmental variation, potentially masking the co-evolution of productivity and preservation conditions. Consequently, a multidimensional analytical approach is necessary to reconstruct depositional environments and to clarify enrichment mechanisms. Several studies have examined sedimentary facies, geochemical signatures, and reservoir properties of the Wulalike Formation [5,17,18], while some researchers have conducted preliminary investigations into the sedimentary environment and organic matter enrichment mechanisms [19,20]. However, these works lack systematic analysis of how organic matter enrichment characteristics differ across distinct lithofacies and how these differences correspond to paleoenvironmental variations. This gap limits our understanding of the formation’s heterogeneous shale gas potential. Therefore, further investigation into the mechanisms of organic matter enrichment in this shale unit is warranted.
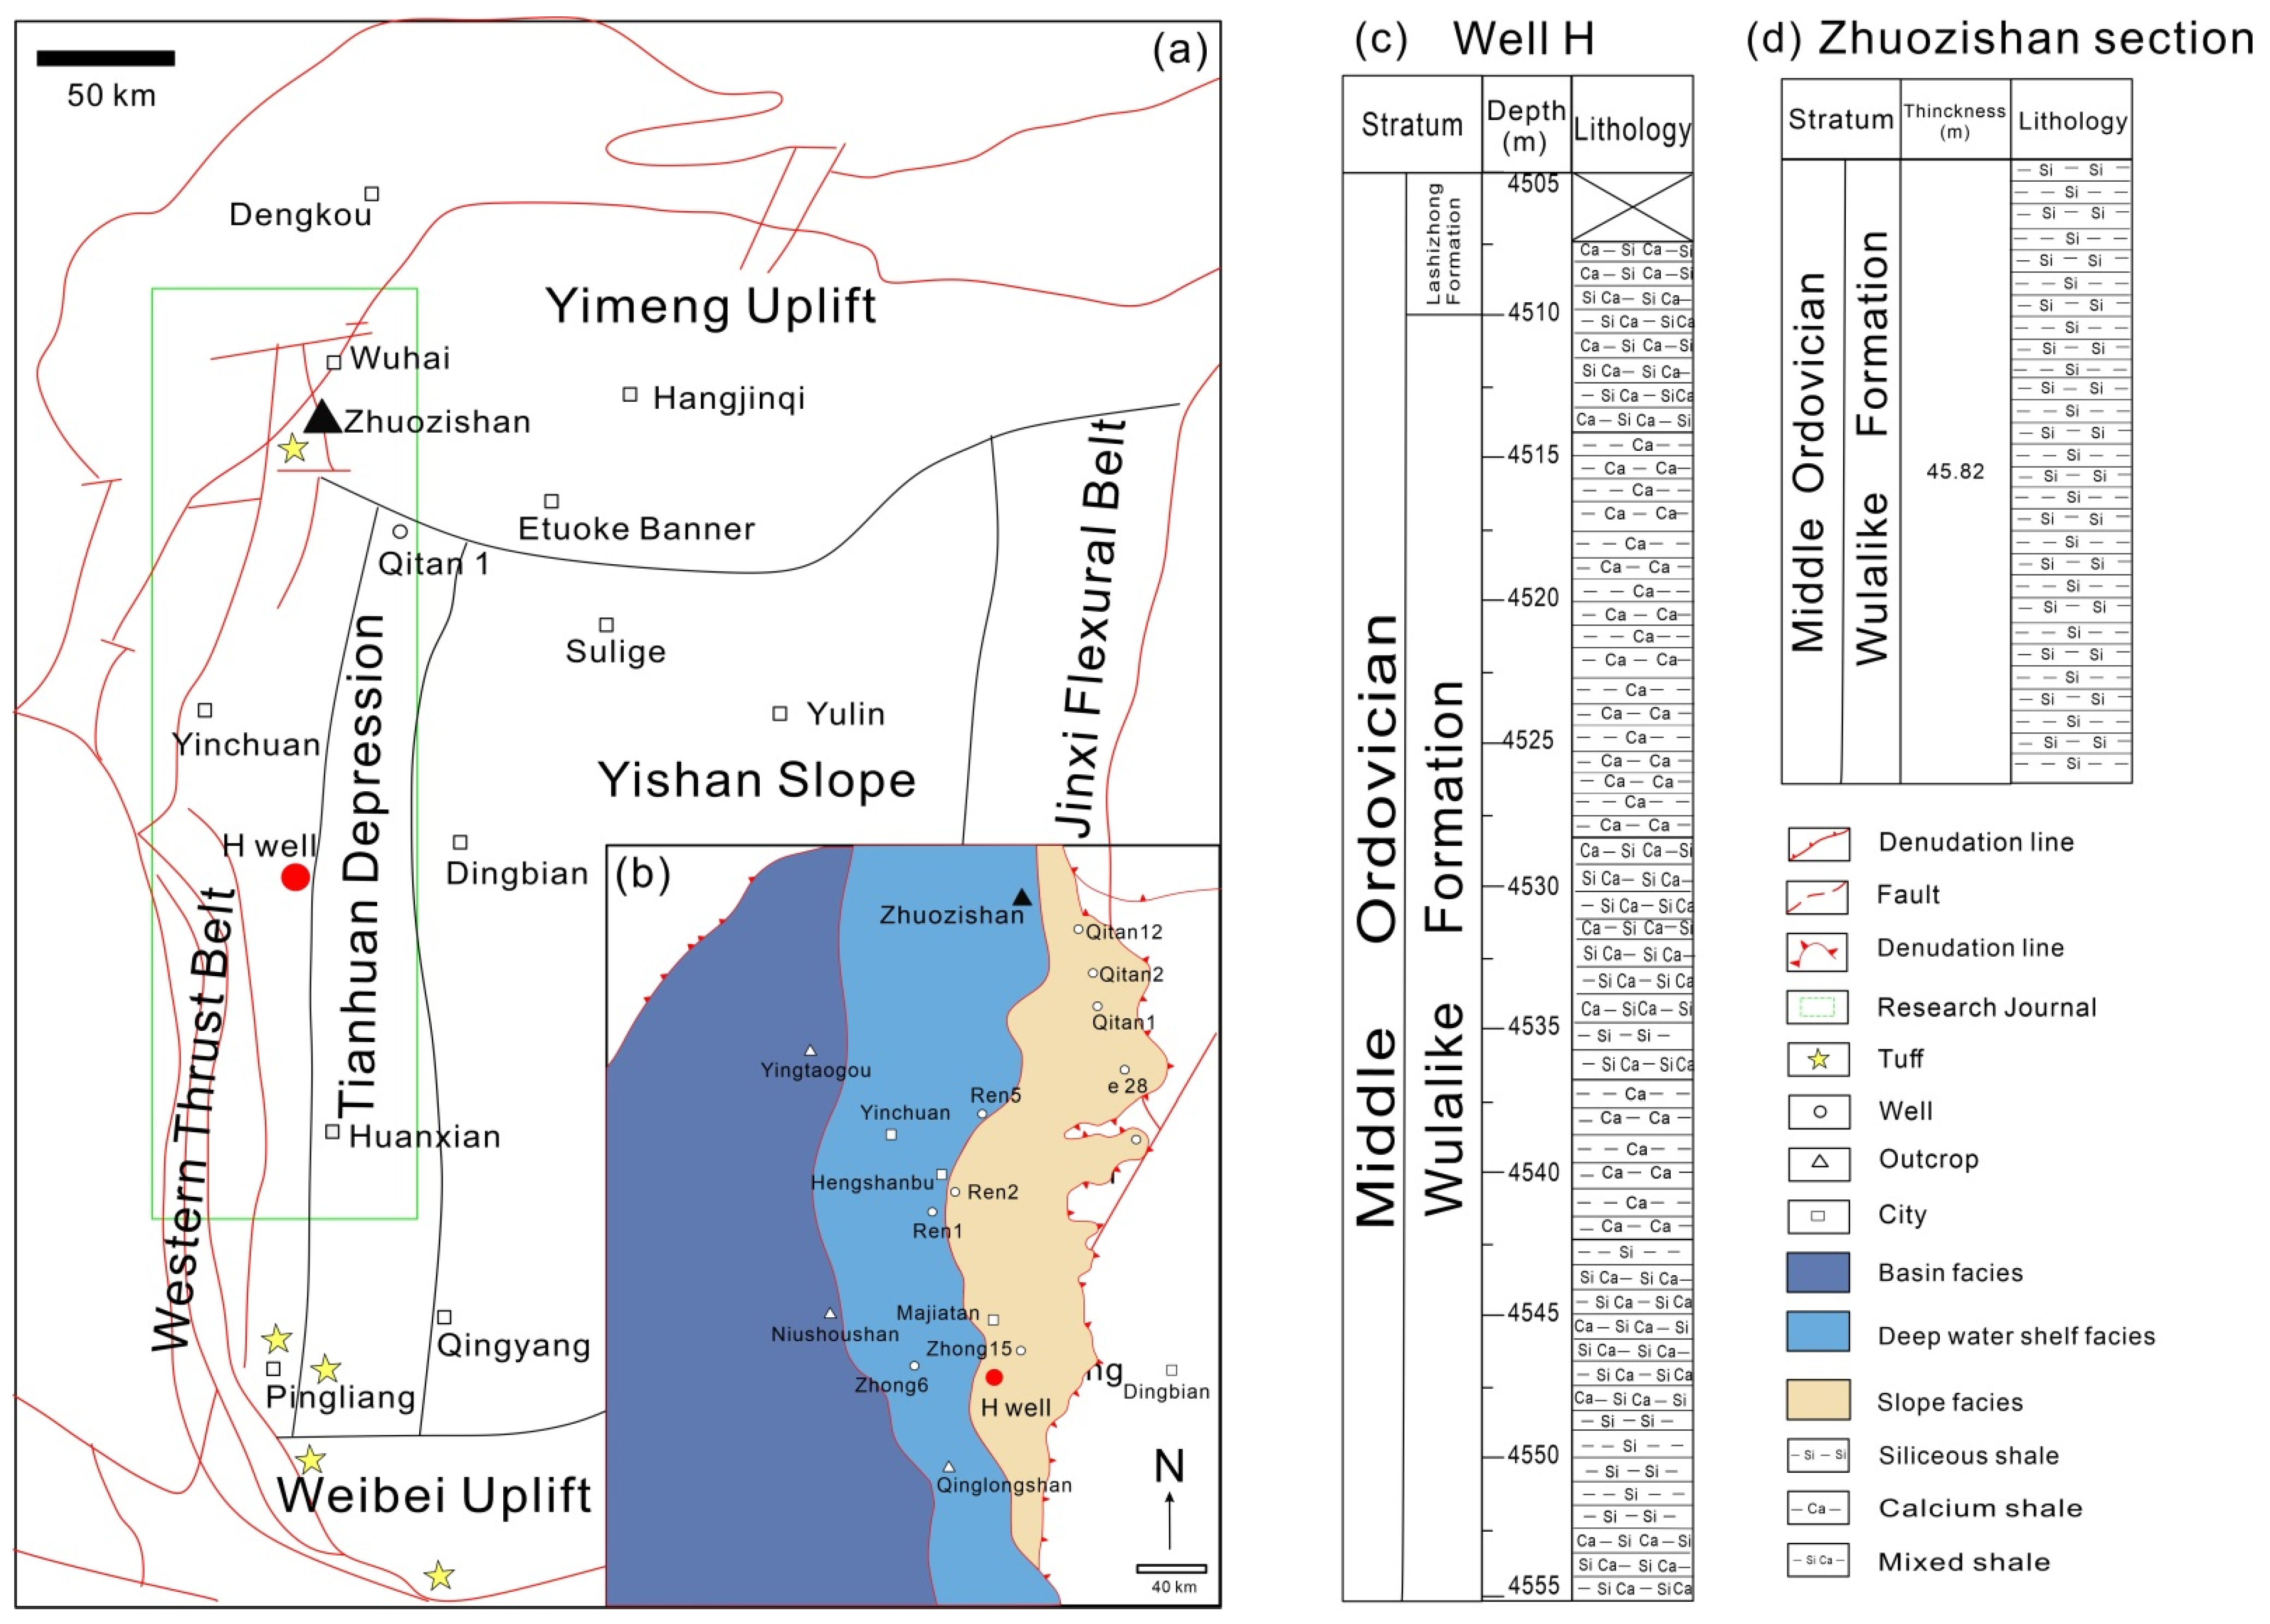
Based on newly measured drilling core data from Well H (Figure 1c) and previous research from field outcrops, this study aims to (1) reconstruct the sedimentary environmental evolution of different lithofacies within the Wulalike Formation; (2) identify the dominant factors influencing organic matter enrichment and (3) compare the sedimentary environments and enrichment types of these Ordovician shales with those of typical Ordovician hydrocarbon source rocks in China. Given the relatively low TOC of the Wulalike Formation shales compared to classic marine shale plays, this study places particular emphasis on understanding the differential enrichment patterns across lithofacies under this low-abundance background, and discusses the implications for shale gas potential in such marginal marine settings.

2. Geological Background

The Ordos Basin is a classic polycyclic superimposed basin that has undergone multiple tectonic phases [22]. Its interior is structurally stable and relatively gentle, whereas the basin margins are fault-bounded and tectonically active [23]. During the Middle to Late Ordovician, the basin experienced a major tectonic shift driven by the Caledonian Orogeny [5,24]. In the Middle Ordovician, the basin was situated on a passive continental margin, but by the Late Ordovician, it transitioned to an active margin influenced by island-arc tectonics, during which the Wulalike Formation was deposited [24]. As a result, the Middle–Upper Ordovician strata were eroded and are absent across much of the basin, with the sedimentary records of this period preserved only along the western and southern margins of the basin [25]. The stratigraphic succession in these areas comprises, from bottom to top, the Wulalike, Lashizhong, Gongwusu, and Sheshan formations [4].
During deposition of the Wulalike Formation, the basin formed a rimmed epicontinental sea [4]. The Wulalike Formation was primarily deposited in slope facies adjacent to the denuded paleoland, where graptolitic shales were extensively developed, intercalated with several layers of calcareous breccia [18]. Water depth increased from east to west, creating a complete depositional succession that ranges from slope facies to deep water shelf and basinal facies [17] (Figure 1b). These shales serve as the primary source rock for hydrocarbon discoveries in the Wulalike Formation of the study area.
The study area lies along the western margin of the basin, and covers approximately 60,000 km2. The Wulalike Formation is restricted to this basin margin [5]. In this study, Well H, drilled in the slope facies of the formation, was selected as the key study target. Its lithology is characterized by interbedded calcareous shales, mixed shales and thin limestone beds (Figure 1c). In contrast, the Zhuozishan Section, representing shelf-facies deposits, is described in Figure 1d. Previous studies on the Zhuozishan Section have documented its lithology, sedimentary facies, and organic matter characteristics [19,20], confirming that it is dominated by thick, well-laminated, biogenic siliceous shales, rich in graptolites and other fossils [25]. Therefore, a comparative analysis of Well H and the Zhuozishan Section allows for a comprehensive characterization of the sedimentary paleoenvironmental and organic matter enrichment differences among the varied lithofacies of the Wulalike Formation.

3. Materials and Methods

We studied a drill core of Well H in the western Ordos Basin (location shown in Figure 1a), which penetrated the entire Wulalike Formation. A total of 39 shale samples were collected at an average interval of approximately 1.3 m from a continuous 50 m section of the formation. All samples were carefully cleaned to remove weathered surfaces, post-depositional veinlets, cavities, and visible nodules or bands. About 20 g of each sample was crushed using a hammer and then pulverized into a particle size of <200 mesh using a Rocklabs BTRM mill(Rocklabs, Auckland, New Zealand). The resulting powders were thoroughly mixed to ensure homogeneity, then divided into several aliquots for the following experiments. All experiments were performed at the Research Institute of Petroleum Exploration and Development, China.

3.1. Total Organic Carbon Content (TOC)

TOC was measured using a LECO-CS230 elemental analyzer(LECO, San Jose, CA, USA). Approximately 30–100 mg of powdered sample was treated four times with 5 mol/L HCl to remove carbonate and other inorganic carbon. The residues were repeatedly rinsed with distilled water until the pH exceeded 5.0, then dried overnight at 50 °C and reweighed, and homogenized prior to analysis. TOC is reported as weight percentage (wt.%) for each sample. Analytical precision was controlled by standards (Eltra 92400–4020) and replicate analyses; the precision was better than ±5%.

3.2. X-Ray Diffraction (XRD)

Powdered samples were thoroughly homogenized and loaded into aluminum sample holders. The XRD patterns of whole-rock samples were collected on a SmartLab diffractometer (Rigaku Corporation, Tokyo, Japan) with Cu-Kα radiation (λ = 1.5418 Å). Measurements were conducted over a 2θ range of 2.6° to 45° with a step size of 0.02° 2θ, at an operating voltage of 40 kV and a tube current of 150 mA. The scattering slit and receiving slit were set to 1° and 0.3 mm, respectively. Mineral phase identification and semiquantitative determination of their relative abundances (wt.%) were achieved via computer-aided analysis of the XRD diffractograms using the TOPAS V6 software (Bruker AXS GmbH, Karlsruhe, Germany) platform with the Rietveld refinement method. The semiquantitative calculation of relative mineral contents was based on the integrated peak area of the major intensity reflection for each mineral, with corrections applied for Lorentz-polarization effects [26].

3.3. Major and Trace Elements Analyses

Major elements were analyzed by wavelength-dispersive X-ray fluorescence (WDXRF) using an Axios mAX spectrometer(PANalytical BV, Almelo, The Netherlands). Samples were prepared as fused glass beads to ensure homogeneity and minimize mineralogical effects. A rhodium X-ray tube operated at 50 kV and 50 mA was used. Major oxides (e.g., SiO2, Al2O3, Fe2O3, CaO, MgO) were quantified with counting times of 20–40 s per element. Analytical accuracy and precision (better than 5%) were verified using certified references materials AGV-2, GSR-1, and GSR-5, according to GB/T 14506.30–2010 [27] from the Chinese National Standard, with measured values deviating by less than 3% from certified values.
Trace elements and rare earth elements (REEs) were determined by inductively coupled plasma–mass spectrometry (ICP-MS) using an iCAP-Q instrument (Thermo Fisher Scientific, Waltham, MA, USA) after high-pressure acid digestion. Approximately 25 mg of powdered sample was digested in ultrapure HNO3, HF, and HClO4 at 190 °C for 72 h in PTFE vessels (e.g., Parr bomb or equivalent). After cooling, the solution was evaporated at 150 °C to near dryness to remove residual HF and HClO4, reducing the volume to approximately 1–2 mL. The residue was then redissolved in 5% HNO3, diluted to 50 mL, and filtered through a 0.45-μm membrane. Rhodium (Rh) and rhenium (Re) were added as internal standards to correct for instrumental drift and matrix effects. Analytical accuracy was assessed using Chinese certified reference materials GBW 07107 (shale) and GBW 07114 (dolomite). The resulting relative standard deviation (RSD) for all trace elements was controlled under 5%.
The enrichment factor (EF) of Mo and U was calibrated by Post-Archean Australian Shale (PAAS) values [28]. The EF is calculated as follows:
X EF = X / Al sample X / Al PAAS
where (X/Al)sample and (X/Al)PAAS represent the ratios of element X to aluminum (Al) in the sample and PAAS, respectively. Elements with XEF > 1 are considered enriched, whereas those with XEF < 1 are depleted relative to average shale [7].
The negative Eu anomaly is expressed by δEu, calculated using the following formula [29]:
δ Eu = Eu N S m N G d N
To reconstruct the paleoclimatic conditions of the Wulalike Formation, three widely used geochemical proxies (CIA, C-value, and Sr/Cu ratio) were selected, as they are reliable indicators for paleoclimate reconstruction [30]. Their calculation methods are summarized below:
The corrected CIA is calculated as follows [31]:
CIA corr = Al 2 O 3 Al 2 O 3 + CaO + Na 2 O + K 2 O corr 100
K 2 O c o r r = m A l 2 O 3 + m C a O + N a 2 O 1 m
m = K 2 O A l 2 O 3 + C a O + N a 2 O + K 2 O
All oxide concentrations are expressed in molar proportions. CaO* represents calcium derived from silicate minerals, corrected for apatite, and is calculated as [32]
CaO # = CaO P 2 O 5 10 3
CaO = min Na 2 O , CaO #
For the C-value is calculated as [33]
C = ( Fe + Mn + Cr + Ni + V + Co ) Ca + Mg + Sr + Ba + K + Na
To assess non-terrestrial silica input and paleoproductivity, excess silica (SiXS) was calculated as [34]
Si XS = Si sample - Al sample   X / Al   PAAS
where Sisample and Alsample are the concentrations of Si and Al in the samples and (Si/Al)PAAS is the elemental ratio of Post-Archean Australian Shale (PAAS) [6].

4. Results

4.1. Total Organic Carbon and Petrology

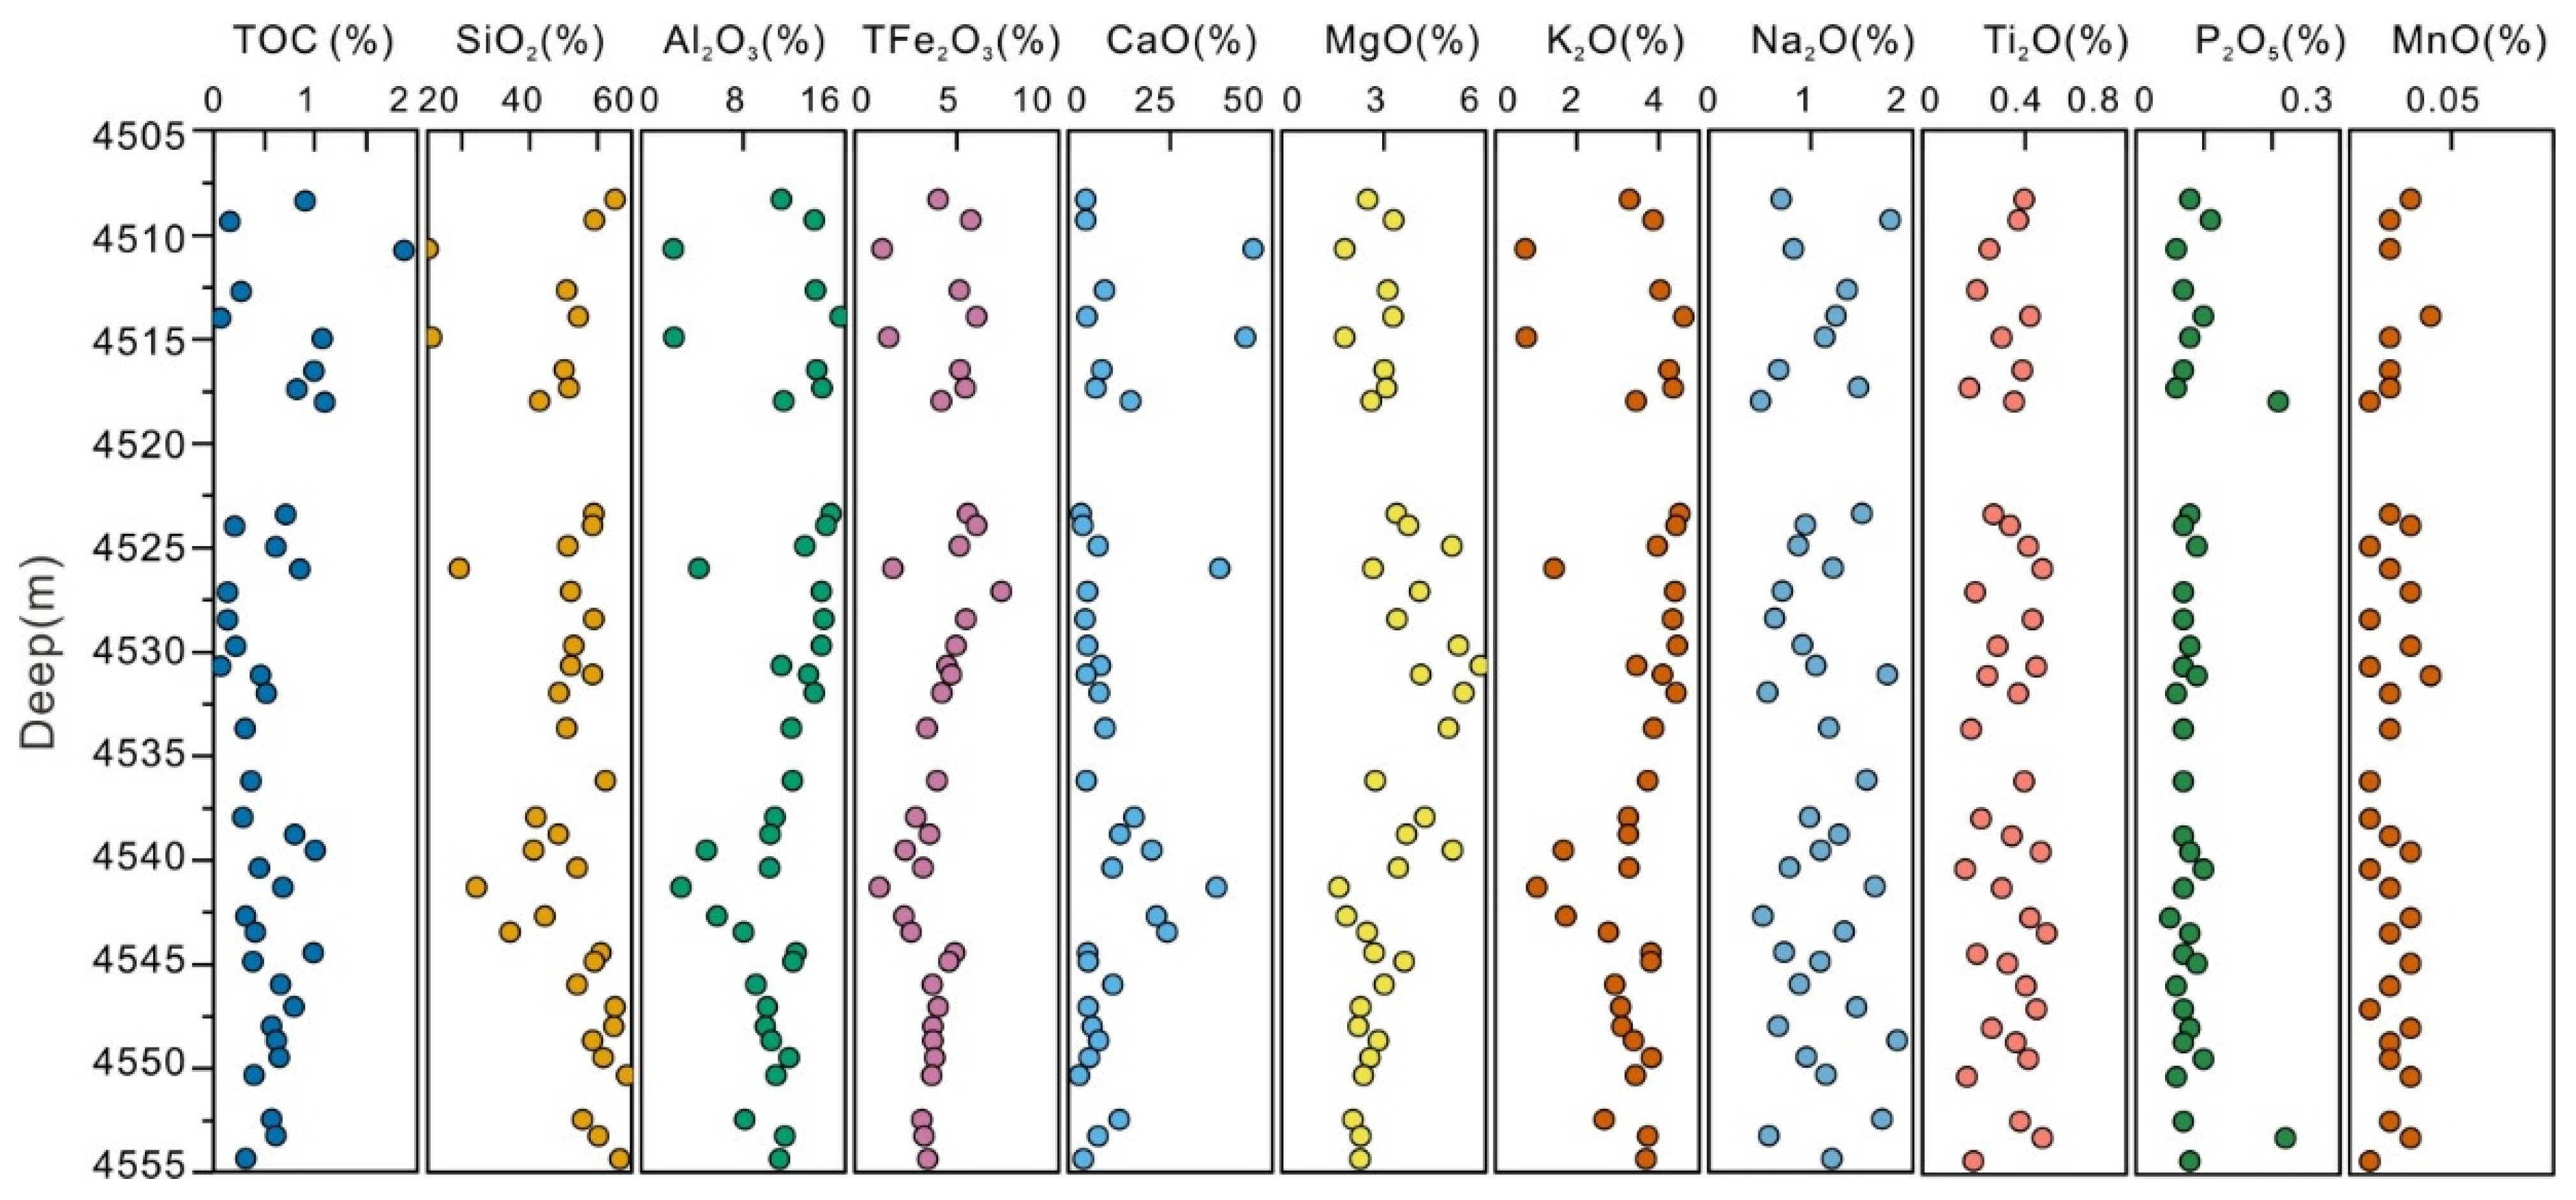
The TOC values of the Wulalike Formation shale range from 0.07 wt.% to 1.87 wt.% (average 0.57 wt.%). Vertically, TOC values remain consistent, with no discernible patterns or significant variations observed (Figure 2).
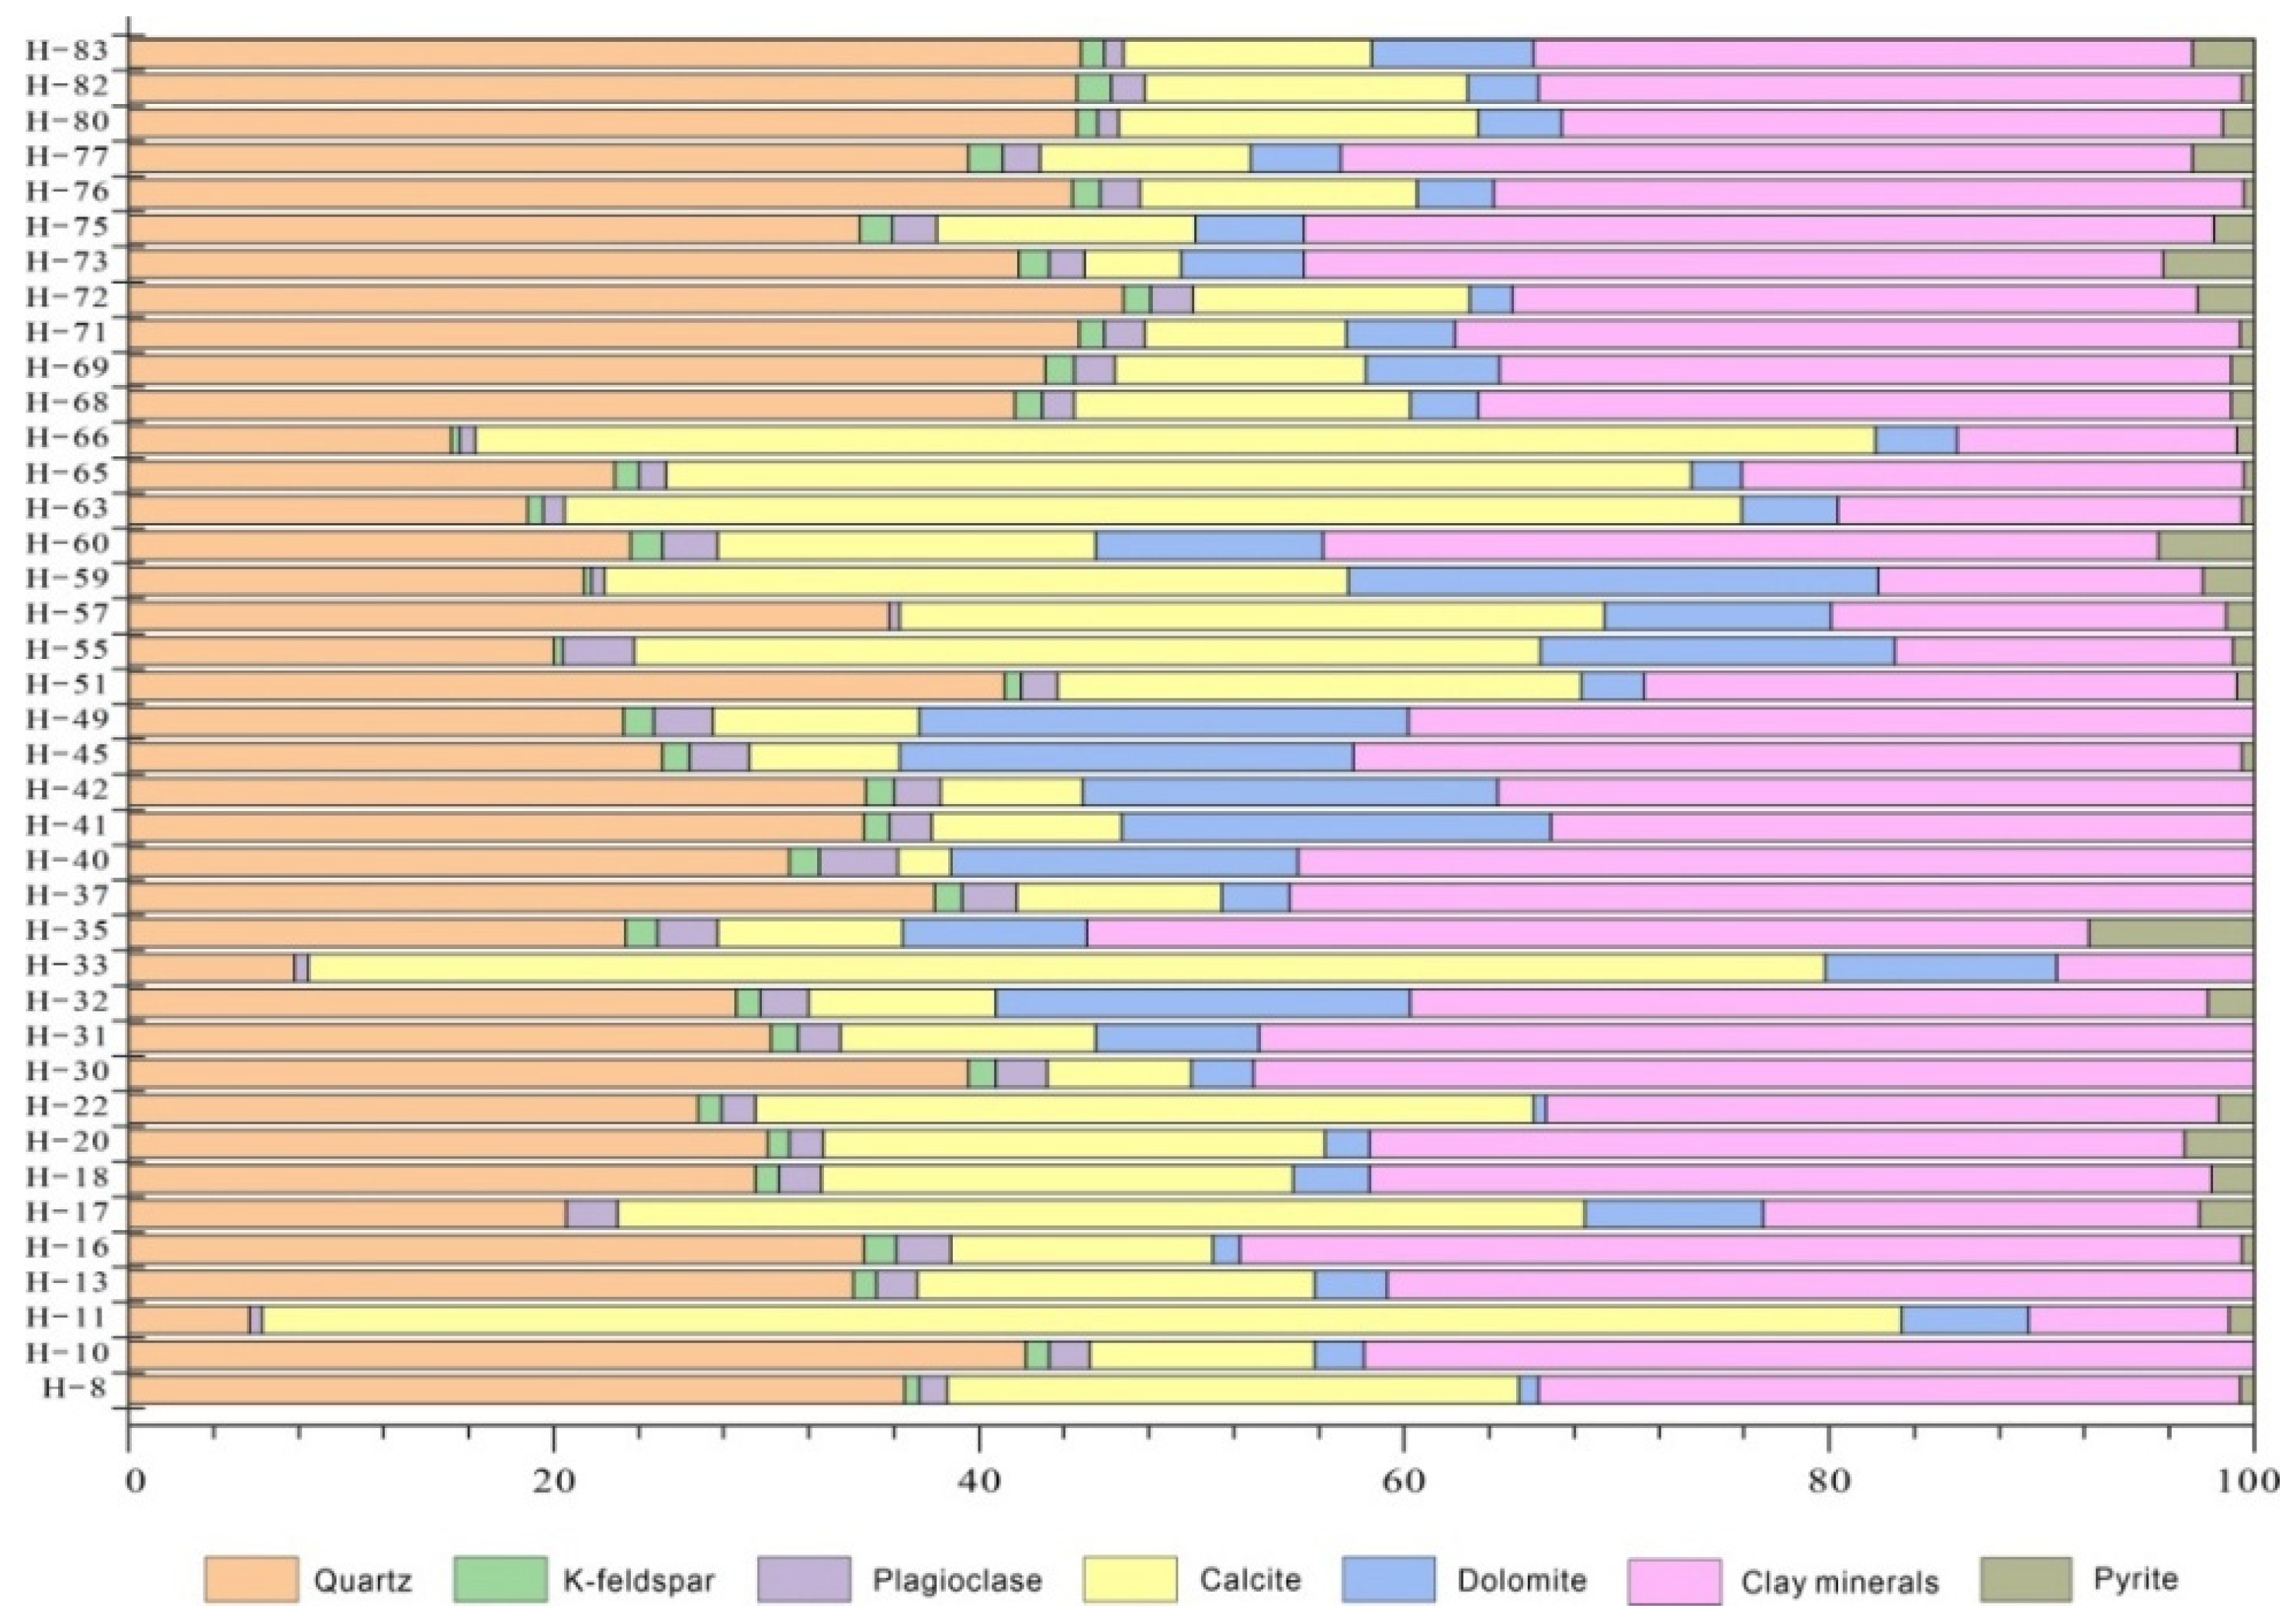
XRD analysis of 39 samples (Figure 3) shows a wide variety of lithologies and complex mineral compositions within the studied shale. The mineral assemblage consists of detrital components (e.g., feldspar, quartz), carbonate minerals (calcite, dolomite), heavy minerals (siderite, pyrite), and a substantial proportion of clay minerals. The mass fractions of the major minerals vary as follows: quartz ranges from 5.7% to 46.8% (average 31.94%), K-feldspar from 0% to 1.6% (average 1.04%), plagioclase from 0.5% to 3.7% (average 1.85%), calcite from 2.5% to 77.1% (average 22.6%), dolomite from 0.6% to 24.9% (average 7.9%), clay minerals from 9.3% to 47.1% (average 33.23%), and pyrite from 0% to 7.8% (average 1.4%).

4.2. Major and Trace Elements

The major elements in the Wulalike shale are primarily SiO2, Al2O3, TFe2O3 and CaO. The SiO2 contents range from 10.17% to 68.55% (average 50.90%). The Al2O3 content ranges from 2.54% to 15.65% (average 10.70%), while the TFe2O3 content ranges from 1.21% to 7.19% (average 4.05%). The CaO content ranges from 2.80% to 45.42% (average 11.63%). The contents of MgO, Na2O, and K2O range from 1.68% to 5.85%, 0.51% to 1.85%, and 1.37% to 4.38%, respectively. The shale also contains trace amounts of P2O5, TiO2 and MnO, with contents of ranging from 0.05% to 0.22%, 0.21% to 0.61%, and 0.01% to 0.04%, respectively (Figure 3).
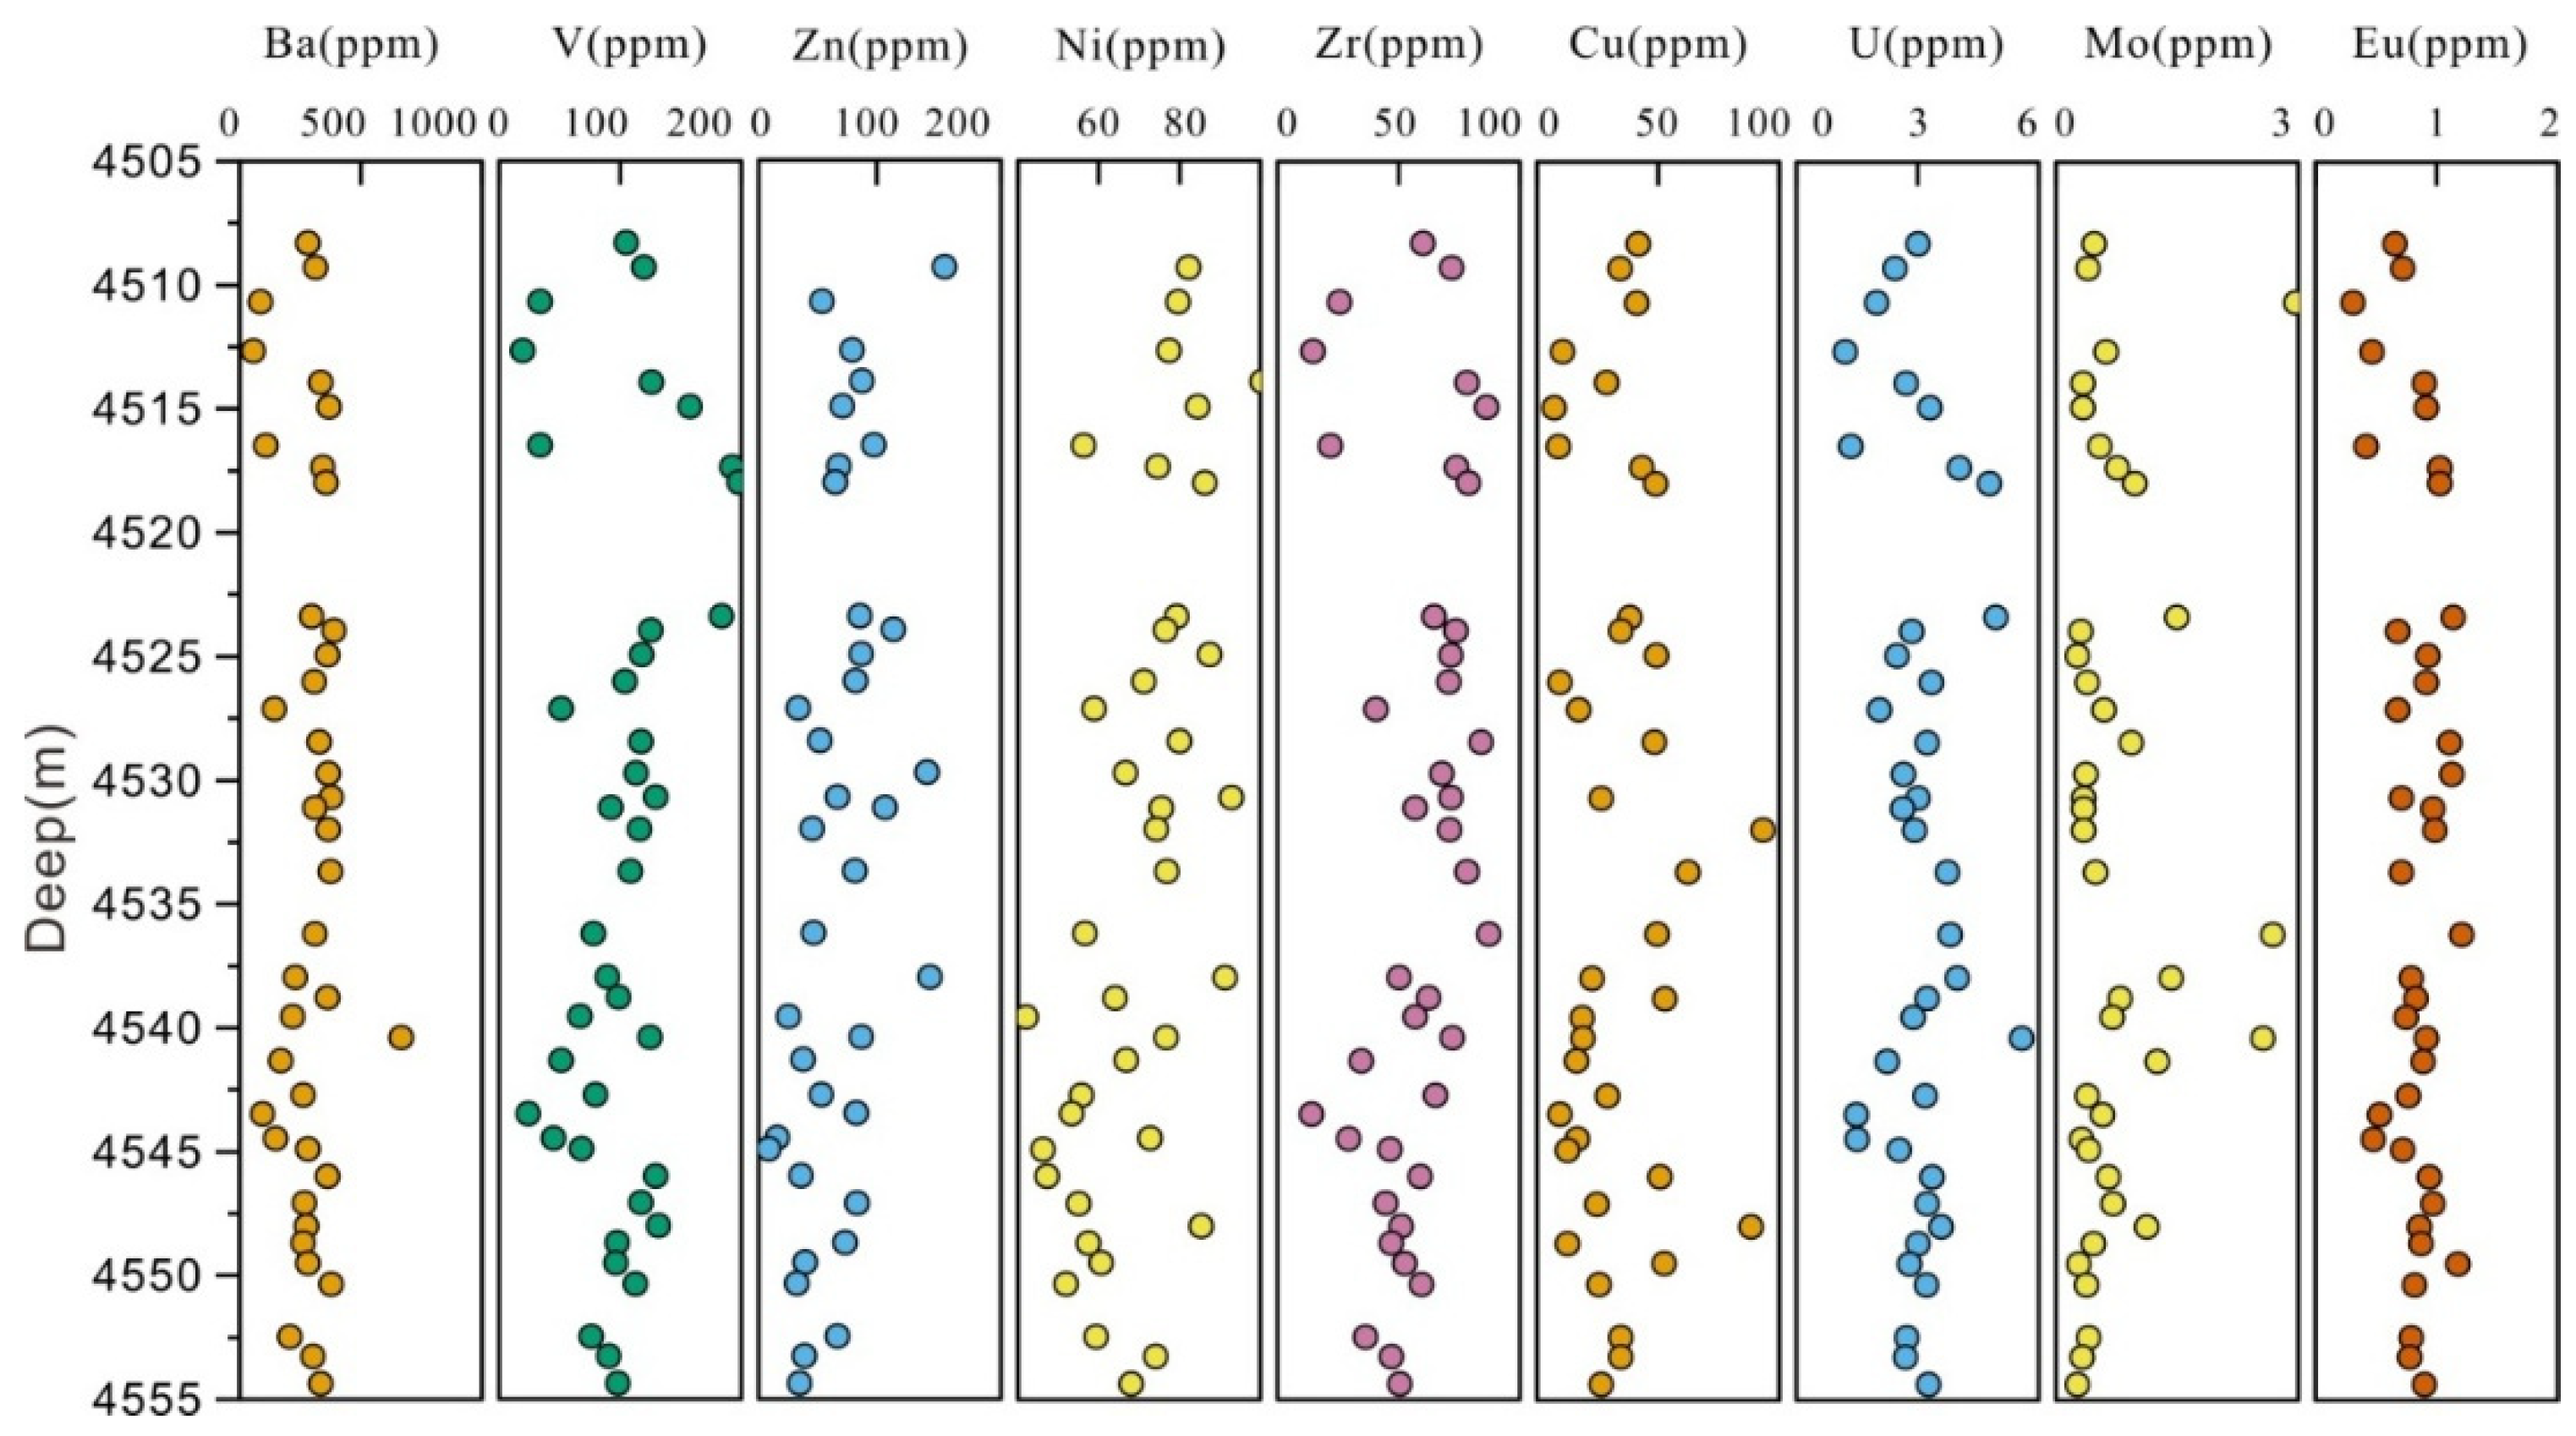
Trace elements in shale samples from the Wulalike Formation include Co, V, Rb, Zr, Ba, Ni, Zn, Mo, U, Cu and Eu. The results show a relatively high concentration of Ba and V, with Ba ranging from 56 to 669 ppm (average 291 ppm) and V from 19 to 198 ppm (average 101 ppm). Other trace elements occur at moderate to low levels: Zn ranges from 57 to 345 ppm (average 116 ppm), Ni from 42 to 133 ppm (average 73 ppm), Zr from 14to 87 ppm (average 57 ppm), and Cu from 7 to 106 ppm (average 35 ppm). U and Mo are comparatively low, with U ranging from 1.20 to 5.58 ppm (average 3.00 ppm), and Mo ranging from 0.27 to 2.97 ppm (average 0.71 ppm). Europium (Eu) concentrations range from 0.31 to 1.20 ppm (average 0.83 ppm) (Figure 4).

5. Discussion

5.1. Relationship Between Lithofacies and TOC

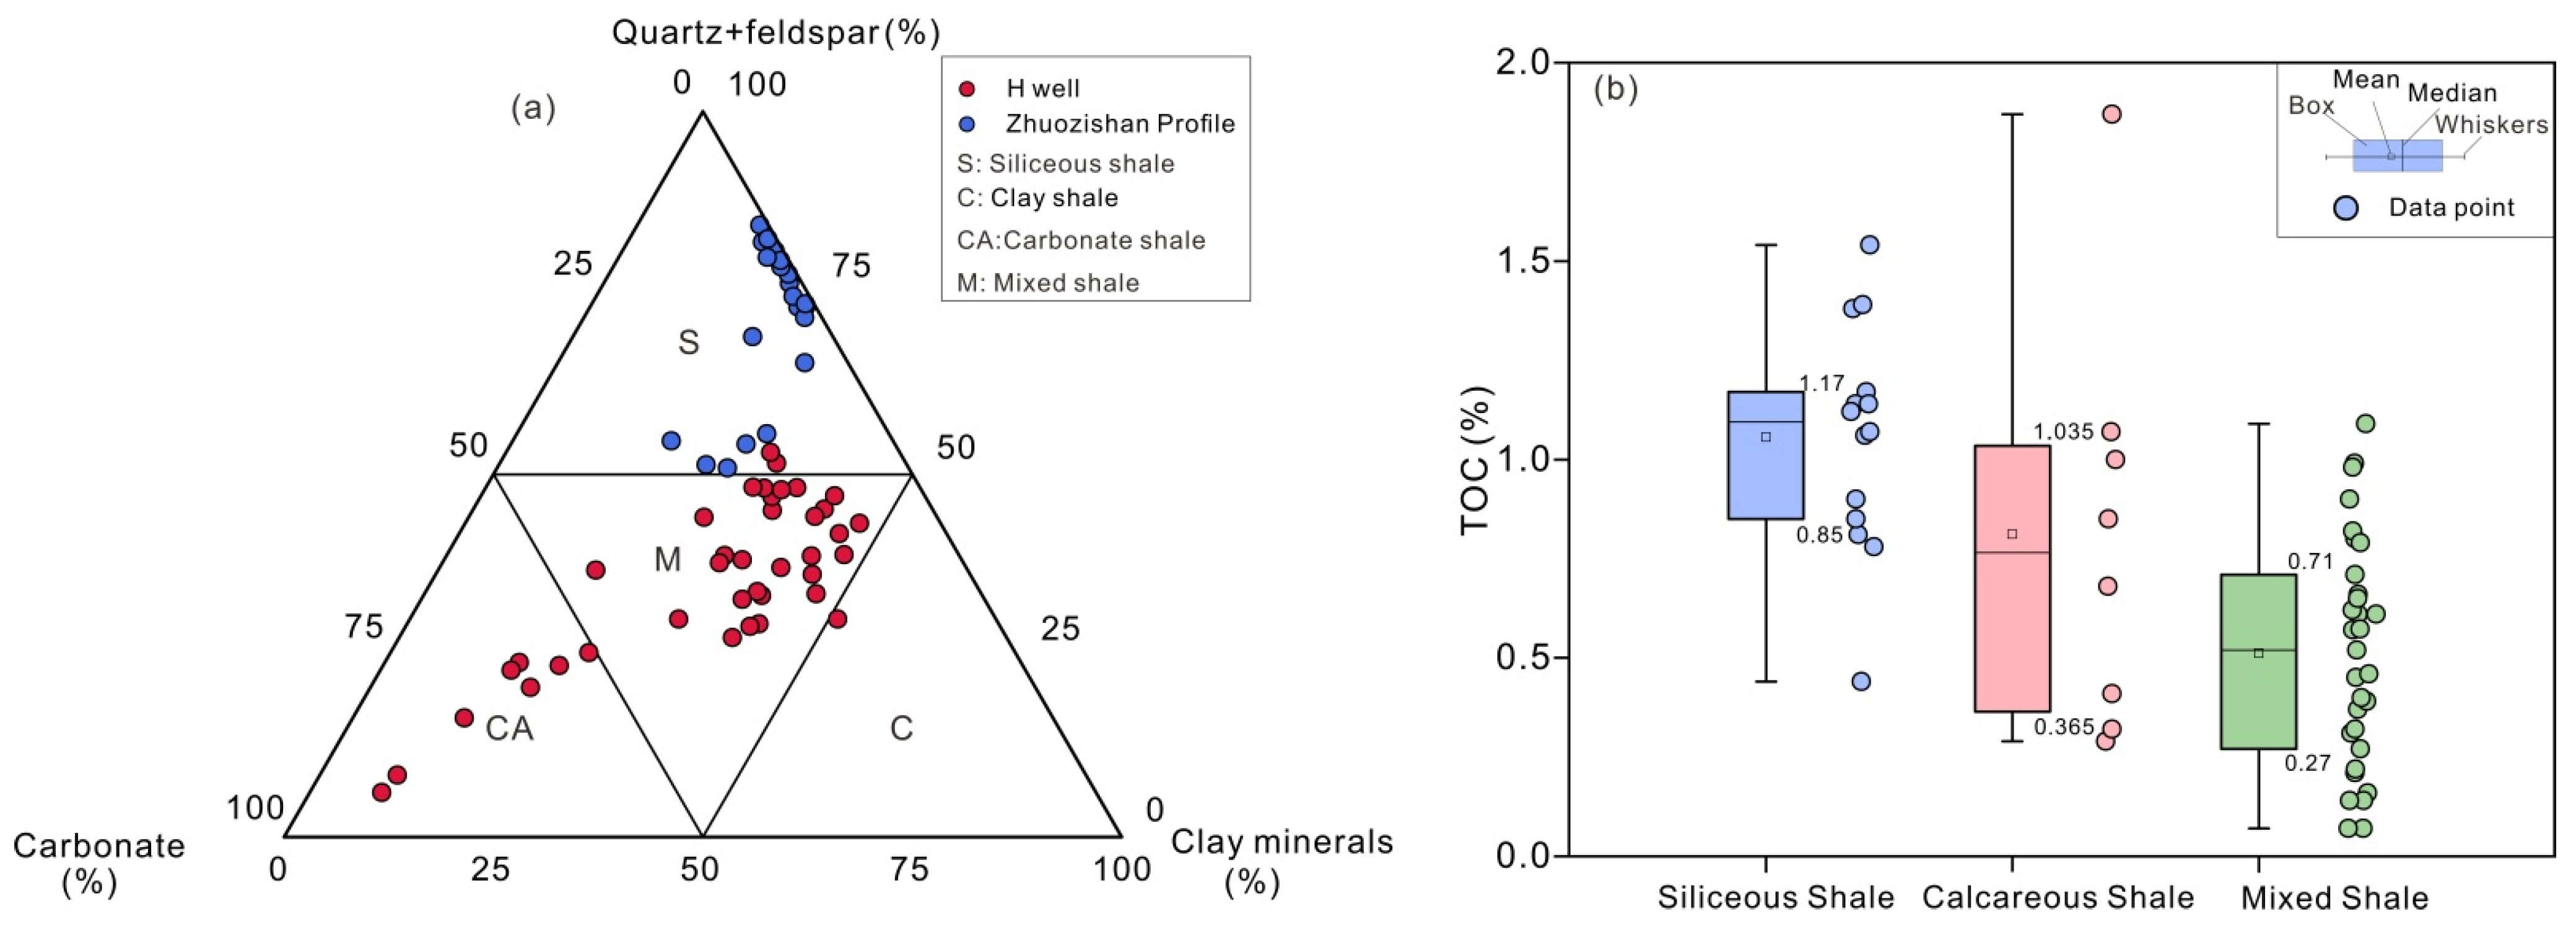
This study adopts the ternary classification scheme based on clay minerals (quartz + feldspar)–carbonate minerals, as proposed in previous studies [12,35]. A 50 wt.% threshold for each end member was adopted as the primary classification criterion. To ensure comprehensive lithofacies coverage and facilitate regional comparison, data from 39 samples from of Well H were combined with 14 shale samples from the Zhuozishan Section [21]. Based on ternary diagram analysis, the shales are classified into three lithofacies: 14 siliceous shale lithofacies (S), 8 calcareous shale lithofacies (CA), and 31 mixed shale lithofacies (M) (Figure 5a).
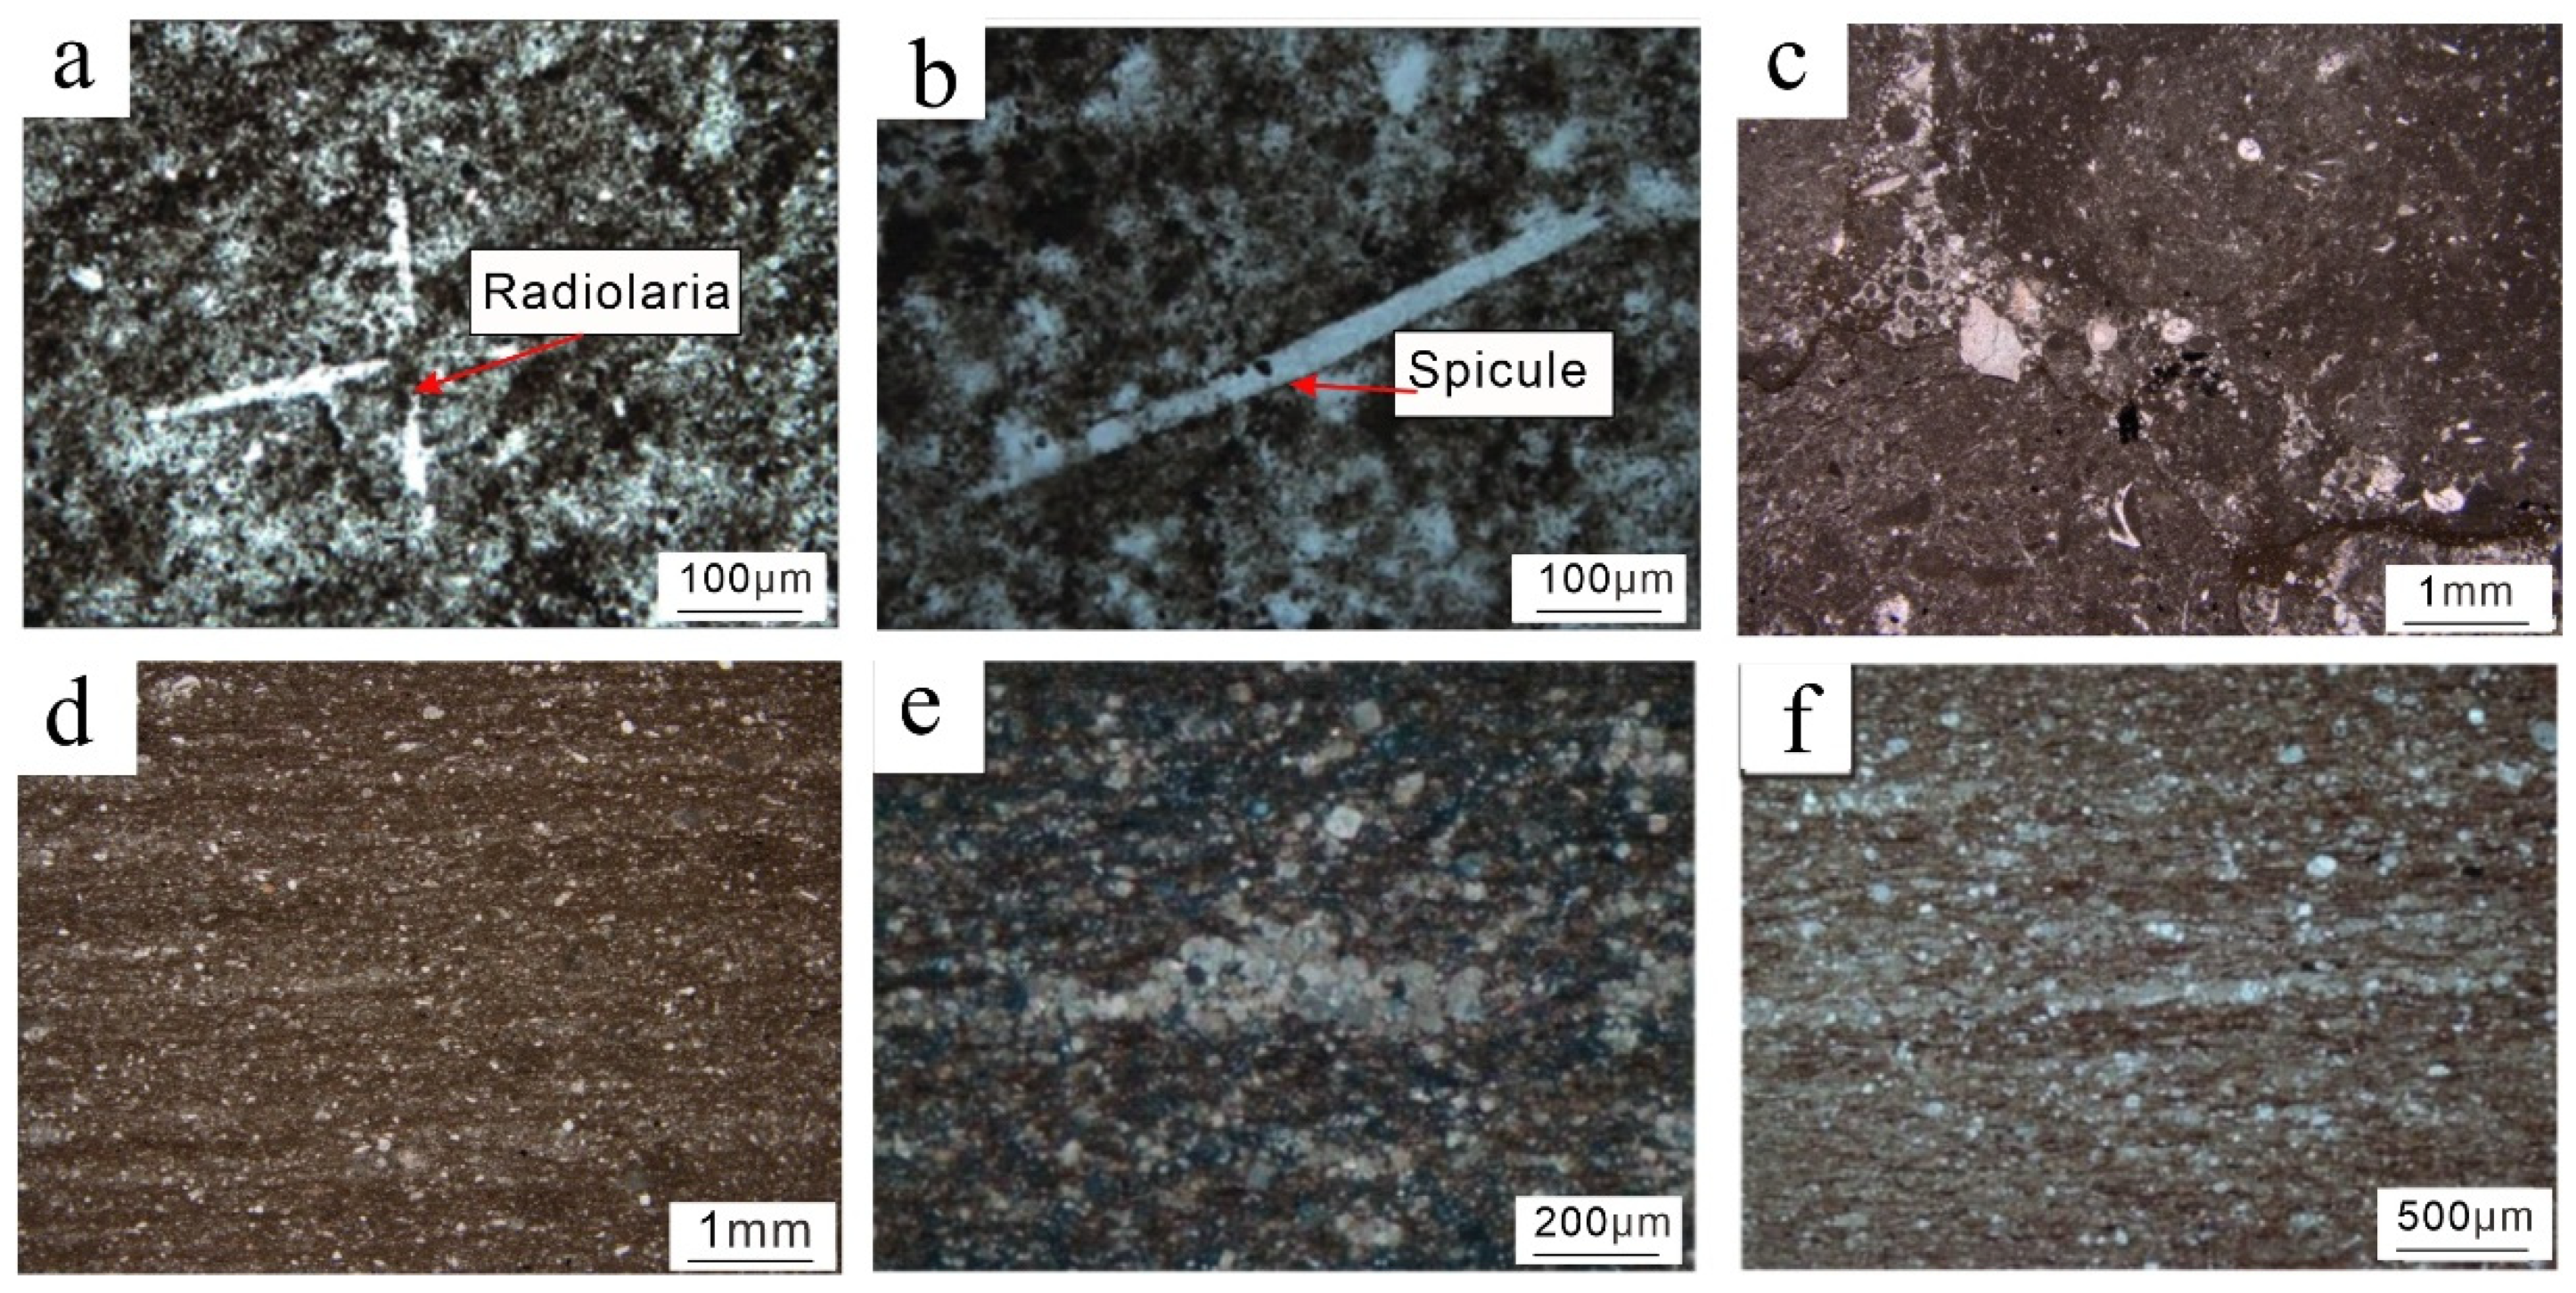
Microscopic observations and XRD analyses show that the siliceous shale lithofacies (S), mainly developed in the Zhuozishan section, is black to grayish-black and rich in siliceous microfossils, such as sponge spicules, radiolarians, and algae (Figure 6a,b). This facies is notably enriched in quartz, feldspar, and pyrite. In Well H, the shale succession is dominated by calcareous (CA) and mixed (M) lithofacies. The CA facies displays well-developed bioclastic textures, and ranges from dark gray to grayish-yellow. Organic matter occurs mainly as disseminated particles within argillaceous laminae or as discontinuous accumulations along contacts between dolomite and clay minerals (Figure 6c,d). The M facies is dark gray to black and contains siliceous, carbonate, and clay minerals, each comprising less than 50%, with no single dominant component. Its fossil assemblage shows transitional features between siliceous and calcareous facies. Organic matter is randomly distributed among mineral grains (Figure 6e,f).
TOC varies markedly among the different shale lithofacies (Figure 5b). Siliceous shale exhibits the highest TOC values, ranging from 0.44% to 1.54% (average 1.05%). Calcareous shale exhibits a wide TOC range (0.29–1.87%, average 0.81%), generally lower on average than that of siliceous shale. Mixed shale shows the lowest average TOC (0.07–1.09%, average 0.51%). Although the measured TOC values are generally below the global 2 wt.% threshold commonly used to define organic-rich shales [36,37] (e.g., Wufeng–Longmaxi Formation: full-interval TOC > 2 wt.%, Saergan formation: 0.5–4.8 wt.%, average 2.51 wt.%) [3,9]), they still meet shale gas exploration criteria in the northwestern Ordos Basin.

5.2. Terrigenous Supply

Terrigenous material enters marine environments mainly through fluvial and aeolian processes, influencing both marine productivity and organic matter enrichment [38]. On the one hand, it supplies essential nutrients (e.g., N, P, and Fe) that enhance primary productivity. On the other hand, excessive terrigenous input can dilute organic matter, reducing its relative abundance in sediments. Aluminum (Al) and titanium (Ti) are commonly used as proxies for terrigenous input because they are hosted in chemically stable phases—Al in clay minerals and feldspars, and Ti in heavy minerals—and are largely immobile during sediment transport and early diagenesis [35]. Consequently, their concentrations are minimally affected by post-depositional processes and typically correlate positively with the intensity of detrital influx [6,9,38], making them reliable indicators of terrigenous supply to marine depositional systems.
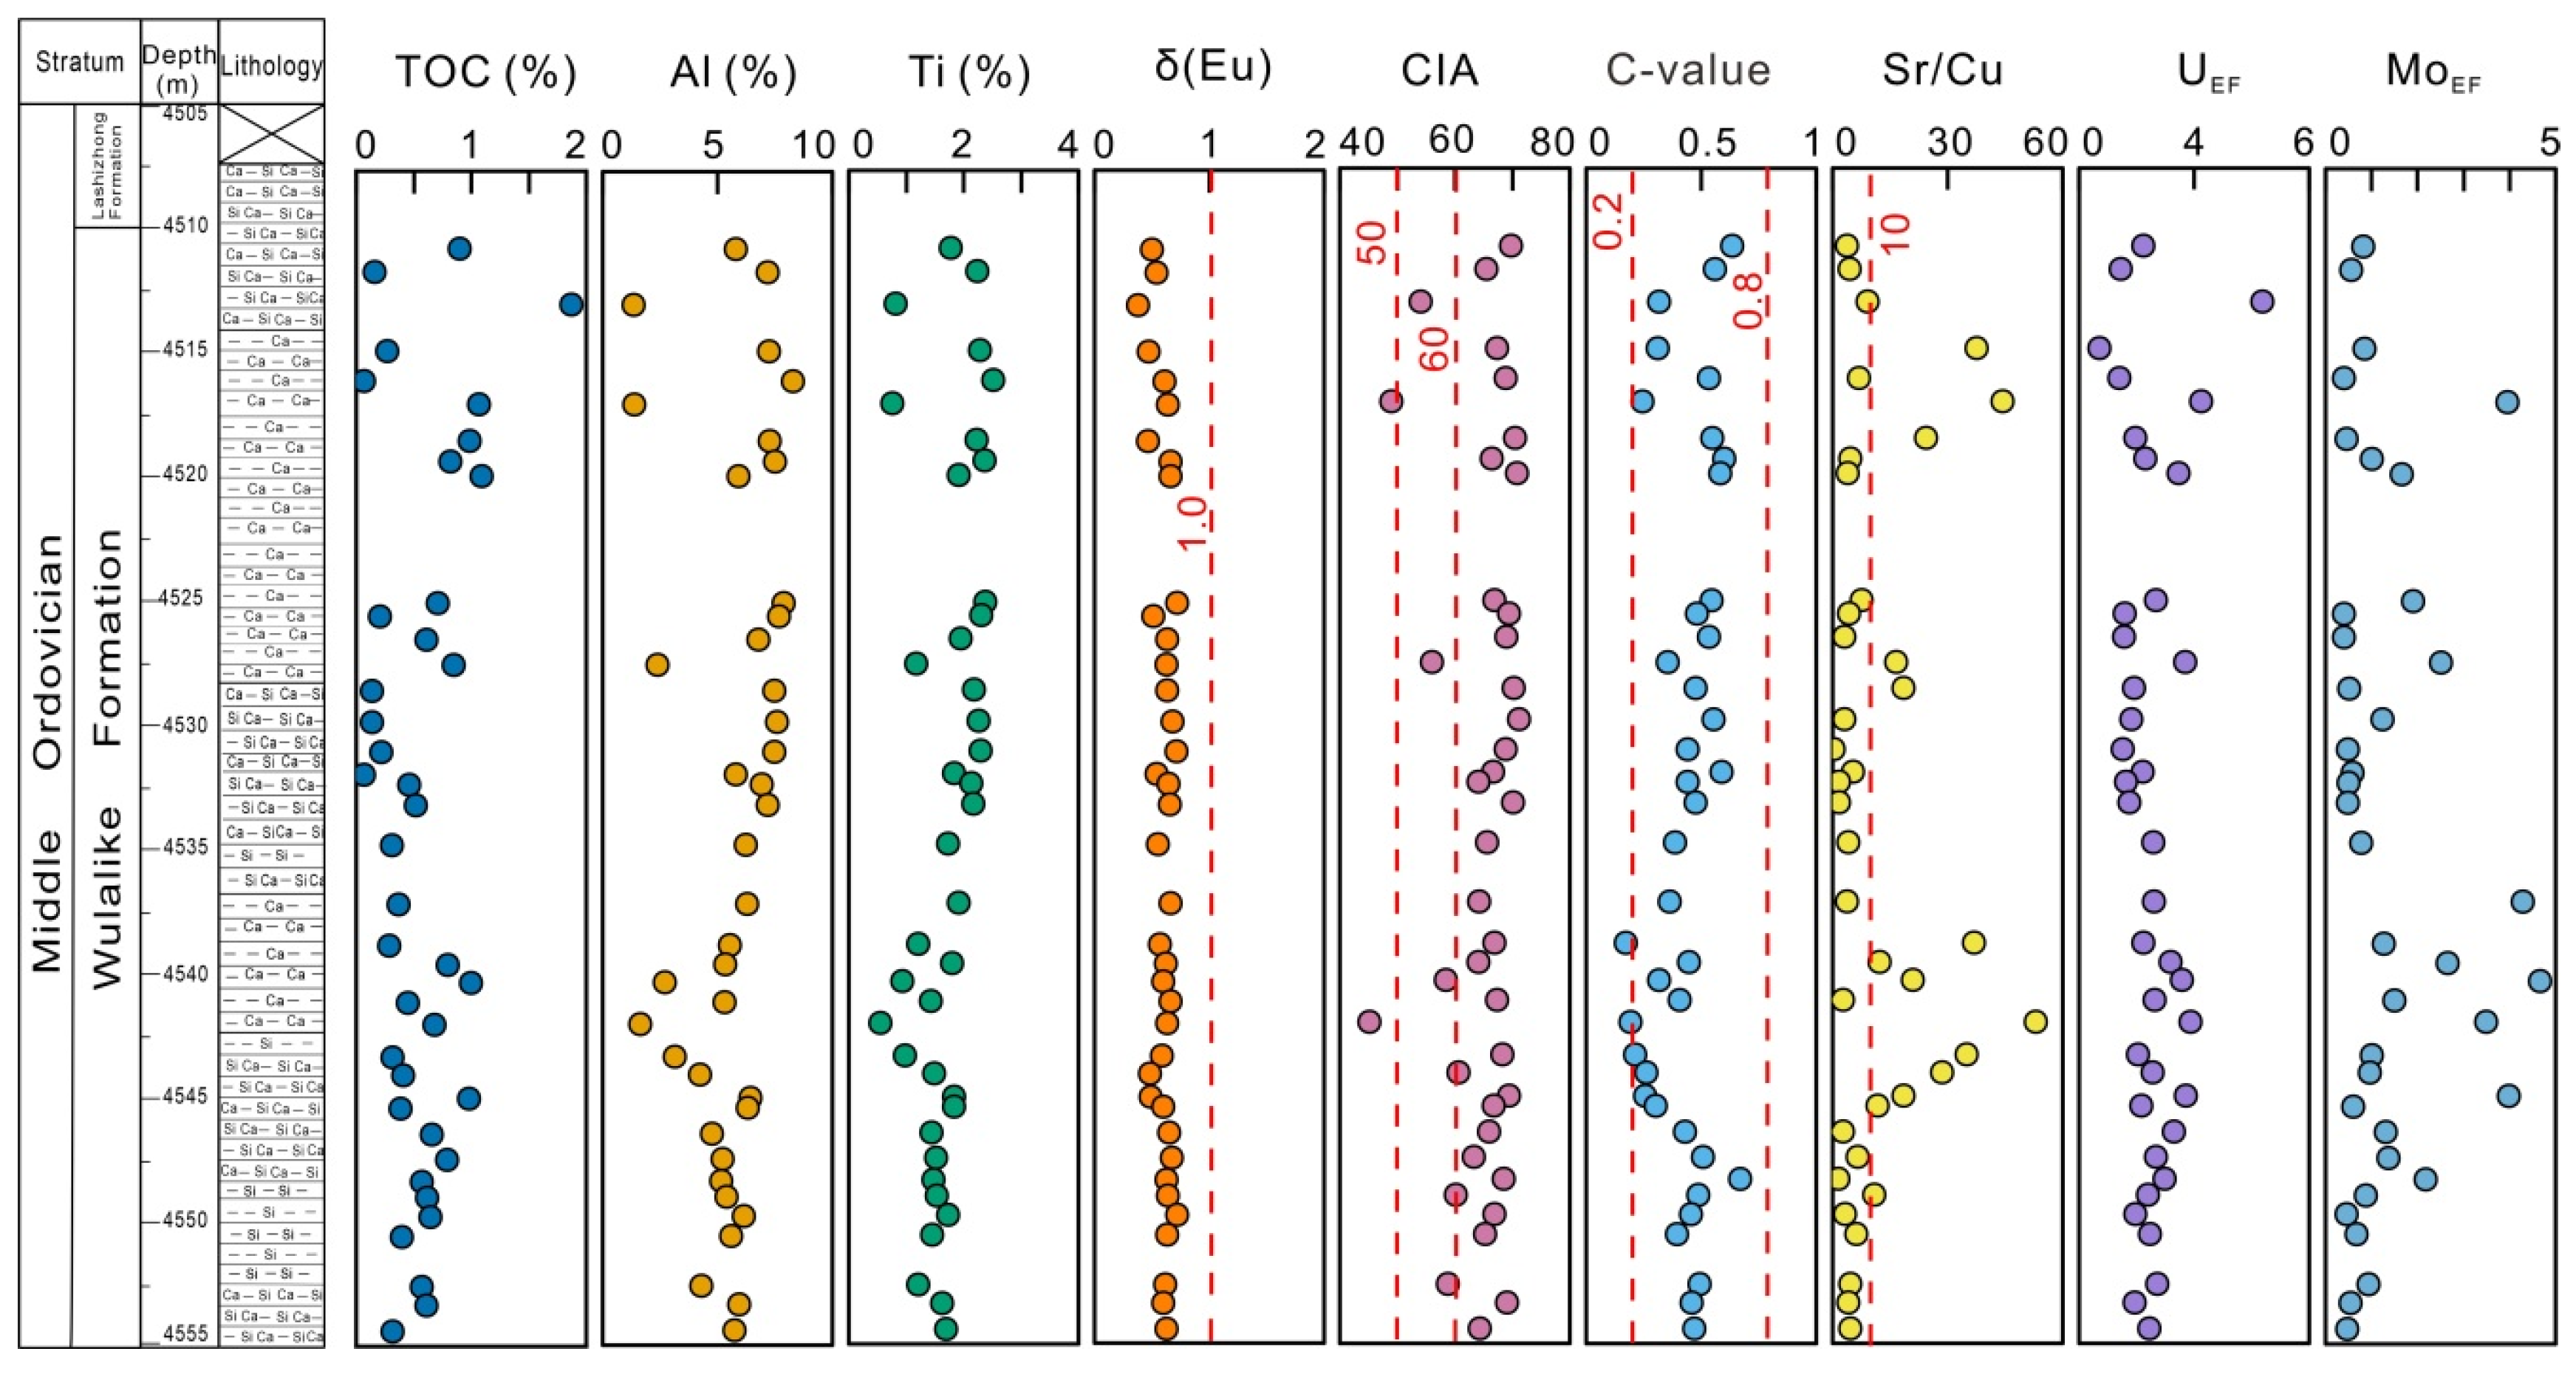
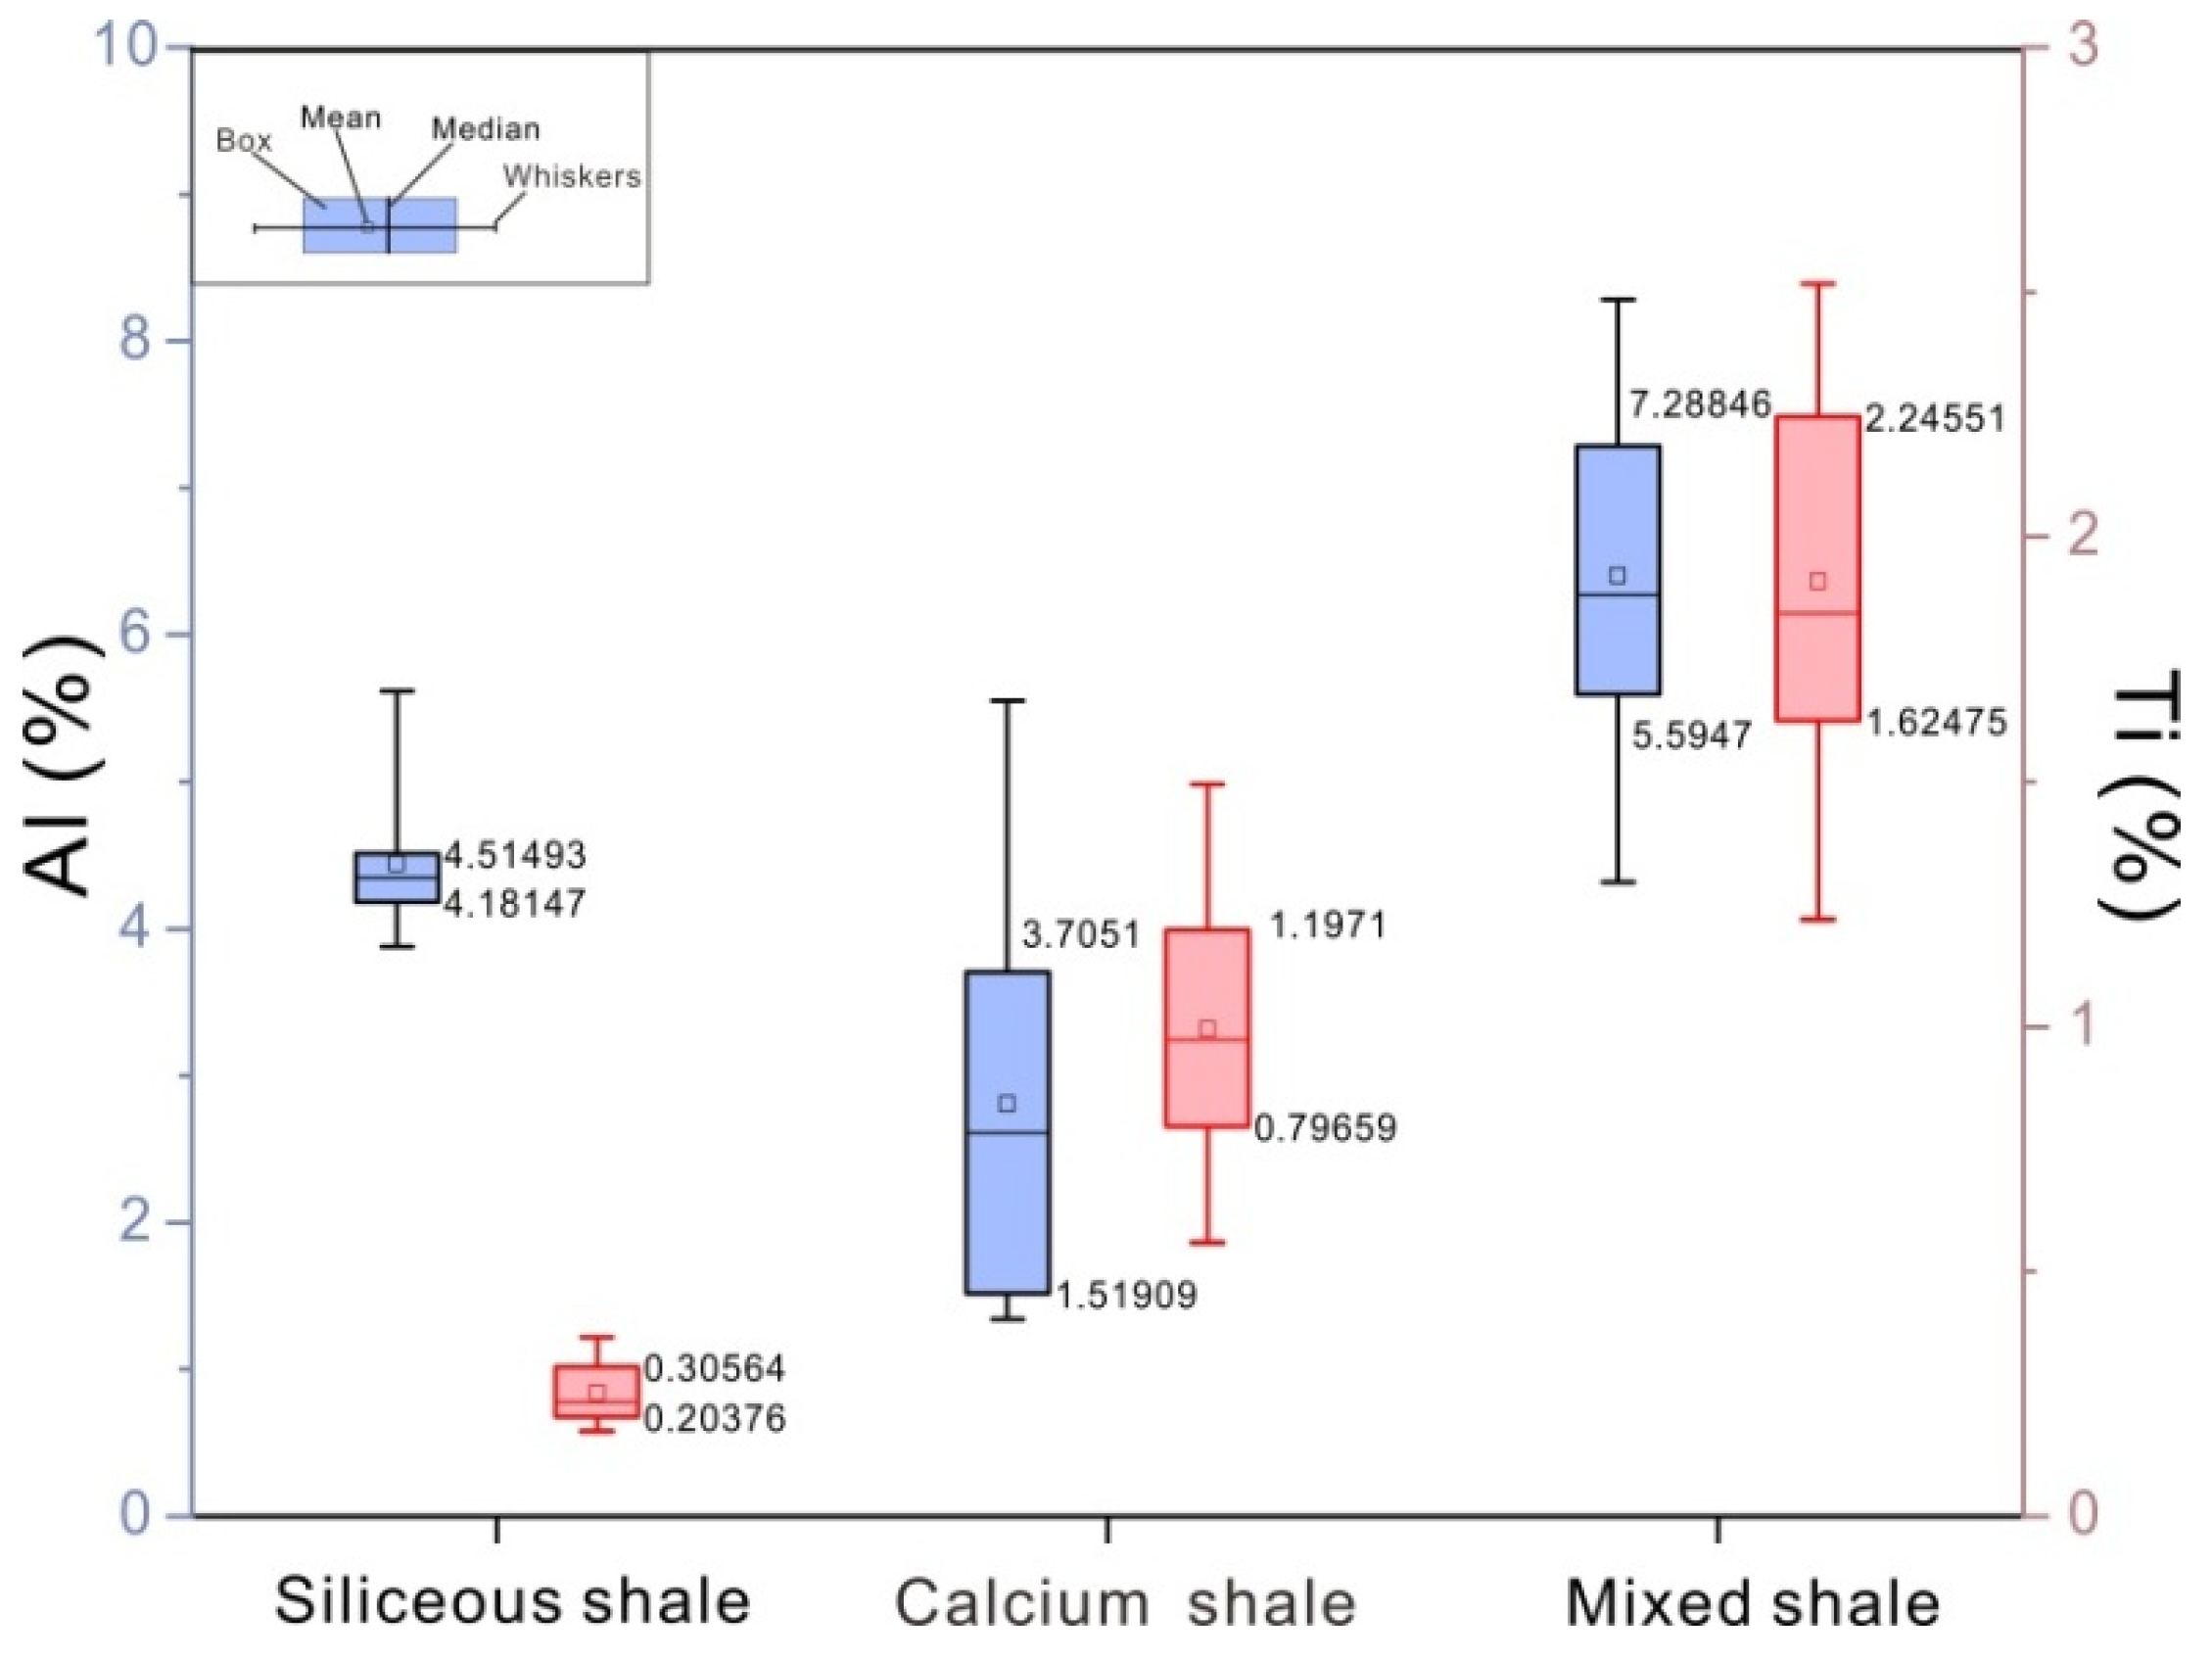
In the studied shales, Al contents range from 1.34% to 8.28% (average 5.34%), while Ti contents vary from 0.17% to 2.51% (average 1.33%) (Figure 7). This geochemical signature indicates relatively low terrigenous input in Wulalike formation shales compared to other typical marine shales: the input is lower than in the Wufeng–Longmaxi Formation shales (average Al = 6.57 wt.%, Ti = 0.41 wt.%) [9,39], but higher than in the Saergan Formation shales (average Al = 3.62 wt.%, Ti = 0.22 wt.%) [3]. When integrated with lithofacies analysis, these data indicate that mixed shales have relatively high Al and Ti contents, reflecting deposition under strong terrigenous input. In contrast, siliceous and calcareous shales exhibit lower Al and Ti contents, consistent with depositional environments characterized by weak terrigenous supply (Figure 8). During the deposition of the Middle Ordovician Wulalike Formation, global cooling was widespread [40]. However, from a long-term paleoclimatic perspective, the Middle Ordovician paleotemperature still remained within a warm interval [40], which favored weathering processes and led to persistently high terrigenous input, as reflected in the elevated Al content of the Wulalike Formation.

5.3. Volcanic/Hydrothermal Activity

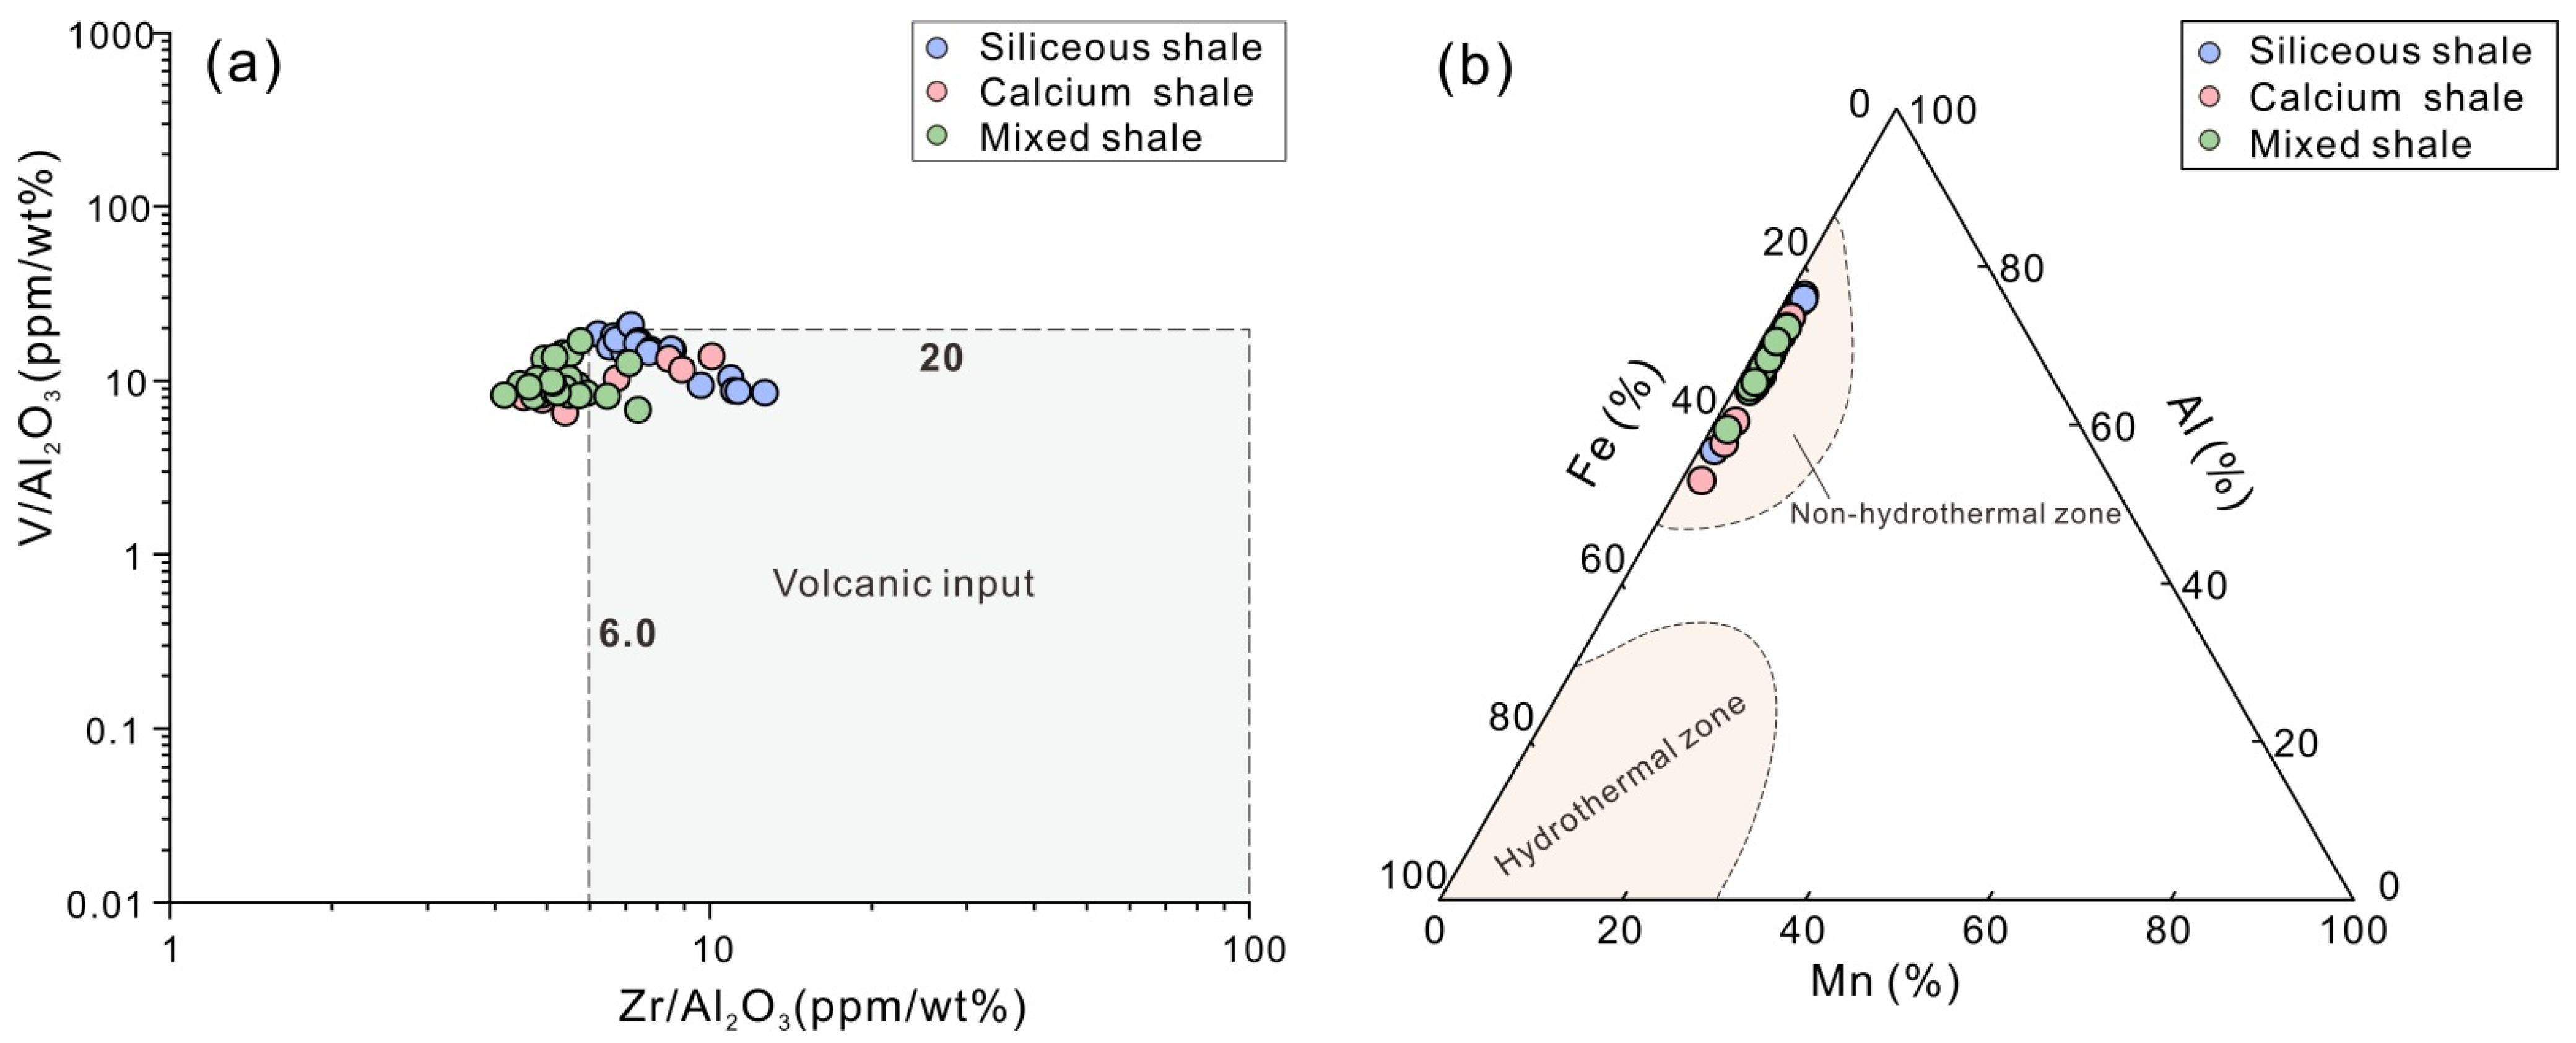
Volcanic activity exerts dual impacts on ecosystems. On the one hand, nutrient inputs and climatic effects associated with greenhouse gas release can stimulate phytoplankton growth and enhance primary productivity [41,42]. On the other hand, intense eruptions may release toxic substances that disrupt terrestrial and marine ecosystems, altering biogeochemical nutrient cycles [43]. During diagenesis, volcanic ash layers commonly undergo silica loss through devitrification and concomitant aluminum enrichment due to clay mineral alteration [44]. Moreover, their typically low organic matter content and high sedimentation rates limit their capacity to scavenge redox-sensitive trace elements (RSTEs) such as V, Ni, and Cr. Given these characteristics, this study applies the geochemical criteria V/Al2O3 < 20 ppm/wt.% and Zr/Al2O3 > 6.0 ppm/wt.% to identify volcanic input [44], a dual-threshold approach that effectively distinguishes volcanic ash layers from background shales.
The volcanic material identified in this study is interpreted to have originated from an active Middle–Late Ordovician volcanic arc within the North Qinling Orogenic Belt, located immediately south of the Ordos Basin and separated from it by the Weihe Graben [45,46]. Thin-section observations of core samples from Well H reveal no volcaniclastic components throughout the stratigraphic succession (Figure 6). In contrast, discrete tuffaceous interbeds, 2–5 cm-thick, occur near the top of the Wulalike Formation at the Zhuozishan section along the northwestern basin margin, representing a distal deep-water facies [47]. This occurrence is noteworthy, as the Zhuozishan section lies farther from the inferred volcanic source than Well H. Geochemical evidence supports this observation. V/Al2O3 ratios in shales from all lithofacies across the basin remain consistently low (<20 ppm/wt.%), indicating negligible regional volcanic input. In contrast, elevated Zr/Al2O3 ratios (>6.0 ppm/wt.%) are restricted to siliceous shales from the Zhuozishan section. This anomaly spatially coincides with the tuffaceous layers, providing clear evidence for localized volcanic ash deposition. Most samples from Well H fall below the established volcanic thresholds, although a few calcareous shale samples may record minor volcanic influence (Figure 9a). Overall, these patterns suggest that volcaniclastic dispersal during the Middle Ordovician was not governed by simple atmospheric fallout, which would decrease systematically with distance from the source. Instead, it was influenced by the basin’s tectono-sedimentary framework, which focused ash transport into specific depocenters [46,47]. Thus, volcanic input to the Wulalike Formation was spatially limited and strongly controlled by paleogeography. Thus, volcanic input to the Wulalike Formation was spatially limited and controlled by paleogeography. This contrasts with the Wufeng Formation, which experienced intense, high-frequency volcanic activity, with most samples exhibiting Zr/Al2O3 > 6.0 ppm/wt.% and Zr/Cr > 10 ppm/wt.%. The Saergan Formation also records significant volcanic input, as documented by Hg/TOC up to 138 ppb/wt.% [3,9].
REE distributions provide a key geochemical proxy for assessing hydrothermal activity [48]. Under high-temperature (>250 °C) and reducing conditions, hydrothermal fluids leach redox-sensitive metals (e.g., Fe and Mn), from mafic to ultramafic rocks in the mantle and deep crust [49,50], promoting the mobilization of europium as divalent Eu2+. Upon cooling or oxidation near vent sites, Eu2+ is oxidized to Eu3+, which has much lower solubility and precipitates rapidly, producing positive Eu anomalies (δEu > 1) in hydrothermal sediments [51]. In contrast, all analyzed samples in this study exhibit δEu values < 1 (Figure 8), indicating minimal hydrothermal influence.
Al–Fe–Mn ternary diagrams are widely used to evaluate the hydrothermal alteration of silicate minerals [52,53,54]. Aluminum (Al) primarily reflects terrigenous clastic input and typically shows stable concentration in normal sedimentary environments, whereas hydrothermal fluids are enriched in Fe and Mn but depleted in Al. Hydrothermal activity thus introduces substantial Fe- and Mn-bearing minerals into sediments, resulting in marked enrichment of Fe and Mn and a relative dilution of Al.
In the Al–Fe–Mn ternary diagram, the three end-members are defined by the oxide contents of Al2O3, Fe2O3 (or FeO), and MnO. Plotting sample compositions on this diagram allows for an effective visual assessment of the relative contributions of detrital versus hydrothermal components, distinguishing normal sedimentary deposition from hydrothermal-influenced systems [55]. In this study, all samples from the Wulalike Formation plot entirely within the non-hydrothermal field of the Al–Fe–Mn diagram (Figure 9b). Together with the consistent absence of positive Eu anomalies, this distribution provides robust evidence that the Wulalike Formation was deposited without significant hydrothermal influence.

5.4. Paleoclimate and Paleoweathering Conditions

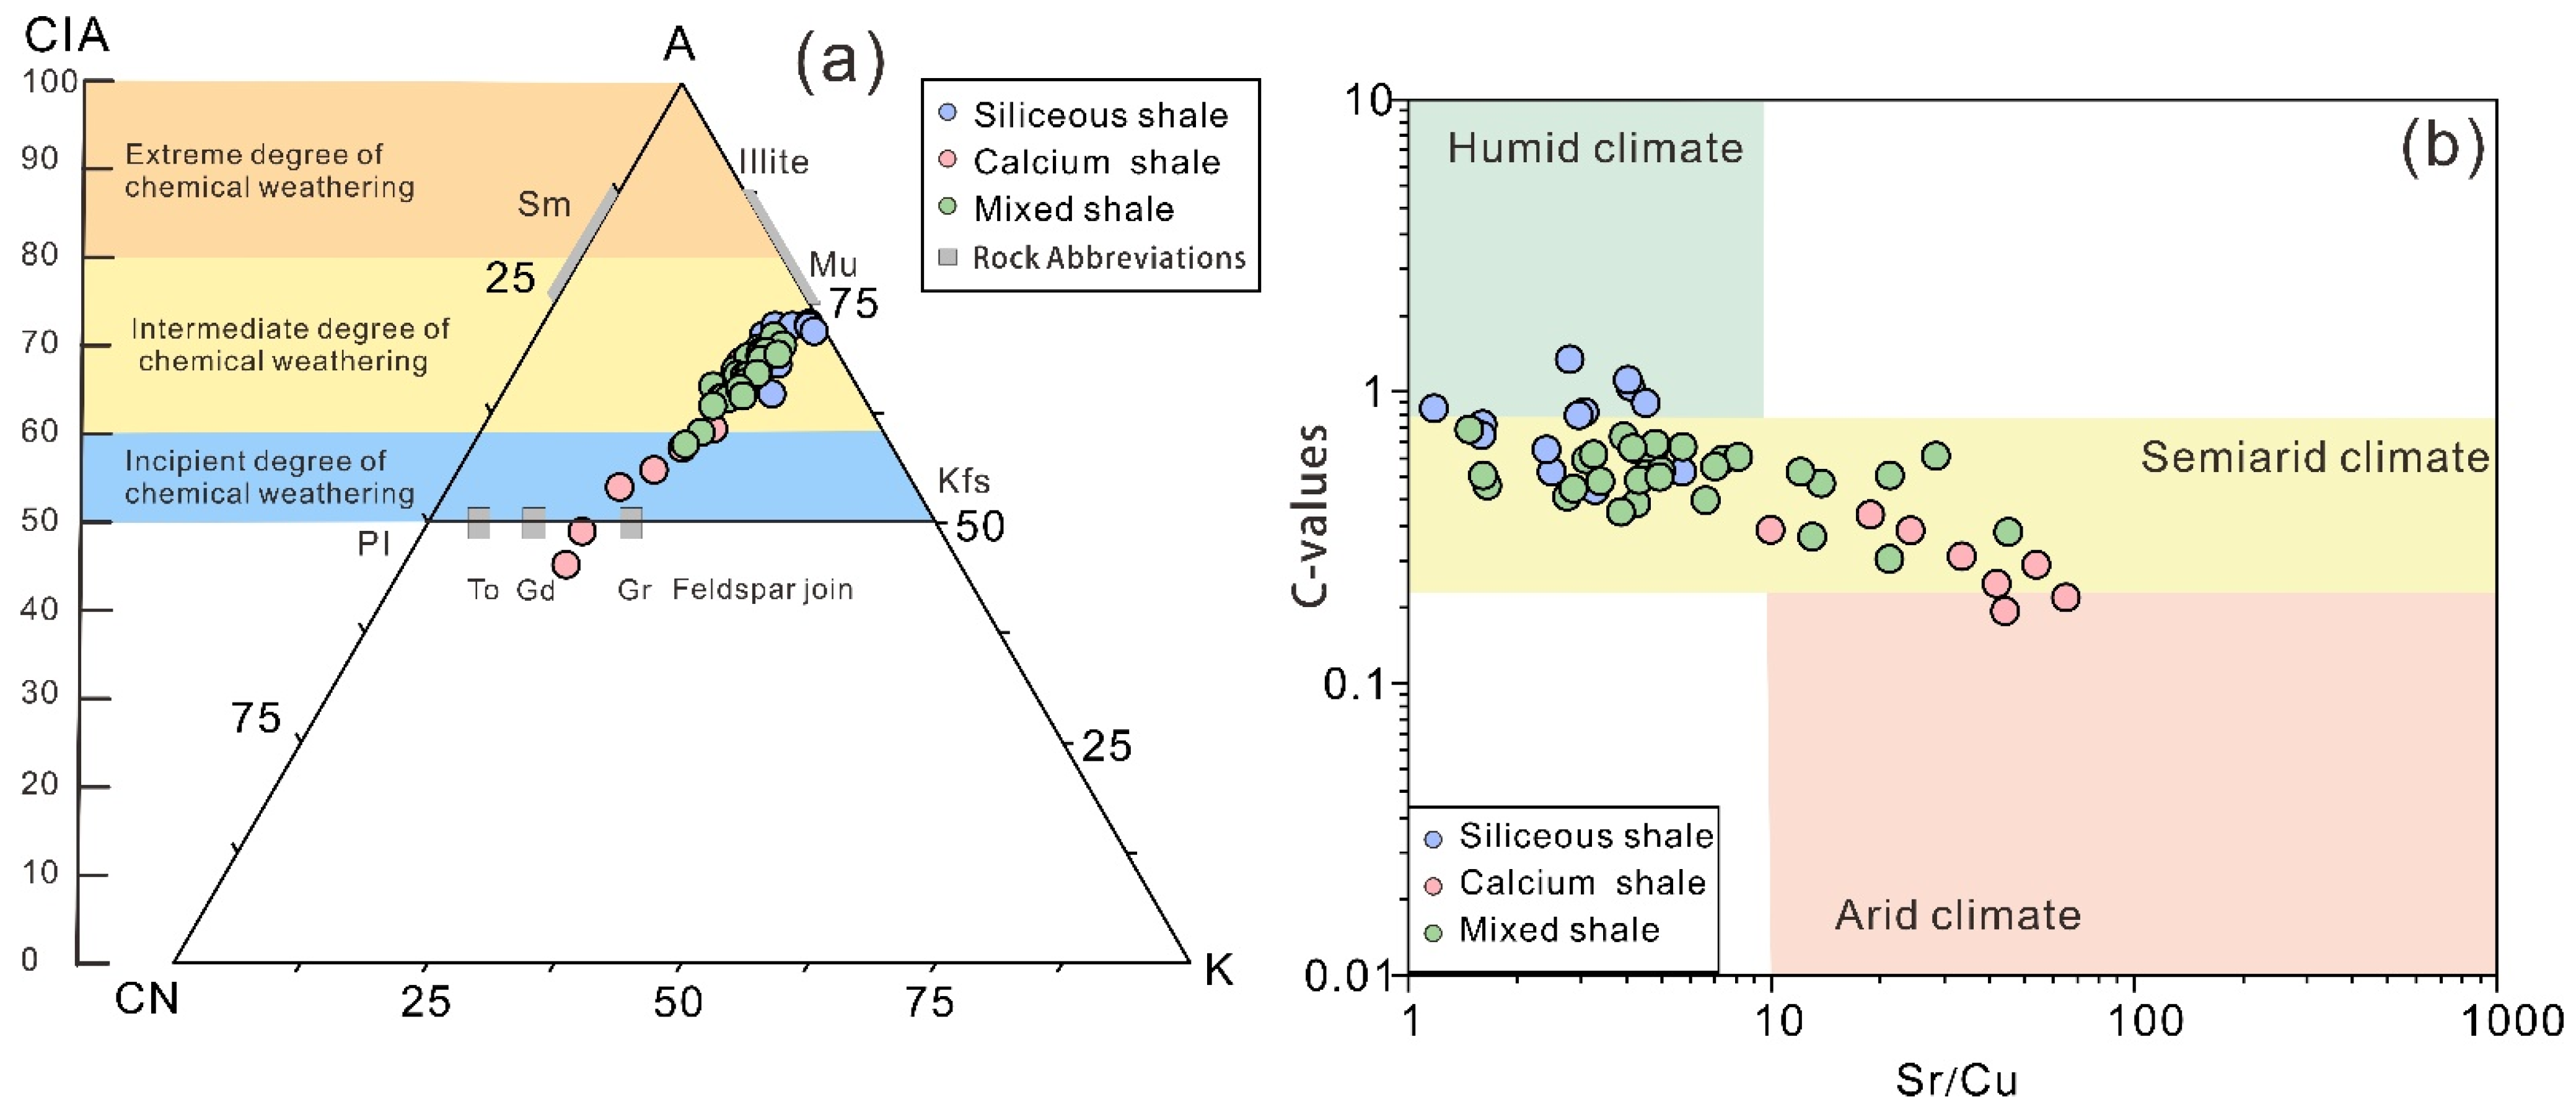
The Chemical Index of Alteration (CIA) is a key indicator of chemical weathering intensity, with higher values generally reflecting stronger weathering [30]. However, during diagenesis of mudstones and shales, the transformation of kaolinite to illite through interaction with K-rich fluids introduces additional K2O, which artificially increases CIA values. Therefore, correction for diagenetic K enrichment is necessary [56]. Climatic conditions exert a strong control on elemental enrichment patterns in shales. Humid environments promote the accumulation of redox-sensitive and immobile elements (e.g., Fe, Mn, Cr, V, Co, Ni), while arid climates favor enrichment of mobile elements (e.g., Na, Mg, K, Ca, Sr, Ba). Based on these contrasting behaviors, the C-value has been established as a robust paleoclimatic proxy [33]. C-values > 0.8 indicate humid paleoclimates, values between 0.2 and 0.8 reflect semihumid to semiarid conditions, and values < 0.2 are characteristic of arid environments [33]. The Sr/Cu ratio is another widely applied paleoclimate indicator. Sr tends to concentrate under arid conditions through evaporation, while Cu is enriched in humid environments due to enhanced weathering and reducing conditions. Sr/Cu ratios > 10 typically indicate arid climates, whereas ratios < 10 suggest humid conditions [57,58].
Using Equations (3) and (8), CIA, C-values, and Sr/Cu ratios, were calculated for shale samples from the Wulalike Formation. CIA values range from 45 to 73 (average 66), C from 0.17 to 1.12 (average 0.51; Figure 8), and Sr/Cu ratios from 0.4 to 53 (average 9.8). Together, these proxies indicate that the Wulalike shales were mainly deposited mainly under semihumid to semiarid paleoclimatic conditions with moderate chemical weathering (Figure 10a,b). This interpretation is consistent with the paleoclimatic and weathering conditions reported for the Wufeng–Longmaxi Formations (mean CIA = 67, C-value = 0.32, and Sr/Cu ratio = 3.81), and with the relatively intense paleoweathering conditions of the Saergan Formation (mean CIA = 68) [3,9].
Clear lithofacies-dependent differences are evident. Siliceous shales show higher CIA and C-values (averages 70 and 0.71, respectively), reflecting relatively humid conditions and stronger chemical weathering. In contrast, calcareous shales display lower CIA and C-values (averages of 57 and 0.26) and higher Sr/Cu ratios, indicating drier depositional environments and weaker weathering intensity. These systematic variations highlight the sensitivity of geochemical proxies to both paleoclimate and source-area weathering intensity across different lithofacies.

5.5. Marine Redox Conditions

Bottom-water redox conditions strongly influence biological communities, sedimentary processes, and the enrichment and preservation of organic matter [59]. Uranium (U) and molybdenum (Mo) are highly redox-sensitive trace elements and are widely used as proxies for reconstructing paleoredox conditions during shale deposition. Under anoxic to euxinic conditions, both elements are efficiently scavenged from seawater and become strongly enriched in sediments [60]. The degree of enrichment is commonly quantified using uranium and molybdenum enrichment factors (UEF and MoEF) [59,60,61]. The degree of seawater restriction (i.e., basin connectivity to the open ocean) exerts a strong control on trace-element enrichment in sediments [62]. Under anoxic conditions, the strong association between authigenic Mo and organic matter leads to a close correlation between Mo and TOC. Combined with Mo’s low crustal abundance and long residence time in seawater, the Mo/TOC ratio serves as a robust proxy for assessing basin restriction [63].
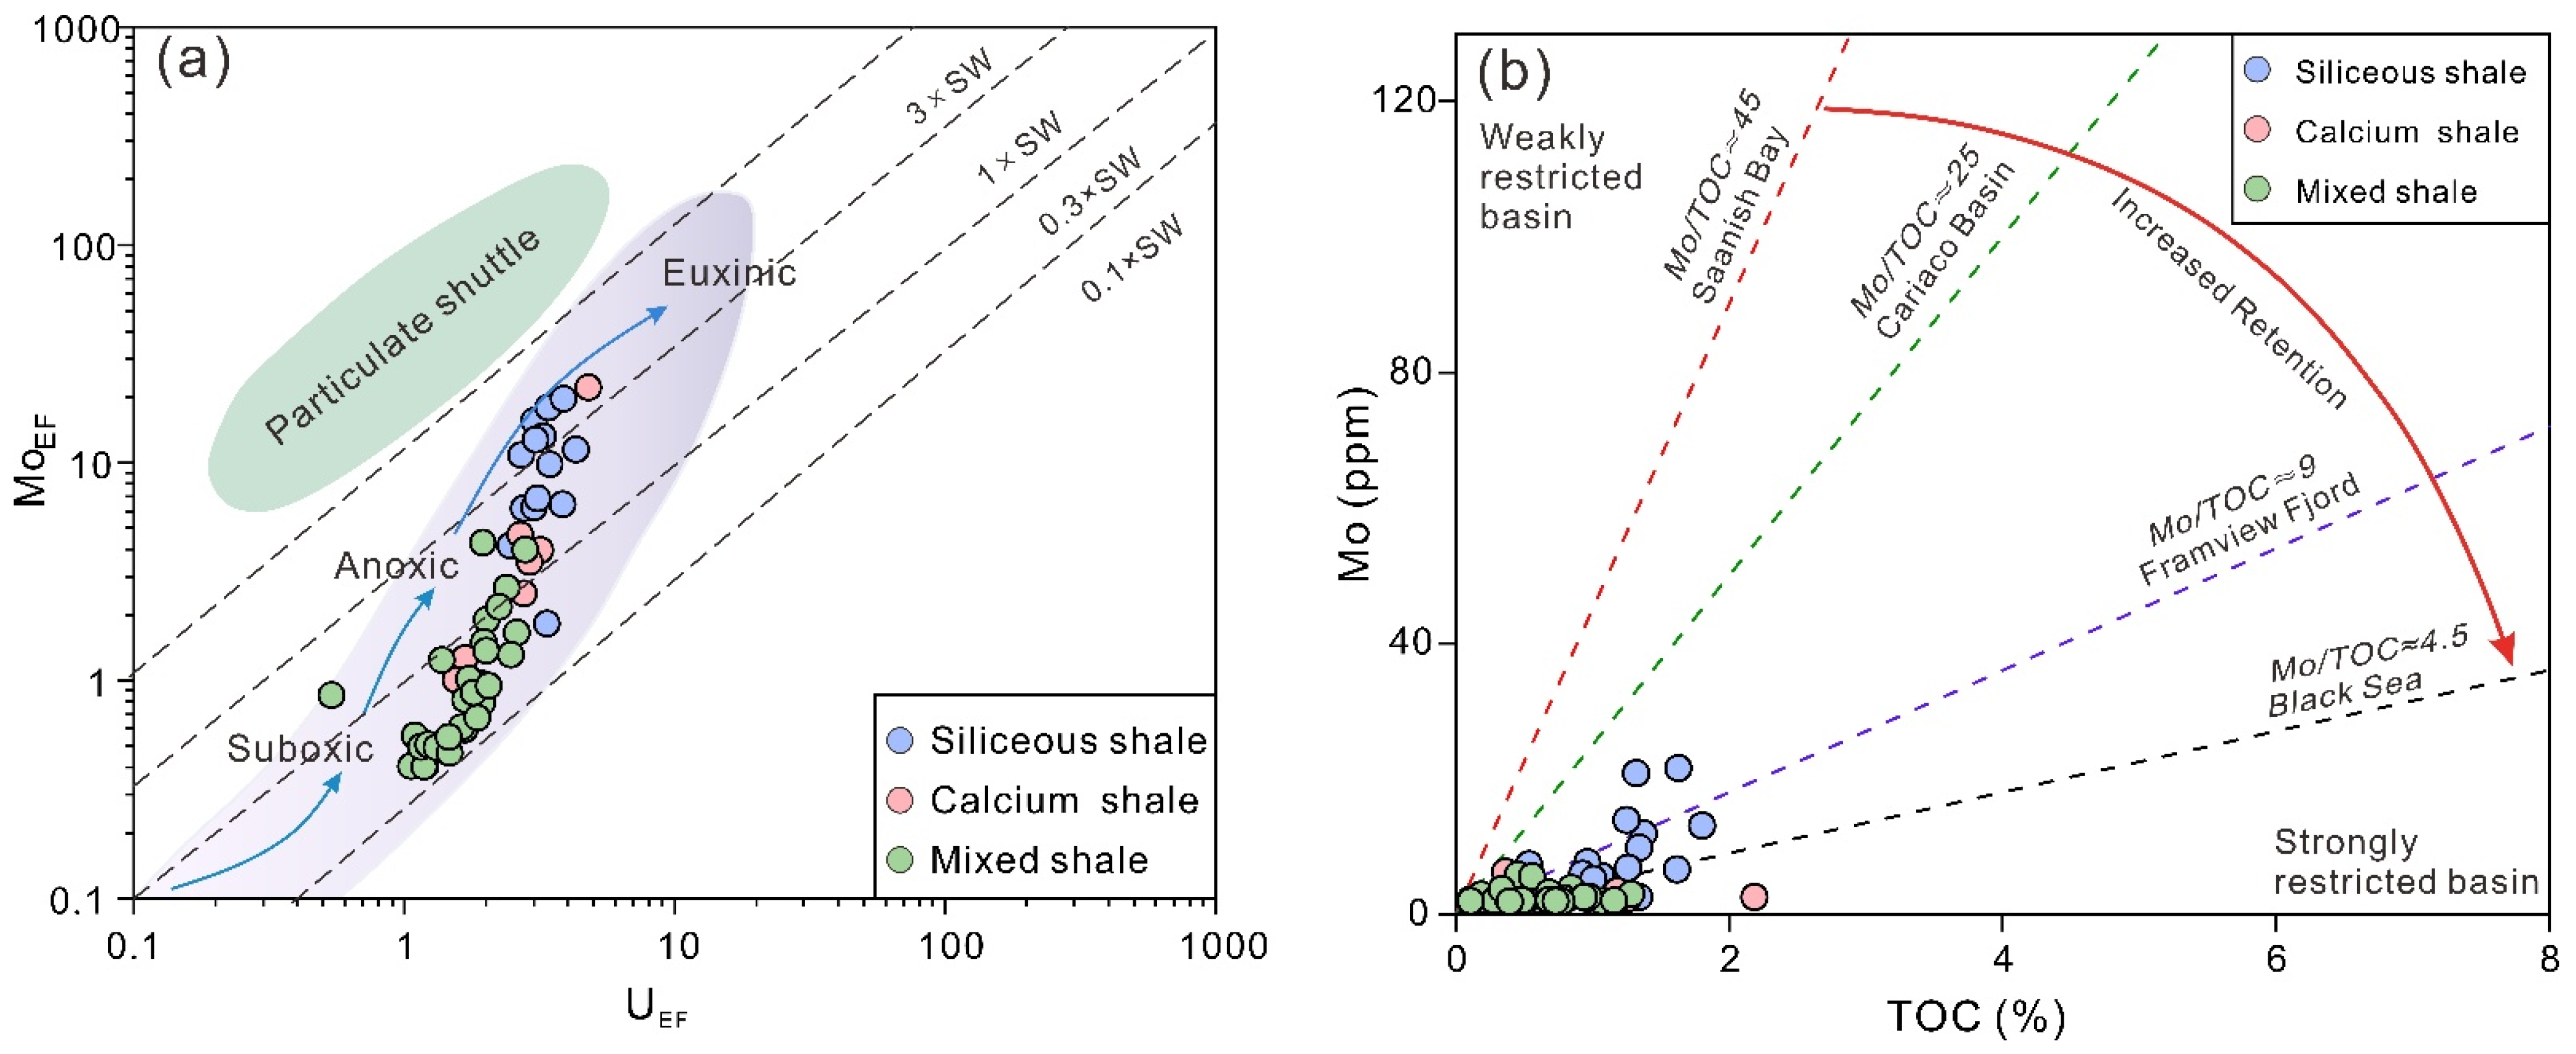
For shale samples from Well H, UEF and MoEF values are 2.26 and 4.10, respectively. On the U–Mo enrichment factor diagram (Figure 11a), most samples plot within the transitional field, indicating deposition under persistently reducing bottom-water conditions. Lateral variations in redox conditions are reflected by changes in TOC, with the highest TOC values associated with more highly reducing conditions (Figure 11).
Clear redox differences are observed among lithofacies (Figure 11a). Siliceous shales display modest UEF and MoEF values, with Mo/U ratios typically ranging from 1 to 3 times that of modern seawater (Mo/U = 7.5. Figure 11). Additionally, siliceous shales show elevated Mo/TOC values (0.6–10.7, average 5.01. Figure 11b), indicative of anoxic to euxinic bottom-water conditions and deposition under moderately to highly restricted marine settings. These redox conditions are similar to those of the Wufeng Formation, where UEF values range from 4.96 to 189 ppm, MoEF values range from 2.11 to 30 ppm, and MoEF/UEF ratios range from 1 to 3 × SW [9,40].
In contrast, calcareous and mixed shales show lower Mo/U ratios, approximately 0.3–1 times the modern seawater value, and relatively low Mo/TOC ratios (0.3–10.24, average 2.07). These values are analogous to those observed in the Longmaxi Formation and the Saergan Formation shales [9], suggesting that most samples were deposited under suboxic to anoxic conditions within a strongly restricted depositional setting [3,64]. This observation supports the interpretation that the Wulalike Formation was deposited in a regionally restricted marine setting, which played a key role in controlling on bottom water redox conditions and facilitated and the preservation of organic matter.

5.6. Paleoproductivity

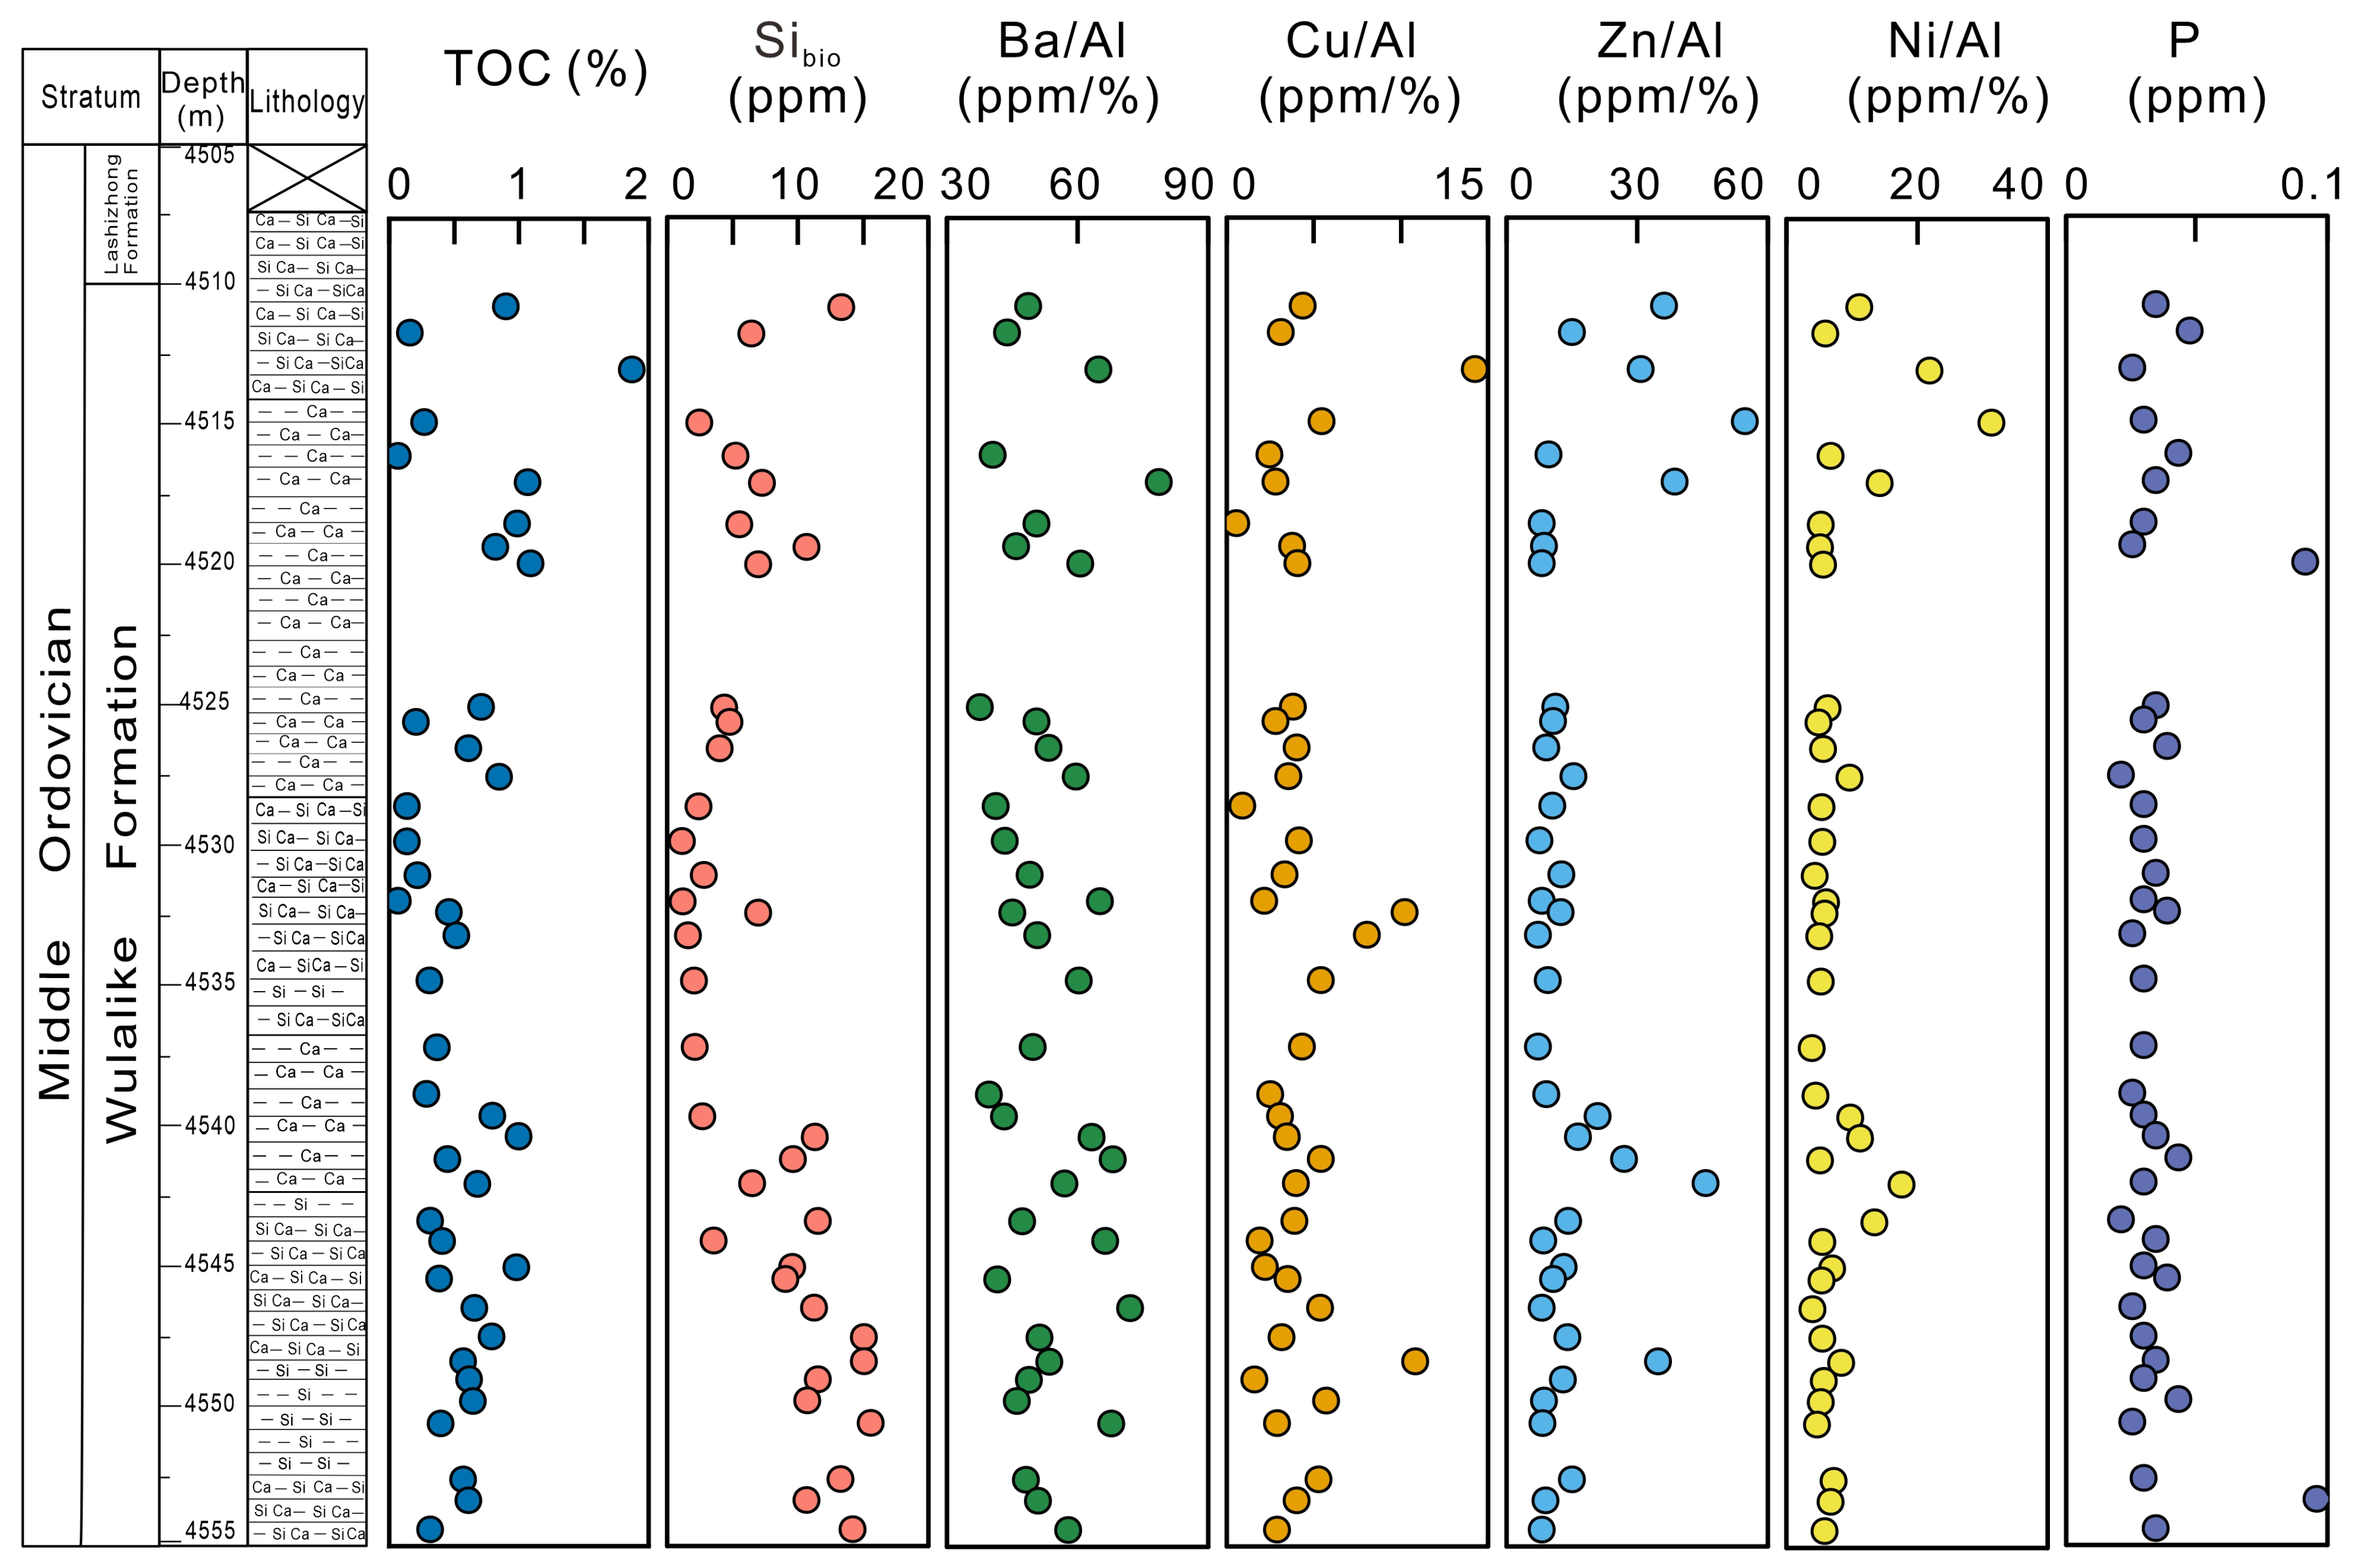
Biogenic silica, derived from the siliceous tests of phytoplankton, and biogenic barium (Ba) are widely recognized as proxies for reconstructing paleoproductivity [65]. At the same time, productivity-sensitive trace elements (Cu, Zn, Ni, P) show divergent responses to redox variations [66,67]. After correction for terrigenous input using aluminum normalization, none of productivity-sensitive trace elements (Cu, Zn, Ni, P) in the Wulalike shales exhibit a statistically significant correlation with TOC (Figure 12). This lack of correlation may reflect the fact that under anoxic conditions, P can dissolve into seawater from organic matter in a reductive environment [66], while Cu and Ni tend to be preferentially retained or enriched [67]. Consequently, the variations in Cu/Al, Zn/Al, Ni/Al, and P content are more likely controlled by changes in redox conditions than by primary productivity itself. Accordingly, excess silica (Sixs) and biogenic Ba are adopted as the primary paleoproductivity proxies in this study. Both are sensitive to changes in surface ocean productivity and are relatively resistant to alteration during burial and early diagenesis, making them reliable indicators of past biological export fluxes [68,69].
Siliceous minerals are generally classified into biogenic, hydrothermal, and terrigenous clastic types [53]. As discussed in Section 5.2, the deposition of the Wulalike shales were not accompanied with significant volcanic or hydrothermal activity. Therefore, its siliceous mineral assemblage is dominated by biogenic and terrigenous clastic components. Excess silica (Sixs) was calculated following the method of Holdaway and Clayton [34] by subtracting the terrigenous detrital silica contribution from the total silica content; in this study, Sixs is considered equivalent to biogenic silica. The calculated results indicate that the Wulalike Formation shales contain an average biogenic silica content of 7.52% (Figure 12), significantly lower than those of the Lower Silurian Longmaxi Formation black shales in the Sichuan Basin (average 45.51%) [70]. This pronounced contrast suggests that paleoproductivity during deposition of the Wulalike shales was relatively low.
Barium (Ba) concentrations in marine sediments are commonly correlated with primary productivity, as Ba is largely mainly precipitated in the water column as barite (BaSO4) [71,72,73,74]. However, Ba abundance can be significantly affected by terrigenous input. To correct for this effect, Ba is typically normalized to aluminum (Al)—a proxy for clastic supply—using the Ba/Al ratio; higher values indicate enhanced paleoproductivity [72,73,75]. For example, shales of the Longmaxi Formation in the Sichuan Basin exhibit high Ba/Al ratios (average 173), widely interpreted as evidence of elevated paleoproductivity [76]. In contrast, the Wulalike Formation shales analyzed in this study show substantially lower Ba/Al ratios, ranging from 37 to 72 (average 51.5) (Figure 12), indicating relatively low paleoproductivity. This interpretation is consistent with independent estimates based on biogenic silica content, supporting a coherent picture of limited biological productivity during deposition of the Wulalike Formation.
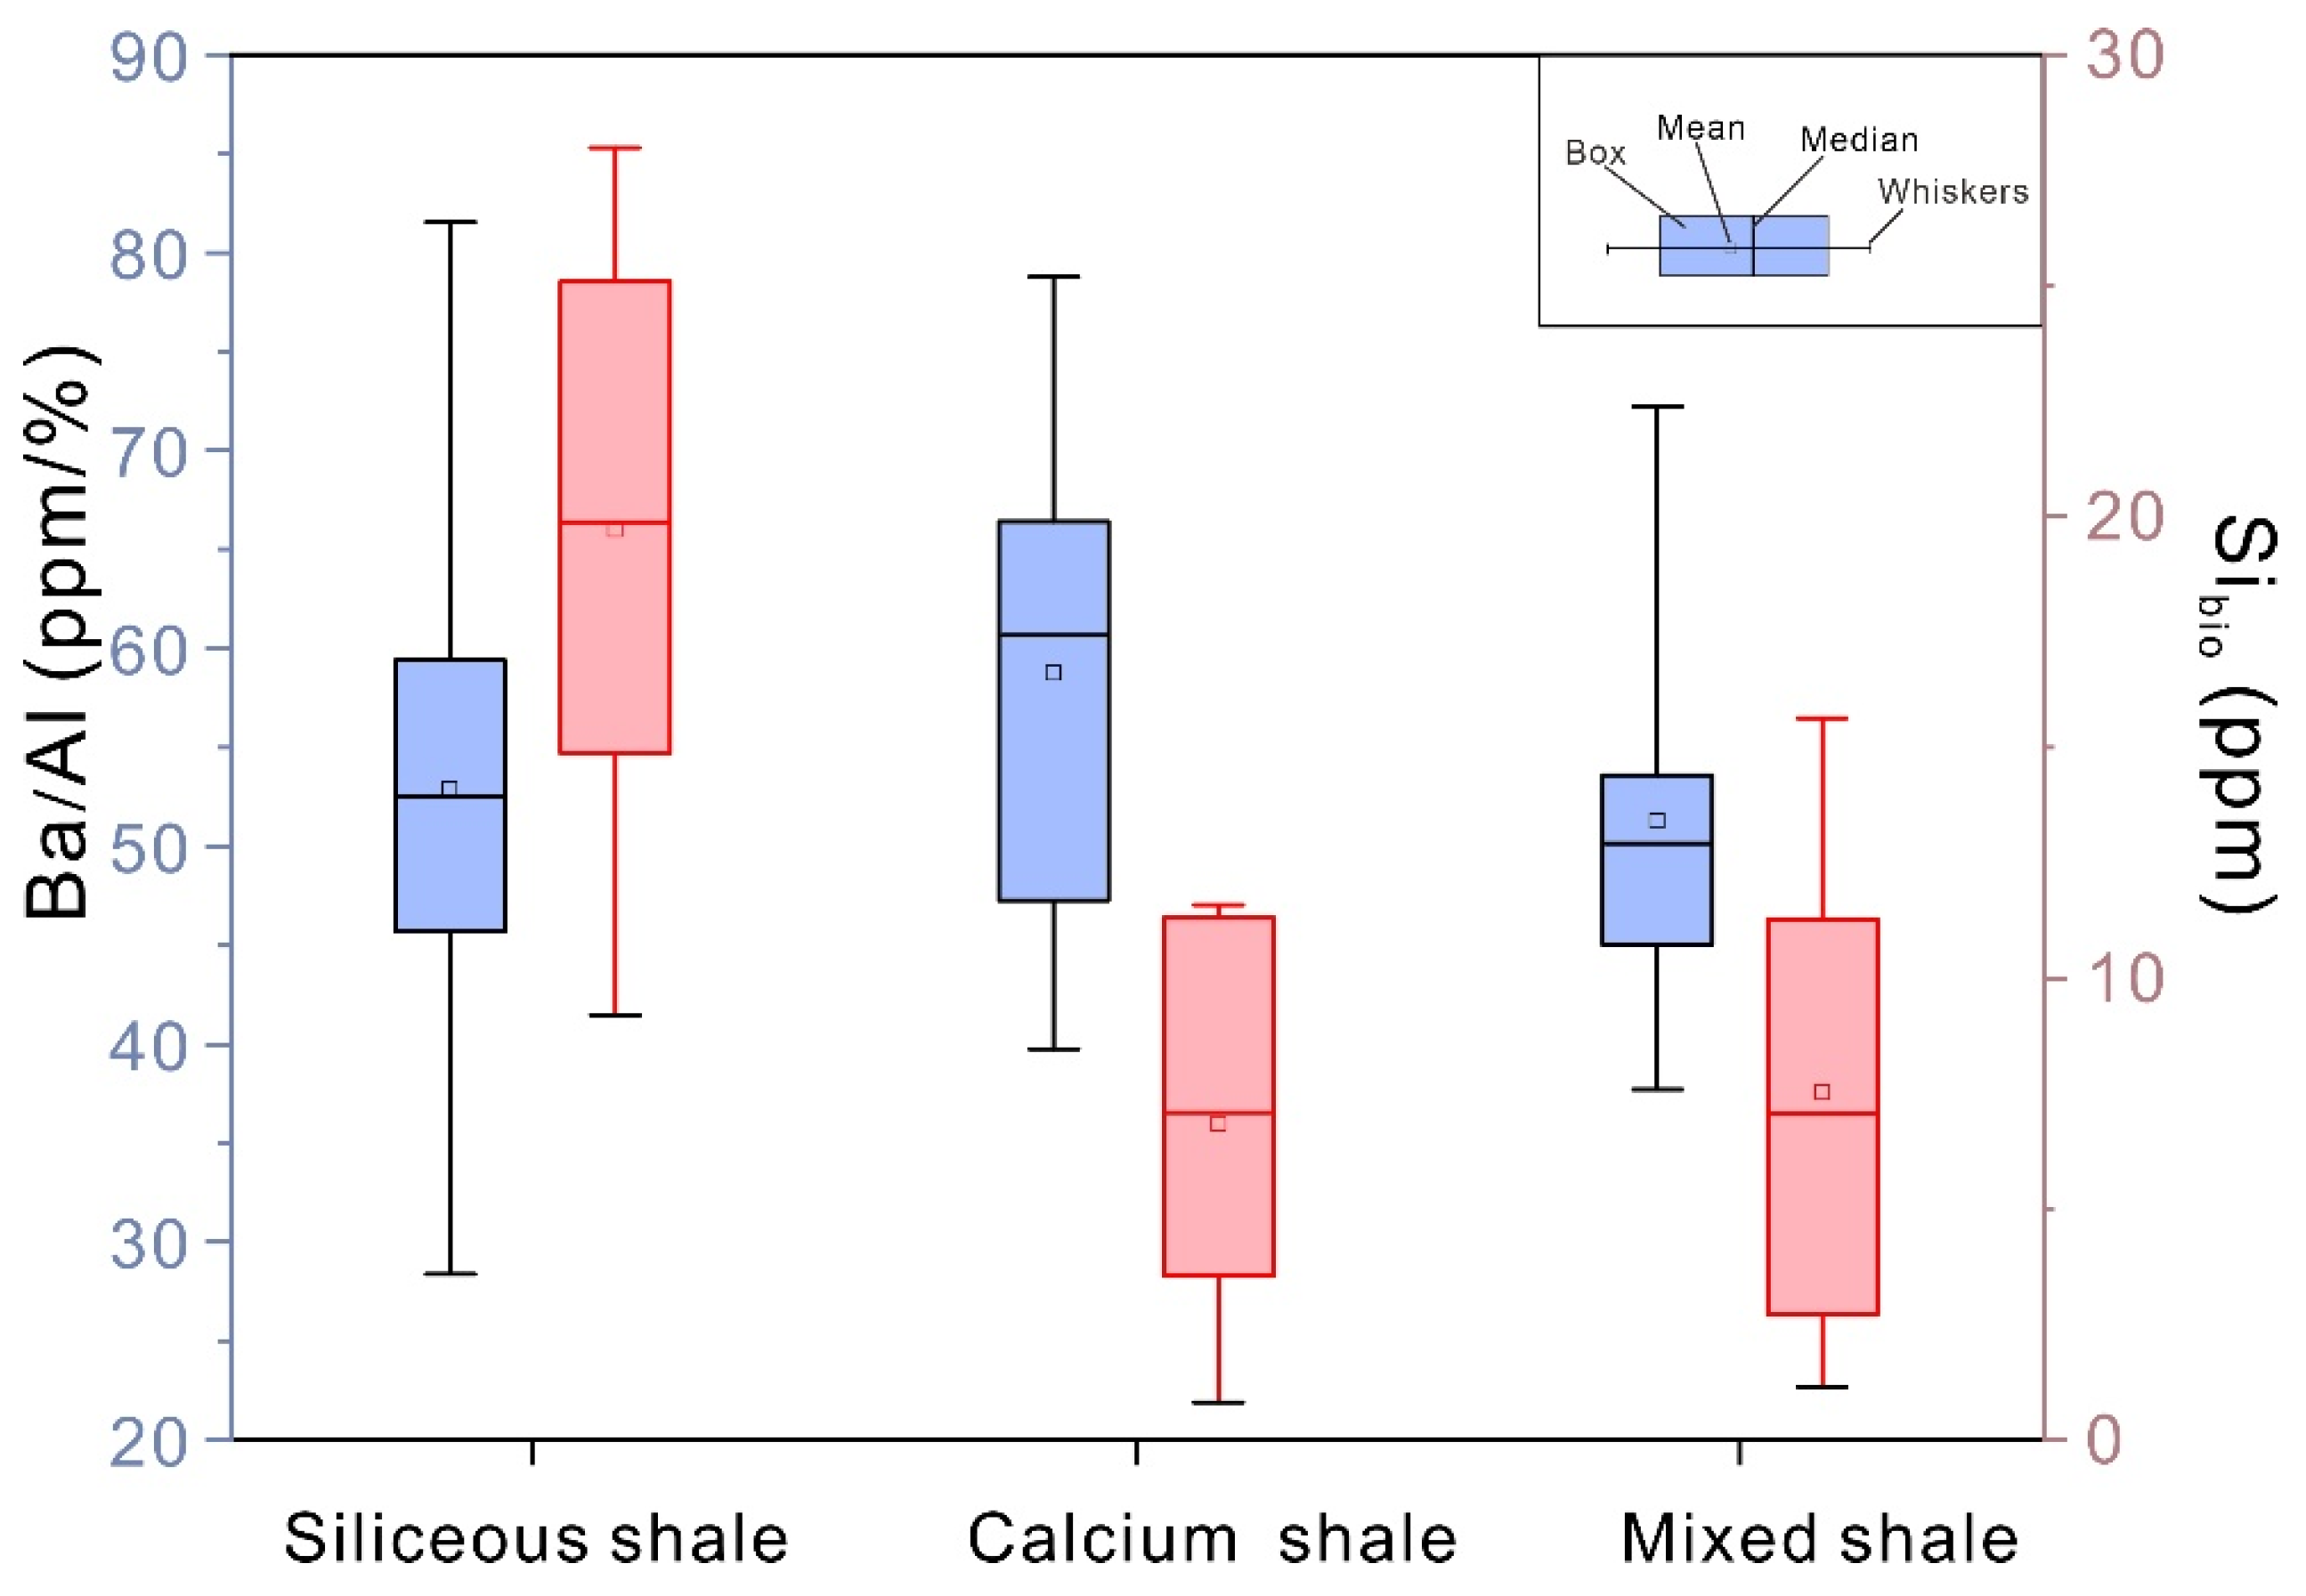
Integration with lithofacies analysis (Figure 13) reveals distinct paleoproductivity patterns among the three shale types. Siliceous shales display the highest biogenic silica contents and Ba/Al ratios, reflecting relatively elevated productivity and significant contributions from siliceous organisms. Mixed shales exhibit the lowest values for both proxies, consistent with strong dilution by terrigenous input (Figure 7), while calcareous shales show intermediate values. Overall, these observations indicate that the Wulalike Formation was deposited under a generally low-paleoproductivity regime.

5.7. Controls on Differential Enrichment of Organic Matter in the Wulalike Formation

Organic matter enrichment in the Wulalike Formation is influenced by multiple external factors, including primary productivity, terrigenous supply, marine redox conditions, and volcanic or hydrothermal activity [14,15,16]. Integrating the geochemical proxies and sedimentary environmental indicators discussed above, this study identifies clear differences in organic matter enrichment among shale lithofacies of the Wulalike Formation.
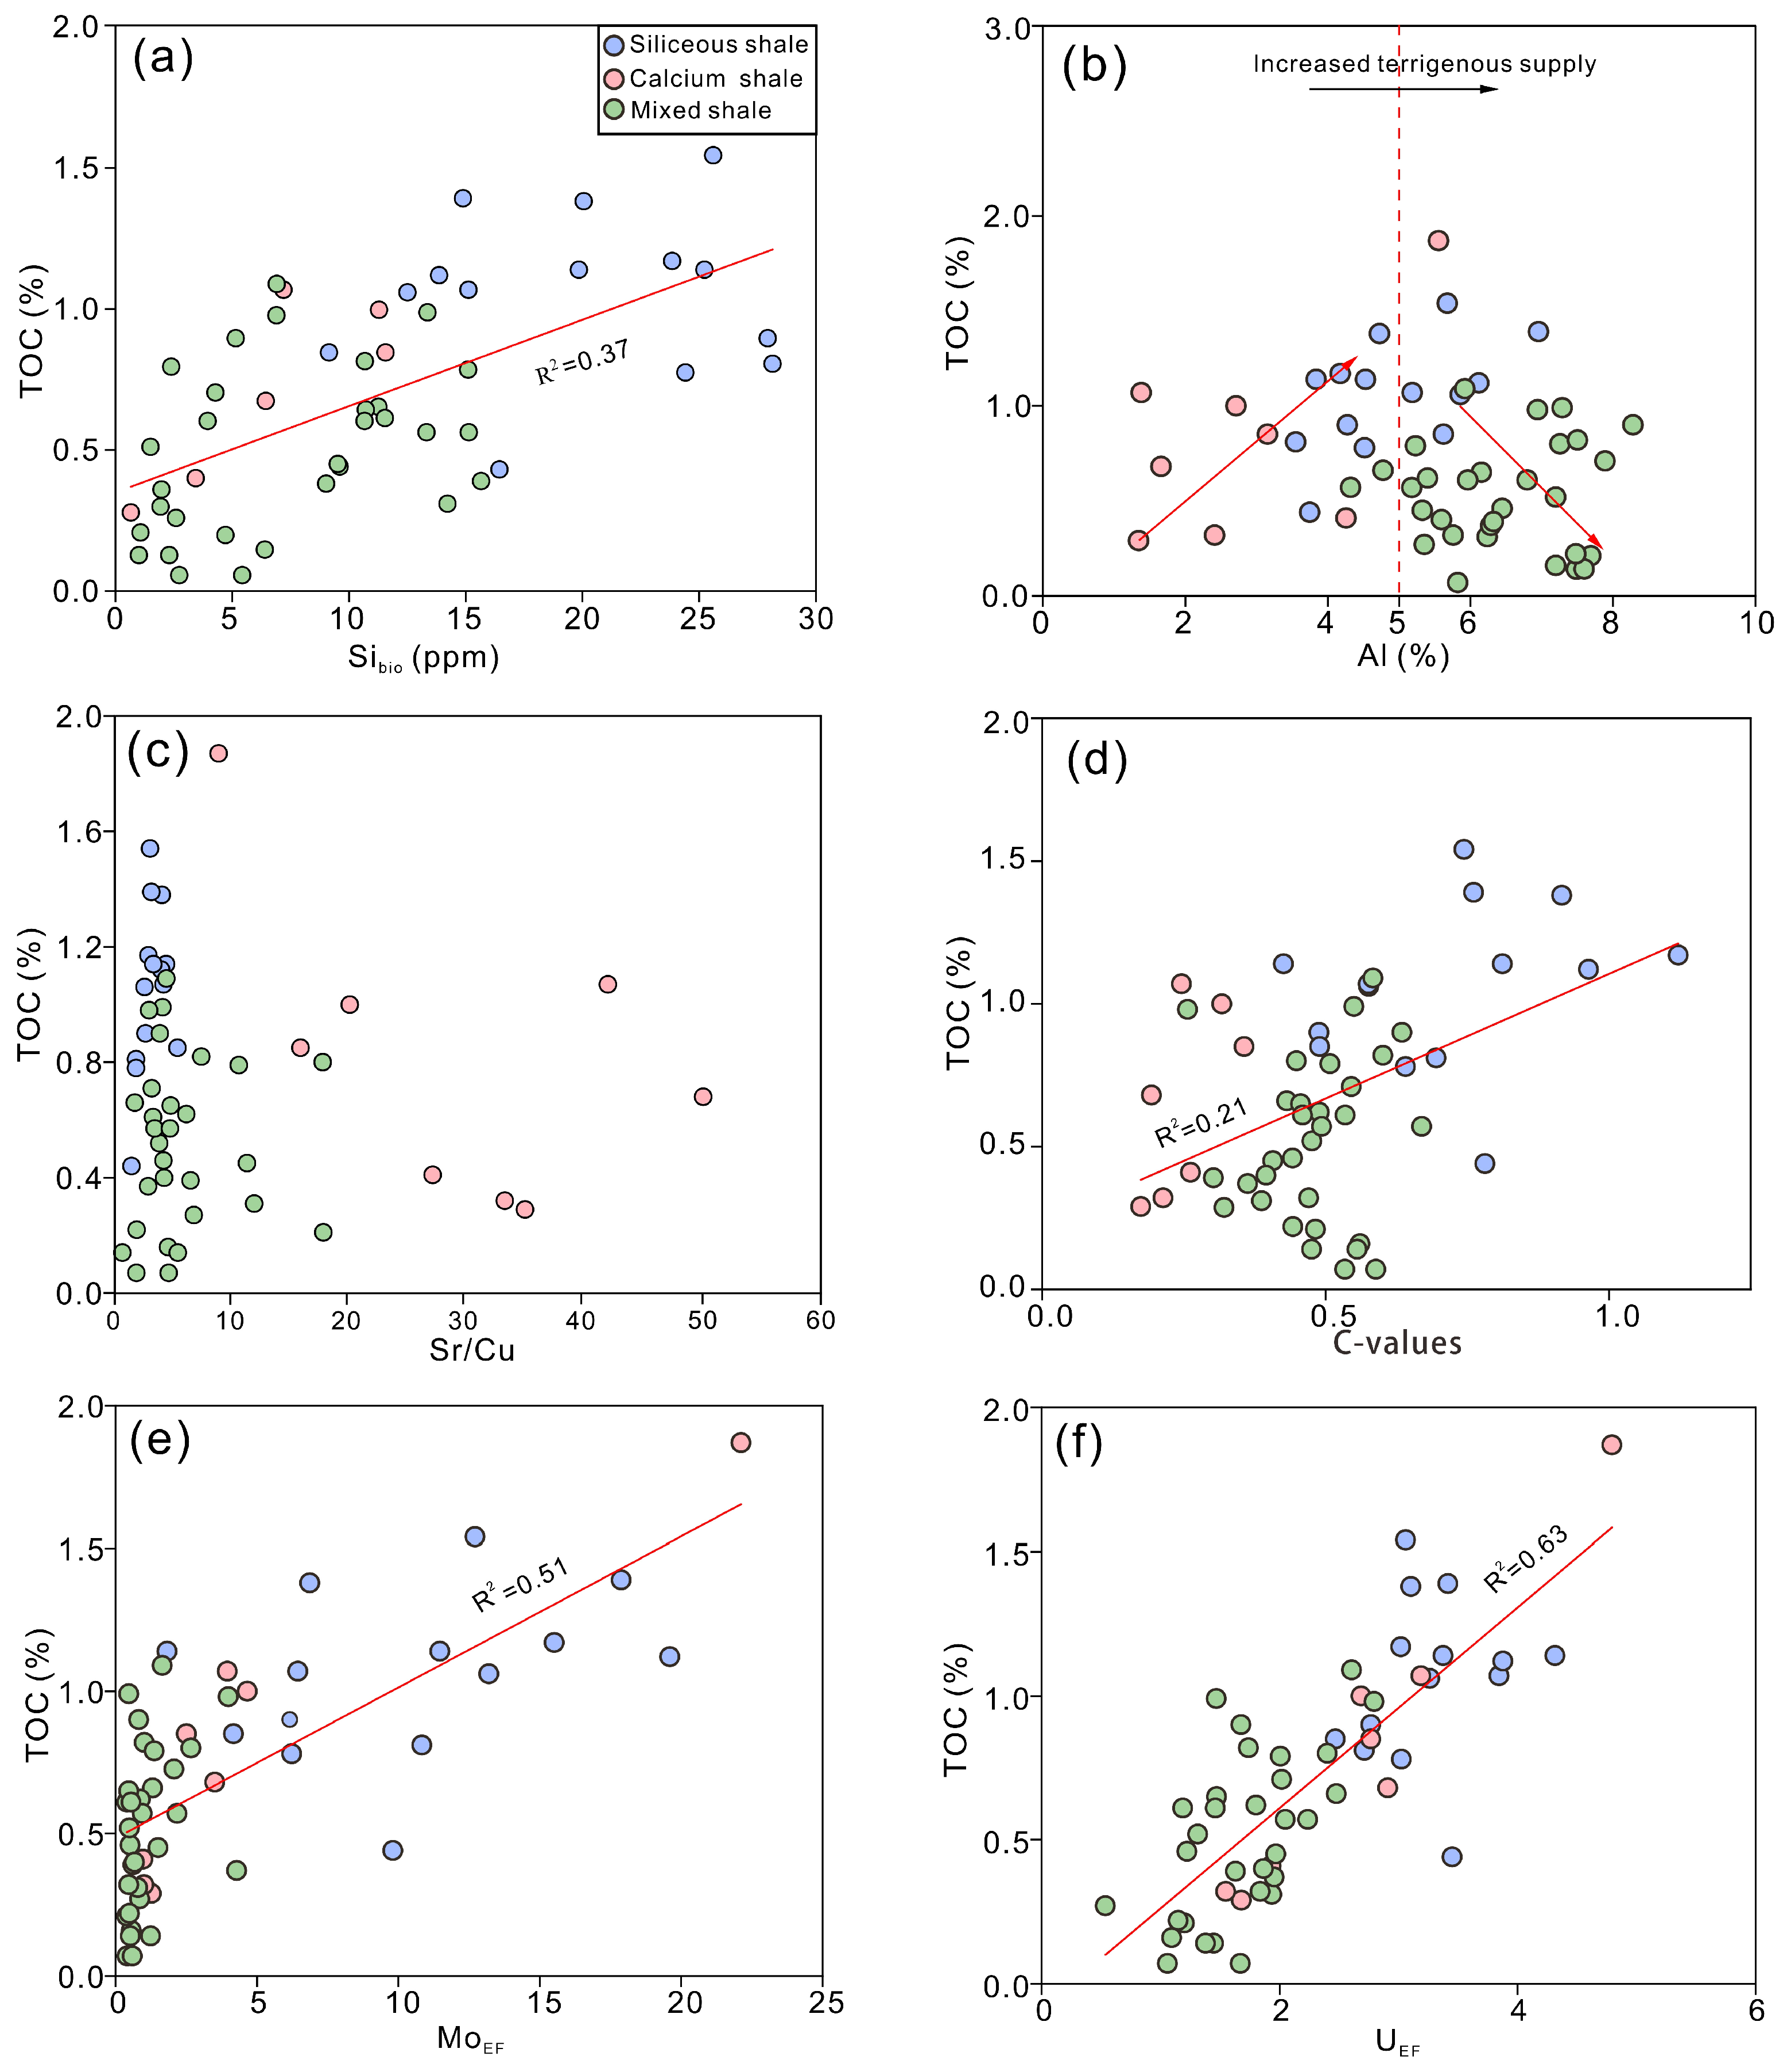
Paleoproductivity is a key factor in the enrichment of organic matter in shale [15]. However, this relationship is complex in the Wulalike Formation. Biogenic silica shows only a weak to moderate positive correlation with TOC (R2 = 0.37. Figure 14a). Consistent with the generally low TOC values across the study area, overall paleoproductivity was low, suggesting a limited contribution to organic matter enrichment. This persistently low productivity is likely attributable to limited nutrient input, implying that the low organic matter enrichment was predominantly constrained by insufficient primary productivity. The Wulalike shales in this study were deposited far from volcanic eruption zones, with no evident volcanic influence recognized. Coupled with limited terrigenous nutrient input, these factors collectively appear to have constrained surface water paleoproductivity and ultimately contributed to the relatively low TOC compared to the Wufeng–Longmaxi and Saergan shales.
Terrestrial debris input plays a significant role in organic matter enrichment. Terrigenous supply exerted a dual influence: moderate input can enhance organic matter enrichment and preservation via mineral adsorption and nutrient supply for enhanced biological productivity. However, excessive input increased water turbidity, and nutrient dilution may have suppressed productivity and organic matter preservation, as suggested by the reduced TOC values (Figure 14b). This finding is consistent with previous studies on the effects of terrigenous detrital input on organic matter enrichment in the Wufeng–Longmaxi Formation [39].
Evaluation of paleoclimatic proxies further indicates suggests limited climatic control on organic enrichment. While the Sr/Cu ratio shows no clear correlation with TOC (Figure 14c), and the C-value exhibits a weak positive correlation with TOC (R2 = 0.21. Figure 14d), these proxies indicate that the Wulalike shales were mainly deposited under semihumid to semiarid paleoclimatic conditions with moderate chemical weathering (Figure 10a,b). Hence, paleoclimatic conditions appear to have played a secondary role in influencing organic matter enrichment in the Wulalike Formation.
Both UEF and MoEF in the Wulalike Formation show statistically positive correlations with TOC (R2 = 0.51 and 0.63, respectively; see Figure 14e,f). These correlations suggest that reducing bottom-water conditions may have played a crucial role in enhancing organic matter preservation by limiting early diagenetic oxidation and microbial degradation. Given the overall low TOC background, the strength of these correlations is particularly notable, indicating that even modest improvements in preservation conditions could facilitate relative organic matter accumulation. Collectively, these observations suggest that marine redox conditions were a primary factor influencing organic matter enrichment in the Wulalike Formation.
Synthesizing the above analyses, organic matter enrichment in the Wulalike Formation shales reflects the combined effects of multiple factors: paleoproductivity, terrigenous input, paleoclimate, and redox conditions. In terms of terrigenous input, organic matter accumulation was limited. Paleoproductivity was modest, primarily due to distal volcanic activity and restricted terrigenous nutrient supply. This was accompanied by moderate terrigenous detrital input, together providing a modest foundation for organic matter deposition. Regarding preservation, the study area is located in a depression zone along the western margin of the Ordos Basin during the Middle–Late Ordovician, adjacent to the western side of the Central Paleo-uplift. This setting corresponded to a residual marginal-sea deep-water slope environment, which favored the development of anoxic to sulfidic bottom waters. This redox condition is supported by significant positive correlations among UEF, MoEF, and TOC. Additionally, the warm and humid paleoclimate may have further promoted organic matter preservation.

6. Conclusions

Based on mineralogical composition, the shales of the Wulalike Formation are divided into three lithofacies associations: siliceous, calcareous, and mixed shales lithofacies. These show distinct differences in total organic carbon (TOC) content. The siliceous facies has the highest organic matter content, with an average TOC of 1.05%. Paleoenvironmental reconstruction using elemental geochemistry suggests that the siliceous shales were deposited under warm and humid climatic conditions. They reflect relatively high paleoproductivity, low terrigenous input, and anoxic to euxinic bottom-water conditions.
Compared to typical high-productivity marine shales, the Wulalike Formation exhibits overall lower TOC values, which is likely attributable to its deposition distal from volcanic zones within a highly restricted, stagnant water environment with limited nutrient supply. Despite the relatively low organic matter content, it may still meet the criteria for shale gas exploration in the northwestern Ordos Basin.
Analysis of organic matter enrichment across different lithofacies in the Wulalike Formation reveals that, within this low TOC background, enrichment patterns is primarily associated with favorable redox conditions and paleoclimate, with terrigenous detrital input playing a dual regulatory role, while the influence of paleoproductivity appears relatively limited. It should be noted that this study has certain limitations, including a relatively small number of drilling wells in the study area and the lack of further investigation into the southwestern margin of the basin. Future work will involve systematic research on paleoenvironmental reconstruction and organic matter enrichment mechanisms on a comprehensive, basin-wide scale to advance our understanding of hydrocarbon source rock development patterns in this formation.

Author Contributions

Conceptualization, X.Q. and Y.Y.; methodology, X.Q., Y.Y. and K.L.; software, X.Q. and J.Z.; validation, Y.Y. and X.Q.; formal analysis, X.Q. and K.L.; investigation, X.Q.; resources, Y.Y. and J.Z.; data curation, X.Q.; writing—original draft preparation, X.Q.; writing—review and editing, Y.Y. K.L. and J.Z.; visualization, X.Q. and K.L.; supervision, Y.Y., J.Z. and K.L.; project administration, J.Z.; funding acquisition, J.Z. All authors have read and agreed to the published version of the manuscript.

Funding

This research was funded by Digital Basin Construction and Hydrocarbon Resource Evaluation of the Ordos Basin, grant number D25074 and the APC was funded by China University of Petroleum (Beijing).

Data Availability Statement

All data and materials are available on request from the corresponding author. The data are not publicly available due to ongoing studies using a part of the data.

Conflicts of Interest

Author Kang Liu was employed by the company China National Petroleum Corporation. The remaining authors declare that the research was conducted in the absence of any commercial or financial relationships that could be construed as a potential conflict of interest.

References

  1. Guo, X.; Wang, R.; Shen, B.; Wang, G.; Wang, C.; Wang, Q. Geological Characteristics, Resource Potential, and Development Direction of Shale Gas in China. Pet. Explor. Dev. 2025, 52, 17–32. [Google Scholar] [CrossRef]
  2. Cao, H.; Wang, Z.; Dong, L.; Xiao, Y.; Hu, L.; Chen, F.; Wu, L. Influence of Hydrothermal and Upwelling Events on Organic Matter Accumulation in the Gas-Bearing Lower Cambrian Shales of the Middle Yangtze Block, South China. Mar. Pet. Geol. 2023, 155, 106373. [Google Scholar] [CrossRef]
  3. Liu, M.; Chen, D.; Zhou, X.; Yuan, W.; Jiang, M.; Liu, L. Climatic and Oceanic Changes during the Middle–Late Ordovician Transition in the Tarim Basin, NW China and Implications for the Great Ordovician Biodiversification Event. Palaeogeogr. Palaeoclimatol. Palaeoecol. 2019, 514, 522–535. [Google Scholar] [CrossRef]
  4. Huang, J.; Zhang, C.; Tan, K.; Huang, Z.; Shi, J.; Zhang, Y.; Li, X.; Guo, W.; Feng, M.; Wang, J. Formation Conditions and Exploration Potential for Marine Shale Gas from the Ordovician Wulalike Formation in the Western Ordos Basin. Acta Sedimentol. Sin. 2024, 43, 1163–1177. (In Chinese) [Google Scholar] [CrossRef]
  5. Fu, S.; Fu, J.; Xi, S.; Huang, Z. Geological Characteristics of Ordovician Marine Shale Gas in the Ordos Basin and Its Prospects. China Pet. Explor. 2021, 26, 33–44. (In Chinese) [Google Scholar] [CrossRef]
  6. Tribovillard, N.; Algeo, T.J.; Lyons, T.; Riboulleau, A. Trace Metals as Paleoredox and Paleoproductivity Proxies: An Update. Chem. Geol. 2006, 232, 12–32. [Google Scholar] [CrossRef]
  7. Algeo, T.J.; Tribovillard, N. Environmental Analysis of Paleoceanographic Systems Based on Molybdenum–Uranium Covariation. Chem. Geol. 2009, 268, 211–225. [Google Scholar] [CrossRef]
  8. Algeo, T.J.; Maynard, J.B. Trace-Element Behavior and Redox Facies in Core Shales of Upper Pennsylvanian Kansas-Type Cyclothems. Chem. Geol. 2004, 206, 289–318. [Google Scholar] [CrossRef]
  9. Makeen, Y.M.; Hakimi, M.H.; Abdullah, W.H. The origin, type and preservation of organic matter of the Barremian–Aptian organic-rich shales in the Muglad Basin, Southern Sudan, and their relation to paleoenvironmental and paleoclimate conditions. Mar. Pet. Geol. 2015, 65, 187–197. [Google Scholar] [CrossRef]
  10. Sajid, Z.; Ismail, M.S.; Zakariah, M.N.A.; Tsegab, H.; Gámez Vintaned, J.A.; Hanif, T.; Ahmed, N. Impact of paleosalinity, paleoredox, paleoproductivity/preservation on the organic matter enrichment in black shales from Triassic turbidites of Semanggol Basin, Peninsular Malaysia. Minerals 2020, 10, 915. [Google Scholar] [CrossRef]
  11. Ross, D.J.; Bustin, R.M. Investigating the use of sedimentary geochemical proxies for paleoenvironment interpretation of thermally mature organic-rich strata: Examples from the Devonian–Mississippian shales, Western Canadian Sedimentary Basin. Chem. Geol. 2009, 260, 198–208. [Google Scholar] [CrossRef]
  12. Wang, E.; Guo, T.; Li, M.; Xiong, L.; Dong, X.; Zhang, N.; Wang, T. Depositional Environment Variation and Organic Matter Accumulation Mechanism of Marine–Continental Transitional Shale in the Upper Permian Longtan Formation, Sichuan Basin, SW China. ACS Earth Space Chem. 2022, 6, 2199–2214. [Google Scholar] [CrossRef]
  13. Gallego-Torres, D.; Martínez-Ruiz, F.; Paytan, A.; Jiménez-Espejo, F.J.; Ortega-Huertas, M. Pliocene–Holocene Evolution of Depositional Conditions in the Eastern Mediterranean: Role of Anoxia vs. Productivity at Time of Sapropel Deposition. Palaeogeogr. Palaeoclimatol. Palaeoecol. 2007, 246, 424–439. [Google Scholar] [CrossRef]
  14. Werne, J.P.; Sageman, B.B.; Lyons, T.W.; Hollander, D.J. An Integrated Assessment of a “Type Euxinic” Deposit: Evidence for Multiple Controls on Black Shale Deposition in the Middle Devonian Oatka Creek Formation. Am. J. Sci. 2002, 302, 110–143. [Google Scholar] [CrossRef]
  15. Rimmer, S.M.; Thompson, J.A.; Goodnight, S.A.; Robl, T.L. Multiple Controls on the Preservation of Organic Matter in Devonian–Mississippian Marine Black Shales: Geochemical and Petrographic Evidence. Palaeogeogr. Palaeoclimatol. Palaeoecol. 2004, 215, 125–154. [Google Scholar] [CrossRef]
  16. Lash, G.G.; Blood, D.R. Organic Matter Accumulation, Redox, and Diagenetic History of the Marcellus Formation, Southwestern Pennsylvania, Appalachian Basin. Mar. Pet. Geol. 2014, 57, 244–263. [Google Scholar] [CrossRef]
  17. Yu, Z.; Zhou, J.; Li, C.; Song, X.; Luo, C.; Wu, X.; Wu, D.; Hu, C. Tectonic-Lithofacies Paleogeographic Characteristics of Ordovician Kelimoli and Wulalike Stages in the Western Edge of Ordos Basin. Nat. Gas Geosci. 2021, 32, 816–825. (In Chinese) [Google Scholar] [CrossRef]
  18. Zhang, F.; Li, Y.; Luo, J.; Ren, X.; Zhang, L.; Zhang, J. Microscopic Pore Structure Characteristics of Shale of Ordovician Wulalike Formation in Western Ordos Basin. Lithol. Reserv. 2022, 34, 50–62. (In Chinese) [Google Scholar] [CrossRef]
  19. Zhang, Y.; Guo, Y.; Hou, W.; Zhao, Z.; Gao, J. Geochemical Characteristics and Exploration Potential of the Middle-Upper Ordovician Source Rocks on the Western and Southern Margin of Ordos Basin. Nat. Gas Geosci. 2013, 24, 894–904. (In Chinese) [Google Scholar]
  20. Sun, H.; Gao, J.; Fu, L.; Bai, Y.; Zhang, T.; Chen, Z.; Yuan, L.; Liu, B. Restoration of Ordovician Paleoenvironment and Analysis of Sedimentary System in the Western Margin of Ordos Basin. J. Northeast Pet. Univ. 2023, 47, 44–69. (In Chinese) [Google Scholar]
  21. Zhang, Y. Study on Quartz Origins, Organic Matter Enrichment Mechanism and Shale Gas Formation Process of Marine Shale in the Ordovician Wulalike Formation, Northern Ordos Basin, China. Master’s Thesis, Chang’an University, Xi’an, China, 2024. (In Chinese) [Google Scholar]
  22. Zhang, B.; Zhang, J.; Zhao, H.; Nie, F.; Wang, Y.; Zhang, Y. Tectonic Evolution of the Western Ordos Basin during the Palaeozoic-Mesozoic Time as Constrained by Detrital Zircon Ages. Int. Geol. Rev. 2019, 61, 461–480. [Google Scholar] [CrossRef]
  23. Zhu, S.; Liu, L.; Wang, L.; Wang, Z.; Hu, J.; Zhang, J.; Chen, H. Provenance Signature and Tectono–Sedimentary Setting of the Permian Shihezi Formation (Ordos Basin, China): Insights from Geochemistry and Detrital Zircon U–Pb Dating. Mar. Pet. Geol. 2024, 165, 106901. [Google Scholar] [CrossRef]
  24. Sun, J.; Dong, Y. Foreland Basin Development in Response to Proto-Tethyan Ocean Closure, Western North China Block. Geosphere 2024, 20, 799–824. [Google Scholar] [CrossRef]
  25. Liu, S. The Coupling Mechanism of Basin and Orogen in the Western Ordos Basin and Adjacent Regions of China. J. Asian Earth Sci. 1998, 16, 369–383. [Google Scholar] [CrossRef]
  26. Pape, H.; Clauser, C.; Iffland, J. Permeability Prediction Based on Fractal Pore-Space Geometry. Geophysics 1999, 64, 1447–1460. [Google Scholar] [CrossRef]
  27. GB/T 14506.30-2010; Methods for Chemical Analysis of Silicate Rocks—Part 30: Determination of 44 Elements. National Technical Committee for Standardization of Land and Resources: Beijing, China, 2010.
  28. Taylor, S.R.; McLennan, S.M. The Continental Crust: Its Composition and Evolution. J. Geol. 1985, 94, 57–72. [Google Scholar] [CrossRef]
  29. Dauphas, N.; Pourmand, A. Thulium anomalies and rare earth element patterns in meteorites and Earth: Nebular fractionation and the nugget effect. Geochim. Cosmochim. Act. 2015, 163, 234–261. [Google Scholar] [CrossRef]
  30. Deng, T.; Li, Y.; Wang, Z.; Yu, Q.; Dong, S.; Yan, L.; Hu, W.; Chen, B. Geochemical Characteristics and Organic Matter Enrichment Mechanism of Black Shale in the Upper Triassic Xujiahe Formation in the Sichuan Basin: Implications for Paleoweathering, Provenance and Tectonic Setting. Mar. Pet. Geol. 2019, 109, 698–716. [Google Scholar] [CrossRef]
  31. Nesbitt, H.W.; Young, G.M. Early Proterozoic Climates and Plate Motions Inferred from Major Element Chemistry of Lutites. Nature 1982, 299, 715–717. [Google Scholar] [CrossRef]
  32. Panahi, A.; Young, G.M.; Rainbird, R.H. Behavior of Major and Trace Elements (Including REE) during Paleoproterozoic Petrogenesis and Diagenetic Alteration of an Archean Granite near Ville Marie, Québec, Canada. Geochim. Cosmochim. Acta 2000, 64, 2199–2220. [Google Scholar] [CrossRef]
  33. Cao, J.; Wu, M.; Chen, Y.; Hu, K.; Bian, L.; Wang, L.; Zhang, Y. Trace and Rare Earth Element Geochemistry of Jurassic Mudstones in the Northern Qaidam Basin, Northwest China. Geochemistry 2012, 72, 245–252. [Google Scholar] [CrossRef]
  34. Holdaway, H.; Clayton, C. Preservation of Shell Microstructure in Silicified Brachiopods from the Upper Cretaceous Wilmington Sands of Devon. Geol. Mag. 1982, 119, 371–382. [Google Scholar] [CrossRef]
  35. Jiang, Z.; Duan, H.; Liang, C.; Wu, J.; Zhang, W.; Zhang, J. Classification of Hydrocarbon-Bearing Fine-Grained Sedimentary Rocks. J. Earth Sci. 2017, 28, 693–796. [Google Scholar] [CrossRef]
  36. Jarvie, D.M.; Hill, R.J.; Ruble, T.E.; Pollastro, R.M. Unconventional Shale-Gas Systems: The Mississippian Barnett Shale of North-Central Texas as One Model for Thermogenic Shale-Gas Assessment. AAPG Bull. 2007, 91, 475–499. [Google Scholar] [CrossRef]
  37. Loucks, R.G.; Reed, R.M.; Ruppel, S.C.; Jarvie, D.M. Morphology, Genesis, and Distribution of Nanometer-Scale Pores in Siliceous Mudstones of the Mississippian Barnett Shale. J. Sediment. Res. 2009, 79, 848–861. [Google Scholar] [CrossRef]
  38. Yarincik, K.M.; Murray, R.W.; Peterson, L.C. Climatically Sensitive Eolian and Hemipelagic Deposition in the Cariaco Basin, Venezuela, over the Past 578,000 Years: Results from Al/Ti and K/Al. Paleoceanography 2000, 15, 210–228. [Google Scholar] [CrossRef]
  39. Wang, Q.; Feng, Y.; Gao, P.; Meng, G.; Lu, C.; Fan, Q.; Xiao, X. Influence of the Sedimentary Environment of the Wufeng–Longmaxi Shale on Organic Matter Accumulation in the Dingshan Area, Sichuan Basin. Front. Earth Sci. 2024, 12, 1457377. [Google Scholar] [CrossRef]
  40. Bergmann, K.D.; Macdonald, F.A.; Swanson-Hysell, N.L. The causes and consequences of Ordovician cooling. Annu. Rev. Earth Planet. Sci. 2025, 53, 651–685. [Google Scholar] [CrossRef]
  41. Smith, M.E.; Carroll, A.R.; Singer, B.S. Synoptic Reconstruction of a Major Ancient Lake System: Eocene Green River Formation, Western United States. Geol. Soc. Am. Bull. 2008, 120, 54–84. [Google Scholar] [CrossRef]
  42. Shen, J.; Algeo, T.J.; Zhou, L.; Feng, Q.; Yu, J.; Ellwood, B. Volcanic Perturbations of the Marine Environment in South China Preceding the Latest Permian Mass Extinction and Their Biotic Effects. Geobiology 2011, 10, 82–103. [Google Scholar] [CrossRef]
  43. Grasby, S.E.; Shen, W.; Yin, R.; Gleason, J.D.; Blum, J.D.; Lepak, R.F.; Hurley, J.P.; Beauchamp, B. Isotopic Signatures of Mercury Contamination in Latest Permian Oceans. Geology 2017, 45, 55–58. [Google Scholar] [CrossRef]
  44. Yang, S.; Hu, W.; Fan, J.; Deng, Y. New Geochemical Identification Fingerprints of Volcanism during the Ordovician-Silurian Transition and Its Implications for Biological and Environmental Evolution. Earth-Sci. Rev. 2022, 228, 104016. [Google Scholar] [CrossRef]
  45. Wu, H.; Su, Z.; Pei, W.; Wei, L.; Ren, J.; Zhang, C.; Fu, S. Zircon SHRIMP U-Pb Ages and Hf Isotope Characteristics of the Zircons from Tuff in Ordovician Majiagou Formation in the Central–Eastern Ordos Basin and Their Geological Significance. Geol. Rev. 2024, 70, 1767–1787. (In Chinese) [Google Scholar] [CrossRef]
  46. Wang, J.; Zhao, H.; Lei, L.; Cao, H.; Wang, J.; Wang, S.; Wei, L.; Li, J. The Zircon U-Pb Geochronology and Geochemical Characteristics of the Ordovician Tuff in the Ordos Basin and Their Geological Significances. Bull. Mineral. Petrol. Geochem. 2023, 42, 1359–1371. (In Chinese) [Google Scholar] [CrossRef]
  47. Wu, S.; Zhang, Y.; Xing, E. Zircon U-Pb Ages and Hf Isotope Characteristics and Their Geological Significance of Tuff in Wulalike Formation in the Northwestern Ordos Basin. Geol. Rev. 2017, 63, 1309–1327. (In Chinese) [Google Scholar] [CrossRef]
  48. Bau, M.; Möller, P. Rare Earth Element Systematics of the Chemically Precipitated Component in Early Precambrian Iron Formations and the Evolution of the Terrestrial Atmosphere-Hydrosphere-Lithosphere System. Geochim. Cosmochim. Acta 1993, 57, 2239–2249. [Google Scholar] [CrossRef]
  49. German, C.R.; Von Damm, K.L. Hydrothermal Processes. In Treatise on Geochemistry; Holland, H.D., Turekian, K.K., Eds.; Elsevier: Oxford, UK, 2006; Volume 6, pp. 181–222. [Google Scholar] [CrossRef]
  50. Bau, M. Rare-Earth Element Mobility during Hydrothermal and Metamorphic Fluid-Rock Interaction and the Significance of the Oxidation State of Europium. Chem. Geol. 1991, 93, 219–230. [Google Scholar] [CrossRef]
  51. Douville, E.; Bienvenu, P.; Charlou, J.L. Yttrium and Rare Earth Elements in Fluids from Various Deep-Sea Hydrothermal Systems. Geochim. Cosmochim. Acta 1999, 63, 627–643. [Google Scholar] [CrossRef]
  52. Yamamoto, K. Geochemical Characteristics and Depositional Environments of Cherts and Associated Rocks in the Franciscan and Shimanto Terranes. Sediment. Geol. 1987, 52, 65–108. [Google Scholar] [CrossRef]
  53. Choi, J.H.; Hariya, Y. Geochemistry and Depositional Environment of Mn Oxide Deposits in the Tokoro Belt, Northeastern Hokkaido, Japan. Econ. Geol. 1992, 87, 1265–1274. [Google Scholar] [CrossRef]
  54. Adachi, M.; Yamamoto, K.; Sugisaki, R. Hydrothermal Chert and Associated Siliceous Rocks from the Northern Pacific: Their Geological Significance as Indication of Ocean Ridge Activity. Sediment. Geol. 1986, 47, 125–148. [Google Scholar] [CrossRef]
  55. Evans, G.N.; Ji, S.; Kaçar, B.; Anbar, A.D.; Seyfried, W.E., Jr. Transition Metals in Alkaline Lost City Vent Fluids Are Sufficient for Early-Life Metabolisms. Geochim. Cosmochim. Acta 2024, 385, 61–73. [Google Scholar] [CrossRef]
  56. Fedo, C.M.; Nesbitt, H.W.; Young, G.M. Unravelling the Effects of Potassium Metasomatism in Sedimentary Rocks and Paleosols, with Implications for Paleoweathering Conditions and Provenance. Geology 1995, 23, 921–924. [Google Scholar] [CrossRef]
  57. Moradi, A.V.; Sarı, A.; Akkaya, P. Geochemistry of the Miocene Oil Shale (Hançili Formation) in the Çankırı-Çorum Basin, Central Turkey: Implications for Paleoclimate Conditions, Source–Area Weathering, Provenance and Tectonic Setting. Sediment. Geol. 2016, 341, 289–303. [Google Scholar] [CrossRef]
  58. Imboden, D.M.; Lerman, A. Chemical Models of Lakes. In Lakes: Chemistry, Geology, Physics; Lerman, A., Ed.; Springer: New York, NY, USA, 1978; pp. 341–356. [Google Scholar] [CrossRef]
  59. Jones, B.; Manning, D.A.C. Comparison of Geochemical Indices Used for the Interpretation of Palaeoredox Conditions in Ancient Mudstones. Chem. Geol. 1994, 111, 111–129. [Google Scholar] [CrossRef]
  60. Tribovillard, N.; Algeo, T.J.; Baudin, F.; Riboulleau, A. Analysis of Marine Environmental Conditions Based on Molybdenum–Uranium Covariation—Applications to Mesozoic Paleoceanography. Chem. Geol. 2012, 324–325, 46–58. [Google Scholar] [CrossRef]
  61. Algeo, T.J.; Liu, J. A Re-Assessment of Elemental Proxies for Paleoredox Analysis. Chem. Geol. 2020, 540, 119549. [Google Scholar] [CrossRef]
  62. Algeo, T.J.; Lyons, T.W. Mo–Total Organic Carbon Covariation in Modern Anoxic Marine Environments: Implications for Analysis of Paleoredox and Paleohydrographic Conditions. Paleoceanography 2006, 21, PA4010. [Google Scholar] [CrossRef]
  63. Algeo, T.J.; Rowe, H. Paleoceanographic Applications of Trace-Metal Concentration Data. Chem. Geol. 2012, 324–325, 6–18. [Google Scholar] [CrossRef]
  64. Zhu, B.; Guo, T.; Liu, C.; Pan, W.; Chen, Y.; Zhang, Y.; Yang, T. Coastal Upwelling and Redox Variations in the Northwestern Tarim Basin (Northwest China) during the Middle–Late Ordovician: Implication for Paleo-Depositional Conditions of the Organic Matter Enrichment in the Saergan Formation. Front. Earth Sci. 2023, 11, 1321488. [Google Scholar] [CrossRef]
  65. Schoepfer, S.D.; Shen, J.; Wei, H.; Tyson, R.V.; Ingall, E.D.; Algeo, T.J. Total Organic Carbon, Organic Phosphorus, and Biogenic Barium Fluxes as Proxies for Paleomarine Productivity. Earth-Sci. Rev. 2015, 149, 23–52. [Google Scholar] [CrossRef]
  66. Algeo, T.J.; Ingall, E. Sedimentary C:P ratios, paleocean ventilation, and Phanerozoic atmospheric pO2. Palaeogeogr. Palaeoclimatol. Palaeoecol. 2007, 256, 130–155. [Google Scholar] [CrossRef]
  67. Lewan, M.D.; Maynard, J.B. Factors controlling enrichment of vanadium and nickel in the bitumen of organic sedimentary rocks. Geochim. Cosmochim. Acta 1982, 46, 2547–2560. [Google Scholar] [CrossRef]
  68. Yang, X.; Li, T.; Chen, T.; Zheng, J.; Li, W. Incorporation of Al into Diatom Frustule as a Proxy of Seawater Al/Si Ratios in the Antarctic Zone of the Southern Ocean: Implications for Surface Silicic Acid Concentrations during the Last Glacial Period. Quat. Sci. Rev. 2024, 334, 108724. [Google Scholar] [CrossRef]
  69. Hohl, S.V.; Lin, Y.-B.; Wei, H.-Z.; Wei, G.-Y.; Viehmann, S. Barium Isotopes in Stromatolites through Deep-Time: A Novel Tracer for Metal Cycling in the Photic Zone. Earth Planet. Sci. Lett. 2024, 632, 118639. [Google Scholar] [CrossRef]
  70. Xiangrong, Y.; Detian, Y.; Xiaosong, W.; Liwei, Z.; Shujing, B.; Hanwen, X.; Yin, G.; Jie, H. Different Formation Mechanism of Quartz in Siliceous and Argillaceous Shales: A Case Study of Longmaxi Formation in South China. Mar. Pet. Geol. 2018, 94, 80–94. [Google Scholar] [CrossRef]
  71. Paytan, A.; Kastner, M.; Chavez, F.P. Glacial to Interglacial Fluctuations in Productivity in the Equatorial Pacific as Indicated by Marine Barite. Science 1996, 274, 1355–1357. [Google Scholar] [CrossRef]
  72. Paytan, A.; Griffith, E.M. Marine Barite: Recorder of Variations in Ocean Export Productivity. Deep-Sea Res. Part II 2007, 54, 687–705. [Google Scholar] [CrossRef]
  73. Dymond, J.; Suess, E.; Lyle, M. Barium in Deep-Sea Sediment: A Geochemical Proxy for Paleoproductivity. Paleoceanography 1992, 7, 163–181. [Google Scholar] [CrossRef]
  74. Dymond, J.; Collier, R.W. Particulate Barium Fluxes and Their Relationships to Biological Productivity. Deep-Sea Res. Part II 1996, 43, 1283–1308. [Google Scholar] [CrossRef]
  75. Dean, W.E.; Gardner, J.V.; Piper, D.Z. Inorganic Geochemical Indicators of Glacial-Interglacial Changes in Productivity and Anoxia on the California Continental Margin. Geochim. Cosmochim. Acta 1997, 61, 4507–4518. [Google Scholar] [CrossRef]
  76. Chen, L.; Jiang, S.; Chen, P.; Chen, X.; Zhang, B.; Zhang, G.; Lin, W.; Lu, Y. Relative Sea-Level Changes and Organic Matter Enrichment in the Upper Ordovician-Lower Silurian Wufeng-Longmaxi Formations in the Central Yangtze Area, China. Mar. Pet. Geol. 2021, 124, 104809. [Google Scholar] [CrossRef]
Figure 1. Structural units, lithofacies paleogeography of the Ordos Basin, and distribution of wells and outcrops of the Wulalike Formation in (a) tectonic division and locations of wells and outcrops [18], (b) lithofacies paleogeography showing wells and outcrops [17], (c) lithologic columns of the Wulalike Formation in Well H, (d) lithologic column of the Zhuozishan section (modified from [21]).
Minerals 16 00234 g001
Figure 2. Vertical variations in the TOC and major elements in the Wulalike Formation at Well H.
Minerals 16 00234 g002
Figure 3. Mineral composition of the shale samples in the Wulalike Formation at Well H.
Minerals 16 00234 g003
Figure 4. Vertical variations in the partial trace elements and rare earth elements in the Wulalike Formation at Well H.
Minerals 16 00234 g004
Figure 5. (a) Ternary diagram of mineral compositions of the Wulalike Formation, western margin of the Ordos Basin. (b) TOC distribution of different shale lithofacies. Data from the Zhuozishan section and siliceous shale from [21].
Minerals 16 00234 g005
Figure 6. Core samples and thin section images of representative shale lithofacies from the Wulalike Formation, western margin of the Ordos Basin. (a) Radiolarian siliceous microfossils, Zhuozishan section, plane-polarized light [21]. (b) Sponge spicule-rich siliceous microfossils, Zhuozishan section, plane-polarized light [21]. (c) Sparry dolomite grains with micritic cement, Well H (4514.94 m), plane-polarized light. (d) Clay laminae, Well H (4537.97 m), plane-polarized light. (e) Calcite grains with siliceous cement, Well H (4222.14 m), cross-polarized light. (f) Calcareous laminae, Well H (4226.89 m), plane-polarized light.
Minerals 16 00234 g006
Figure 7. Vertical variations in TOC, terrigenous input proxies (Al, Ti), hydrothermal activity indicators δ (Eu), chemical weathering indicators (CIA, C-value, Sr/Cu) and redox proxies (UEF, MoEF) in the Wulalike Formation at Well H.
Minerals 16 00234 g007
Figure 8. Statistical distributions of Al and Ti among different shale lithofacies. Siliceous shale data are from [21].
Minerals 16 00234 g008
Figure 9. (a) Cross plots used for geochemical identification of volcanic activity in the Wulalike Formation shales, Ordos Basin. (b) Al–Fe–Mn ternary diagram illustrating the siliceous origin of the black shale samples from the Wulalike Formation, siliceous shale data from [21].
Minerals 16 00234 g009
Figure 10. Paleoclimate and paleoweathering parameters of the Wulalike Formation (a) A-CN-K ternary diagram. Abbreviations: Pl—plagioclase, Kfs—K-feldspar, Sm—smectite, Mu—muscovite, To—tonalite, Gd—granodiorite, Gr—granite. (b) C-values and Sr/Cu cross plot for paleoclimate discrimination. Siliceous shale data are from [21].
Minerals 16 00234 g010
Figure 11. (a) Covariation of MoEF and UEF illustrating water column redox conditions of the Wulalike Formation shales (SW = sea water). (b) Mo–TOC relationship indicating the degree of water column restriction in the Wulalike Formation shales. Siliceous shale data are from [21].
Minerals 16 00234 g011
Figure 12. Vertical variations in paleoproductivity proxies (Sibio, Ba/Al, Cu/Al, Zn/Al, Ni/Al, and P) in the Wulalike Formation at Well H.
Minerals 16 00234 g012
Figure 13. Statistical comparison of Sibio and Ba/A1 ratios among shale lithofacies in the Wulalike Formation; siliceous shale data are from [21].
Minerals 16 00234 g013
Figure 14. Correlation between TOC and geochemical indicators of the Wulalike Formation. (a) Sibio vs. TOC. (b) Al vs. TOC. (c) Sr/Cu vs. TOC. (d) C-value vs. TOC. (e) MoEF vs. TOC. (f) UEF vs. TOC. Siliceous shale data are from [21].
Minerals 16 00234 g014
Disclaimer/Publisher’s Note: The statements, opinions and data contained in all publications are solely those of the individual author(s) and contributor(s) and not of MDPI and/or the editor(s). MDPI and/or the editor(s) disclaim responsibility for any injury to people or property resulting from any ideas, methods, instructions or products referred to in the content.