Abstract
Nine samples of carbonate-free sodalite-group minerals, including those with abnormally high contents of polysulfide groups, fluoride anion and carbon dioxide molecules as well as synthetic fluoraluminate sodalite-type compound Na8(Si7Al5O24)(AlF6)3–·5H2O, have been studied by means of electron microprobe analyses, infrared and Raman spectroscopy; the CO2 content was determined using the selective sorption of gaseous ignition products. This article describes a semi-quantitative method for estimating the content of carbon dioxide molecules in these minerals, based on IR spectroscopy data. The data obtained demonstrate the existence of a sulfide sodalite-group mineral with the idealized formula Na7(Si6Al6O24)(S3−)·H2O, which differs significantly from the formula Na6Ca2(Si6Al6O24)S2–2 accepted for lazurite. According to single-crystal X-ray structural analysis, in the F-rich sodalite-group mineral from the Eifel paleovolcanic region, Germany with the idealized formula Na7(Si6Al6O24)F−·nH2O fluorine occurs as an isolated F− anion, unlike synthetic F-rich sodalite-type compounds.
1. Introduction
Natural aluminosilicates belonging to the sodalite group are feldspathoids whose crystal structures are based on the tetrahedral framework (AlxSi1−xO2)x– with large cavities (so-called β-cages) hosting large cations (Na+, K+, Ca2+), additional anions (Cl−, F−, SO42–, S2–, S3−, etc.) and neutral molecules (H2O, CO2) [1,2,3,4,5,6,7,8,9,10,11]. Sodalite-type compounds with different additional anions (CO3−, HCOO−, AlF63–, OH−) have been synthesized [12,13,14,15,16].
Vibrational (infrared and Raman) spectroscopy has proven to be an effective tool with which various anionic and neutral extra-framework groups in minerals of the sodalite group can be identified. However, a number of unresolved problems remain related to the quantitative determination of the relative contents of various groups containing C, S, and F, the limits of carbon dioxide contents, the writing of chemical formulae for members of the sodalite group with high sulfur and fluorine contents, as well as the present-day problem with the status of lazurite in the nomenclature of minerals. In this work, a combination of infrared and Raman spectroscopy was applied to the study of extra-framework anionic and neutral groups in nine samples of sodalite-group minerals with contrastingly different chemical compositions, including samples with abnormally high contents of polysulfide groups, fluoride anion and carbon dioxide molecules. In addition, this paper describes a semi-quantitative method for estimating the content of CO2 molecules in these minerals, based on IR spectroscopy data.
2. Materials and Methods
The samples investigated in this work are as follows.
Sample 1 is blue sodalite, forming grains up to 3 cm across in a cancrinite–sodalite pegmatite uncovered at the western slope of Mount Kobelikha, in the bench bottom of the open pit situated in the Vishnevogorskiy syenite-miaskite complex, South Urals, Russia. Associated minerals are potassium feldspar, cancrinite, annite, muscovite, different zeolites, as well as accessory zircon, thorite, ilmenite, columbite-(Fe), Nb-bearing rutile, a pyrochlore-group mineral, various sulfides etc. [17].
Sample 2 is gray nosean forming crystals up to 0.5 cm across and twins on (111) up to 1 cm long in cavities of nosean sanidinite in the In den Dellen (Zieglowski) pumice quarry, 1.5 km NE of Mendig, Laach Lake (Laacher See) paleovolcano, Eifel region, Rhineland-Palatinate, Germany. Metasomatic nosean sanidinites of the Laach Lake area are derivatives of foyaite magmas which are comagmatic with nosean-cancrinite-nepheline syenites [18,19,20,21,22]. Associated minerals are sanidine, augite, annite, and zircon.
Sample 3 is blue rock-forming SO4-bearing triclinic lazurite (intermediate member of the haüyne–lazurite solid-solution series) from the Malobystrinskoe lazurite deposit, Baikal Lake area, Siberia, Russia [23]. Associated minerals are calcite, diopside, pyrite, fluorapatite, and phlogopite. The sample was kindly provided by A.N. Sapozhnikov.
Sample 4 is lilac haüyne forming imperfect crystals up to 0.4 cm in cavities of a metasomatic rock composed of haüyne, calcite and phlogopite from the Tultuy lazurite deposit, Baikal Lake area, Siberia, Russia.
Sample 5 is light blue (with a greenish tint) rock-forming haüyne from the Malobystrinskoe lazurite deposit. Associated minerals are dolomite and diopside.
Sample 6 (Figure 1) comes from the collection of Anatoly V. Kasatkin (catalogue number 569L). It originates from the Malobystrinskoe lazurite deposit and is a fragment of lazurite-rich metasomatic rock. CO2-rich, SO4-bearing lazurite (an intermediate member of the haüyne–lazurite solid-solution series) occurs there as bright blue massive aggregates up to 3.5 cm × 2 cm. Other associated minerals are diopside, calcite, dolomite, anhydrite, and phlogopite.
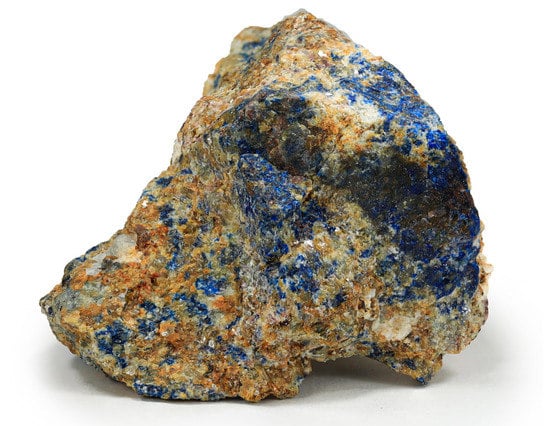
Figure 1.
Bright blue CO2-rich, SO4-bearing lazurite with orange diopside in metasomatic rock. Sample 6. Field width: 9 cm. Photographer: Anastasia D. Kasatkina.
Sample 7 is a large (2 cm × 3 cm × 4 cm) deep blue twin on (111) of sulfide-rich lazurite from calcite marble (Figure 2). The sample originates from the Sar-e Sang lazurite deposit, Badakhshan, Afghanistan, which is the type locality of lazurite.
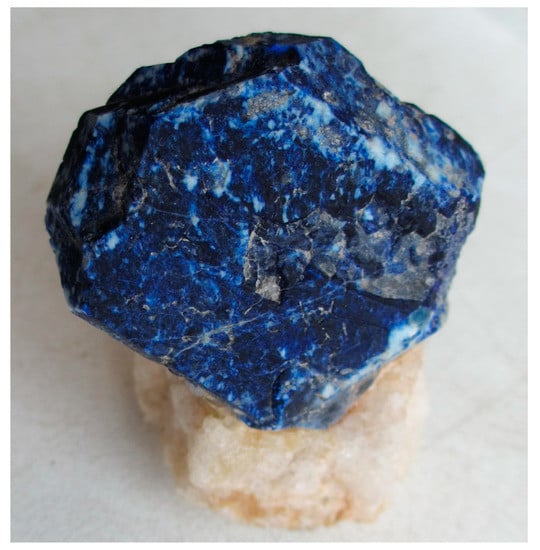
Figure 2.
Twin of a deep blue sulfide-rich lazurite extracted from calcite marble (white). Sample 7. Field width: 4.5 cm. Photographer: Nikita V. Chukanov.
Sample 8 is lazurite forming a deep blue outer zone of a rhombic dodecahedral crystal 2 cm across from calcite marble (Figure 3). The inner zone of the crystal is composed of gray haüyne. The sample originates from the Sar-e Sang lazurite deposit.
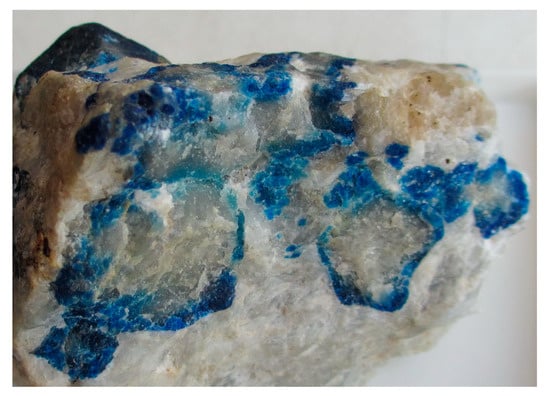
Figure 3.
Zoned haüyne–lazurite crystals in calcite marble. Sample 8. Field width: 6 cm. Photographer: Nikita V. Chukanov.
Sample 9 is an F-rich sodalite-group mineral forming yellowish twins on (111) up to 1 mm long in the cavities of nepheline- and biotite-bearing trachitoid sanidinite from the In den Dellen (Zieglowski) pumice quarry (Figure 4).
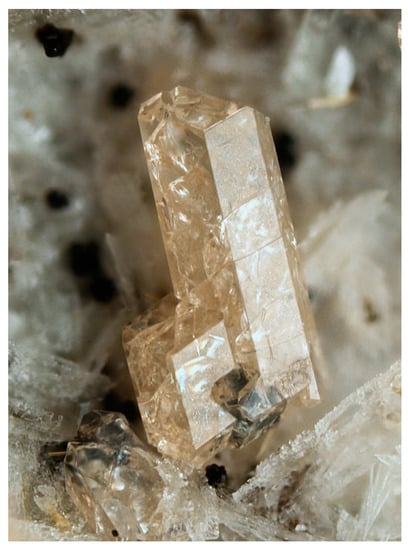
Figure 4.
Twin of a F-rich sodalite-group mineral on sanidinite. Sample 9. Photographer: Marko Burkhardt. Field width: 1 mm.
Sample 10 (used for comparison) is a synthetic F-rich sodalite-type compound Na7.38(Si6.74Al5.26O24)(AlF6)0.70·4.88H2O synthesized hydrothermally (at T = 650 °C, P = 2 kBar) in a Si-Al-Na-F-H2O system [14]. The sample was kindly provided by A.R. Kotel’nikov.
Table 1 lists the analytical methods which were used for the characterization of different samples (“+” means that the method was applied). Samples 3, 6, 7, and 9 with unusual compositional characteristics were investigated in the most detail. Samples 1, 2, 4, 5, and 8 played an auxiliary role and were used to obtain calibration dependence for the determination of the content of CO2 molecules from the IR spectra. Some data for Samples 1 and 10 were taken from literature sources, indicated in Table 1.

Table 1.
Techniques applied for the characterization of Samples 1 to 10.
Electron microprobe analyses (three spot analyses for each sample) were carried out using a Tescan VEGA-II XMU electronic microscope (EDS mode, 20 kV, 400 pA). Data reduction was carried out by means of a modified INCA Energy 450 software package. The size of the electron beam was 157–180 nm. The beam was rastered on an area 20 μm × 20 μm in order to minimize sample damage. The time of data acquisition was 50 s. The sample-to-detector distance was 25 mm. The standards used are: albite for Na and Si, sanidine for K, wollastonite for Ca, Al2O3 for Al, BaSO4 for S, CaF2 for F, and NaCl for Cl.
The content of fluorine in the F-rich Sample 9 was determined as the mean of 11 spot analyses using a Jeol JSM-6480LV scanning electron microscope equipped with an INCA-Wave 500 wavelength-dispersive spectrometer (Laboratory of Analytical Techniques of High Spatial Resolution, Department of Petrology, Moscow State University), with an acceleration voltage of 20 kV, a beam current of 20 nA, and a 3 μm beam diameter. MgF2 was used as a reference.
For all samples except Sample 7, CO2 was determined by the selective sorption of CO2 on an askarite sorbent (an asbestiform matter saturated by NaOH) from gaseous products obtained by heating of the mineral at 1080 °C in oxygen at 1 atm. For Sample 7, CO2 and H2O were determined by gas chromatography of products of ignition in oxygen at 1200 °C with a Vario Micro cube analyzer (Elementar GmbH, Frankfurt, Germany).
In order to obtain infrared (IR) absorption spectra, powdered samples were mixed with dried KBr, pelletized, and analyzed using an ALPHA FTIR spectrometer (Bruker Optics) in the range 360–4000 cm−1 with a resolution of 4 cm−1 and 16 scans. An IR spectrum of an analogous pellet prepared from pure KBr was used as a reference. The optical densities of the bands at 2341–2346 cm−1 were measured relative to the optical density at 2500 cm−1. The optical densities of the band used as an internal standard was measured at the absorption maximum in the range 656–668 cm−1; the common tangents to the two deepest minima in the range 500–830 cm−1 were used as baselines.
Raman spectra of randomly oriented samples were obtained using an EnSpectr R532 spectrometer based on an OLYMPUS CX 41 microscope coupled with a diode laser (λ = 532 nm) at room temperature. The spectra were recorded in the range from 100 to 4000 cm−1 with a diffraction grating (1800 g mm−1) and spectral resolution of about 6 cm−1. The output power of the laser beam was about 5 mW. The diameter of the focal spot on the sample was less than 5 μm. The backscattered Raman signal was collected with a 40× objective; signal acquisition time for a single scan of the spectral range was 1 s, and the signal was averaged over 50 scans. Crystalline silicon was used as a standard.
The single-crystal X-ray diffraction experiment was carried out for Sample 9 using Xcalibur S CCD diffractometer. The measured intensities were corrected for Lorentz, background, polarization and absorption effects. Data reduction was performed using CrysAlisPro Version 1.171.39.46 [24]. The studied sample is cubic, space group I-43m, a = 9.05887(10) Å, V = 743.40(2) Å3. The crystal structure of Sample 9 was obtained by direct methods and refined using the SHELX software package [25]. The structure was refined for the two-component twin with refined twin ratio 0.52:0.48. Experimental details are given in Table 2.
Table 2.
Crystal data, data collection information and structure refinement details for sample 9.
3. Results
3.1. Chemical Composition
Chemical data for the studied sodalite-group minerals are given in Table 3. The CO2 content in Sample 9 was determined by means of IR spectroscopy (see below).
Table 3.
Chemical composition of sodalite-group minerals.
It is to be noted that the CO2 contents in Samples 2–9 correspond to the CO2 molecules in the sodalite cavities because IR spectra of these samples do not contain characteristic bands of the CO32– anion. Samples 6, 7 and 9 are characterized by abnormally high contents of carbon, sulfur and fluorine, respectively.
3.2. Infrared Spectroscopy
The IR spectra of the studied Samples 1–10 are given in Figure 5, Figure 6, Figure 7 and Figure 8. All of them contain bands of O–H stretching and H–O–H bending vibrations (in the ranges 3400–3700 and 1640–1660 cm−1, respectively) which are due to the presence of H2O molecules (zeolitic water). Taking into account that in the sodalite-type framework, each tetrahedral atom is coordinated by two O atoms, the presence of OH groups connected to the framework should be excluded. Additional bands in the ranges 3200–3400 and 1687–1709 cm−1 in the IR spectra of Samples 1, 2, 9 and 10 may correspond to H3O+ or H5O2+ cations [26]. This assumption is confirmed by the presence of a band in the range 1339–1358 cm−1 in the IR spectra of these four samples whereas IR spectra of other samples do not contain this band. The IR band in the range 1320–1390 cm−1 is a characteristic feature of isolated H+ cation which may be formed as a result of dissociation of acid groups: H3O+ → H+ + H2O; H5O2+ → H+ + 2H2O [26].
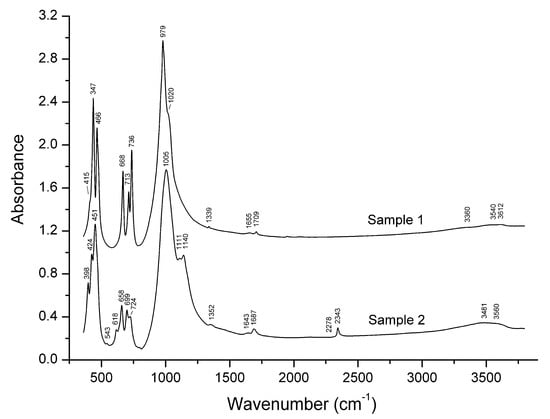
Figure 5.
Infrared absorption spectra of sodalite and nosean (Samples 1 and 2).
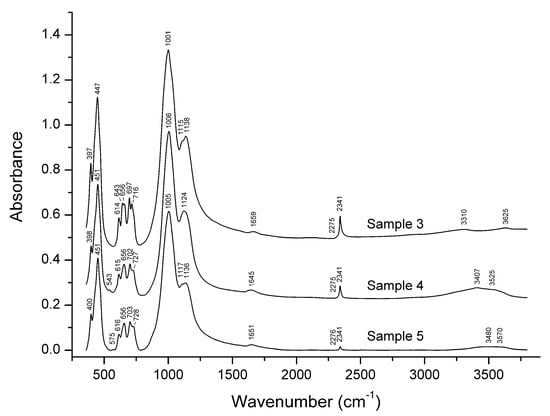
Figure 6.
Infrared absorption spectra of the sulfate-rich minerals belonging to the haüyne–lazurite solid-solution series (Samples 3 to 5).
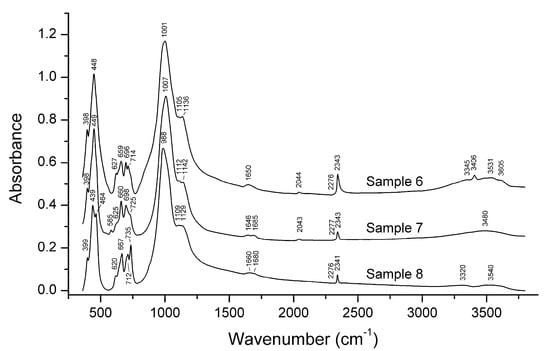
Figure 7.
Infrared absorption spectra of the sulfate-poor minerals belonging to the haüyne–lazurite solid-solution series (Samples 6 to 8).
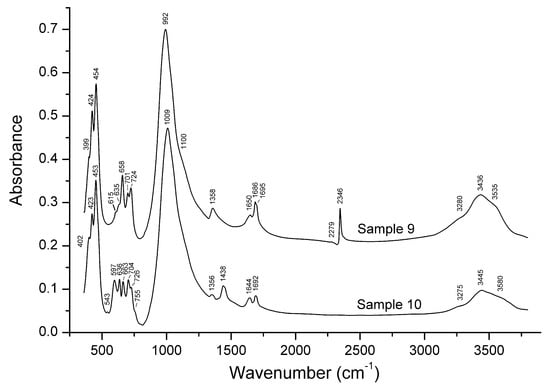
Figure 8.
Infrared absorption spectra of the F-rich sodalite-group mineral (Sample 9) and synthetic fluoraluminate sodalite-type compound (Sample 10).
Characteristic IR bands of S-bearing groups in the sodalite-group minerals are observed in the ranges 1124–1142 cm−1 (asymmetric stretching vibrations of the SO42– group, the F2(ν3) mode), 614–637 cm−1 (bending vibrations of the SO42– group, the F2(ν4) mode) and 575–585 cm−1 (antisymmetric stretching vibrations of the S3− radical anion, the ν3 mode—A weak band) [26,27,28,29,30]. Taking into account the overlapping of the bands of asymmetric stretching vibrations of the SO42– group and antisymmetric T–O–T stretching (T = Al, Si) vibrations of the tetrahedral framework in the range 1020–1150 cm−1, the band in the range 614–627 cm−1 should be considered as the most reliable indication of the presence of the sulfate anion in the sodalite-group minerals. This anion was reliably detected in Samples 2–9. The characteristic band of the S3− radical anion is observed in the IR spectra of Samples 5 and 7. It is to be noted that the S2– anion does not have inner degrees of freedom and, consequently, its absorption bands could not be observed in the wavenumber range 360–3800 cm−1.
The three bands at about 670, 710 and 740 cm−1 are proof that the sodalite-type structure exists. In some spectra, including those of Samples 3, 4 and 7, the arrangements of these three characteristic bands are disturbed. Most probably, this phenomenon is due to structure modulation, which is a characteristic feature of sodalite-type minerals from metasomatic lazurite deposits [23].
The strongest band of the CO32– group in sodalite cavities is observed in the range 1436–1450 cm−1 [30,31]. In the IR spectra of natural samples investigated in this work, this band is absent, but a band at 1438 cm−1 is observed in the IR spectrum of the synthetic sodalite-type compound, with the presumed crystal-chemical formula Na7.38(Si6.74Al5.26O24)(AlF6)0.70·4.88H2O (Sample 10 [14]).
The IR spectrum of Sample 10 was discussed elsewhere [15]. In accordance with structural data and by analogy with IR spectra of natural fluoraluminates [30], the band at 597 cm−1 corresponds to stretching vibrations of the AlF63– anion. This band is absent in the IR spectra of all other samples investigated in this work, including natural F-rich sodalite-type mineral (Sample 9).
A narrow band at 2341–2346 cm−1 present in the IR spectra of Samples 2–9 is due to the antisymmetric stretching vibrations of CO2 molecules [11,32]. This band is accompanied by a very weak isotope satellite at 2275–2279cm−1 corresponding to 13C16O2. Samples 3, 6 and 9 are the most CO2-rich.
The optical density of the band at 2341–2346 cm−1 (D) shows positive correlation with the content of CO2 determined by selective sorption (Figure 9). Consequently, IR spectroscopy can be used for the estimation of the content of CO2 molecules in sodalite-group minerals.
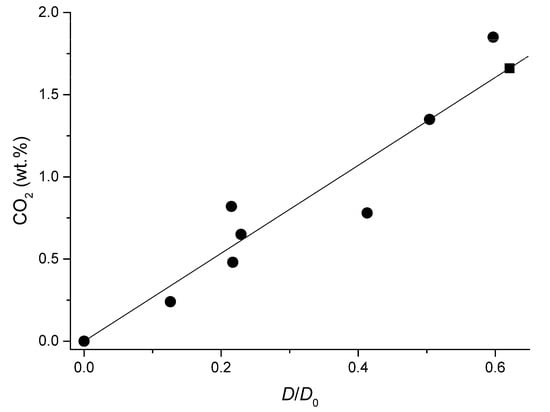
Figure 9.
The correlation between the content of CO2 determined by the selective sorption and relative optical density of the band at 2341–2346 cm−1 (D0 is the optical density at the maximum of the band at 656–668 cm−1 used as an internal standard). The circles correspond to Samples 1–8 and the square corresponds to Sample 9 with the CO2 content determined using this correlation.
We failed to assign the weak band at 2043–2044 cm−1 observed in the IR spectra of Samples 6 and 7. Hypothetically, this band may be associated with a minor admixture of an extra-framework component with the S–H covalent bond.
3.3. Raman Spectroscopy
Among the nine minerals of the sodalite group studied in this work, there are several samples characterized by anomalous features of the chemical composition (Table 3). These are Samples 3, 6 and 9 with high contents of carbon dioxide molecules (≥ 0.36 CO2 groups pfu), Sample 7 with a high content of sulfur (2.74 atoms pfu), and Sample 9 characterized by a very high content of fluorine (1.81 wt.%, 0.83 atoms pfu), which has never been noted in natural sodalites before. Among minerals, a higher content of CO2 molecules (2.2 wt.%) was detected only in cordierite [33]. Figure 10 and Figure 11 show the Raman spectra of these samples as well as the Raman spectrum of the synthetic F-rich compound with the idealized formula Na8(Si7Al5O24)(AlF6)·5H2O (Sample 10).
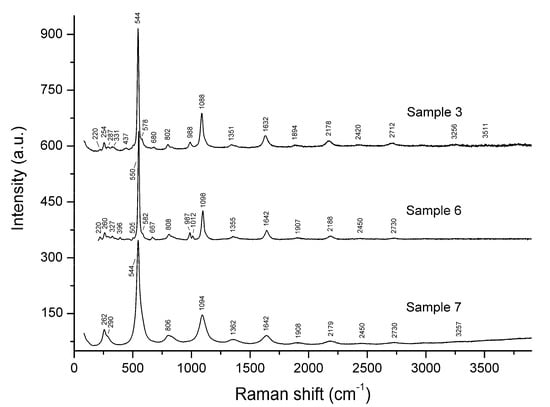
Figure 10.
Raman spectra of the members of the haüyne–lazurite solid-solution series.
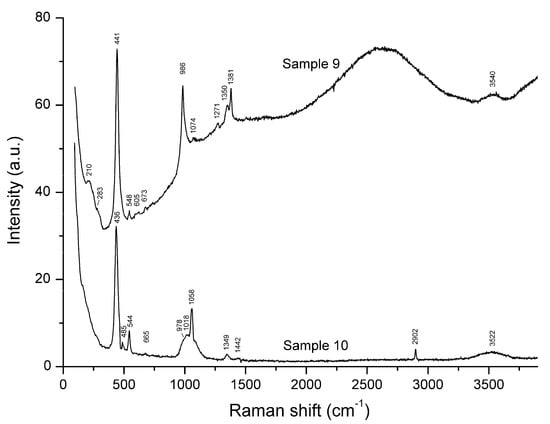
Figure 11.
Raman spectra of the F-rich sodalite-group mineral (Sample 9) and the synthetic fluoraluminate sodalite-type compound (Sample 10).
The F-rich Sample 9 shows a strong luminescence under a laser beam (the broad feature in the range 1900–3200 cm−1: Figure 11). The cause of this phenomenon is unknown. Another specific feature of the Raman spectrum of Sample 9 is the presence of the weak bands at 605 and 1074 cm−1 which are absent in the Raman spectra of other samples and may correspond to translational and librational modes of HF [34].
The assignment of Raman bands is given in Table 4. For the assignment of the bands at 327–331 and 667–680 cm−1 to the vibrations of the S4− radical anion, see the Discussion section.
Table 4.
Raman bands of sodalite-group minerals and Sample 10, and their assignment.
3.4. X-ray Diffraction Data and Crystal Structure
The studied sample of the F-rich sodalite-group mineral (Sample 9) retains the sodalite-type framework built by corner-linked TO4 tetrahedra (T = Si, Al). Extra-framework cations (Na+ and subordinate K+ and Ca2+ statistically replacing each other), anions (F−, Cl−, SO42–) and neutral molecules (H2O, CO2) occur in β-cages. The refined F content of 1.54 apfu is significantly higher than the value of 0.83 F apfu in the empirical formula. On the other hand, no separate sites were found for H2O and CO2 molecules. For this reason, we assume that these components may replace F anions. Additional water molecules may occur with a very low occupancy around O atoms of SO4 tetrahedron (OS). The Na site is split onto three subsites with partial occupancies. The site occupancy factors for all Na subsites were refined using Na scattering curve and Uanis restrained to be equal; then, K (K = K + Ca) admixture was added according to chemical data and the refined number of electrons.
Atom coordinates and displacement parameters for Sample 9 are given in Table 5 and interatomic distances in Table 6. The crystal structure of Sample 9 is shown in Figure 12.
Table 5.
Atom coordinates, equivalent displacement parameters (in Å2), site occupancy factors (s.o.f.) and site multiplicities (Q) for the Sample 9.
Table 6.
Selected interatomic distances (Å) in the structure of Sample 9.

Figure 12.
The crystal structure of the F-rich sodalite-group mineral (Sample 9).
4. Discussion
The empirical formulae of the studied sodalite-group minerals were calculated based on chemical data (Table 3) and taking into account the above data on the infrared and Raman spectra. According to the spectroscopic data, the anomalously high-sulfur Sample 7 from Sar-e Sang (the type locality of lazurite) has a high content of the radical anions S3− and a low content of the SO42– groups; other polysulfide anions are absent, and the presence of the monosulfide anion S2– cannot be excluded. Consequently, the charge-balanced formula of Sample 7 is (Na6.66K0.26Ca0.16)(Si6.44Al5.54Fe3+0.02O24)(S3−)0.80(S2–,SO42–)0.35Cl0.18(CO2)0.22·1.13H2O. The idealized formula of this sample is Na7(Si6Al6O24)(S3−)·H2O. This formula differs significantly from the idealized formula Na3Ca(Si3Al3)O12S (another spelling being Na6Ca2(Si6Al6O24)S2–2) of lazurite given in the current IMA list of mineral species [35] together with the reference [9]. Moreover, the latter formula contradicts the results of X-ray structural analysis of “lazurite” from [9], which correspond to a SO4-dominant mineral.
The charge-balanced empirical formula of another sample from Sar-e Sang (Sample 8) is (Na6.38Ca1.22K0.12)(Si6.10Al5.86Fe3+0.04O24)(S2–,SO42–)1.30(S3−)0.16(CO2)0.16·nH2O, which is close to the lazurite formula from the IMA list of mineral species. The charge-balanced formula of one more S2–-dominant lazurite sample (Sample 3) is (Na7.05Ca1.00)(Si6.02Al5.93Fe3+0.05O24)(S2–,SO42–)1.40(S3−)0.27(CO2)0.36·nH2O. These examples show that several different sulfide members of the sodalite group (with different contents of Ca, H2O and CO2 and with different dominant sulfide groups) may exist, and the status of lazurite as a mineral species needs to be specified.
The charge-balanced empirical formula of the most CO2-rich lazurite (Sample 6) is (Na7.43K0.16Ca0.43)(Si6.17Al5.75Fe3+0.08O24)(S2–,SO42–)1.21(S3−)0.15Cl0.06(CO2)0.46·nH2O (here, we neglected trace amounts of the S4− anions showing a weak Raman band at 327 cm−1). Taking into account the low intensities of the bands of sulfate groups in the IR spectrum of Sample 6, one can conclude that in this sample, sulfate anion plays a subordinate role. Consequently, the idealized formula of Sample 6 is Na8(Si6Al6O24)S2–·nH2O, which also differs significantly from the formula Na6Ca2(Si6Al6O24)S2–2 accepted currently for lazurite. Moreover, one cannot exclude the existence of a sulfide sodalite-group mineral with species-defining CO2 molecules. A higher CO2 content (2.70 wt.%) was detected in nosean from Bassano Romano, Viterbo, Lazio, Italy [11], but this sample is characterized by a relatively low intensity of the stretching band of carbon dioxide and, therefore, most of the carbon in it belongs to carbonate anions.
Structural carbon dioxide is a typical admixed component of different silicate minerals with microporous and channel structures. The well-known examples are different members of the cancrinite group [36,37,38,39,40], cordierite [41,42,43,44], beryl [45,46], pollucite [47], melanophlogite [48] etc. Sodalite-group minerals are not an exclusion from this trend.
The radical ion (S3)− is considered by most researchers as the main cause of blue color of lazurite [49,50,51,52,53,54,55,56]. Our data confirm this conclusion.
In the review [57], it is stated that “The radical anion [S–S–S–S]*− has not yet been observed convincingly by Raman spectroscopy”. However, it is to be noted that the structure and Raman spectrum of the tetrasulfide radical anion is discussed in detail in [54]. The authors of this paper concluded that (S4)− has the flat star shape, D3h. The calculated wavenumbers of Raman active bands ν1(A1) = 329, ν3(E) = 680, and ν4(E) = 345 cm−1 are in excellent agreement with experimental data. The intensities of the bands ν1 and ν3 are nearly equal, whereas ν4 is observed as a weak shoulder. In our Raman spectra of Samples 3 and 6, the weak bands ν1 and ν3 also have nearly equal intensities, and the band ν4 is not observed. In the Raman spectra of F-rich and S-depleted Samples 9 and 10, the bands at 673 and 665, which are not accompanied by the bands in the range 320–340 cm−1, are tentatively assigned to the vibrations of the HF molecule as a whole, in accordance with [34].
The IR and Raman spectra indicate that F-rich Sample 9 contains sulfate groups, H2O and CO2 molecules. As noted above, the band at 1350–1358 cm−1 observed in both IR and Raman spectra may correspond to vibrations of the H+ cation in the β-cage. Unlike the synthetic F-rich sodalite-type compound (Sample 10), Sample 9 does not show IR and Raman bands of the AlF63– anion. Consequently, the empirical formula of the latter sample is H+0.12(Na5.86K0.82Ca0.10)(Si6.34Al5.66O24)F0.83Cl0.17(SO4)0.17(CO2)0.36·nH2O. The addition of H+ in the empirical formula is formally required for the charge balance, and is in agreement with the above assumption that Sample 10 contains additional H+ cation. The most interesting feature of Sample 9 is a significant predominance of F− over all other extra-framework anions, which makes it possible to consider this mineral as a potentially new mineral species with the idealized formula Na7(Si6Al6O24)F−·nH2O. Most probably, this mineral crystallized at high fugacities of HF and CO2.
Hypothetically, anionic and neutral extra-framework components (Cl−, OH−, F−, AlF63–, SO42–, S2–, S3−, CO32–, C2O42–, CO2, H2O, CH4 etc.) occurring in β-cages of minerals belonging to the sodalite and cancrinite groups could be used as important geochemical markers, provided that the relationships between their contents and conditions of mineral formation will be investigated in detail experimentally. In particular, one can suppose that the ratios SO42–: (S2– + S3−) and (CO32– + CO2): C2O42–: CH4 may reflect oxygen fugacity in the mineral-forming medium. The geochemical role of different S-bearing species, including the trisulfur radical anion, is discussed in [29,58].
Author Contributions
N.V.C. and I.V.P. wrote the paper. N.V.C. obtained and interpreted the IR spectra. M.F.V. obtained and interpreted the Raman spectra. N.V.Z. solved the crystal structure. D.Y.P. carried out the crystal-chemical analysis. I.V.P. obtained the crystal data. C.S. and A.V.K. collected the samples 6 and 9, respectively. V.O.Y. obtained electron-microprobe data. All authors have read and agreed to the published version of the manuscript.
Funding
This work was supported by the Russian Foundation for Basic Research, grants nos. 18-29-12007-mk (Raman spectroscopy) and by the Russian Science Foundation, grant no. 19-17-00050 (crystal structure analysis). A part of this work (IR spectroscopy and a part of chemical analyses) has been carried out in accordance with the state task, state registration number AAAA-A19-119092390076-7. The authors are grateful to A.N. Saposhnikov and A.R. Kotelnikov for samples provided for the investigations.
Conflicts of Interest
The authors declare no conflict of interest.
References
- Taylor, D. The sodalite group of minerals. Contrib. Mineral. Petrol. 1967, 16, 172–188. [Google Scholar] [CrossRef]
- Sahl, K.; Chatterjee, N.D. The crystal structure of bicchulite, Ca2[Al2SiO6](OH)2. Zeits. Krist. 1977, 146, 35–41. [Google Scholar] [CrossRef]
- Sahl, K. Refinement of the crystal structure of bicchulite, Ca2[Al2SiO6](OH)2. Zeits. Krist. 1980, 152, 13–21. [Google Scholar] [CrossRef]
- Uchida, E.; Iiyama, J.T. On kamaishilite, Ca2Al2SiO6(OH)2; a new mineral (tetragonal), dimorphous with bicchulite, from the Kamaishi mine, Japan. Proc. Jpn. Acad. 1981, 57B, 239–243. (In English) [Google Scholar] [CrossRef][Green Version]
- Peterson, R.C. The structure of hackmanite, a variety of sodalite, from Mont St-Hilaire, Quebec. Can. Mineral. 1983, 21, 549–552. [Google Scholar]
- Hassan, I.; Grundy, H.D. The crystal structures of sodalite-group minerals. Acta Cryst. 1984, B40, 6–13. [Google Scholar] [CrossRef]
- Hassan, I.; Buseck, P. Cluster ordering and antiphase domain boundaries in hauyne. Can. Mineral. 1989, 27, 173–180. [Google Scholar]
- Hassan, I.; Grundy, H.D. The structure of nosean, ideally Na8[Al6Si6O24]SO4·H2O. Can. Mineral. 1989, 27, 165–172. [Google Scholar]
- Hassan, I.; Peterson, R.C.; Grundy, H.D. The structure of lazurite, ideally Na6Ca2(Al6Si6O24)S2, a member of the sodalite group. Acta Cryst. C 1985, 41, 827–832. [Google Scholar] [CrossRef]
- Gobeltz-Hautecoeur, N.; Demortier, A.; Lede, B.; Lelieur, J.P.; Duhayon, C. Occupancy of the sodalite cages in the blue ultramarine pigments. Inorg. Chem. 2002, 41, 2848–2854. [Google Scholar] [CrossRef]
- Bellatreccia, F.; Della Ventura, G.; Piccinini, M.; Cavallo, A.; Brilli, M. H2O and CO2 in minerals of the hauyne-sodalite group: A FTIR spectroscopy study. Mineral. Mag. 2009, 73, 399–413. [Google Scholar] [CrossRef]
- Fechtelkord, M. Structural study of Na8[AlSiO4]6(CO3)x(HCOO)2-2x(H2O)4x, 0.2 ≤ x ≤ 1, synthesized in organic solvents: Order and disorder of carbonate and formate anions in sodalite. Micropor. Mesopor. Mater. 1999, 28, 335–351. [Google Scholar] [CrossRef]
- Gesing, T.M.; Buhl, J.C. Crystal structure of a carbonate-nosean Na8[AlSiO4]6CO3. Eur. J. Miner. 1998, 10, 71–77. [Google Scholar] [CrossRef]
- Yakubovich, O.V.; Kotel’nikov, A.R.; Shchekina, T.I.; Gramenitskiy, E.N.; Zubkov, E.S. New representative in the sodalite structure type with extraframework anions [AlF6]3–. Crystallogr. Rep. 2011, 56, 190–197. [Google Scholar] [CrossRef]
- Gramenitskii, E.N.; Kotel’nikov, A.R.; Shchekina, T.I.; Yakubovich, O.V.; Devyatova, V.N.; Zubkov, E.S.; Suk, N.I.; Vigasina, M.F.; Kotel’nikova, Z.A. Composition, structure and conditions of formation of fluorine-containing sodalite (experimental data). Geochem. Int. 2018, 56, 521–534. [Google Scholar] [CrossRef]
- Hassan, I.; Grundy, H.D. The crystal structure of basic cancrinite, ideally Na8[Al6Si6O24](OH)2·3H2O. Can. Mineral. 1991, 29, 123–130. [Google Scholar]
- Nishanbaev, T.P.; Rassomahin, M.A.; Blinov, I.A.; Popova, V.I. Minerals of sodalite-cancrinite pegmatites from the Vishnevogorsk miaskite massif, South Urals. Mineralogy 2016, 3, 40–52. (In Russian) [Google Scholar]
- Schmitt, A.K.; Wetzel, F.; Cooper, K.M.; Zou, H.; Wörner, G. Magmatic longevity of Laacher See volcano (Eifel, Germany) indicated by U–Th dating of intrusive carbonatites. J. Petrol. 2010, 51, 1053–1085. [Google Scholar] [CrossRef]
- Frechen, J. Vorgänge der Sanidinit-Bildung im Laacher Seegebiet. Fortschr. Mineral. 1947, 26, 147–166. (In German) [Google Scholar]
- Frechen, J. Siebengebirge am Rhein, Laacher Vulkangebiet, Maargebiet der Westeifel. Sammlung geologischer Führer, 3. Auflage; Schweitzerbart: Stuttgart, Germany, 1976; p. 209. (In German) [Google Scholar]
- Schmitt, A.K. Laacher See revisited: High-spatial-resolution zircon dating indicates rapid formation of a zoned magma chamber. Geology 2006, 34, 597–600. [Google Scholar] [CrossRef]
- Chukanov, N.V.; Krivovichev, S.V.; Pakhomova, A.S.; Pekov, I.V.; Schäfer, C.; Vigasina, M.F.; Van, K.V. Laachite, (Ca,Mn)2Zr2Nb2TiFeO14, a new zirconolite-related mineral from the Eifel volcanic region, Germany. Eur. J. Mineral. 2014, 26, 103–111. [Google Scholar] [CrossRef]
- Evsyunin, V.G.; Sapozhnikov, A.N.; Kashaev, A.A.; Rastsvetaeva, R.K. Crystal Structure of Triclinic Lazurite. Crystallogr. Rep. 1997, 42, 938–945. [Google Scholar] [CrossRef]
- Rigaku Oxford Diffraction. CrysAlisPro Software System, version 1.171.39.46; Rigaku Oxford Diffraction: Oxford, UK, 2018. [Google Scholar]
- Sheldrick, G.M. Crystal structure refinement with SHELXL. Acta Crystallogr. 2015, C71, 3–8. [Google Scholar]
- Chukanov, N.V.; Chervonnyi, A.D. Infrared Spectroscopy of Minerals and Related Compounds; Springer: London, UK, 2016; p. 1109. [Google Scholar] [CrossRef]
- Clark, R.J.H.; Cobbold, D.G. Characterization of sulfur radical-ions in solutions of alkalipolysulfides in dimethylformamide and hexamethylphosphoramide and in solid-state in ultramarine blue, green, and red. Inorg. Chem. 1978, 17, 3169–3174. [Google Scholar] [CrossRef]
- Li, S.; Liu, M.; Sun, L. Preparation of acid-resisting ultramarine blue by novel two-step silica coating process. Indust. Eng. Chem. Res. 2011, 50, 7326–7331. [Google Scholar] [CrossRef]
- Chivers, T.; Elder, P.J.W. Ubiquitous trisulfur radical anion: Fundamentals and applications in materials science, electrochemistry, analytical chemistry and geochemistry. Chem. Soc. Rev. 2013, 42, 5996–6005. [Google Scholar] [CrossRef]
- Chukanov, N.V. Infrared Spectra of Mineral Species: Extended Library; Springer-Verlag GmbH: Dordrecht, The Netherlands; Heidelberg, Germany; New York, NY, USA; London, UK, 2014; p. 1716. ISBN 9400771274. [Google Scholar]
- Buhl, J.-C. Kinetic investigations of the formation of carbonate sodalite. React. Kinet. Catal. Lett. 1992, 48, 641–648. [Google Scholar] [CrossRef]
- Balassone, G.; Bellatreccia, F.; Mormone, A.; Biagioni, C.; Pasero, M.; Petti, C.; Mondillo, N.; Fameli, G. Sodalite-group minerals from the Somma-Vesuvius volcanic complex, Italy: A case study of K-feldspar-rich xenoliths. Mineral. Mag. 2012, 76, 191–212. [Google Scholar] [CrossRef]
- Armbruster, T.; Schreyer, W.; Hoefs, J. Very high CO2 cordierite from Norwegian Lapland: Mineralogy, petrology, and carbon isotopes. Contrib. Mineral. Petrol. 1982, 81, 262–267. [Google Scholar] [CrossRef]
- Sheft, I.; Perkins, A.J. Anhydrous hydrogen fluoride: Raman spectrum of the liquid. J. Inorg. Nucl. Chem. 1976, 38, 665–668. [Google Scholar] [CrossRef]
- IMA List of Minerals. Available online: http://cnmnc.main.jp/ (accessed on 16 April 2020).
- Cámara, F.; Bellatreccia, F.; Della Ventura, G.; Mottana, A. Farneseite, a new mineral of the cancrinite-sodalite group with a 14 layer stacking sequence. Eur. J. Mineral. 2005, 17, 839–846. [Google Scholar] [CrossRef]
- Della Ventura, G.; Bellatreccia, F.; Bonaccorsi, E. CO2 molecules in pitiglianoite, a mineral of the cancrinite-sodalite group. Eur. J. Mineral. 2005, 17, 847–851. [Google Scholar] [CrossRef]
- Della Ventura, G.; Bellatreccia, F.; Parodi, G.C.; Cámara, F.; Piccinini, M. Single-crystal FTIR and X-ray study of vishnevite, ideally [Na6(SO4)][Na2(H2O)2](Si6Al6O24). Amer. Mineral. 2007, 92, 713–721. [Google Scholar] [CrossRef]
- Della Ventura, G.; Bellatreccia, F.; Piccinini, M. Channel CO2 infeldspathoids: A review of existing data and new perspectives. Rend. Accad. Lincei 2008, 19, 141–159. [Google Scholar] [CrossRef]
- Cámara, F.; Bellatreccia, F.; Della Ventura, G.; Gunter, M.E.; Sebactiani, M.; Cavallo, A. Kircherite, a new mineral of the cancrinite-sodalite group with a 36-layer stacking sequence: Occurrence and crystal structure. Am. Mineral. 2012, 97, 1494–1504. [Google Scholar] [CrossRef][Green Version]
- Armbruster, T.; Bloss, F.D. Channel CO2 in cordierites. Nature 1980, 286, 140–141. [Google Scholar] [CrossRef]
- Le Breton, N. Infrared investigation of CO2-bearing cordierites. Contrib. Mineral. Petrol. 1989, 103, 387–396. [Google Scholar] [CrossRef]
- Kolesov, B.A.; Geiger, C.A. Cordierite II: The role of CO2 and H2O. Am. Mineral. 2000, 85, 1265–1274. [Google Scholar] [CrossRef]
- Khomenko, V.M.; Langer, K. Carbon oxides in cordierite channels: Determination of CO2 isotopic species and CO by single crystal IR spectroscopy. Am. Mineral. 2005, 90, 1913–1917. [Google Scholar] [CrossRef]
- Aines, R.D.; Rossman, G.R. The high temperature behaviour of water and carbon dioxide in cordierite and beryl. Am. Mineral. 1984, 69, 319–327. [Google Scholar]
- Charoy, B.; de Donato, P.; Barres, O.; Pintho-Choelo, C. Channel occupancy in an alkali-poor beryl from Serra Blanca (Goias, Brazil): Spectroscopic characterization. Am. Mineral. 1996, 81, 395–403. [Google Scholar] [CrossRef]
- Bellatreccia, F.; Della Ventura, G.; Gatta, G.D.; Guidi, M.C.; Harley, S. Carbon dioxide in pollucite, a feldspathoid with the ideal composition (Cs,Na)16Al16Si32O96×nH2O. Mineral. Mag. 2012, 76, 903–911. [Google Scholar] [CrossRef]
- Kolesov, B.A.; Geiger, C.A. Molecules in the SiO2-clathrate melanophlogite: A single-crystal Raman study. Am. Mineral. 2003, 88, 1364–1368. [Google Scholar] [CrossRef]
- McLaughlan, S.D.; Marshall, D.J. Paramagnetic resonance of sulfur radicals in synthetic sodalites. J. Phys. Chem. 1970, 74, 1359–1363. [Google Scholar] [CrossRef]
- Platonov, A.N.; Tarashchan, A.N.; Belichenko, V.P.; Povarennikh, A.S. Spectroscopic study of sulfide sulfur in some framework aluminosilicates. Const. Prop. Miner. 1971, 5, 61–72. (In Russian) [Google Scholar]
- Samoilovich, M.I. An ESR study of sulfur-bearing radical ions in minerals. Geokhimiya 1971, 4, 477–483. (In Russian) [Google Scholar]
- Clark, R.J.H.; Dines, T.J.; Kurmoo, M. On the nature of the sulphur chromophores in ultramarine blue, green, violet, and pink and of the selenium chromophore in ultramarine selenium: Characterization of radical anions by electronic and resonance Raman spectroscopy and the determination of their excited-state geometries. Inorg. Chem. 1983, 22, 2766–2772. [Google Scholar]
- Reinen, D.; Lindner, G.-G. The nature of the chalcogen colour centres in ultramarine-type solids. Chem. Soc. Rev. 1999, 28, 75–84. [Google Scholar] [CrossRef]
- Reshetnyak, N.B.; Tretyakova, L.I.; Vokhmentsev, A.Y. Investigation of colour centrums in natural lazurite by means of Raman spectroscopy. Mineral. Zhurnal 1986, 8, 49–60. (In Russian) [Google Scholar]
- Tauson, V.L.; Sapozhnikov, A.N. On the nature of lazurite colouring. Zap. Ross. Mineral. Obs. 2003, 132, 102–107. (In Russian) [Google Scholar]
- Fleet, M.E. XANES spectroscopy of fulfur in earth minerals. Canad. Mineral. 2005, 43, 1811–1838. [Google Scholar] [CrossRef]
- Steudel, R.; Chivers, T. Correction for ‘The role of polysulfide dianions and radical anions in the chemical, physical and biological sciences, including sulfur-based batteries’. Chem. Soc. Rev. 2019, 48, 3279–3319. [Google Scholar] [CrossRef] [PubMed]
- Tauson, V.L.; Sapozhnikov, A.N.; Shinkareva, S.N.; Lustenberg, E.E. Indicative properties of lazurite as a member of clathrasil mineral family. Dokl. Earth Sci. 2011, 441, 1732–1737. [Google Scholar] [CrossRef]


© 2020 by the authors. Licensee MDPI, Basel, Switzerland. This article is an open access article distributed under the terms and conditions of the Creative Commons Attribution (CC BY) license (http://creativecommons.org/licenses/by/4.0/).