Abstract
Rapid and reliable analytical methods are required to support quality control and decision-making in lithium-bearing mineral processing. In this study, the application of Fourier Transform Infrared (FTIR) spectroscopy combined with Partial Least Squares (PLS) chemometric modeling is evaluated for the simultaneous prediction of lithium oxide (Li2O) and spodumene contents in pegmatitic samples. Two independent PLS models were developed using FTIR spectra preprocessed with first derivative and/or Standard Normal Variate (SNV). Spectral regions were selected based on the vibrational response of Al–O, Si–O, and OH− groups, which are indirectly influenced by lithium-bearing phases. The spectral datasets were divided into calibration and independent external test sets, and model performance was assessed using statistical metrics and Principal Component Analysis (PCA). The Li2O model achieved an R2 of 0.9934 and an RMSEP of 0.185 in external validation, with a mean absolute error below 0.15%. The spodumene model achieved an R2 of 0.9961, an RMSEP of 1.79, and a mean absolute error of 2.80%. These results demonstrate that the FTIR-PLS approach enables efficient quantitative estimation of lithium-bearing minerals, with reduced analytical time, good predictive accuracy, and suitability for application in process control and mineralogical sorting environments. PCA confirmed the statistical representativeness of the test sets, with no evidence of spectral extrapolation.
1. Introduction
Advances in the mineralogical characterization of strategic ores, such as lithium-bearing materials, have driven the development of faster and more representative analytical methods that can be integrated into operational routines. The growing demand for lithium, driven by the battery and energy technology industries, reinforces the need for tools that enable rapid, cost-effective, and efficient grade monitoring throughout the beneficiation chain, particularly in complex geological settings such as lithium-bearing pegmatites [1,2,3].
Fourier Transform Infrared (FTIR) spectroscopy has emerged as a viable alternative to conventional analytical techniques due to its rapid response, low operational cost, and sensitivity to structural and chemical variations in silicate materials. FTIR spectral features arise from vibrational modes of functional groups within the mineral structure, particularly in the 1100–400 cm−1 region associated with Si–O and Al–O stretching and bending vibrations, as well as bands in the 3600–3200 cm−1 region related to OH− groups. Although lithium does not exhibit direct infrared-active vibrational bands, its presence influences the position and intensity of structural features and can therefore be indirectly inferred through aluminosilicate-related spectral regions [2,3,4,5,6,7].
However, the direct use of FTIR spectra for grade prediction presents challenges, including band overlap, the presence of accessory mineral phases, and physical interferences such as particle size effects, moisture, and crystal orientation. To mitigate these effects, mathematical preprocessing techniques, such as Standard Normal Variate (SNV), are commonly applied to enhance chemically relevant information and reduce instrumental and physical noise [3,5,8].
Following spectral preprocessing, multivariate regression methods can be employed, with Partial Least Squares (PLS) regression being one of the most widely adopted techniques in spectroscopic analysis. PLS projects spectral data onto latent factors that explain variability in both the spectral matrix and the response variable. Model performance is typically assessed using statistical parameters such as the coefficient of determination (R2), Root Mean Square Error (RMSE), and bias, which provide insight into predictive accuracy, stability, and applicability [5,6]. To ensure reliable model development, the reference grades used as response variables must be obtained using validated analytical methods. The integration of laboratory reference data with FTIR spectra enables the construction of robust predictive models that link rapid spectroscopic measurements to accurate mineralogical and chemical grade information [3,6].
Assessment of model generalization capability is essential for applications in mineral process control. The use of independent test sets allows verification of model robustness when applied to new samples. Among multivariate evaluation tools, Principal Component Analysis (PCA) is widely used to assess data representativeness and the consistency of sample distribution between calibration and test sets [5,9]. The combined use of FTIR, Inductively Coupled Plasma Optical Emission Spectrometry (ICP-OES), X-ray Diffraction (XRD), and PLS modeling, together with PCA-based multivariate evaluation, enables the establishment of an analytical framework for mineralogical and chemical prediction with direct relevance to operational environments. This approach contributes to reduced response time, increased monitoring frequency, and improved control of mining, blending, separation, and final product shipment decisions.
In this context, the novelty of the present study lies in the application of FTIR coupled with Partial Least Squares (PLS) regression to predict Li2O and spodumene contents in lithium-bearing pegmatites from Araçuaí, Minas Gerais, Brazil, considering samples from different stages of exploration and beneficiation. From an operational perspective, the FTIR-PLS methodology enables rapid decision-making to support ore stockpile management, blend formation, and beneficiation plant control, acting as a fast, non-destructive, and cost-effective tool that complements conventional analytical techniques such as ICP-OES and XRD by reducing turnaround time and analytical costs while improving process responsiveness.
2. Materials and Methods
2.1. Samples and Geological Context
The samples investigated in this study consist of lithium-bearing pegmatitic ores collected from different stages of exploration and beneficiation of deposits located in the Araçuaí region, Minas Gerais, Brazil. This region is characterized by a complex pegmatitic mineral assemblage, with significant variability in gangue mineralogy, which makes it particularly suitable for evaluating the robustness and applicability of spectroscopic–chemometric models under realistic geological conditions.
The sample set includes materials representative of varying lithium grades and mineralogical compositions, ensuring that both calibration and validation datasets encompass a wide compositional range relevant to mineral process control applications.
2.2. Reference Analytical Methods
Lithium oxide (Li2O) contents were determined by Inductively Coupled Plasma Optical Emission Spectrometry (ICP-OES) using an Agilent 5110 instrument (Agilent Technologies, Santa Clara, CA, USA). Sample preparation consisted of alkaline fusion with sodium peroxide (Na2O2) and sodium hydroxide (NaOH) in zirconium crucibles at 550 °C, followed by acid digestion using nitric acid (HNO3, 2 mol L−1) and tartaric acid (C4H6O6).
Spodumene contents were quantified by X-ray Diffraction (XRD) using a Panalytical Aeris diffractometer (Panalytical, Almelo, The Netherlands) equipped with Cu Kα radiation (λ = 1.5406 Å), a nickel Kβ filter, and a PIXcel 1D detector (Panalytical, Almelo, The Netherlands). Data were collected over the 5–70° (2θ) range. Quantitative phase analysis was performed by Rietveld refinement using the HighScore software (Malvern Panalytical; Panalytical, Almelo, The Netherlands), with crystallographic data obtained from the Crystallography Open Database (COD).
The elemental and phase reference data used for model development and validation were obtained from routine analytical measurements generated during mineral processing control activities conducted by SGS Geosol throughout 2024 and were compiled specifically for the construction and evaluation of the FTIR-PLS methodology.
The results obtained by ICP-OES (Li2O) and XRD-Rietveld (spodumene) were used as reference values (Y-variables) for the development, calibration, and validation of the FTIR-PLS models.
2.3. FTIR Spectral Acquisition and Pre-Processing
Fourier Transform Infrared (FTIR) spectra were acquired using a Bruker ALPHA II spectrometer (Bruker Optik GmbH, Ettlingen, Germany) operating in Attenuated Total Reflectance (ATR) mode with a diamond ATR crystal. Spectra were collected in the range of 4000–400 cm−1, with consistent acquisition parameters for all samples.
Spectral preprocessing was performed using the OPUS software (ver. 9.2) to reduce physical interferences and enhance chemically relevant information. The applied preprocessing strategies included first derivative transformation and Standard Normal Variate (SNV) normalization, which are widely used to minimize baseline effects, scattering phenomena, and particle size variability in powdered mineral samples.
2.4. Selection of Spectral Regions
Spectral regions used for model construction were selected through an iterative and statistically driven procedure. Multiple spectral regions were initially evaluated based on signal intensity and structural sensitivity associated with Al–O, Si–O, and OH− vibrational modes characteristic of aluminosilicate minerals.
Final spectral ranges were chosen according to the following combined criteria:
- maximization of the correlation coefficient (R);
- minimization of prediction errors (RMSECV and RMSEP);
- reduction in model bias; and
- minimization of outliers related to mineral matrix differentiation.
Preference was given to spectral regions less sensitive to mineralogical variability of the mineral matrix, thereby improving model stability and reducing prediction errors for both Li2O and spodumene contents.
2.5. PLS Model Development and Validation
Two independent Partial Least Squares (PLS) regression models were developed: one for predicting Li2O content and another for predicting spodumene content. The preprocessed FTIR spectra were correlated with the corresponding reference values obtained by ICP-OES (Li2O) and XRD (spodumene).
The dataset was randomly divided into calibration and external validation (test) sets, ensuring representative distributions of grades and mineralogical variability. Model calibration was performed using the calibration set, while predictive performance was evaluated exclusively on the independent test set.
The number of PLS factors for each model was selected based on the stabilization of prediction error and the avoidance of overfitting, using RMSECV, RMSEP, coefficients of determination (R2), and bias as selection criteria. For the spodumene model, nine factors were retained, providing the optimal balance between predictive accuracy and model robustness.
2.6. Multivariate Evaluation by PCA
Principal Component Analysis (PCA) was applied to the preprocessed spectral data to assess the multivariate representativeness of the calibration and test sets. PCA score plots were used to evaluate data distribution, overlap between datasets, and the absence of extrapolation or anomalous outliers.
The consistency between calibration and validation samples within the multivariate space was considered a key indicator of model robustness and generalization capability.
A general workflow summarizing the methodological steps adopted in this study is presented in Figure 1. The flowchart illustrates the sequence of operations from sample origin and reference data acquisition to FTIR spectral collection, preprocessing, chemometric modeling, validation, and interpretation.
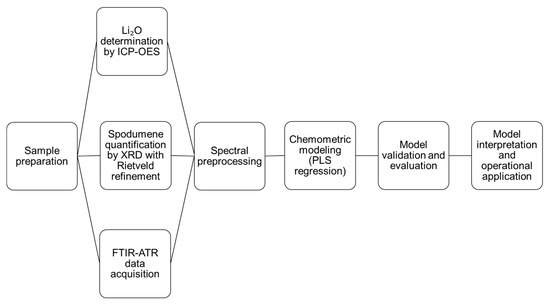
Figure 1.
Schematic workflow of the FTIR–PLS approach for Li2O and spodumene quantification.
3. Results
3.1. Prediction of Li2O by FTIR
The multivariate model for predicting Li2O content was constructed using 446 FTIR spectra from 119 samples, with 219 spectra allocated to calibration and 227 to the external test set. The spectra were preprocessed using the first derivative and SNV. The spectral ranges selected for calibration, highlighted as the white regions in Figure 2, correspond to 1627.6–1369.7 cm−1 and 1103.5–665.4 cm−1.
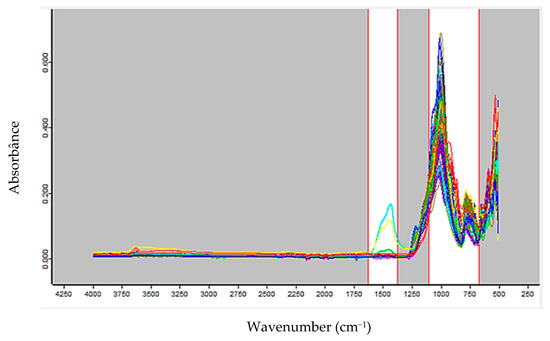
Figure 2.
Spectral region selected for the calibration of the Li2O prediction model, after preprocessing the FTIR spectra with first derivative and SNV.
The final model was fitted and yielded an R2 of 99.34%, an RMSEE of 0.144. Application to the external test set resulted in an R2 of 98.93%, an RMSEP of 0.185, and a bias of −0.0385. The relationship between predicted and observed values is shown in Figure 3.
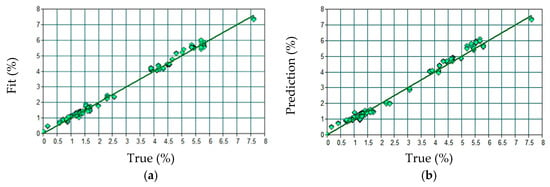
Figure 3.
Relationship between predicted and observed values for Li2O content in the external test set: (a) Calibration and (b) Validation.
Principal Component Analysis (PCA), illustrated in Figure 4, demonstrated a partial overlap between the calibration (green diamonds) and test (blue triangles) sets, with a homogeneous distribution and an absence of identifiable outliers.
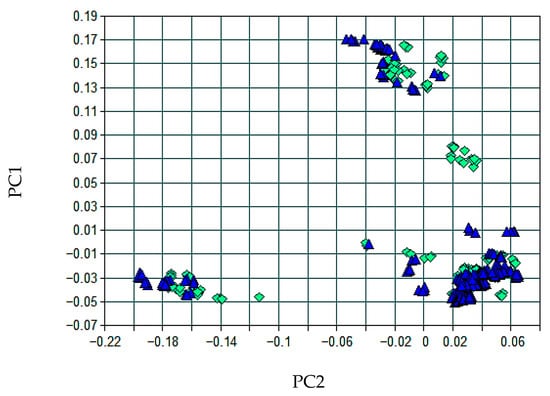
Figure 4.
Distribution of principal component scores (PC1 vs. PC2) for calibration (green diamonds) and test (blue triangles) samples in the Li2O model.
The comparison (see Appendix A) between the actual and predicted values for Li2O content in the external validation set confirms the model’s good accuracy, with a mean absolute error of less than 0.15%, low bias, and a homogeneous distribution of residuals around the trend line. The linear correlation between the observed and estimated values, as previously illustrated in Figure 2, reflects the model’s statistical stability even outside the calibration database.
3.2. Spodumene Prediction by FTIR
For the model predicting spodumene content (%), 238 FTIR spectra from 78 samples were used, with 121 spectra allocated to the calibration set and 117 to the external validation set. The selected spectral ranges, highlighted as the white regions in Figure 5, correspond to 3756.9–3056.7 cm−1, 2450.7–2207 cm−1, and 1265.3–534.4 cm−1.
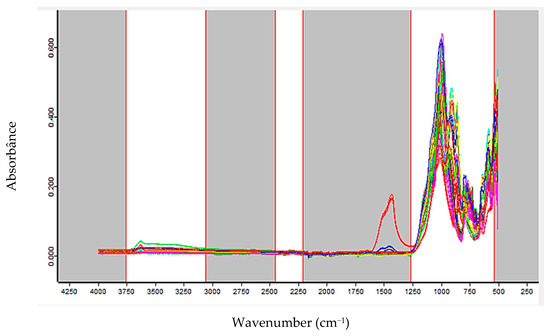
Figure 5.
Spectral ranges used for constructing the spodumene prediction model.
The model was fitted using 9 latent factors. The calibration resulted in an R2 of 99.61%, an RMSEE of 1.79, and the external validation yielded an R2 of 98.6%, an RMSEP of 3.53, and a bias of 0.0706. Figure 6 shows the linear relationship between the predicted and observed values in the test set.
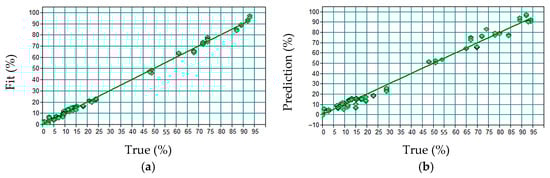
Figure 6.
Relationship between predicted and observed values for spodumene content in the external test set: (a) Calibration and (b) Validation.
The multivariate separation between the calibration and test sets was verified by PCA, presented in Figure 7, which showed a centered distribution of scores and an absence of extreme dispersions.
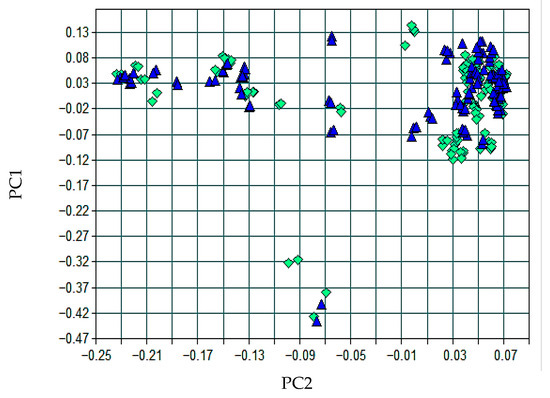
Figure 7.
Principal component scores (PC1 vs. PC2) for the spodumene model, showing overlap between calibration (green diamonds) and test (blue triangles) sets.
The external test set (see Appendix A) for the spodumene model exhibited a mean absolute error of less than 2.80%, which is compatible with industrial applications. The residuals remained symmetrically distributed with no systematic trend, reinforcing the model’s performance on samples not included in the calibration.
4. Discussion
The development of multivariate models based on FTIR spectroscopy demonstrated high statistical performance for the prediction of Li2O and spodumene, validating the applicability of this approach in routine mineral characterization and process control contexts. Modeling with Partial Least Squares (PLS) regression enabled the capture of spectral variations indirectly associated with the presence of lithium and the proportion of spodumene, even in the absence of specific vibrational bands for the Li+ cation. In the spodumene model, the utilized spectral regions included stretching and bending bands of the aluminosilicate structure, as well as signals related to OH− groups. The spectral response showed good correlation with the content of the target mineral phase, albeit subject to the influence of co-occurring minerals such as micas. The greater dispersion of the residuals suggests the model is more sensitive to compositional variations and structural interferences. Nevertheless, principal component analysis indicated compatibility between the datasets.
The robustness of the models developed here is associated with the combination of adequate preprocessing techniques, such as the first derivative and SNV, the careful selection of spectral regions, and validation with a representative external set. The obtained RMSEP values classify them as reliable for analytical application. The R2 values of 0.986 (spodumene) and 0.989 (Li2O), together with RMSEP values of 3.53 and 0.185, respectively, demonstrate a predictive accuracy that aligns well with data found in the literature for FTIR analyses. For instance, models reported in the literature show R2 values of 0.98 and RMSEP of 6.0 [10]; R2 between 0.86 and 0.99 and RMSEP between 1.2 and 4.3 [4]; and R2 values from 0.86 to 0.99 and RMSEP from 0.9 to 5.1 [2]. The performance of the current models is comparable or superior, which validates their reliability for predicting the studied parameters.
Despite the rigorous data preprocessing, some data points show deviations from the regression trend line, as observed in Figure 3b and Figure 6b. These deviations may be associated with multiple factors, including compositional heterogeneity and a lower sampling density within specific concentration ranges. In such intervals, a limited number of samples may not fully represent the intrinsic variability of the system, which can result in increased dispersion relative to the trend line. Future studies incorporating a higher density of samples in these concentration ranges may help to further improve model robustness and predictive performance.
From a technical standpoint, the results demonstrate that FTIR spectroscopy coupled with PLS modeling is a viable alternative for the partial substitution or complementary use of destructive and/or costly methods, such as ICP-OES and XRD with Rietveld refinement, for the characterization of pegmatitic ores. The methodology demonstrated sufficient sensitivity to capture complex structural variations in minerals with spectral similarity, while maintaining statistical stability and reducing analytical response time. Although the model’s precision is acceptable for exploratory applications and mineralogical sorting, the mean absolute error of 2.80% indicates room for improvement. The potential spectral interference from co-occurring phases may contribute to residual variations and reduced accuracy. Expanding the calibration database, coupled with complementary mineralogical characterization, could increase the model’s selectivity and robustness in operational scenarios.
5. Conclusions
The application of FTIR spectroscopy combined with multivariate PLS regression modeling showed high predictive performance for Li2O and spodumene grades in pegmatitic samples, using spectral preprocessing with first derivative and/or Standard Normal Variate (SNV). The selected spectral regions effectively captured relevant structural variations within the mineral matrix, even in the absence of specific vibrational bands associated with the lithium cation.
The externally calibrated and validated models exhibited statistical metrics compatible with analytical requirements for process control, with coefficients of determination (R2) greater than 0.98 and low Root Mean Square Errors of Prediction (RMSEP), indicating high predictive capability. Exploratory analysis by Principal Component Analysis (PCA) confirmed the statistical representativeness of the test sets, with no evidence of spectral extrapolation or formation of anomalous clusters.
The achieved accuracy, with mean absolute errors below 0.15% for Li2O and 2.8% for spodumene, demonstrates the robustness of the developed models and their suitability for operational applications, including sample sorting, mineralogical assessment of blends, and monitoring of intermediate product quality. Accordingly, the results confirm the technical feasibility of the FTIR-PLS approach as a fast, non-destructive, and low-cost alternative method for the simultaneous estimation of Li2O and spodumene in lithium-bearing minerals, with potential for direct application in production environments and mineralogical research.
Although the results for spodumene were satisfactory in the external test set, the magnitude of the mean absolute error suggests that further refinement is needed. The presence of interfering mineral phases and inherent compositional variability may affect the spectral response. Expanding the sample database and further refining spectral region selection are promising avenues for improving model performance in future studies
Author Contributions
Author Contributions: Conceptualization, B.P.d.O. and E.S.; Methodology, B.P.d.O.; Validation, B.P.d.O.; Formal analysis, B.P.d.O.; Investigation, B.P.d.O.; Resources, E.S.; Data curation, B.P.d.O.; Writing—original draft preparation, B.P.d.O.; Writing—review and editing, B.P.d.O.; Supervision, E.L.; Project administration, E.S. and E.L. All authors have read and agreed to the published version of the manuscript.
Funding
This research received no external funding.
Data Availability Statement
The data used to support the findings of this study are available from the corresponding authors upon request.
Acknowledgments
The authors thank SGS Geosol Laboratórios for providing the samples and the laboratory infrastructure necessary for conducting the spectroscopic and chemical analyses.
Conflicts of Interest
Beatriz Oliveira and Elisiane Lelis are employees of SGS Geosol. The authors declare that they have no known competing financial interests or personal relationships that could have appeared to influence the work reported in this paper.
Appendix A

Table A1.
Comparison between actual and predicted Li2O values (% by weight) in the external validation set, based on the PLS model applied to the preprocessed FTIR spectra.
Table A1.
Comparison between actual and predicted Li2O values (% by weight) in the external validation set, based on the PLS model applied to the preprocessed FTIR spectra.
| Test Set Validation | ||||
|---|---|---|---|---|
| Sample | Spectrum | Reference Value (ICP-OES) | Predicted Value | Difference |
| 1 | 1 | 2.20 | 2.01 | 0.19 |
| 1 | 2 | 2.20 | 2.02 | 0.18 |
| 1 | 3 | 2.20 | 1.95 | 0.25 |
| 1 | 4 | 2.20 | 2.08 | 0.12 |
| 2 | 5 | 1.20 | 1.31 | −0.11 |
| 2 | 6 | 1.20 | 1.22 | −0.02 |
| 2 | 7 | 1.20 | 1.27 | −0.07 |
| 2 | 8 | 1.20 | 1.26 | −0.06 |
| 3 | 9 | 0.70 | 0.89 | −0.19 |
| 3 | 10 | 0.70 | 0.88 | −0.18 |
| 3 | 11 | 0.70 | 0.90 | −0.20 |
| 3 | 12 | 0.70 | 0.85 | −0.15 |
| 4 | 13 | 1.30 | 1.36 | −0.06 |
| 4 | 14 | 1.30 | 1.42 | −0.12 |
| 4 | 15 | 1.30 | 1.39 | −0.09 |
| 4 | 16 | 1.30 | 1.38 | −0.08 |
| 5 | 17 | 1.00 | 1.08 | −0.08 |
| 5 | 18 | 1.00 | 1.11 | −0.11 |
| 5 | 19 | 1.00 | 1.09 | −0.05 |
| 5 | 20 | 1.00 | 1.05 | −0.05 |
| 6 | 21 | 1.40 | 1.45 | −0.05 |
| 6 | 22 | 1.40 | 1.49 | −0.09 |
| 6 | 23 | 1.40 | 1.49 | −0.09 |
| 6 | 24 | 1.40 | 1.47 | −0.07 |
| 7 | 25 | 0.93 | 0.92 | 0.01 |
| 7 | 26 | 0.93 | 0.94 | −0.01 |
| 7 | 27 | 0.93 | 0.95 | −0.02 |
| 7 | 28 | 0.93 | 0.95 | −0.02 |
| 8 | 29 | 1.22 | 0.95 | 0.27 |
| 8 | 30 | 1.22 | 0.93 | 0.29 |
| 8 | 31 | 1.22 | 0.93 | 0.29 |
| 8 | 32 | 1.22 | 0.98 | 0.24 |
| 9 | 33 | 1.73 | 1.42 | 0.31 |
| 9 | 34 | 1.73 | 1.43 | 0.30 |
| 9 | 35 | 1.73 | 1.46 | 0.27 |
| 9 | 36 | 1.73 | 1.40 | 0.33 |
| 10 | 37 | 2.33 | 2.00 | 0.34 |
| 10 | 38 | 2.33 | 1.98 | 0.35 |
| 10 | 39 | 2.33 | 2.00 | 0.33 |
| 10 | 40 | 2.33 | 1.93 | 0.40 |
| 11 | 41 | 4.98 | 4.82 | 0.16 |
| 11 | 42 | 4.98 | 4.82 | 0.16 |
| 11 | 43 | 4.98 | 4.85 | 0.14 |
| 11 | 44 | 4.98 | 4.84 | 0.14 |
| 12 | 45 | 1.67 | 1.48 | 0.20 |
| 12 | 46 | 1.67 | 1.50 | 0.17 |
| 12 | 47 | 1.67 | 1.45 | 0.22 |
| 12 | 48 | 1.67 | 1.45 | 0.22 |
| 13 | 49 | 1.61 | 1.60 | 0.01 |
| 13 | 50 | 1.61 | 1.60 | 0.01 |
| 13 | 51 | 1.61 | 1.62 | 0.00 |
| 13 | 52 | 1.61 | 1.61 | 0.00 |
| 14 | 53 | 0.92 | 1.02 | −0.10 |
| 14 | 54 | 0.92 | 0.99 | −0.07 |
| 14 | 55 | 0.92 | 1.02 | −0.10 |
| 14 | 56 | 0.92 | 1.04 | −0.12 |
| 15 | 57 | 0.84 | 0.88 | −0.04 |
| 15 | 58 | 0.84 | 0.90 | −0.06 |
| 15 | 59 | 0.84 | 0.88 | −0.04 |
| 15 | 60 | 0.84 | 0.87 | −0.03 |
| 16 | 61 | 1.29 | 1.33 | −0.03 |
| 16 | 62 | 1.29 | 1.31 | −0.02 |
| 16 | 63 | 1.29 | 1.35 | −0.06 |
| 16 | 64 | 1.29 | 1.31 | −0.02 |
| 17 | 65 | 5.45 | 5.37 | 0.08 |
| 17 | 66 | 5.45 | 5.62 | −0.17 |
| 17 | 67 | 5.45 | 5.42 | 0.03 |
| 17 | 68 | 5.45 | 5.48 | −0.03 |
| 18 | 69 | 5.82 | 5.64 | 0.18 |
| 18 | 70 | 5.82 | 5.54 | 0.28 |
| 18 | 71 | 5.82 | 5.69 | 0.13 |
| 18 | 72 | 5.82 | 5.58 | 0.24 |
| 19 | 73 | 1.34 | 1.34 | 0.00 |
| 19 | 74 | 1.34 | 1.37 | −0.03 |
| 19 | 75 | 1.34 | 1.37 | −0.03 |
| 19 | 76 | 1.34 | 1.33 | 0.01 |
| 20 | 77 | 1.27 | 1.27 | 0.00 |
| 20 | 78 | 1.27 | 1.25 | 0.02 |
| 20 | 79 | 1.27 | 1.22 | 0.05 |
| 20 | 80 | 1.27 | 1.19 | 0.08 |
| 21 | 81 | 1.05 | 1.08 | −0.03 |
| 21 | 82 | 1.05 | 1.09 | −0.04 |
| 21 | 83 | 1.05 | 1.11 | −0.06 |
| 21 | 84 | 1.05 | 1.11 | −0.06 |
| 22 | 85 | 1.09 | 1.13 | −0.04 |
| 22 | 86 | 1.09 | 1.11 | −0.02 |
| 22 | 87 | 1.09 | 1.12 | −0.03 |
| 22 | 88 | 1.09 | 1.13 | −0.04 |
| 23 | 89 | 1.00 | 1.09 | −0.09 |
| 23 | 90 | 1.00 | 1.10 | −0.10 |
| 23 | 91 | 1.00 | 1.06 | −0.06 |
| 23 | 92 | 1.00 | 1.10 | −0.10 |
| 24 | 93 | 0.76 | 0.84 | −0.08 |
| 24 | 94 | 0.76 | 0.83 | −0.07 |
| 24 | 95 | 0.76 | 0.81 | −0.05 |
| 24 | 96 | 0.76 | 0.84 | −0.08 |
| 25 | 97 | 4.18 | 4.41 | −0.23 |
| 25 | 98 | 4.18 | 4.36 | −0.18 |
| 25 | 99 | 4.18 | 4.40 | −0.22 |
| 25 | 100 | 4.18 | 4.39 | −0.21 |
| 26 | 101 | 3.82 | 3.98 | −0.16 |
| 26 | 102 | 3.82 | 3.99 | −0.17 |
| 26 | 103 | 3.82 | 4.06 | −0.24 |
| 26 | 104 | 3.82 | 4.00 | −0.18 |
| 27 | 105 | 3.91 | 4.03 | −0.12 |
| 27 | 106 | 3.91 | 4.09 | −0.18 |
| 28 | 107 | 4.67 | 4.73 | −0.05 |
| 28 | 108 | 4.67 | 4.72 | −0.05 |
| 28 | 109 | 4.67 | 4.75 | −0.08 |
| 28 | 110 | 4.67 | 4.66 | 0.01 |
| 28 | 111 | 4.67 | 4.75 | −0.08 |
| 29 | 112 | 4.69 | 4.93 | −0.24 |
| 29 | 113 | 4.69 | 4.90 | −0.21 |
| 29 | 114 | 4.69 | 4.88 | −0.19 |
| 29 | 115 | 4.69 | 4.70 | −0.01 |
| 30 | 116 | 4.65 | 4.88 | −0.23 |
| 30 | 117 | 4.65 | 4.86 | −0.21 |
| 30 | 118 | 4.65 | 4.84 | −0.19 |
| 30 | 119 | 4.65 | 4.87 | −0.22 |
| 31 | 120 | 4.61 | 4.70 | −0.09 |
| 31 | 121 | 4.61 | 4.73 | −0.12 |
| 31 | 122 | 4.61 | 4.70 | −0.09 |
| 31 | 123 | 4.61 | 4.83 | −0.22 |
| 32 | 124 | 4.45 | 4.60 | −0.15 |
| 32 | 125 | 4.45 | 4.66 | −0.21 |
| 32 | 126 | 4.45 | 4.68 | −0.23 |
| 32 | 127 | 4.45 | 4.69 | −0.24 |
| 33 | 128 | 4.33 | 4.65 | −0.32 |
| 33 | 129 | 4.33 | 4.66 | −0.33 |
| 33 | 130 | 4.33 | 4.67 | −0.34 |
| 33 | 131 | 4.33 | 4.61 | −0.28 |
| 34 | 132 | 0.16 | 0.50 | −0.34 |
| 34 | 133 | 0.16 | 0.48 | −0.32 |
| 34 | 134 | 4.14 | 4.01 | 0.13 |
| 34 | 135 | 4.14 | 4.06 | 0.08 |
| 35 | 136 | 4.14 | 4.09 | 0.05 |
| 35 | 137 | 4.14 | 3.93 | 0.22 |
| 36 | 138 | 1.61 | 1.62 | −0.01 |
| 36 | 139 | 1.61 | 1.60 | 0.01 |
| 36 | 140 | 1.61 | 1.58 | 0.03 |
| 36 | 141 | 1.61 | 1.61 | 0.00 |
| 37 | 142 | 1.00 | 1.12 | −0.12 |
| 37 | 143 | 1.00 | 1.10 | −0.10 |
| 37 | 144 | 1.00 | 1.09 | −0.09 |
| 37 | 145 | 1.00 | 1.13 | −0.13 |
| 38 | 146 | 0.95 | 0.99 | −0.04 |
| 38 | 147 | 0.95 | 0.98 | −0.03 |
| 38 | 148 | 0.95 | 0.90 | 0.05 |
| 38 | 149 | 0.95 | 0.93 | 0.02 |
| 39 | 150 | 0.83 | 0.96 | −0.13 |
| 39 | 151 | 0.83 | 0.91 | −0.08 |
| 39 | 152 | 0.83 | 0.90 | −0.07 |
| 39 | 153 | 0.83 | 0.92 | −0.09 |
| 40 | 154 | 0.71 | 0.91 | −0.20 |
| 40 | 155 | 0.71 | 0.94 | −0.23 |
| 40 | 156 | 0.71 | 0.93 | −0.22 |
| 40 | 157 | 0.71 | 0.95 | −0.24 |
| 41 | 158 | 5.20 | 5.64 | −0.44 |
| 41 | 159 | 5.20 | 5.52 | −0.32 |
| 41 | 160 | 5.20 | 5.44 | −0.24 |
| 42 | 161 | 1.02 | 1.37 | −0.35 |
| 42 | 162 | 1.02 | 1.40 | −0.38 |
| 42 | 163 | 1.02 | 1.37 | −0.35 |
| 42 | 164 | 1.02 | 1.41 | −0.39 |
| 43 | 165 | 1.29 | 1.25 | 0.04 |
| 43 | 166 | 1.29 | 1.25 | 0.04 |
| 43 | 167 | 1.29 | 1.28 | 0.01 |
| 43 | 168 | 1.29 | 1.35 | −0.06 |
| 44 | 169 | 1.32 | 1.21 | 0.11 |
| 44 | 170 | 1.32 | 1.14 | 0.18 |
| 44 | 171 | 1.32 | 1.27 | 0.05 |
| 44 | 172 | 1.32 | 1.20 | 0.12 |
| 45 | 173 | 5.55 | 5.94 | −0.39 |
| 45 | 174 | 5.55 | 5.92 | −0.37 |
| 45 | 175 | 5.55 | 5.96 | −0.41 |
| 45 | 176 | 5.55 | 5.87 | −0.32 |
| 45 | 177 | 5.55 | 5.83 | −0.28 |
| 45 | 178 | 5.55 | 5.91 | −0.36 |
| 45 | 179 | 5.55 | 5.84 | −0.29 |
| 46 | 180 | 5.68 | 5.94 | −0.26 |
| 46 | 181 | 5.68 | 6.08 | −0.40 |
| 46 | 182 | 5.68 | 5.98 | −0.30 |
| 46 | 183 | 5.68 | 5.95 | −0.27 |
| 47 | 184 | 1.42 | 1.54 | −0.12 |
| 47 | 185 | 1.42 | 1.27 | 0.16 |
| 47 | 186 | 1.42 | 1.33 | 0.09 |
| 47 | 187 | 1.42 | 1.25 | 0.17 |
| 48 | 188 | 5.37 | 5.64 | −0.27 |
| 48 | 189 | 5.37 | 5.69 | −0.32 |
| 48 | 190 | 5.37 | 5.78 | −0.41 |
| 49 | 191 | 1.59 | 1.42 | 0.17 |
| 49 | 192 | 1.59 | 1.45 | 0.14 |
| 49 | 193 | 1.59 | 1.44 | 0.15 |
| 49 | 194 | 1.59 | 1.42 | 0.17 |
| 50 | 195 | 1.44 | 1.27 | 0.17 |
| 50 | 196 | 1.44 | 1.31 | 0.13 |
| 50 | 197 | 1.44 | 1.31 | 0.13 |
| 50 | 198 | 1.44 | 1.26 | 0.18 |
| 51 | 199 | 1.33 | 1.27 | 0.07 |
| 51 | 200 | 1.33 | 1.24 | 0.09 |
| 51 | 201 | 1.33 | 1.33 | 0.00 |
| 51 | 202 | 1.33 | 1.36 | −0.02 |
| 52 | 203 | 1.47 | 1.40 | 0.08 |
| 52 | 204 | 1.47 | 1.38 | 0.09 |
| 52 | 205 | 1.47 | 1.44 | 0.03 |
| 52 | 206 | 1.47 | 1.36 | 0.11 |
| 53 | 207 | 1.14 | 1.11 | 0.03 |
| 53 | 208 | 1.14 | 1.11 | 0.03 |
| 53 | 209 | 1.14 | 1.10 | 0.04 |
| 53 | 210 | 1.14 | 1.13 | 0.01 |
| 54 | 211 | 1.29 | 1.16 | 0.13 |
| 54 | 212 | 1.29 | 1.11 | 0.18 |
| 54 | 213 | 1.29 | 1.20 | 0.09 |
| 54 | 214 | 1.29 | 1.16 | 0.13 |
| 55 | 215 | 7.61 | 7.35 | 0.26 |
| 55 | 216 | 7.61 | 7.29 | 0.32 |
| 56 | 217 | 3.06 | 2.88 | 0.18 |
| 56 | 218 | 3.06 | 2.84 | 0.22 |
| 56 | 219 | 3.06 | 2.82 | 0.24 |
| 56 | 220 | 3.06 | 2.94 | 0.12 |
| 57 | 221 | 0.42 | 0.71 | −0.29 |
| 57 | 222 | 0.42 | 0.74 | −0.32 |
| 57 | 223 | 0.42 | 0.73 | −0.31 |
| 57 | 224 | 0.42 | 0.70 | −0.28 |
| 58 | 225 | 1.61 | 1.42 | 0.20 |
| 59 | 226 | 0.00 | 0.01 | −0.01 |
| 59 | 227 | 0.00 | 0.03 | −0.03 |
Table A2.
Comparison between actual and predicted spodumene values (% by weight) in the external validation set, obtained from processed FTIR spectra modeled by PLS regression.
Table A2.
Comparison between actual and predicted spodumene values (% by weight) in the external validation set, obtained from processed FTIR spectra modeled by PLS regression.
| Test Set Validation | ||||
|---|---|---|---|---|
| Sample | Spectrum | Reference Value (XRD) | Predicted Value | Difference |
| 1 | 1 | 9.60 | 4.67 | 4.93 |
| 2 | 2 | 6.60 | 8.29 | −1.69 |
| 2 | 3 | 6.60 | 7.36 | −0.76 |
| 2 | 4 | 6.60 | 7.88 | −1.28 |
| 2 | 5 | 6.60 | 8.86 | −2.26 |
| 3 | 6 | 2.70 | 3.63 | −0.93 |
| 3 | 7 | 2.70 | 3.72 | −1.02 |
| 3 | 8 | 2.70 | 4.80 | −2.10 |
| 3 | 9 | 2.70 | 3.05 | −0.35 |
| 4 | 10 | 11.90 | 14.10 | −2.20 |
| 4 | 11 | 11.90 | 13.70 | −1.80 |
| 4 | 12 | 11.90 | 13.69 | −1.79 |
| 4 | 13 | 11.90 | 14.17 | −2.27 |
| 5 | 14 | 7.00 | 5.49 | 1.51 |
| 5 | 15 | 7.00 | 7.13 | −0.13 |
| 5 | 16 | 7.00 | 6.32 | 0.68 |
| 5 | 17 | 7.00 | 6.79 | 0.21 |
| 6 | 18 | 0.00 | 1.76 | −1.76 |
| 6 | 19 | 0.00 | 1.83 | −1.83 |
| 7 | 20 | 15.00 | 6.05 | 8.96 |
| 7 | 21 | 15.00 | 6.54 | 8.46 |
| 7 | 22 | 15.00 | 10.05 | 4.95 |
| 8 | 23 | 29.00 | 23.17 | 5.83 |
| 8 | 24 | 29.00 | 24.00 | 5.00 |
| 8 | 25 | 29.00 | 25.49 | 3.51 |
| 8 | 26 | 29.00 | 22.50 | 6.50 |
| 9 | 27 | 17.30 | 15.72 | 1.58 |
| 9 | 28 | 17.30 | 14.72 | 2.58 |
| 9 | 29 | 17.30 | 14.74 | 2.56 |
| 9 | 30 | 17.30 | 14.52 | 2.78 |
| 10 | 31 | 17.70 | 15.64 | 2.06 |
| 10 | 32 | 17.70 | 14.29 | 3.41 |
| 10 | 33 | 17.70 | 14.57 | 3.13 |
| 10 | 34 | 17.70 | 15.04 | 2.66 |
| 11 | 35 | 9.10 | 9.22 | −0.12 |
| 11 | 36 | 9.10 | 9.92 | −0.82 |
| 11 | 37 | 9.10 | 10.25 | −1.15 |
| 11 | 38 | 9.10 | 9.95 | −0.85 |
| 12 | 39 | 9.40 | 11.17 | −1.77 |
| 12 | 40 | 9.40 | 10.96 | −1.56 |
| 12 | 41 | 9.40 | 10.84 | −1.44 |
| 12 | 42 | 9.40 | 10.11 | −0.71 |
| 13 | 43 | 12.40 | 13.87 | −1.47 |
| 13 | 44 | 12.40 | 14.11 | −1.71 |
| 13 | 45 | 12.40 | 13.52 | −1.12 |
| 13 | 46 | 12.40 | 13.34 | −0.94 |
| 14 | 47 | 69.70 | 64.76 | 4.94 |
| 14 | 48 | 69.70 | 65.92 | 3.78 |
| 14 | 49 | 69.70 | 65.39 | 4.31 |
| 14 | 50 | 69.70 | 65.51 | 4.19 |
| 15 | 51 | 15.26 | 14.10 | 1.16 |
| 15 | 52 | 15.26 | 14.42 | 0.84 |
| 15 | 53 | 15.26 | 16.07 | −0.81 |
| 15 | 54 | 15.26 | 15.37 | −0.11 |
| 16 | 55 | 13.14 | 14.67 | −1.53 |
| 16 | 56 | 13.14 | 15.98 | −2.84 |
| 16 | 57 | 13.14 | 15.14 | −2.00 |
| 16 | 58 | 13.14 | 13.95 | −0.81 |
| 17 | 59 | 8.38 | 9.84 | −1.46 |
| 17 | 60 | 8.38 | 9.30 | −0.92 |
| 17 | 61 | 8.38 | 8.44 | −0.06 |
| 17 | 62 | 8.38 | 10.86 | −2.48 |
| 18 | 63 | 9.92 | 10.44 | −0.52 |
| 18 | 64 | 9.92 | 11.18 | −1.26 |
| 18 | 65 | 9.92 | 10.52 | −0.60 |
| 18 | 66 | 9.92 | 10.56 | −0.64 |
| 19 | 67 | 9.19 | 10.59 | −1.40 |
| 19 | 68 | 9.19 | 11.62 | −2.43 |
| 19 | 69 | 9.19 | 11.50 | −2.31 |
| 19 | 70 | 9.19 | 9.93 | −0.74 |
| 20 | 71 | 19.60 | 12.78 | 6.82 |
| 20 | 72 | 19.60 | 13.66 | 5.94 |
| 20 | 73 | 19.60 | 16.60 | 3.00 |
| 21 | 74 | 11.50 | 8.29 | 3.21 |
| 21 | 75 | 11.50 | 9.01 | 2.49 |
| 21 | 76 | 11.50 | 7.25 | 4.25 |
| 21 | 77 | 11.50 | 8.83 | 2.67 |
| 22 | 78 | 0.70 | 4.89 | −4.19 |
| 22 | 79 | 0.70 | 5.81 | −5.11 |
| 22 | 80 | 0.70 | 5.07 | −4.37 |
| 22 | 81 | 0.70 | 5.76 | −5.06 |
| 23 | 82 | 72.00 | 76.45 | −4.45 |
| 23 | 83 | 72.00 | 76.50 | −4.50 |
| 24 | 84 | 67.00 | 74.76 | −7.76 |
| 24 | 85 | 67.00 | 74.24 | −7.24 |
| 24 | 86 | 67.00 | 72.11 | −5.11 |
| 25 | 87 | 23.00 | 17.82 | 5.18 |
| 25 | 88 | 23.00 | 18.73 | 4.27 |
| 25 | 89 | 23.00 | 18.19 | 4.81 |
| 26 | 90 | 72.00 | 75.62 | −3.62 |
| 26 | 91 | 72.00 | 76.49 | −4.49 |
| 27 | 92 | 48.00 | 50.81 | −2.81 |
| 27 | 93 | 48.00 | 51.22 | −3.22 |
| 28 | 94 | 89.00 | 91.64 | −2.64 |
| 28 | 95 | 89.00 | 93.86 | −4.86 |
| 29 | 96 | 74.00 | 82.68 | −8.68 |
| 29 | 97 | 74.00 | 83.00 | −9.00 |
| 30 | 98 | 54.00 | 53.34 | 0.66 |
| 30 | 99 | 54.00 | 53.28 | 0.72 |
| 31 | 100 | 78.00 | 77.01 | 0.99 |
| 31 | 101 | 78.00 | 79.18 | −1.18 |
| 32 | 102 | 92.00 | 95.64 | −3.64 |
| 32 | 103 | 92.00 | 96.93 | −4.93 |
| 33 | 104 | 65.00 | 64.11 | 0.89 |
| 33 | 105 | 65.00 | 64.23 | 0.77 |
| 34 | 106 | 84.00 | 77.14 | 6.86 |
| 34 | 107 | 84.00 | 76.29 | 7.71 |
| 35 | 108 | 80.00 | 79.37 | 0.63 |
| 35 | 109 | 80.00 | 77.99 | 2.01 |
| 36 | 110 | 94.00 | 92.25 | 1.75 |
| 36 | 111 | 94.00 | 90.29 | 3.71 |
| 37 | 112 | 51.00 | 52.48 | −1.48 |
| 37 | 113 | 51.00 | 49.93 | 1.07 |
| 38 | 114 | 93.00 | 90.29 | 2.71 |
| 38 | 115 | 93.00 | 89.62 | 3.38 |
| 39 | 116 | 0.00 | −1.16 | 1.16 |
| 39 | 117 | 0.00 | 2.86 | −2.86 |
References
- Sardisco, L.; Hannula, P.-M.; Pearce, T.; Morgan, L. Multi-Technique Analytical Approach to Quantitative Analysis of Spodumene. Minerals 2022, 12, 175. [Google Scholar] [CrossRef]
- Vahur, S.; Kiudorv, L.; Somelar, P.; Cayme, J.-M.; Retrato, M.; Remigio, R.; Sharma, V.; Oras, E.; Leito, I. Quantitative mineralogical analysis of clay-containing materials using ATR-FT-IR spectroscopy with PLS method. Anal. Bioanal. Chem. 2021, 413, 6535–6550. [Google Scholar] [CrossRef] [PubMed]
- Guatame-García, A.; Buxton, M. Prediction of Soluble Al2O3 in Calcined Kaolin Using Infrared Spectroscopy and Multivariate Calibration. Minerals 2018, 8, 136. [Google Scholar] [CrossRef]
- Müller, M.; Pejcic, B.; Esteban, L.; Piane, C.; Raven, M.; Mizaikoff, B. Infrared Attenuated Total Reflectance Spectroscopy: An Innovative Strategy for Analyzing Mineral Components in Energy Relevant Systems. Sci. Rep. 2014, 4, 6764. [Google Scholar] [CrossRef] [PubMed]
- Xu, X.; Changwen, D.; Fei, M.; Yazhen, S.; Ke, W.; Dong, L.; Jianmin, Z. Detection of soil organic matter from laser-induced breakdown spectroscopy (LIBS) and mid-infrared spectroscopy (FTIR-ATR) coupled with multivariate techniques. Geodema 2019, 355, 113905. [Google Scholar] [CrossRef]
- Zhao, M.; Markiewicz-Keszycka, M.; Beattie, R.; Casado-Gavalda, M.; Cama-Moncunill, X.; O’Donnell, C.; Cullen, P.; Sullivan, C. Quantification of calcium in infant formula using laser-induced breakdown spectroscopy (LIBS), Fourier transform mid-infrared (FT-IR) and Raman spectroscopy combined with chemometrics including data fusion. Food Chem. 2020, 320, 126639. [Google Scholar] [CrossRef] [PubMed]
- RITZ, M.; Vaculíková, L.; Plevová, E.; Matýsek, D. Determination of Chlorite, Muscovite, Albite and Quartz in Claystones and Clay Shales By Infrared Spectroscopy and Partialleast-Squares Regression. Acta Geodyn. Geomater. 2012, 9, 511–520. [Google Scholar]
- Dehaine, Q.; Tijsseling, L.T.; Rollinson, G.K.; Buxton, M.W.N.; Glass, H.J. Geometallurgical Characterisation with Portable FTIR: Application to Sediment-Hosted Cu-Co Ores. Minerals 2022, 12, 15. [Google Scholar] [CrossRef]
- Stacey, P.; Clegg, F.; Sammon, C. Multicomponent Measurement of Respirable Quartz, Kaolinite and Coal Dust using Fourier Transform Infrared Spectroscopy (FTIR): A Comparison Between Partial Least Squares and Principal Component Regressions. Ann. Work Expo. Health 2022, 66, 644–655. [Google Scholar] [CrossRef] [PubMed]
- Weakley, A.T.; Miller, A.L.; Griffiths, P.R.; Bayman, S.J. Quantifying silica in filter-deposited mine dusts using infrared spectra and partial least squares regression. Anal. Bioanal. Chem. 2014, 406, 4715–4724. [Google Scholar] [CrossRef] [PubMed]
Disclaimer/Publisher’s Note: The statements, opinions and data contained in all publications are solely those of the individual author(s) and contributor(s) and not of MDPI and/or the editor(s). MDPI and/or the editor(s) disclaim responsibility for any injury to people or property resulting from any ideas, methods, instructions or products referred to in the content. |
© 2026 by the authors. Licensee MDPI, Basel, Switzerland. This article is an open access article distributed under the terms and conditions of the Creative Commons Attribution (CC BY) license.