


Abstract
The paper presents a recently developed rigid-wall diffusion cell and the experimental setup that allows the determination of the coefficient ω, which quantifies the degree of solute restriction in clays or GCLs that exhibit semi-permeable membrane behaviour. In addition, the apparatus allows the monitoring of the total vertical stress acting on the specimen during a chemico-osmotic diffusion test while keeping the vertical deformations at a negligible level (<1%). This improvement of the traditional testing approach allows for the determination of the chemical-osmotic efficiency coefficient, ω, and of the swelling coefficient , the main parameters that characterize the chemico-osmotic behaviour of clays and GCLs on the same specimen. The paper also reports on the results of some tests carried out on conventional and enhanced GCLs, with the main purpose of comparing the results obtained by means of the new testing apparatus with literature data. A first application of an advanced existing theoretical model for the description of chemical-osmotic phenomena to the results obtained is also illustrated.
1. Introduction
Geosynthetic Clay Liners, (GCLs) consisting of a thin layer of bentonite clay incorporated between two geotextiles have been widely used as hydraulic and pollutant barriers [1]. The high content of sodium montmorillonite (60%–85%) in bentonite clays typically used in GCLs [2] is the key factor for the characteristically low hydraulic conductivity of GCLs when permeated with clean water or dilute electrolyte solutions. For the application of GCLs in landfill bottom barriers, it is essential to evaluate their hydraulic conductivity in contact with leachates [3]. In fact, the hydration of bentonite in the presence of high electrolyte solutions and/or multivalent cations may result in the suppression of bentonite swelling and higher hydraulic conductivity (e.g., [4,5]), thus causing lower efficiency as a hydraulic barrier. The permanence of low hydraulic conductivity is thus the primary factor to consider when assessing the potential application of a GCL as a barrier against pollutant migration.
Bentonite can also act as a semipermeable membrane, restricting solute transport while allowing water flow (chemical osmosis), a behaviour widely documented [6,7,8]. The restriction of ion migration is attributed to the electrostatic repulsion exerted by the permanent negative charge on the basal surfaces of bentonite on anions, whereas the movement of cations is hindered by the electroneutrality condition. In a containment scenario with a semipermeable membrane separating two electrolyte solutions at different concentrations (higher inside and lower or none outside), the difference in electrolyte concentrations generates a flow of water against the chemical gradient (chemical osmosis), which reduces solute migration. Thus, a GCL with semi-permeable membrane behaviour performs better as a solute migration barrier than one without it. The restriction of solute transport by clay membranes is partial and the degree of ion entry restriction has traditionally been quantified in terms of the chemico-osmotic efficiency coefficient, ω.
Given the potential advantages in solute containment (e.g., landfill liners, encapsulation of contaminated soils, etc.), over the last two decades, several studies have addressed the semipermeable behaviour of GCLs [1], modified bentonites [8,9], soil–bentonite mixtures [10,11], sand/SHMP-modified bentonite [12], bentonite–polymer nanocomposites (e.g., [13]), and natural bentonites (e.g., [14]) under saturated conditions. More recently, the membrane behaviour of GCLs has been investigated under unsaturated conditions [15] and at elevated temperatures [16].
Chemico-osmotic diffusion tests have been widely used to determine the ω coefficient of soils and GCLs. The most widely used method is the closed-system approach [6], which applies a steady chemical gradient across a saturated sample while preventing hydraulic flow and volume change. If the material behaves as a semipermeable membrane, the inhibition of chemico-osmotic flow generates a differential pressure across the sample. The absence of volume variation is ensured by using rigid-walled cells and by preventing vertical swell by means of a locked rigid piston [6,17]. However, soil-solute interaction can still cause shrinkage in rigid wall cells, risking hydraulic short-circuiting and compromising the possibly to observe semipermeable membrane behaviour [13].
The authors have been interested in the chemico-osmotic behaviour of GCLs and clayey soils as part of their research on pollutant containment barriers. Therefore, they developed a custom apparatus for conducting chemico-osmotic diffusion tests, for which no standard methods exist. In particular, the apparatus follows the closed-system approach. The main novelty is that it allows to implement both testing approaches reported in the literature to conduct closed system chemico-osmotic diffusion testing. In essence, it allows applying two alternative confinement conditions to the testing specimen, either by means of a locked-in piston, as in [6] and others, or by means of a load cell acting on the specimen, as in [18]. The load-cell option allows monitoring the total vertical stress during testing, while keeping vertical deformation, and thus volume change, negligible (<1% for the tests in this study). Total stress variation under negligible volume change conditions reflects changes in swelling pressure, driven by the same charged solid—ions interactions responsible for the semi-permeable membrane behaviour. Therefore, monitoring the change in total stress during testing test provides and additional means to evaluate the chemico-osmotic response of clays and GCLs.
The article first reviews the experimental methods adopted in the literature to conduct chemico-osmotic testing, outlines advantages and limitations of the different testing approaches. The designed experimental apparatus is then described. The article also presents some comparative tests performed on different GCLs, to validate the apparatus with against literature data and to evaluate the impact of factors such as the GCL type and the electrolyte concentration on the chemico-osmotic efficiency. Preliminary application of an advanced theoretical model proposed in the literature for the description of chemical-osmotic phenomena to the results obtained is also provided. The novel apparatus and initial results of this study have been concisely presented in conference papers [19,20].
2. Literature Review on Chemico-Osmotic Testing Apparatuses and P
Chemo-osmotic tests with the open system approach, i.e., in which volumetric flow through a clay specimen is allowed. In the presence of semi-permeabile membrane behaviour, the total liquid flux across the specimen, q, is given by [21]:
where ∆P is the hydraulic pressure gradient, ∆π is the osmotic pressure gradient induced by the difference in concentrations across the specimen, k is the soil hydraulic conductivity, ω is the chemico-osmotic efficiency coefficient ∆x is the specimen length and γw is the unit weight of water (for dilute solution, the unit weight the solutions can be approximated with that of the solvent). The test comprised two steps: (1) measuring the chemical-osmotic flow, qπ;
and (2) measuring separately the Darcy volumetric flow, qh:
To measure qπ, the system was connected to two reservoirs containing electrolyte solutions of different concentrations (∆π ≠ 0), but subject to the same pressure (∆P = 0) in order to cancel qh from the total solution flux. In the second testing step, qh was measured by permeating the same specimen with a solution composed of the two previous solutions in equal parts (i.e., ∆π = 0) and applying a constant pressure gradient (i.e., ∆P ≠ 0). The chemico-osmotic efficiency coefficient can be then obtained [21]:
Although this procedure is relatively simple to develop for measuring ω, it has the disadvantage of having to conduct the test in two phases and is sensitive to the typically small chemico-osmotic flow, which can be difficult to measure accurately. Furthermore, it implicitly assumes that the hydraulic conductivity k remains unchanged between the two test phases [18].
The testing system developed in [6] adopts the closed system approach and consists of a rigid acrylic cell, a flow pump, two stainless steel cylinders, stainless steel connection pipes, a differential pressure transducer and bladders accumulators for solutions and recharging and withdrawal. During testing, two electrolyte solutions of different concentrations are circulated at the same flow rate along the specimen boundaries, which ensures no hydraulic flow though the specimen while generating a constant concentration gradient (i.e., ∆π ≠ 0). The specimen is confined by a locked piston to maintain zero volume change, although this setup does not allow monitoring the vertical stress. In the case of semi-permeable behavior, a differential pressure ∆P arises across the specimen, and it measured with the differential pressure transducer. The chemico-osmotic efficiency coefficient ω is then obtained from the no-flow condition, (q = 0 in Equation (1)):
Because bentonites behave as “leaky” semi-permeable membranes, solute diffusion occurs during testing. By monitoring the mass flux through the specimen, the effective diffusion coefficient of the solute/s at steady state, D*, and the solute/s retardation factor/s, Rd (assuming irreversible linear absorption) can be determined (see Section 3.2). In [7] chemical-osmotic diffusion tests were performed using a system similar to that in [6], except the test cell was flexible-walled to reduce the risk of sidewall leakage. In this setup, the vertical total stress equals the cell pressure, which was kept constant during the test. Absolute pressure transducers connected in series with the differential pressure transducer along the drainage lines measured pore pressures at specimen boundaries in excess of the backpressure. Hydration, consolidation, saturation and salt flushing of the sample were conducted in a separate flexible-walled permeameter.
The testing system utilized in [11] consisted of a rigid-walled cell, a peristaltic pump, bladders accumulators for solution handling, a pressure transducer along the top line and an accumulator on the bottom line maintained at atmospheric pressure. The pressure transducer was positioned at the same elevation as the sample to avoid hydraulic head differences and all components (accumulators, valves, connections, pipes) were made of rigid acrylic to minimize pressure drops. Samples were first saturated with distilled water under vacuum and then flushed for about 60 days to remove soluble salts and enhance membrane behaviour. After flushing, distilled water was circulated to establish a reference pressure difference, followed by circulation with electrolyte solutions. The electrolyte concentration in the top line was progressively increased while keeping distilled water in the base line, until a stable differential pressure developed. Since the specimen was confined between two rigid plates, the vertical stress state of the specimen was not monitored.
The system used in [15] was similar to that in [6] with some modifications enabling chemical-osmotic diffusion tests on unsaturated samples. In particular, the rigid-walled cell was adapted to accommodate high air-entry (HAE) disks at the boundaries of the specimen, to control the water content of the specimen during testing. In this configuration, solutes must diffuse through the HAE disks before diffusing into and out of the specimen. The setup also enabled maintaining positive porewater pressure inside the specimen while preserving the matric suction corresponding to the unsaturated state (axis translation). As for the testing procedure, the specimen was first hydrated to the target degree of saturation, then transferred to the test cell for the electrolyte solutions circulation phase with the solutions commenced. As in [6], the specimen was confined by a locked-in piston, so the stress state was not monitored during the test.
In [18] a testing apparatus conceptually similar to that used in [6] was described, consisting of a stainless-steel oedometer cell hosting the specimen, a flow pump connected to two cylinders that circulate the electrolyte solutions, two bladder accumulators, three pressure transducers, and a vertical displacement transducer. Unlike the testing system utilized in [6], the system includes a load cell connected to the specimen’s cap, enabling measurement of the vertical total stress throughout the chemico-osmotic stage, consisting in circulating electrolyte solutions in stages of increasing concentrations. Assuming negligible deformation of the load cell, this setup satisfies the no-volume change condition (strain-controlled test). This approach allows determination the chemical-osmotic efficiency coefficient, ω, and the effective diffusion coefficient of the solute D*. Moreover, monitoring the total stress during each stage of testing, under the no -volume change conditions, allows determining the global swelling coefficient , which expresses the change in the chemico-osmotic component of the swelling pressure induced by changes in the boundary electrolyte concentration (i.e., in the boundary osmotic pressure).
Based on the literature review, the authors decided to incorporate the load-cell testing option into the design of the new apparatus; given the advantages offered in terms of material characterization and the limited data available under such conditions. However, they also included the “conventional” locked-in-place piston configuration used in most prior studies, with the purpose to enable comparison with the broader existing dataset and to assess how the testing setup and procedure influence chemico-osmotic diffusion test results.
3. Chemico-Osmotic Diffusion Testing Apparatus and Procedure
3.1. Testing Apparatus
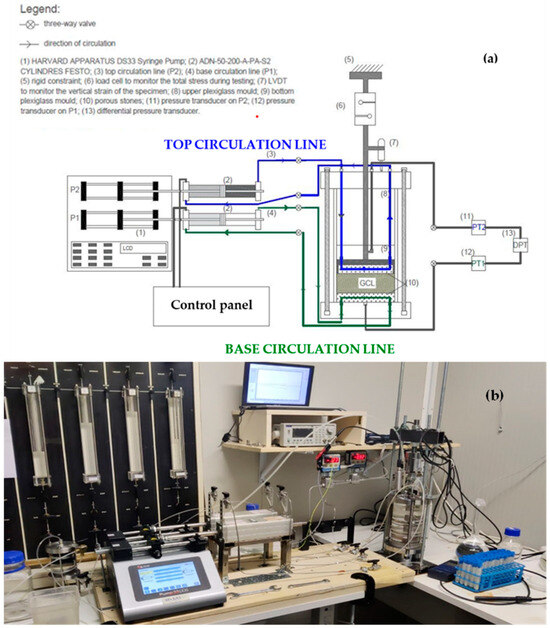
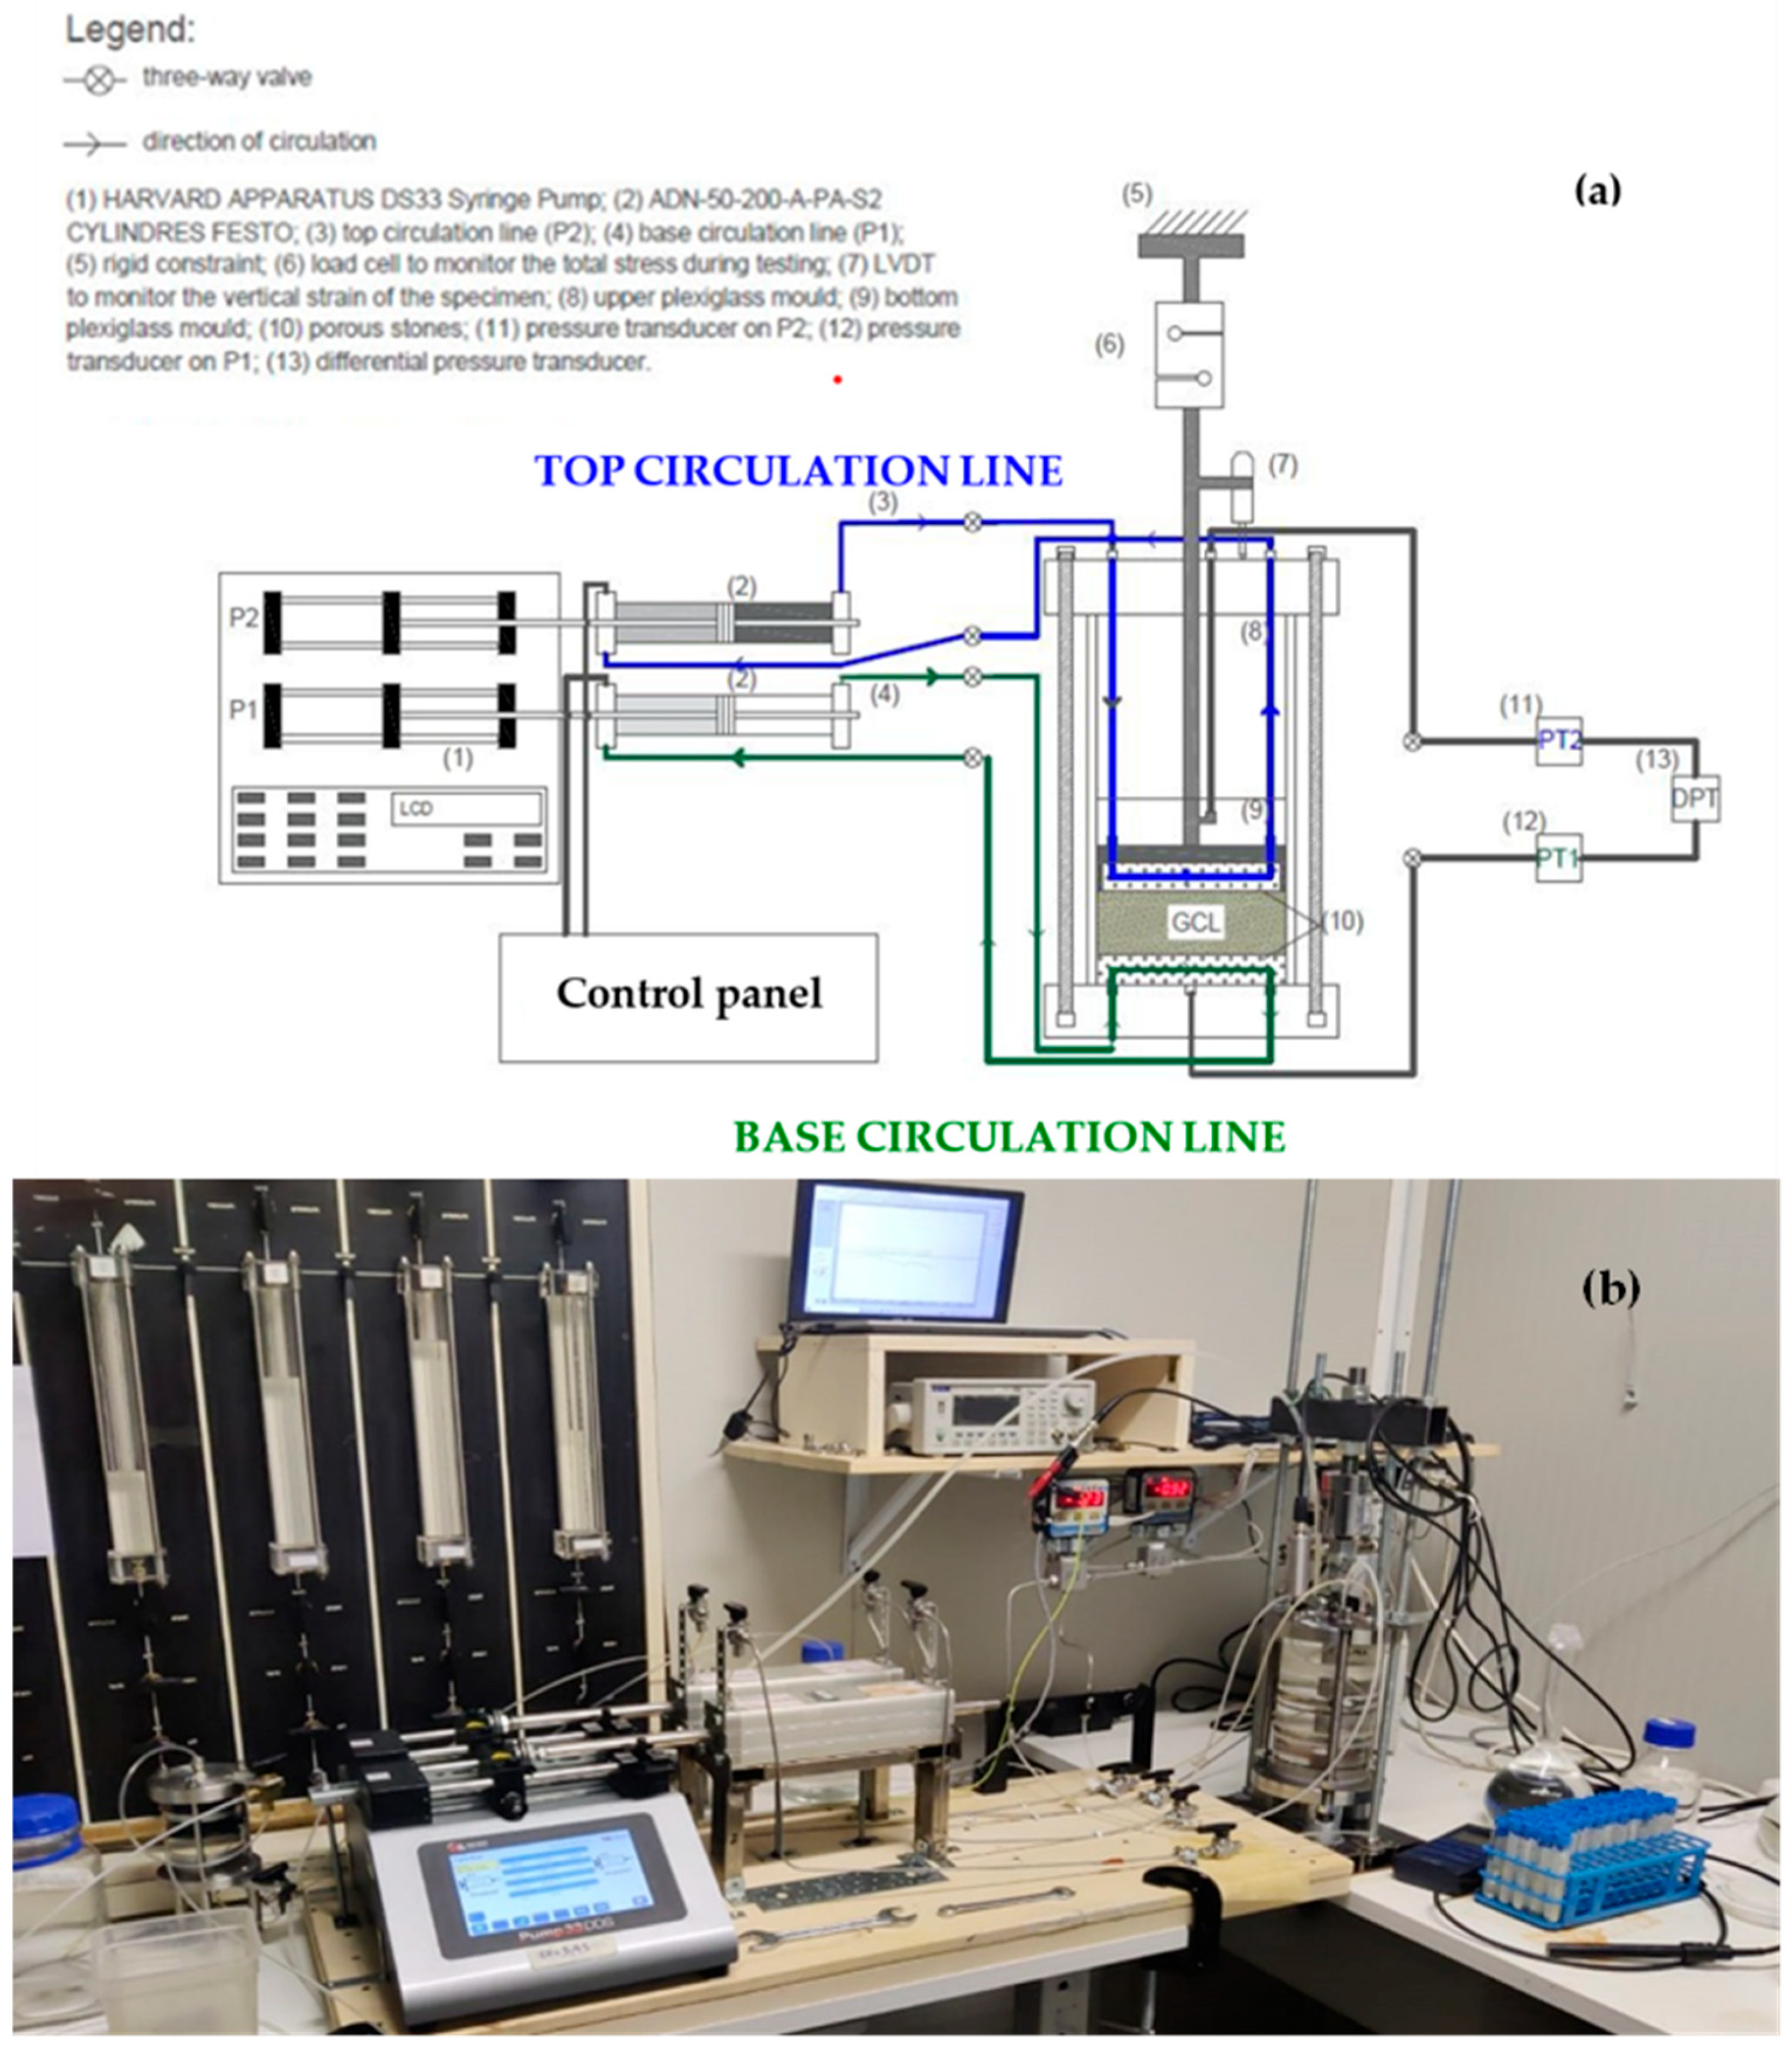
Figure 1 shows a scheme of the apparatus developed in this study, that is conceptually similar to the one described in [6]. The test principle is to induce a steady-state chemical gradient through a saturated soil or GCL specimen while preventing hydraulic flow. The concentration gradient is created by circulating at the same rate electrolyte solutions of different concentrations at each end of the specimen using a dual syringe pump connected to two metal cylinders. The syringe plunger divides the cylinder into two compartments, hydraulically linked to a porous disk in contact with the specimen. The solution is infused into the porous disk through one of the drainage lines at a specific flow rate by moving the plunger connected to the disk and aspirated at the same rate through the other line.
Figure 1.
(a) Schematic of the solution recirculation system and the rigid-wall acrylic cell for the execution of chemico-osmotic diffusion tests (redrawn after [19]): (b) pictorial view of the testing apparatus.
The rigid-wall cell, made of non-conductive plexiglass, consists of a lower cylinder that houses the soil specimen (or GCL) and an upper pressure chamber, hydraulically isolated from the specimen housing by a rigid piston sealed laterally. The cylinder internal diameter and height are both 100 mm. A third drainage line connects each porous disk to a differential pressure transducer. The porous disks, made of ceramic material (porosity n = 0.47, specific gravity Gs = 2.7 and intrinsic permeability K = 5.12 × 10⁻¹² m2) are of the same type and manufacturer as those used in [22]. Hydraulic pressures generated at the top and base of the specimen are monitored separately by gauge pressure transducers placed along the drainage lines.
The rigid piston moves downwards or upwards depending on the pressure applied to the upper chamber during the initial consolidation or swelling phase of the specimens. During the circulation phase, the piston can be either locked-in-place against a rigid steel frame (referred to as “No Strain” condition) or connected to a load cell (LCM411-500-USBH Load Cell, AEP Transducers, Italy) located between the piston rod and the steel frame, which allows the total force acting on the specimen to be monitored. Since the load cell deforms minimally for the measurement of the applied force (≈0.2 mm/KN), in principle volume change is not completely impeded for the latter testing condition (referred to as “Small strain” condition). A displacement transducer (LVDT) attached to the piston rod monitors volume changes both during the chemical-osmotic diffusion stage and preliminary consolidation stage of the specimen.
3.2. Chemico-Osmotic Diffusion Test
In closed-system chemico-osmotic diffusion tests, the efficiency coefficient ω (or “reflection coefficient”) is calculated by Equation (5), where ∆π represents the theoretical osmotic pressure difference across an ideal semipermeable membrane separating two dilute solutions of a single electrolyte, which can be calculated by the van’t Hoff equation:
where ν = number of ions per salt molecule, R = universal gas constant [8.314 J mol−1°K−1], T = absolute temperature [°K], and ∆C = difference in solute concentration across the membrane [M]. Since clays and GCLs typically only partially restrict solutes, a diffusive solute flux occurs in response to the induced concentration gradient, until a steady-state diffusion condition is reached. Monitoring the inlet and outlet solution concentrations enables the calculation the molar diffusive flux at steady state, J, and the chemico-osmotic diffusion coefficient, , can be determined from the Fick’s first law of diffusion [6]:
where Ct,av and Cb,av are the average solute concentration at the top and base of the specimen, respectively, determined as the average of concentrations of the inflow and outflow solutions at the respective porous disk; H is specimen thickness and n is total porosity of the specimen. In the case of electrolyte solutions, for zero electric current density and in the absence of membrane behavior (i.e., ω = 0), the diffusion coefficient measured at steady state is the effective diffusion coefficient of the salt =τm Dso, where τm is the geometric or matrix tortuosity of the porous medium that accounts for pore connectivity and Dso is diffusion coefficient of the salt in free solution. In the presence of membrane behaviour, the diffusion coefficient can be expressed [23]:
where τr is the restrictive tortuosity that accounts for the solute restriction by the charged surface.
Chemico-osmotic diffusion test can be “single stage” (i.e., a single electrolyte solution is circulated throughout the test) or “multiple stage” (the concentration of the electrolyte solution varies across stages). Multistage tests allow for the evaluation of the coefficient ω and of the diffusion coefficient as a function of the electrolyte concentration. Moreover, if carried out with the small strain mode, they also allow for monitoring the change in the total vertical stress acting on the specimen, which, in the absence of volume change, depends solely on the variation of the bentonite swelling pressure [18].
The swell coefficient expresses how efficient a change in the boundary concentration is in producing a change in the chemical-osmotic component of the bentonite swelling pressure, usw, which develops in response to the ion partitioning mechanism within the charged porous medium [24]. In the absence of volume change, the coefficient can be determined as:
where is the change in total vertical stress, is the change in the average interstitial pressure, and is the change in osmotic pressure at the boundary of the specimen between two test stages.
Although small vertical displacements were recorded by the LVDT attached to the piston’s rod (part 7 in Figure 1) during the chemico-osmotic stage of the experiments in this study, assuming that the piston displacement equalled the change in height of the specimen, the corresponding vertical strain of the specimen was always less than 1%, which was considered negligible. Therefore Equation (9) was used to compute the swelling coefficient of the bentonite between two consecutive stages of “multistage” tests.
4. Materials and Methods
4.1. Materials
This article reports the results of chemical-osmotic diffusion tests performed on three different commercially available products, hereinafter called GCL-1, GCL-2 and GCL3 with the aim of illustrating the use of the equipment and to compare the results obtained with literature data concerning identical or similar product, when available.
GCL-1 (Bentofix BFG5000®; NAUE; Espelkamp, Germany) is a needle punched product containing 4.5 kg/m2 of sodium bentonite powder. The main physical and chemical characteristics of GCL-1 are listed Table 1. GCL-2 (Bentomat® SS, CETCO, Hoffman Estates, IL, USA), is a needle-punched product which contains a nominal unit mass of 4.2 kg/m2 of granular sodium bentonite. The main physical and chemical properties of the product are reported in [25]. GCL-3 (Rawmat®, Rawell, Merseyside, UK) is a product known as Dense Prehydrated (DPH GCL). The product type used in this study includes a 5.0 kg/m2 layer of prehydrated and vacuum-extruded bentonite, 4.6 mm thick, interposed between a perforated polyester geotextile and a HDPE layer, which was removed before carrying out the test. It is also known that the bentonite of DPH GCLs is amended with polymers (Na-polyacrylate and Na-carboxymethylcellulose) during the proprietary production process The physical and chemical properties of GCL-3 are reported in Table 1.
Table 1.
Physical and chemical properties of the GCLs used in this study.
4.2. Testing Procedure
Circular GCL specimens (diameter = 100 mm) were carefully cut with a sharp cutter from the GCL roll for subsequent chemico-osmotic testing. The liquids used in this study were distilled water (DW) and potassium chloride (KCl) solutions at concentration 20 mM, 40 mM and 80 mM. These concentrations were selected to facilitate comparison with the results obtained from previous studies. The KCl solutions were prepared by dissolving analytical grade solid KCl in DW. Prior to the chemico-osmotic diffusion testing (see Section 3.2), preliminary hydration and permeation of the GCL specimens with DW were performed in Flexible Wall Permeameters (FWP, Geotac, Houston, TX, USA) following the test method [32] to reduce the concentration of soluble salts (“flushing”), increasing the degree of saturation and measure the saturated hydraulic conductivity (k). An average effective isotropic confining stress σ’i = 34.5 kPa was applied during permeation in FWP. After 4–6 months of permeation with DW, the GCL specimen was carefully extracted from the FWP and transferred into the rigid-wall cell.
Due to unimpeded horizontal swell of the bentonite layer in FWP, the diameter of the hydrated specimen was usually slightly larger than the rigid cell’s internal diameter. Thus, the specimen was gently forced into the rigid cell ensuring a gap-free contact with the cell walls. If a defective contact was suspected, bentonite paste was added along the edges of the specimen with a spatula. The specimens were then reconsolidated to a vertical stress σv’ = 34.5 kPa by pressurizing the upper chamber, to restore the stress level applied during the flushing stage and then permeated again with DW (hydraulic gradient, i = 90–120), mainly to check for sidewall leakage.
After permeation, the confining piston was blocked on the steel frame when operating the “no strain” testing approach, while in the case of the “small strain” testing approach, the load cell was interposed between the piston rod and the steel frame, allowing the total stress to be monitored during the subsequent testing steps. At this point, the upper chamber was depressurized in both testing modes. In case of the “small strain” mode, depressurization caused load cell stressing, due to specimen rebound. After 1 day or longer, until the reading of the load cell stabilized, DW was circulated as the inlet solution for at least 7 days at both ends of the sample to establish the baseline differential pressure and Electrical Conductivity (EC) of the outflow solutions. In fact, despite the flushing phase, residual soluble remained in the specimen, causing the EC of the outlet solution to be higher than that of DW. The circulation rate was set at 4.8 × 10⁻¹⁰ m3/s (41.5 mL/day) in all tests with the aim of allowing comparison with previous studies [31,33].
The chemico-osmotic diffusion phase of the test began by circulating the chosen electrolyte solution as the inlet solution at the top boundary while continuing to circulate of DW at the base. During this phase, the cylinders were regularly recharged every 48 h on average. At the same time, the outlet solutions were sampled to monitor the EC and measure the solute concentrations by means of a Dionex ICS 1000 Ionic Cromatograph, Thermo Fisher, Waltham, MA, USA. At the end of the chemico-osmotic phase, the GCL specimens were permeated again with the electrolyte solution to assess any possible shrinkage of the sample, indicated by an increase in k compared to permeation with DW. Finally, the moisture content of the specimen was measured to estimate the final degree of saturation
4.3. Theoretical Interpretation of Experimental Data
In [24] a theoretical model based on a physical approach for the description of chemical-osmotic phenomena in bentonites was proposed. According to this approach, the values of ω measured during an osmotic test (or “global”values) can be predicted as a function of the void ratio the bentonite (e), the ionic concentration at the boundaries of the porous medium (cs), and of the coefficient of concentration of fixed charges, C’sk,o which represents the concentration of the solid surface charges per unit volume of the pores accessible for ion transport. For a1:1 electrolyte (i.e., containing two monovalent cationic and anionic species such as KCl) in contact with the clay, the chemico-osmotic efficiency coefficient of the bentonite specimen in a chemico-osmotic test setup can be expressed as:
where:
cb and ct are the electrolyte salt concentration (i.e., KCl in this study) at the specimen base and specimen top at steady state, respectively, and t1 is the cation transport number, defined as:
where D0,K and D0,Cl are the diffusion coefficient of potassium and chloride ions in free solution, respectively.
The theoretical model proposed in [24] also allows for the prediction of the swell coefficient Equation (8), between two test stages of a chemico-osmotic test where the electrolyte concentration at the boundaries of the specimen changes from ci to cf. The model assumes that the electrolyte concentrations at the boundaries of the specimen are equal. To fully satisfy this assumption, after a stage where the concentrations at the top and base are different (e.g., 20 mM KCl at the top and DW at the base) during a chemico-osmotic diffusion test, a subsequent stage must be conducted where the concentrations at both ends are equalized (e.g., circulating 20 mM KCl at both the top and the base). According to the abovementioned model, the swell coefficient of the bentonite between two test stages in which the concentration at the top and base boundaries is changed from from ci (e.g., 10 mM KCl) to cf (e.g., 20 mM KCl) can be calculated for a 1:1 electrolyte as:
The experimental results obtained in this study for ω and were interpreted with the model described above.
5. Results and Discussion
5.1. Typical Result of a Chemico-Osmotic Test
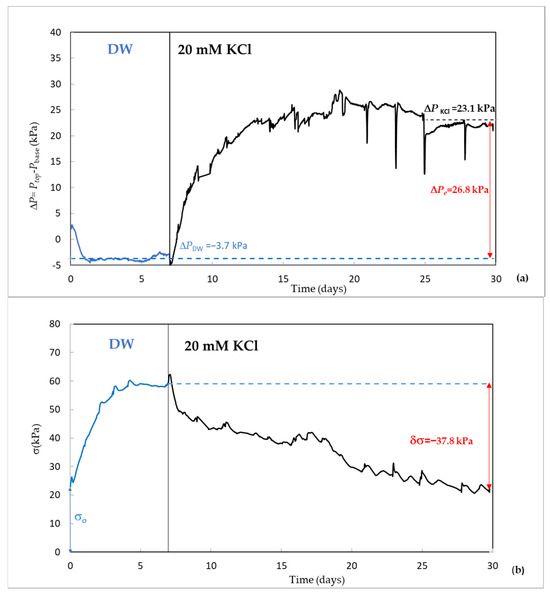
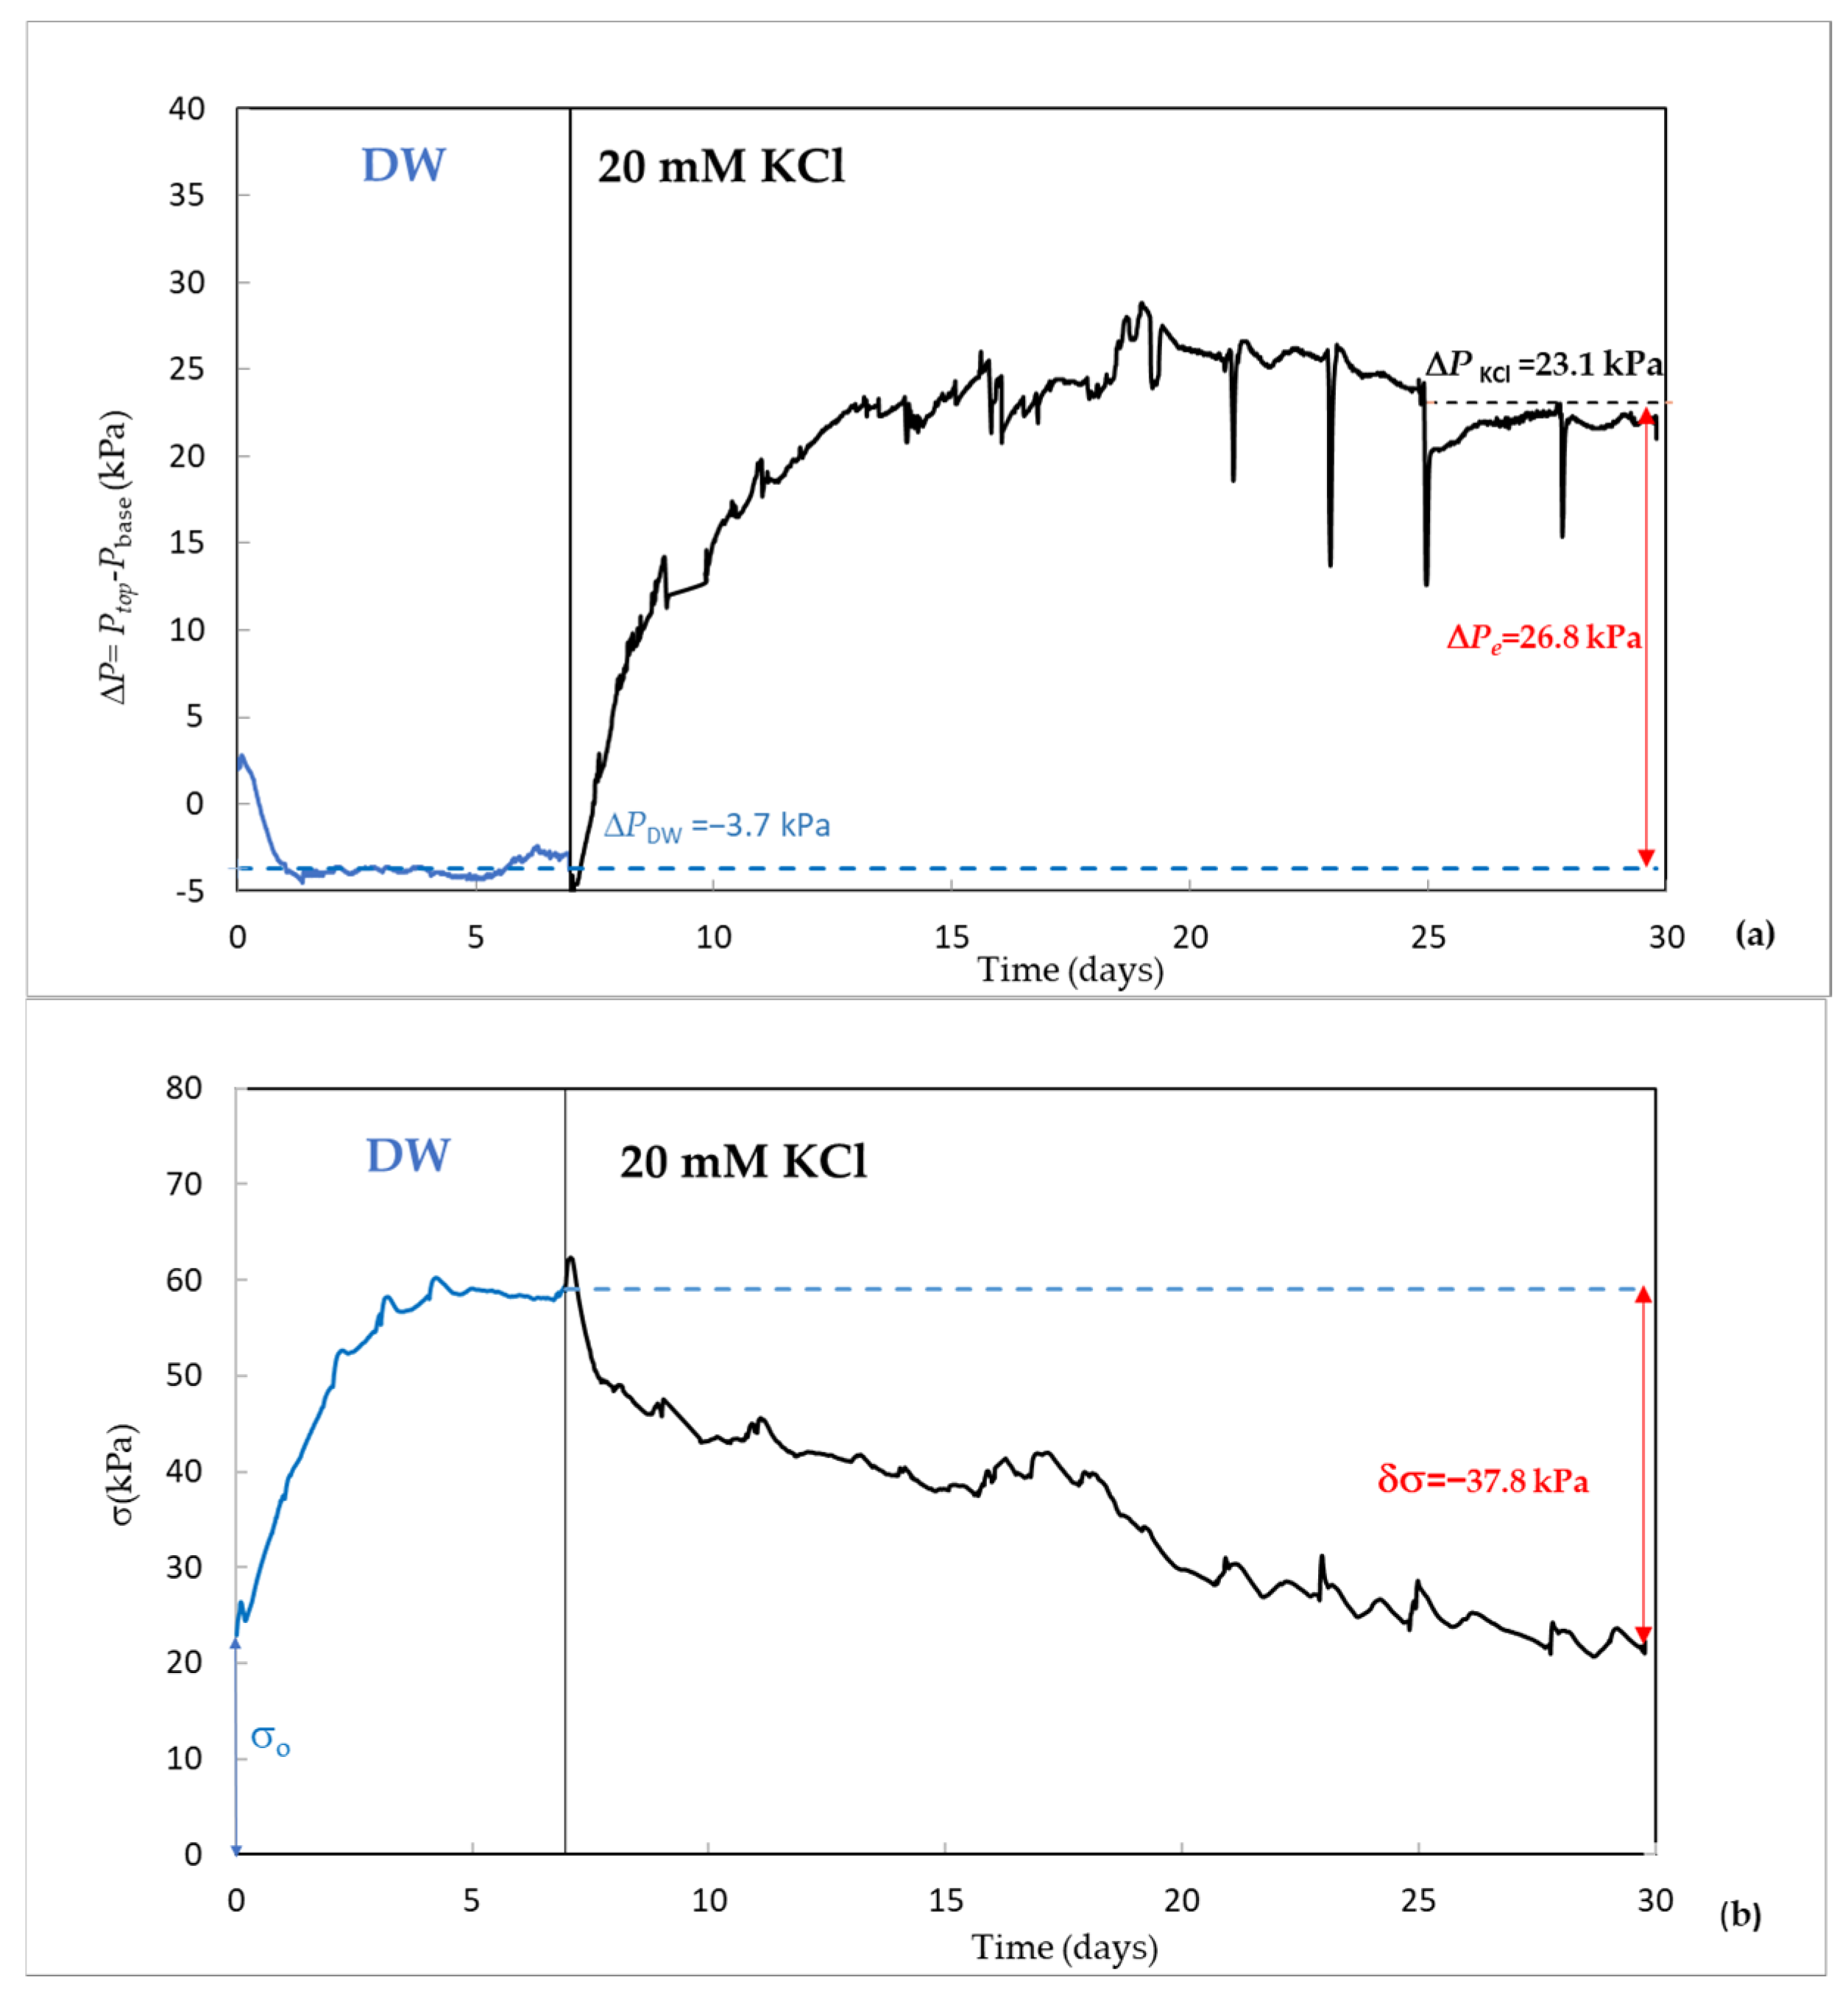
A typical result from a chemical-osmotic diffusion test obtained in this study, showing the trend of the differential pressure, ΔP (=Ptop − Pbase) over time, is shown in Figure 2a. The average differential pressure during the circulation phase with DW, denoted as ΔPDW, was considered representative of the entire phase. The representative value of ΔP during the circulation with the electrolyte solution, denoted as ΔPKCl, was determined from the overall trend, considering also the disturbances induced by the sampling and recharging operations (i.e.,"jumps" in the plot in Figure 2a). The coefficient ω was calculated as follows:
where ΔPe is the effective differential pressure (Figure 3), defined as:
and is the theoretical chemico-osmotic differential pressure, calculated by Equation (6) considering the difference in average concentrations of K+ and Cl− at the specimen boundaries (see Figure 3a,b), determined by chemical analyses of the effluent solutions.
Figure 2.
Typical differential pressure (a) and total stress (b) trends observed during a chemical-osmotic diffusion test conducted with the small-strain mode (GCL-3). Dashed blue lines represent the average differential pressure during DW circulation and final vertical stress at the end of DW circulation, respectively.
Figure 3.
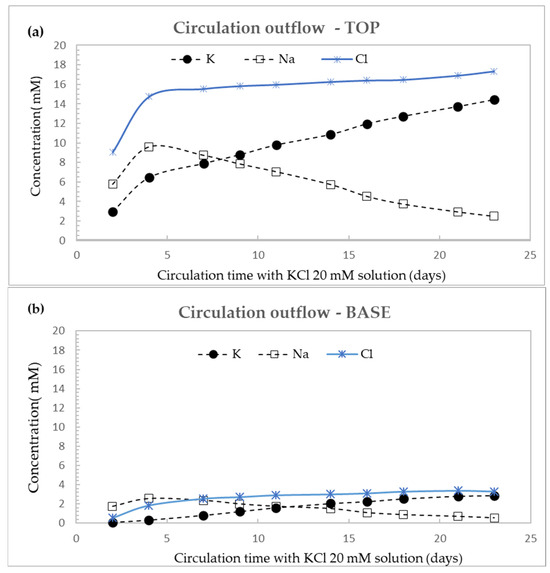
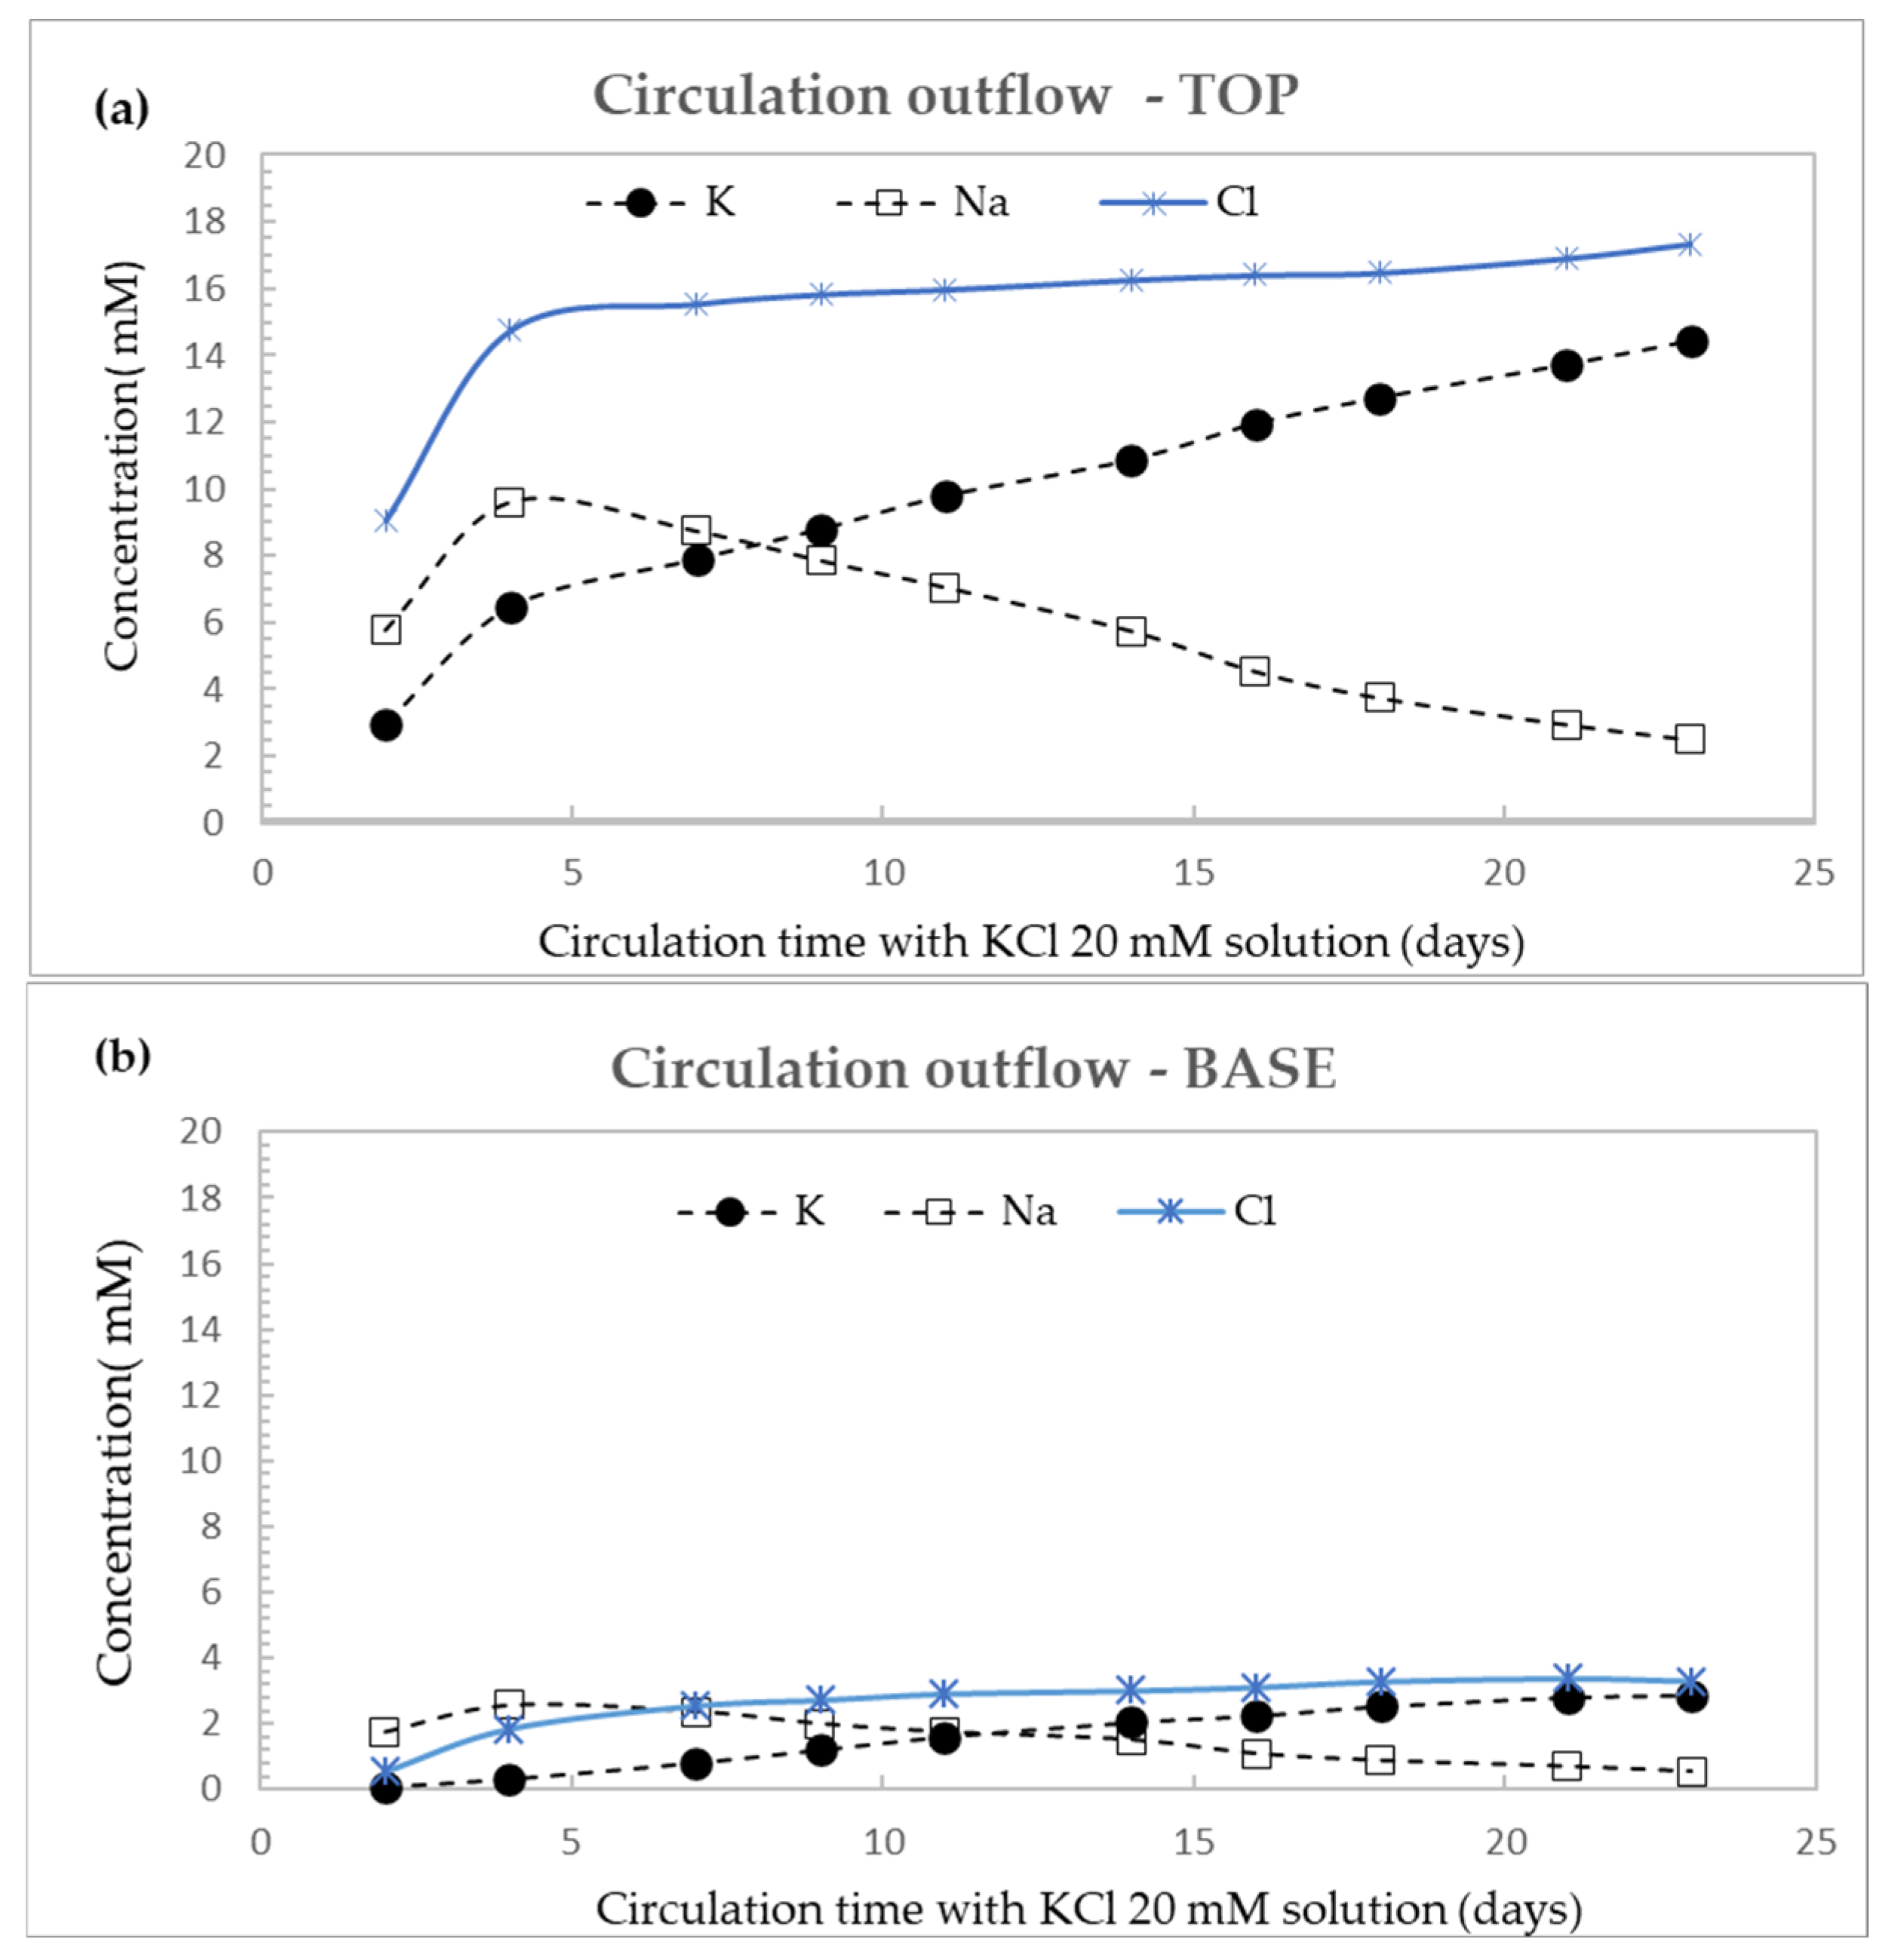
Typical trend of the measured solute concentrations during the circulation of a 20 mM KCl solution: (a) outflow of circulation loop at specimen top; (b) outflow of circulation loop at specimen base (GCL-3).
Figure 2b shows the trend of the total vertical stress (σ) measured using the small-strain test mode. The initial value of the vertical stress (σo) was generated in the load cell as a result of the depressurization of the upper hydraulic chamber and the consequent tendency of the specimen to swell. During the subsequent phase of circulation with DW, an increase in σ was observed. This increase is consistent with the reduction of the concentration of soluble salts at the specimen boundaries, as reflected by the gradual decrease in the EC of the outlet solutions. This decrease in concentrations leads to an increase in the osmotic pressure difference between the specimen pore water and the external circulation solution, which contributes to an increase in the swelling pressure [14], detected by the load cell. Conversely, the circulation of the 20 mM KCl solution at the top of the specimen induces a decreasing trend of σ, due to the reduction of the chemical-osmotic component of the swelling pressure.
Figure 3a,b show the trend in measured solute concentrations in the outflow solutions at the specimen top (a) and base (b) boundary during circulation of 20 mM KCl solution at the top boundary and DW at the base. As expected, solute restriction by the GCL is only partial and solute diffusion occurs through the specimen. This results in a decrease in the solute concentration of the circulation outflow to decrease with respect to the inflow solution (i.e., 20 mM KCl) and the solute concentration in the base outflow to increase with respect to the inflow solution (i.e., DW) as a result of diffusion.
5.2. Effect of GCL Type
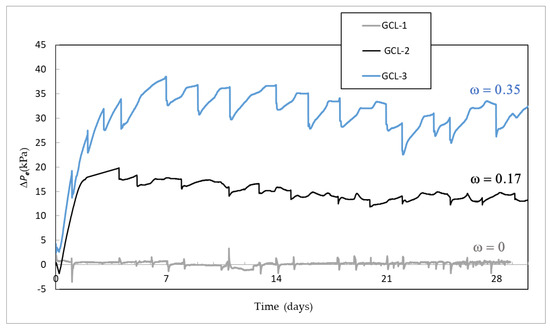
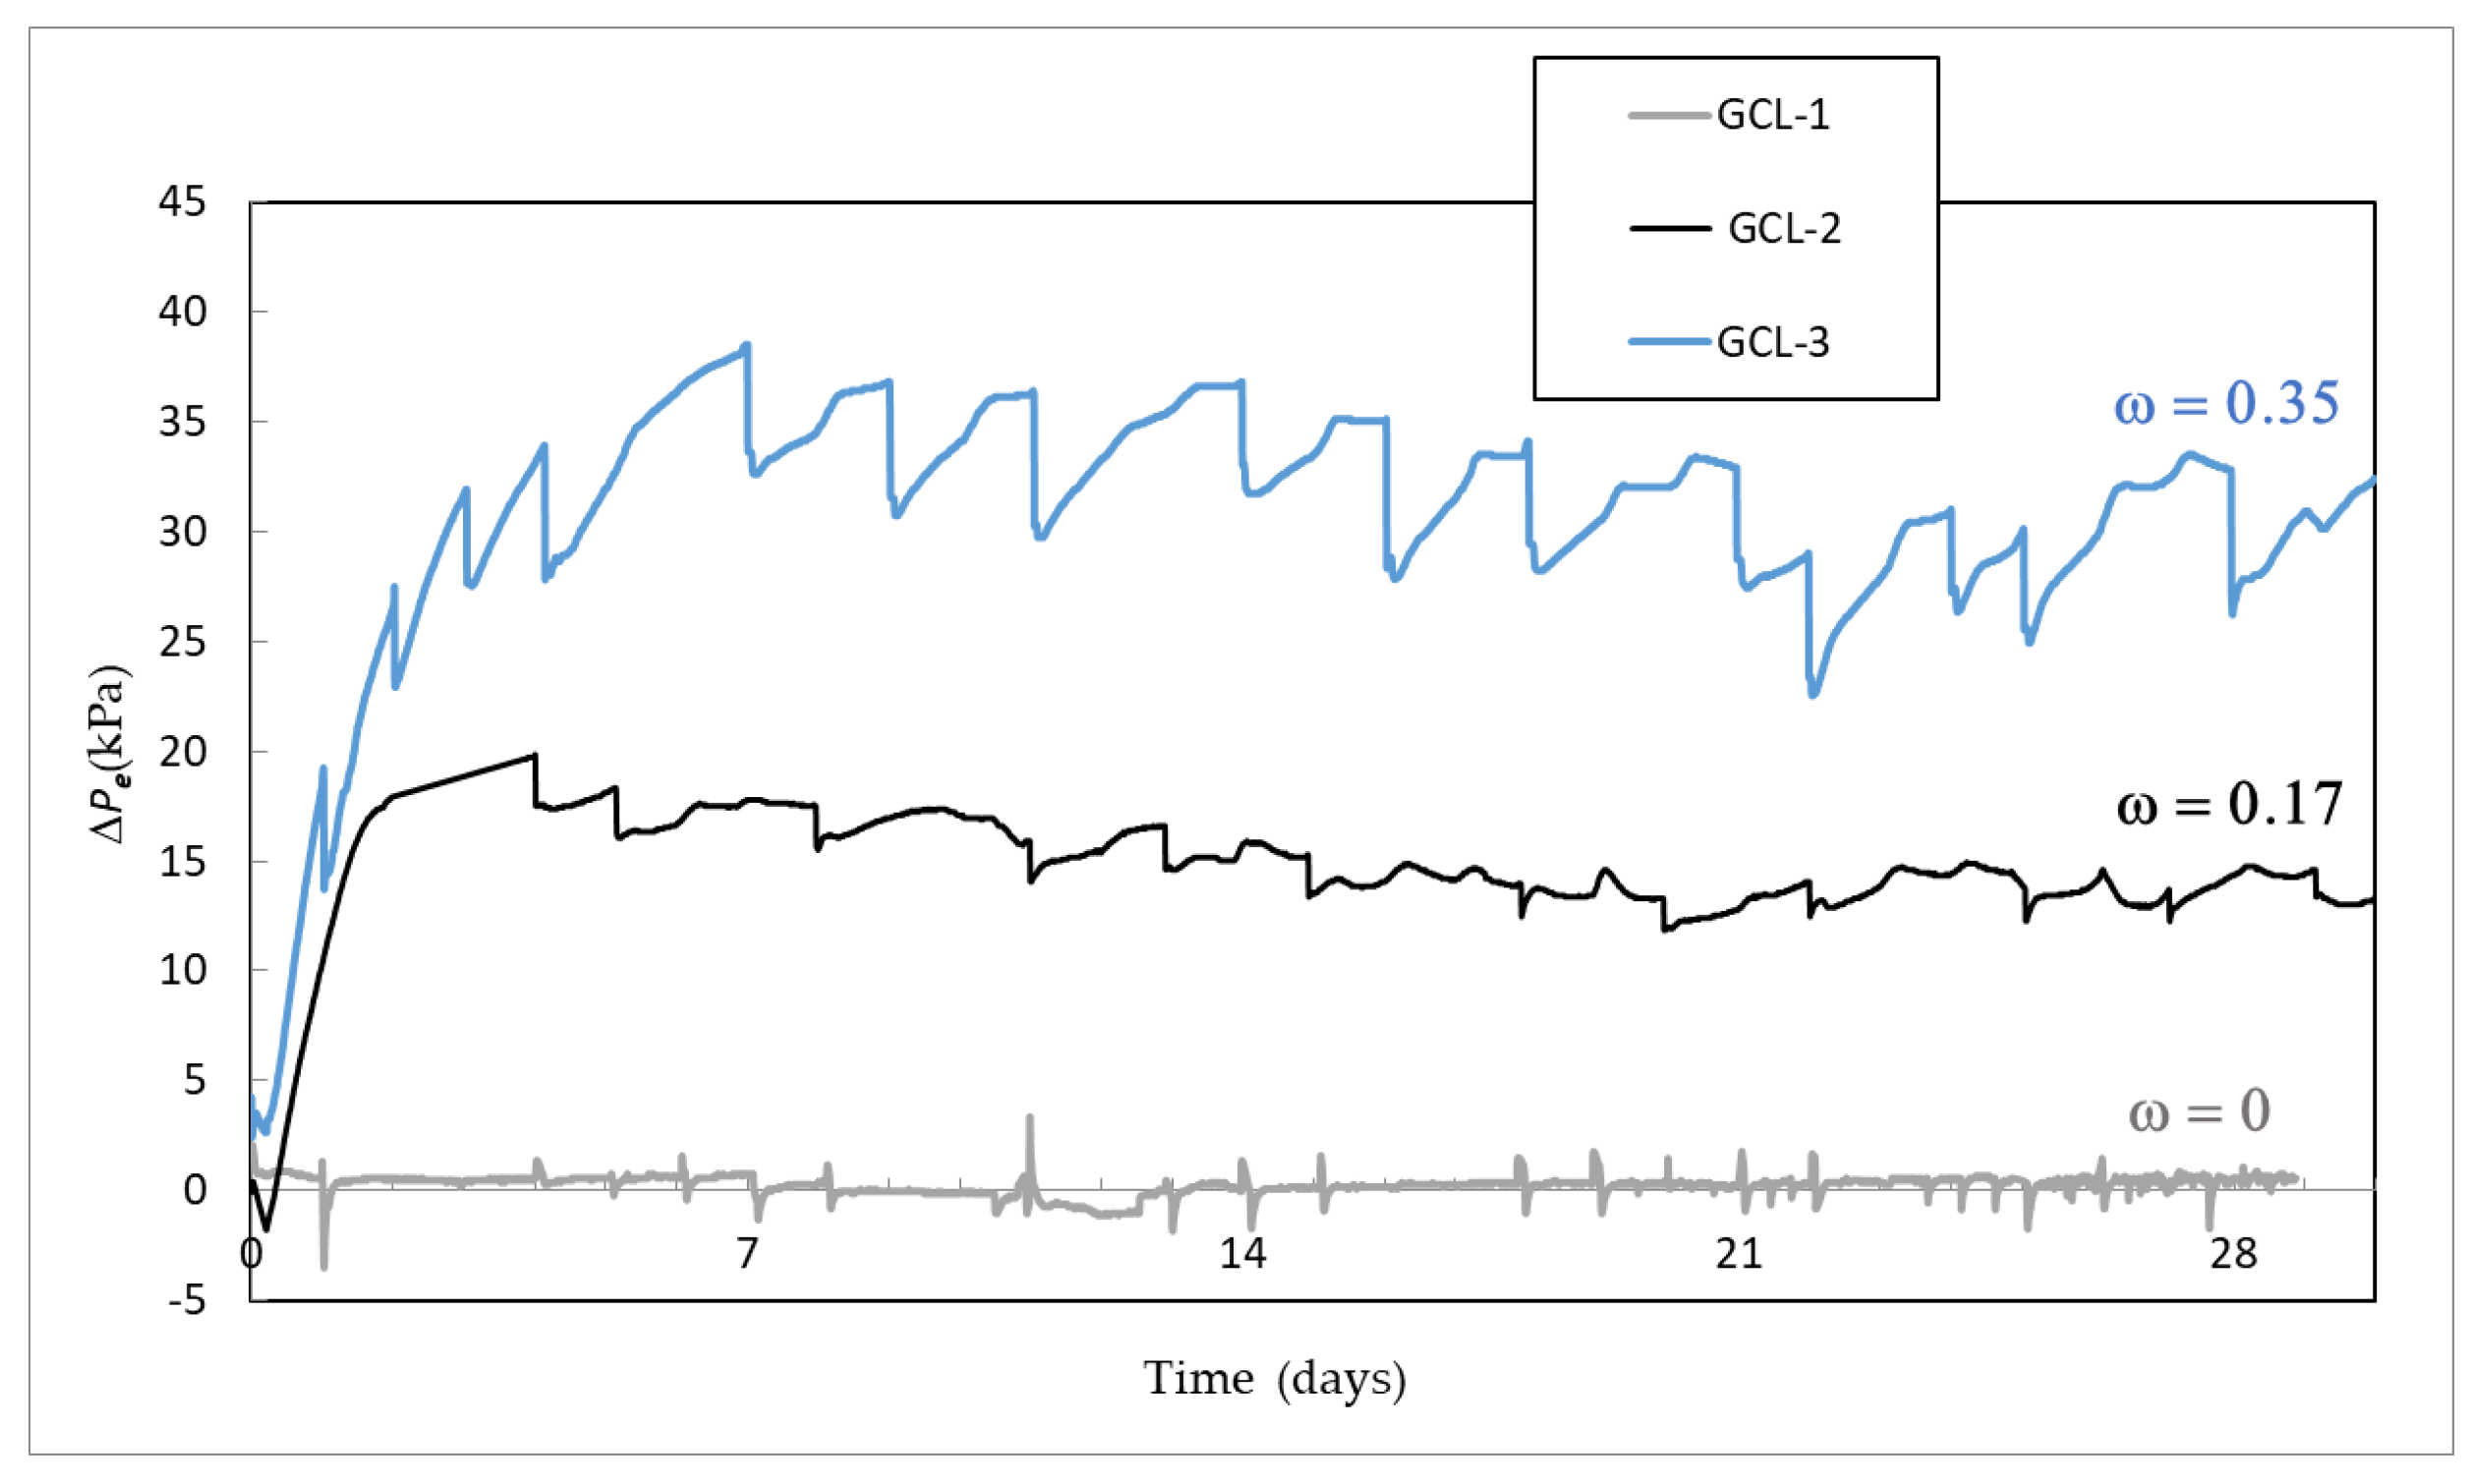
Figure 4 shows a comparison of the effective differential pressure, ΔPe, measured during the circulation phase with 20 mM KCl across the three different products considered in this study: the “conventional” GCLs (GCL-1 and GCL-2) and the enhanced- performance GCL-3 (DPH GCL). The results indicate that the type of GCL significantly influences its chemico-osmotic behaviour. Specifically, the two conventional products, which are similar in configuration (i.e., needle-punched) and bentonite state (i.e., anhydrous), showed a notably different behaviour. The lack of osmotic response (i.e., ΔPe ≈ 0) of GCL-1 was unexpected and confirmed by additional tests (not reported in this paper). Unfortunately, no previous studies have investigated the chemico-osmotic behaviour of this product, therefore no comparison with literature data is possible. The difference with respect to GCL-2 could be ascribed mainly to the properties of bentonite, depending upon its nature and origin. Although no specific analyses were conducted to confirm this, it is possible that the used production lot of GCL-1 contained activated sodium bentonite instead of natural sodium bentonite.
Figure 4.
Trend of the effective differential pressure upon circulation of 20 mM KCl solution during the chemical-osmotic diffusion tests (“no strain” mode) on the three GCLs used in this study and obtained ω values at steady-state.
Sodium activated bentonites (i.e., amended with soda ash) are generally considered of poorer quality than natural sodium bentonite, particularly with respect to the possible non uniformity of the activation process [2]. While GCLs containing activated bentonite can still meet standard technical requirements (e.g., swelling capacity, hydraulic conductivity, etc.) they may not exhibit the same osmotic response as those made with natural sodium bentonite. Since semipermeable membrane behaviour is expected to be affected by the pore size of the clay, sodium-activated bentonite may partly preserve the aggregated fabric of native calcium bentonite with large interaggregate pores that do not favour the onset of semipermeable membrane behaviour. GCL-1 and GCL-2 also differ in bentonite fineness (powder vs. granulated) and fibre distribution (uniform vs. clustered). However, these factors likely have a minor impact on the development of semi-permeable membrane of the GCL compared to bentonite quality.
GCL-3 showed, under the same testing conditions, the highest ΔPe and ω compared to the other products, confirming previous studies [31]. Its superior performance as semi-permeable membrane is likely due to the quality of bentonite (natural sodium bentonite according to the specification sheet of the product) and to the higher dry density relative to the conventional GCL under the same confinement. Additionally, the polymers may help maintaining the semi-permeable membrane behaviour by preventing the DDL from collapsing as electrolyte concentration increases [17]. In a different study [34], XRD analyses of air-dried DPH GCL showed an increase of the basal distance, d001, of montmorillonite crystals to 1.40 nm with respect to 1.25 nm of unamended sodium bentonite, which suggests intercalation of polymer molecules in the interlayer space of the clay.
5.3. Comparison with Previous Studies
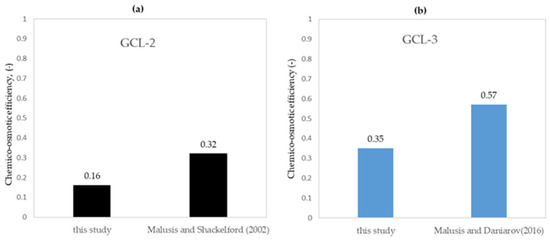
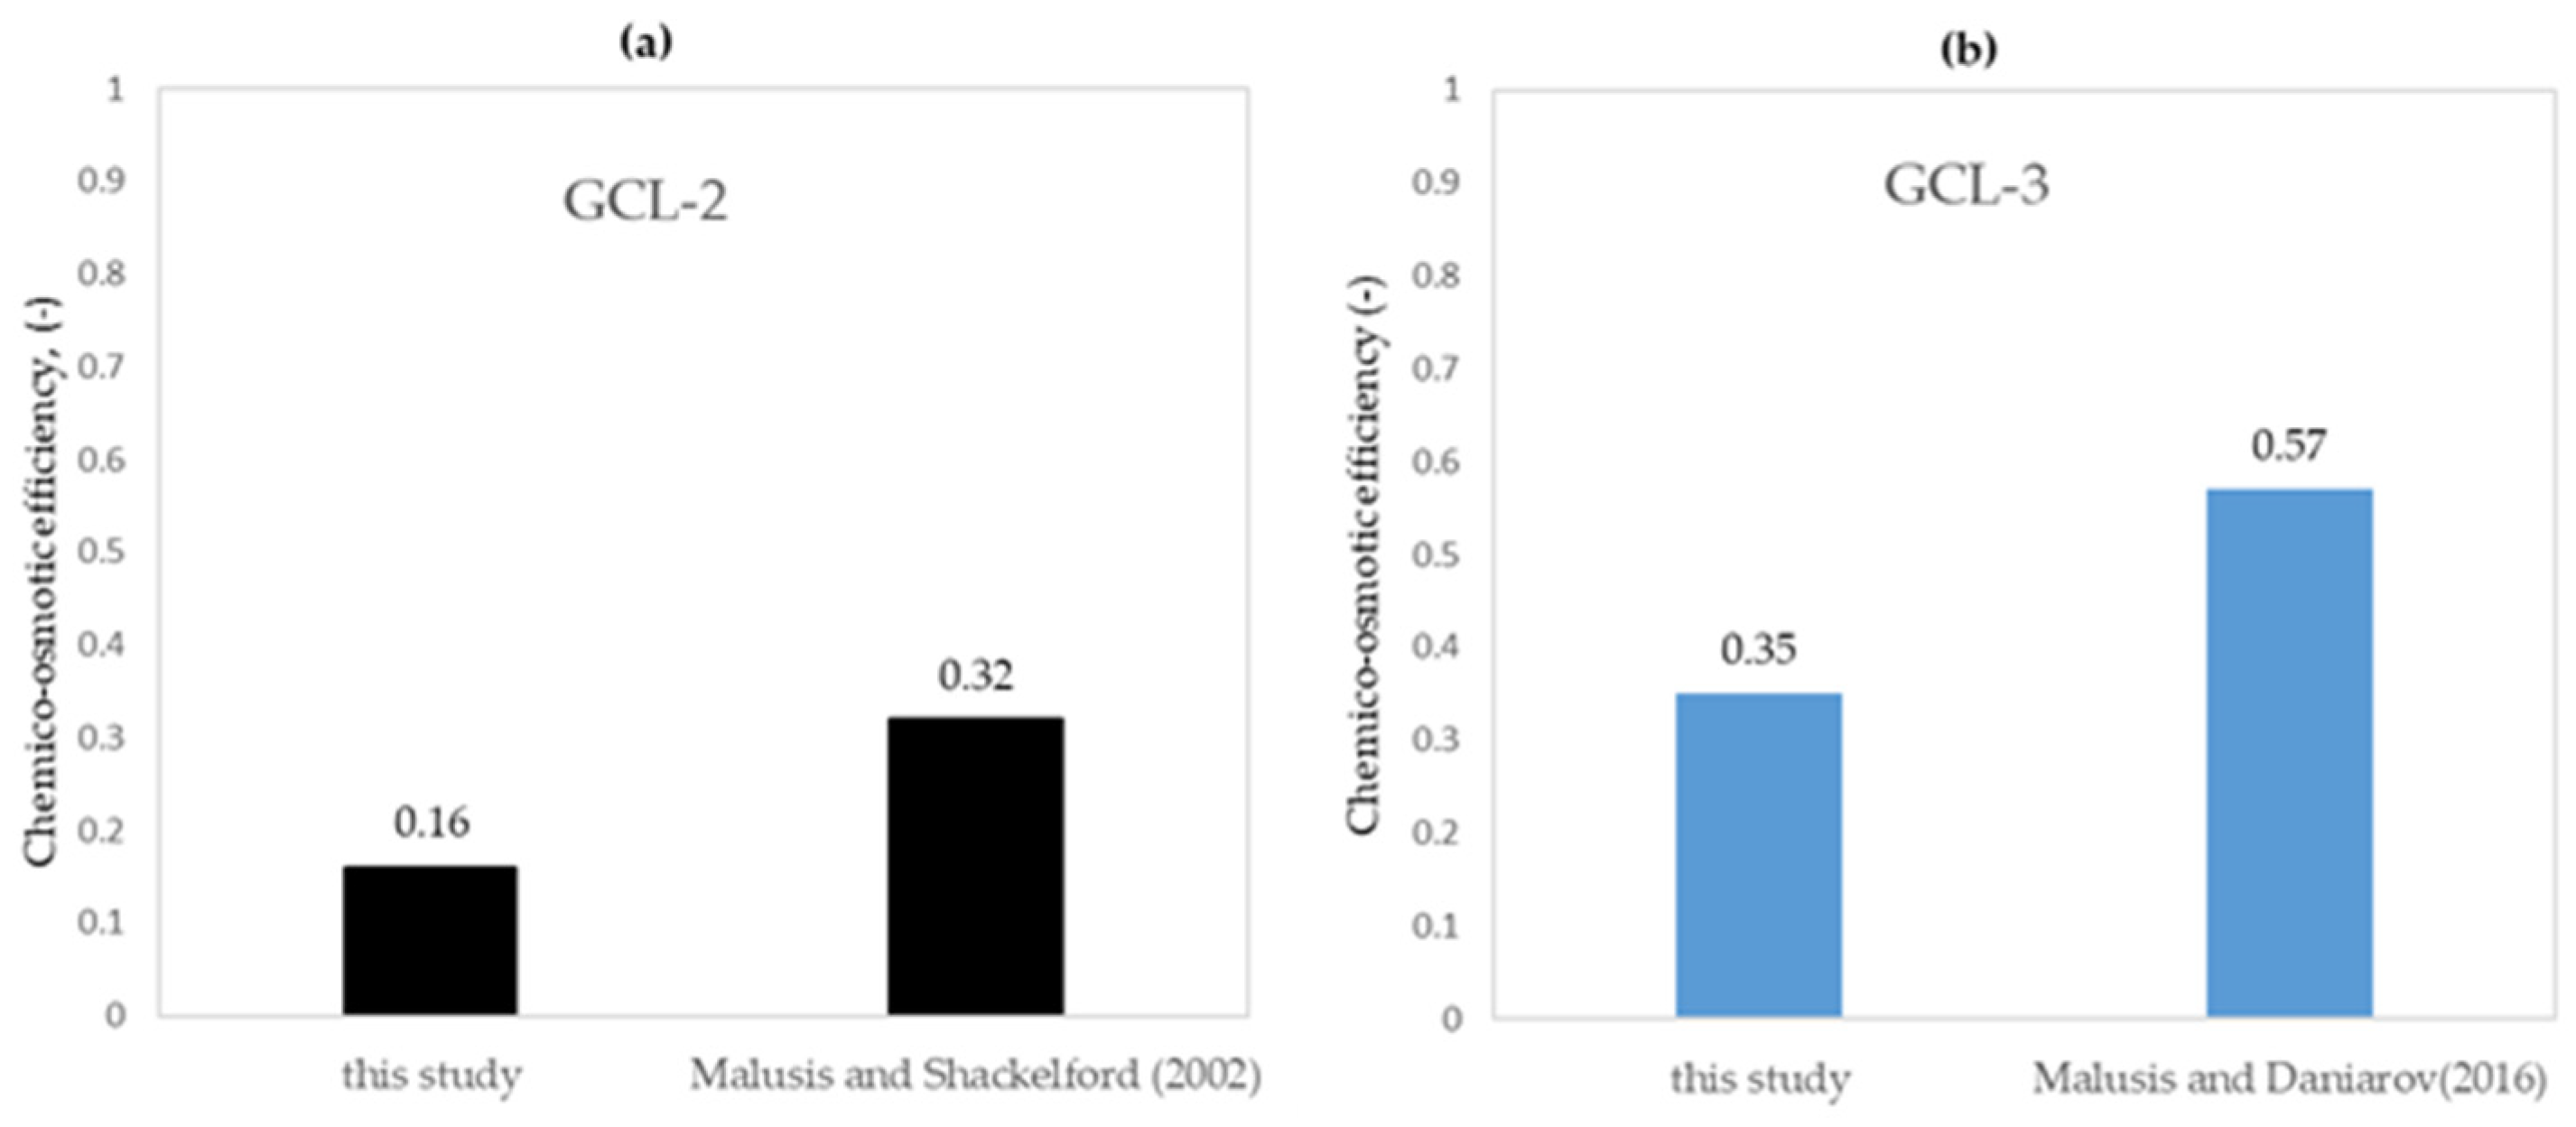
In Figure 5 the results of two tests performed in this study in terms of ω are compared with those reported in [31] and [33], respectively, relating to the same products used in this study (GCL-2 and GCL-3) under the same confinement conditions (no strain set-up, i.e., specimen confined by a locked-in-place piston) and for the same electrolyte solution (20 mM KCl). Regarding the results of GCL-2 (Figure 5a) the ω value obtained in this study (0.17) is lower than obtained (0.32) in the considered study even if the porosity of the specimen observed in this study (n = 0.76) is very close to n = 0.78–0.80, the reported range of porosity values of the specimens. In [33] chemico-osmotic diffusion tests were carried out on a DPH GCL product, similar to the one used in this study, and ω = 0.57 was observed using a 20 mM KCl solution. The lower ω value obtained in this study (ω = 0.35) in the presence of the same solution can be associated to a higher specimen porosity (n = 0.74) with respect to the values reported in the abovementioned study (n = 0.53–0.64).
Figure 5.
Comparison of chemical-osmotic efficiency coefficients obtained in this study with literature data on the same product: (a) GCL-2, (b) GCL-3. Malusis et al. (2002) is reference [31]; Malusis and Danyarov (2016) is reference [33].
Overall, the values of ω obtained in this study are lower than those reported in the literature for the same products under the same testing conditions of the chemico-osmotic diffusion stage (i.e., specimen confined by locked-in-place piston). Due to time required to complete a single chemico-osmotic test, no study has replicated tests to assess the variability associated with the experimental determination of ω on GCLs. Therefore, it is unclear if the observed differences between studies are within the normal experimental variability. Recently, [35] examined the variability of osmotic efficiency coefficients for specimens from different manufacturing lots of the same conventional Na-bentonite product. Comparison of results across different experimental studies revealed significant variability in the reported membrane efficiencies (e.g., by 25 percentage points) even for the same GCL type, concentration, and porosity. A relatively wide range of the final total porosities of DPH GCL specimens (n = 0.53–0.64) was also reported in [33], despite the same specimen preparation and testing conditions were adopted.
Besides normal experimental scatter, additional reasons for the differences observed between the present and previous studies can be hypothesized in:
- inherent product variability among different manufacturing lots (e.g., bentonite quality and content, polymers dosages for GCL-3) as noted in [35].
- differences in the testing procedure prior to chemo-osmotic diffusion stage, as in our case the specimens underwent unloading and reconsolidation after the flushing stage, unlike the studies [31] and [33], in which the flushing stage and the subsequent chemico-osmotic diffusion stage were conducted without unloading. The difference in the specimen preparation and in total porosity could explain the difference observed for GCL-3, since it is recognized that osmotic efficiency decreases with the increase in total porosity [36]. However, the same explanation cannot be invoked in the case of GCL-2, as the total porosity estimated in this study was slightly lower than those reported in [31]. It is possible that the unloading and reconsolidation procedure induced some disturbance or altered the hydrated bentonite fabric with respect to a procedure whereby no unloading takes place, which eventually leads to a lower measured osmotic efficiency coefficient. Additional procedural differences, such as sample size, temperature, frequency of sampling, and characteristics of the apparatus (deformability of the testing cell and drainage lines) may also have contributed.
5.4. Multistage Tests and Theoretical Interpretation
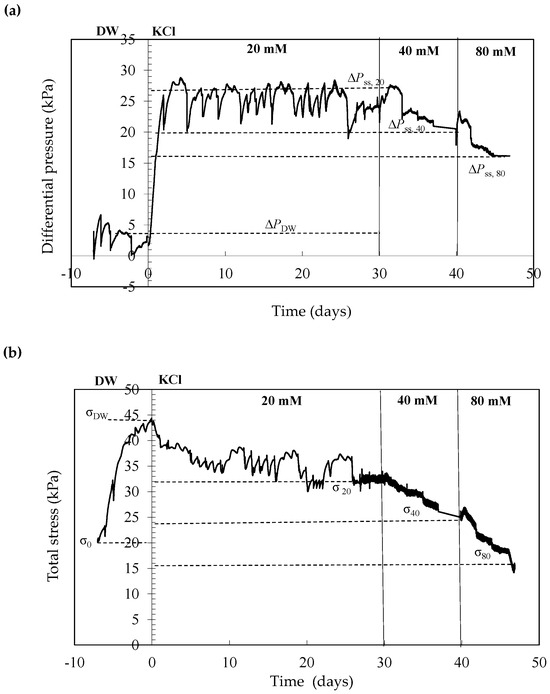
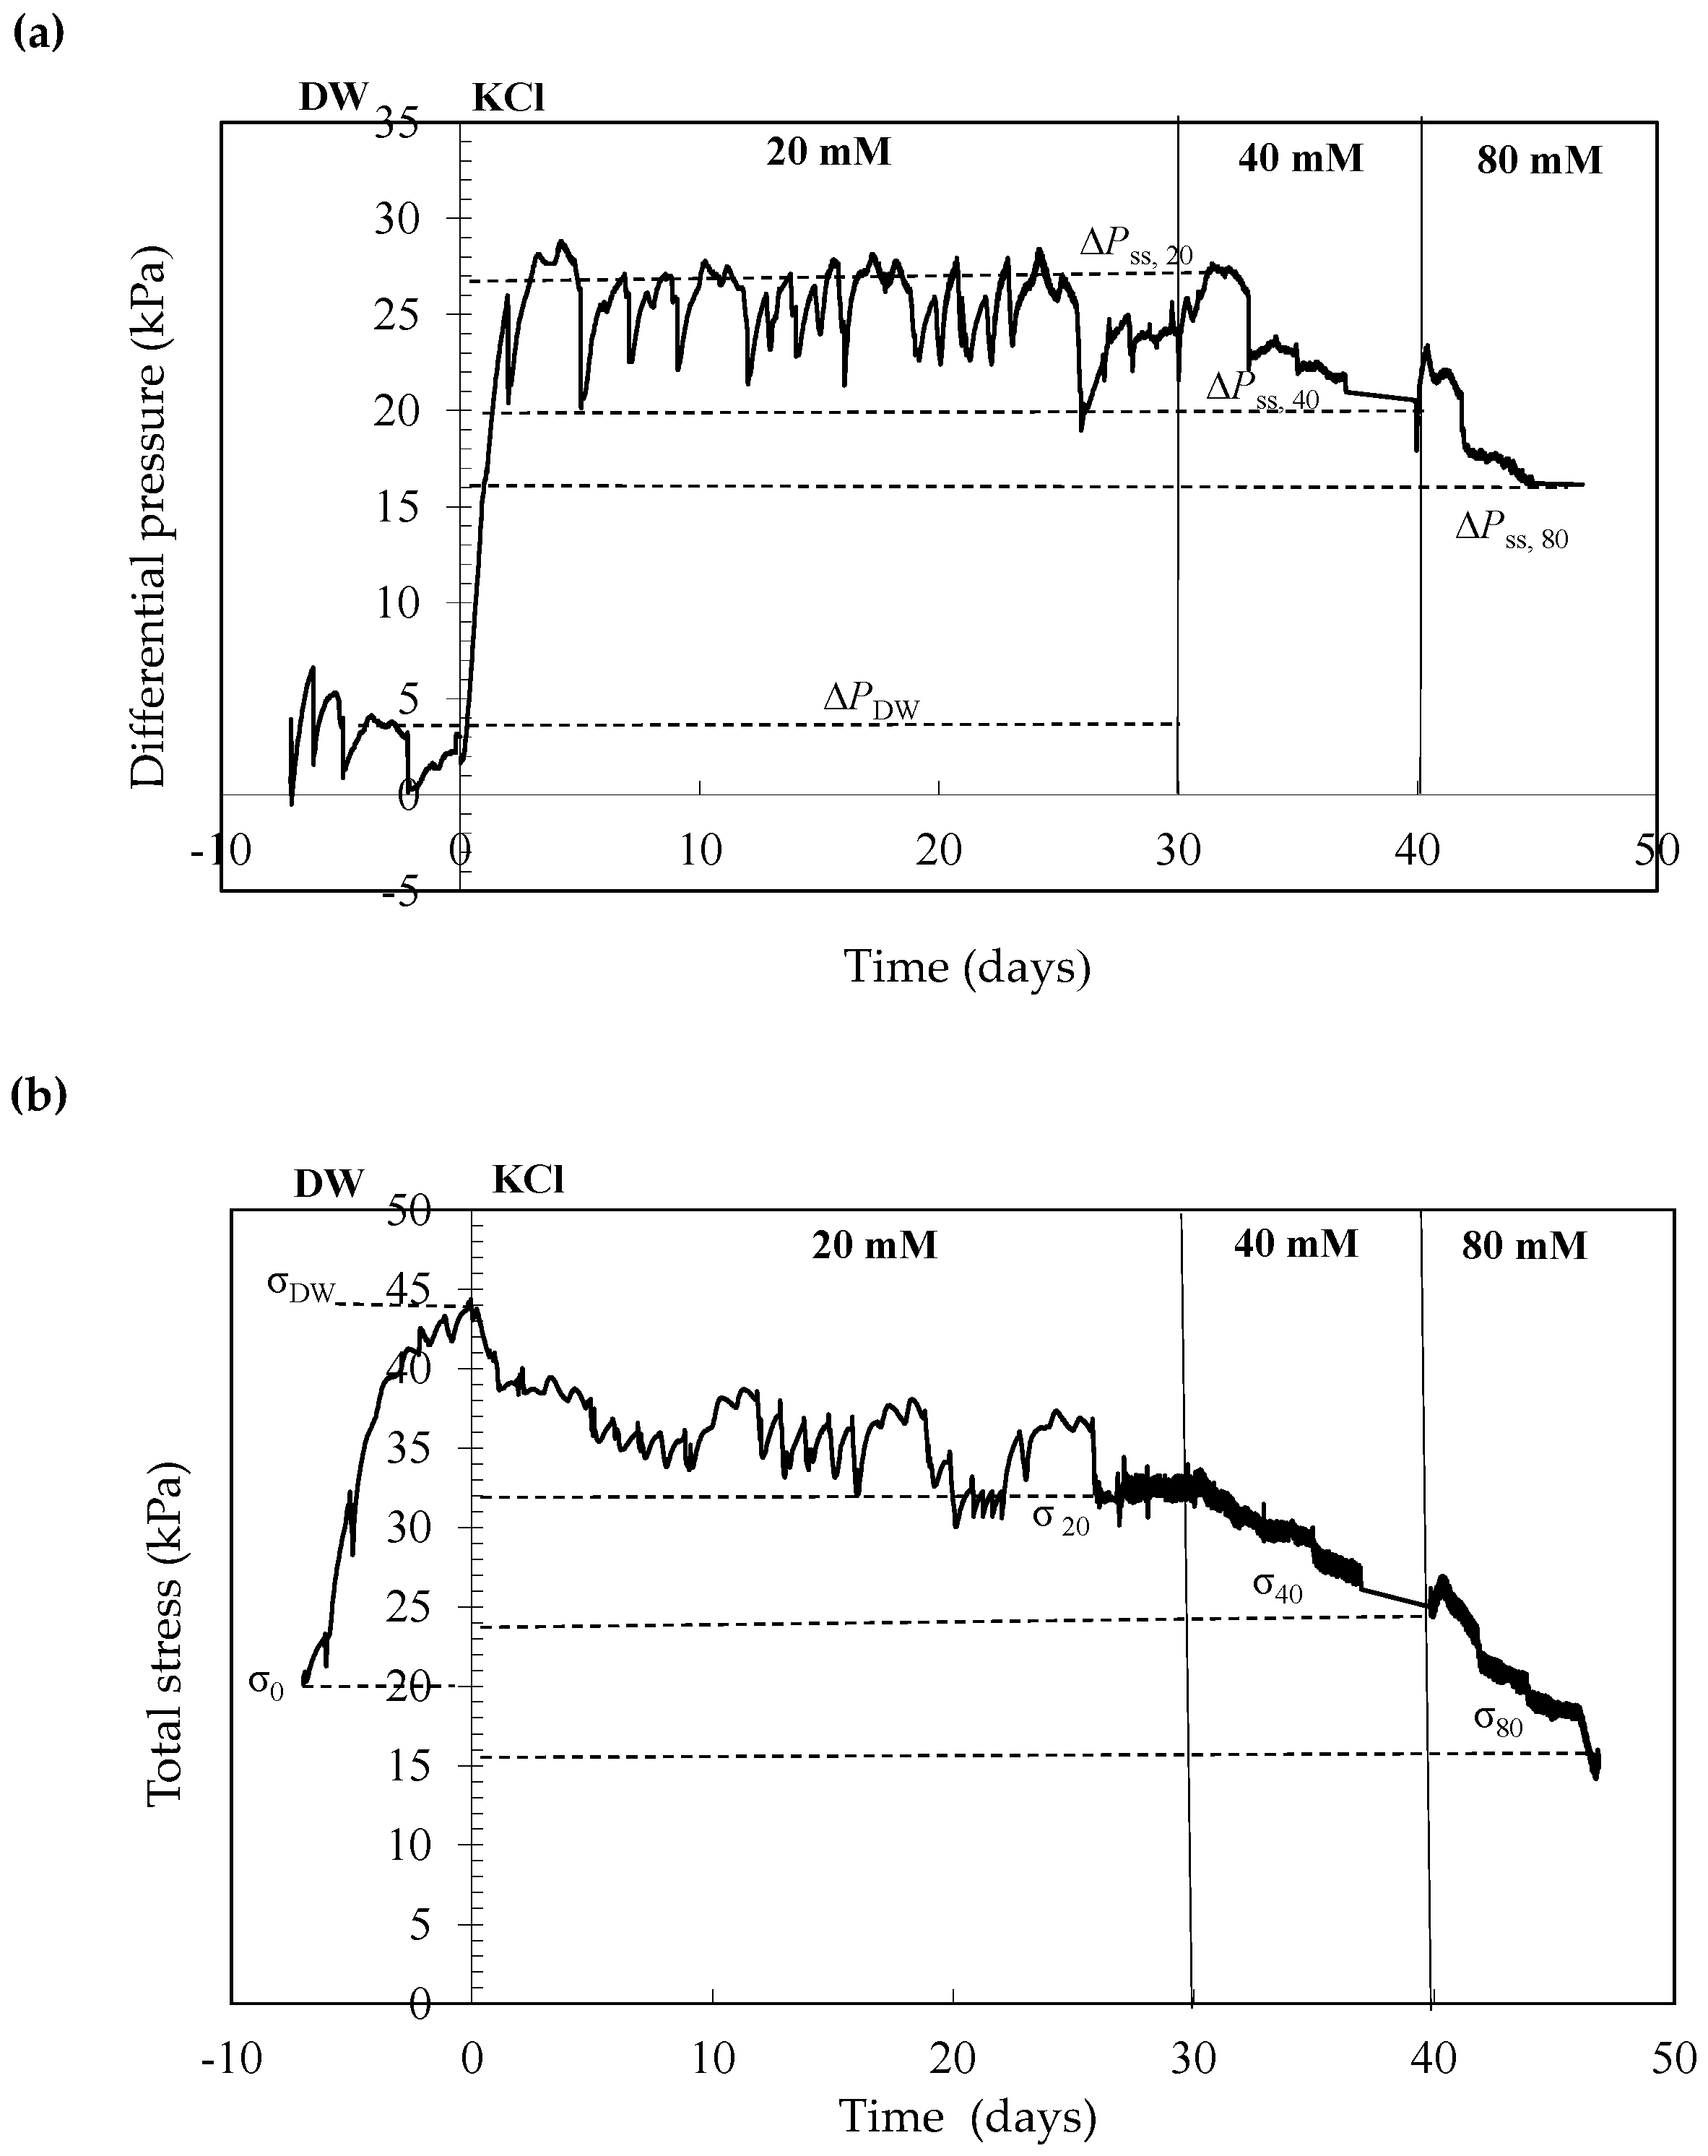
Figure 6a shows the differential pressure values measured during a multistage test on GCL-2, during which the concentration of the KCl solution circulated at the top of the sample was increased in three stages (20 mM, 40 mM, 80 mM) while Figure 6b shows the corresponding measured values of the vertical total stress.
Figure 6.
Trend of differential pressure (a) and total stress (b) during a multistage test on GCL-2 (the circulation time is considered positive starting from the circulation with the 20 mM solution).
The multistage test data were interpreted using the aforementioned theoretical models by assimilating, in the first instance, the void ratio of bentonite to the GCL bulk void ratio [37], eb, and assuming K+ and Cl− as the only ions present in porewater. Moreover, for calculation of the swelling coefficient , the average electrolyte concentration across the specimen at the end of a given testing stage were utilized in Equation (13), since intermediate circulation stages with equal top and the base electrolyte concentration were not performed. Table 2 summarizes the data utilized for the interpretation of the multistage test and the calculated values of ω and .
Table 2.
Interpretation of multistage test on GCL-2.
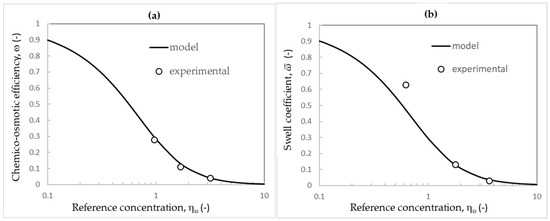
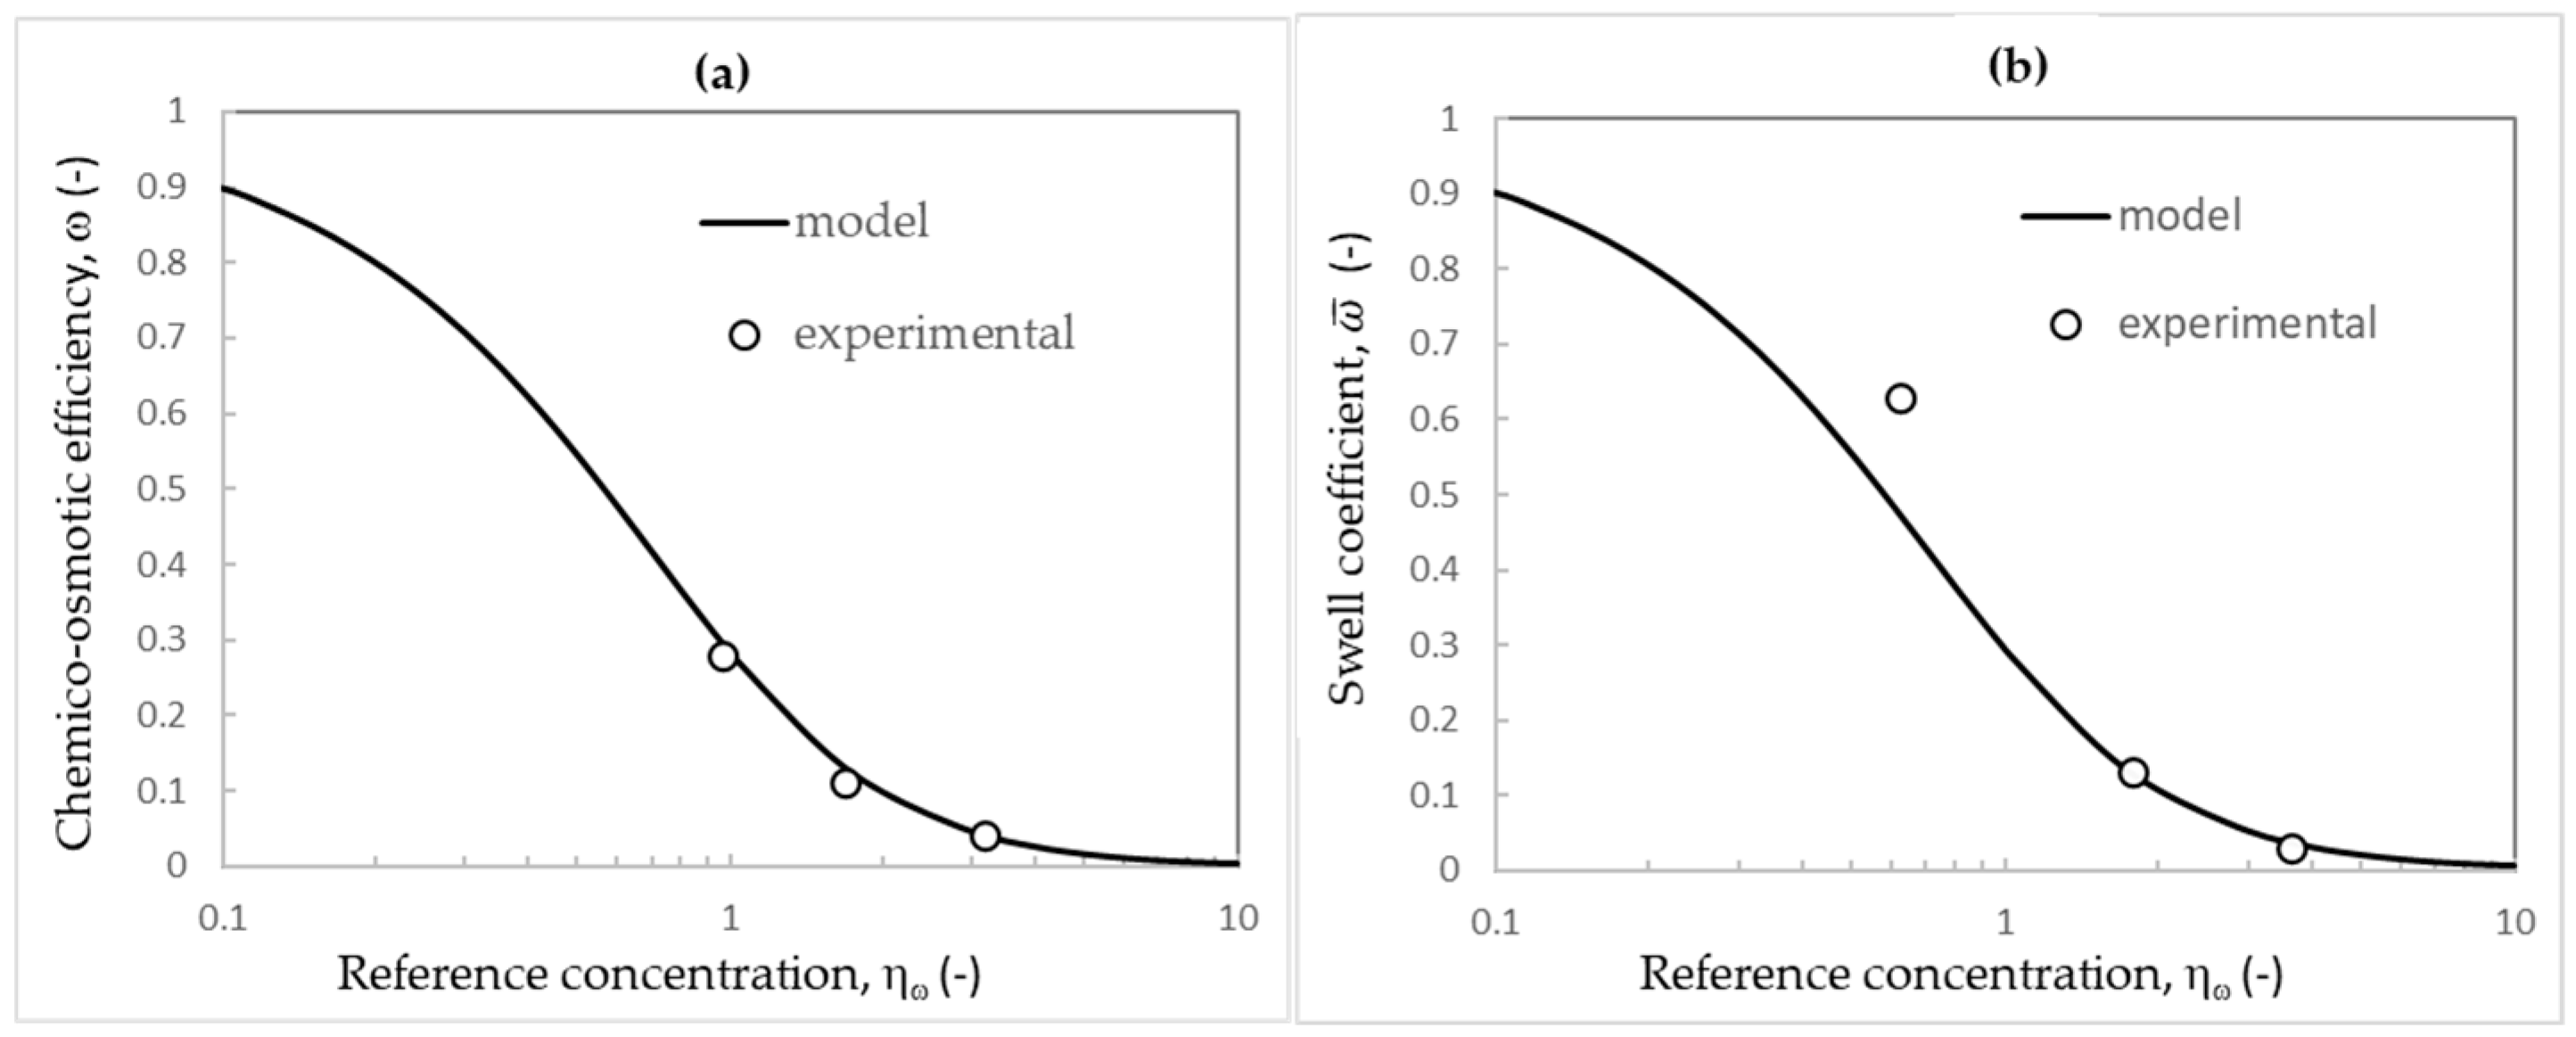
Figure 7 shows excellent agreement between the theoretical prediction (solid line) and the experimental values of ω and , obtained by assuming a single value of the fitting parameter, C’sk,o= 32 mM [38]. The theoretical and experimental values of ω and are plotted as a function of the dimensionless reference concentrations, [22]. The authors recognize that the range of available values for ω and is rather limited and more data would be required for a more robust comparison with the theoretical prediction. To obtain more experimental data at lower , chemico-osmotic diffusion tests should be conducted with electrolyte concentration lower than 20 mM KCl. Unfortunately, lower concentrations entail longer testing times, as the steady-state condition depends upon the chemico-osmotic diffusion coefficient, which decreases with decreasing solute concentration (Table 2), and upon slower equilibrium of the adsorbed cation (i.e., K+). Considering the necessary flushing stage of each specimen (4–6 months) lower concentrations results in long testing times.
Figure 7.
Comparison between the theoretical model and experimental data: (a) ω coefficient; (b) coefficient.
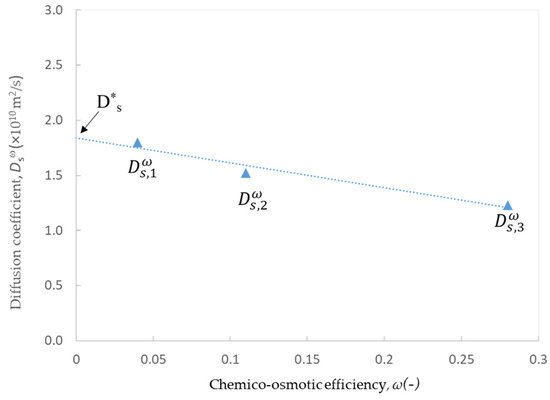
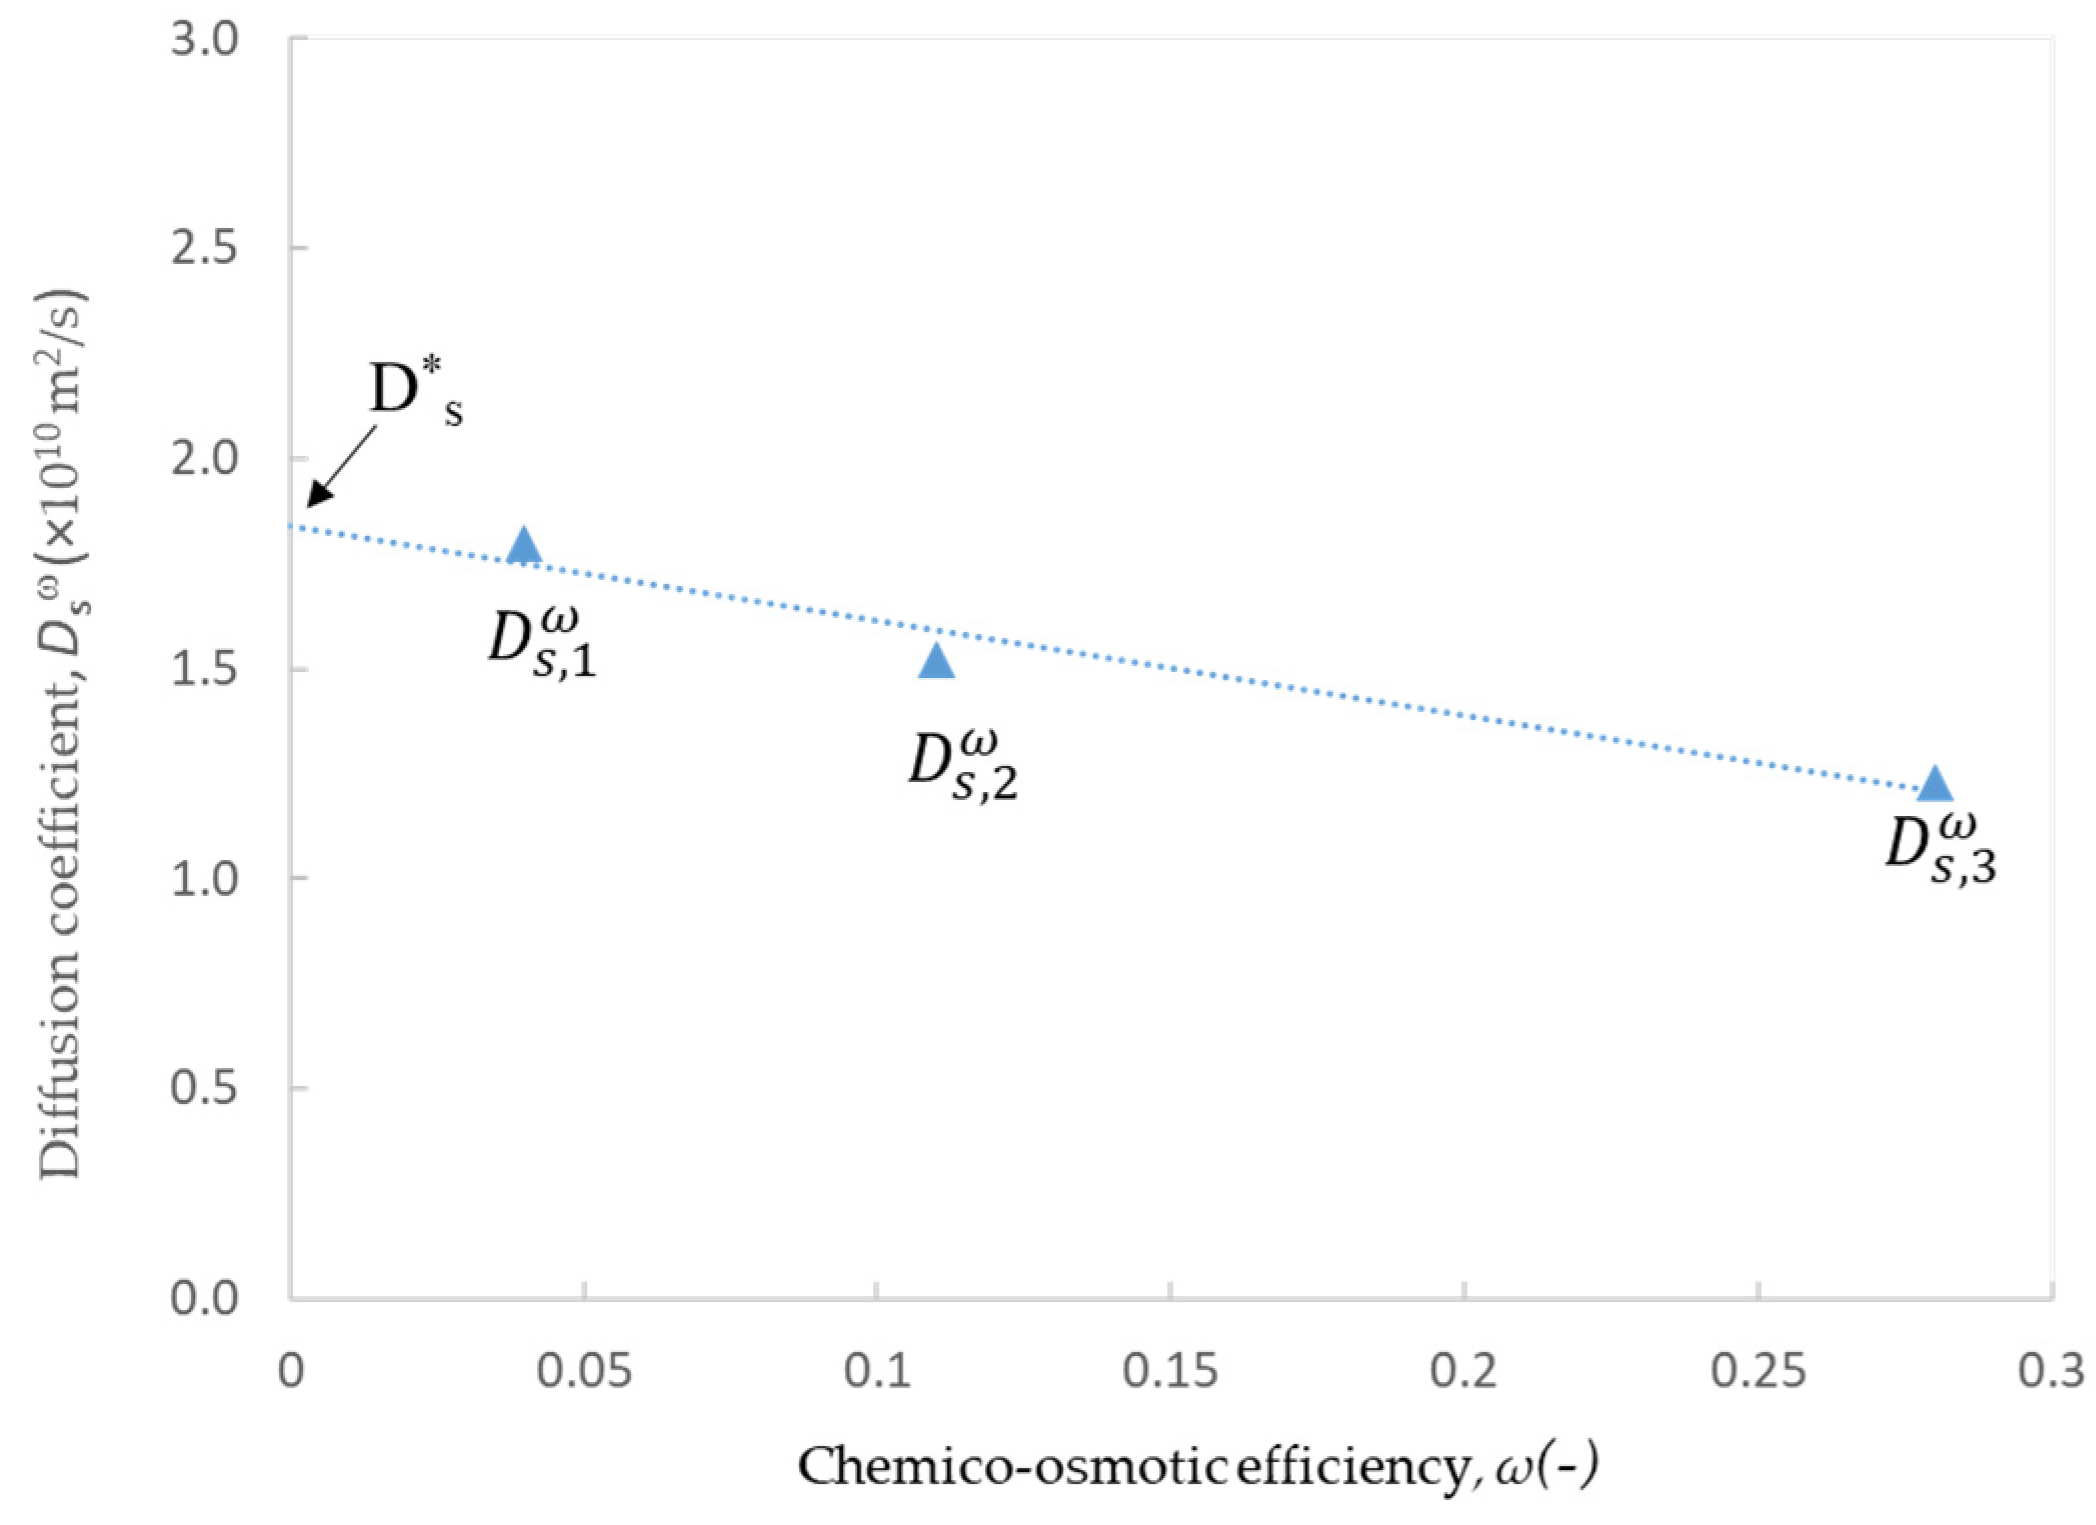
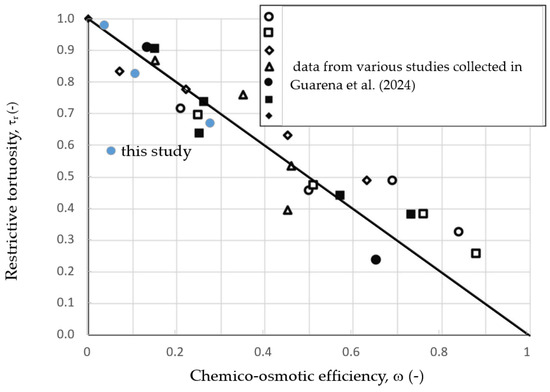
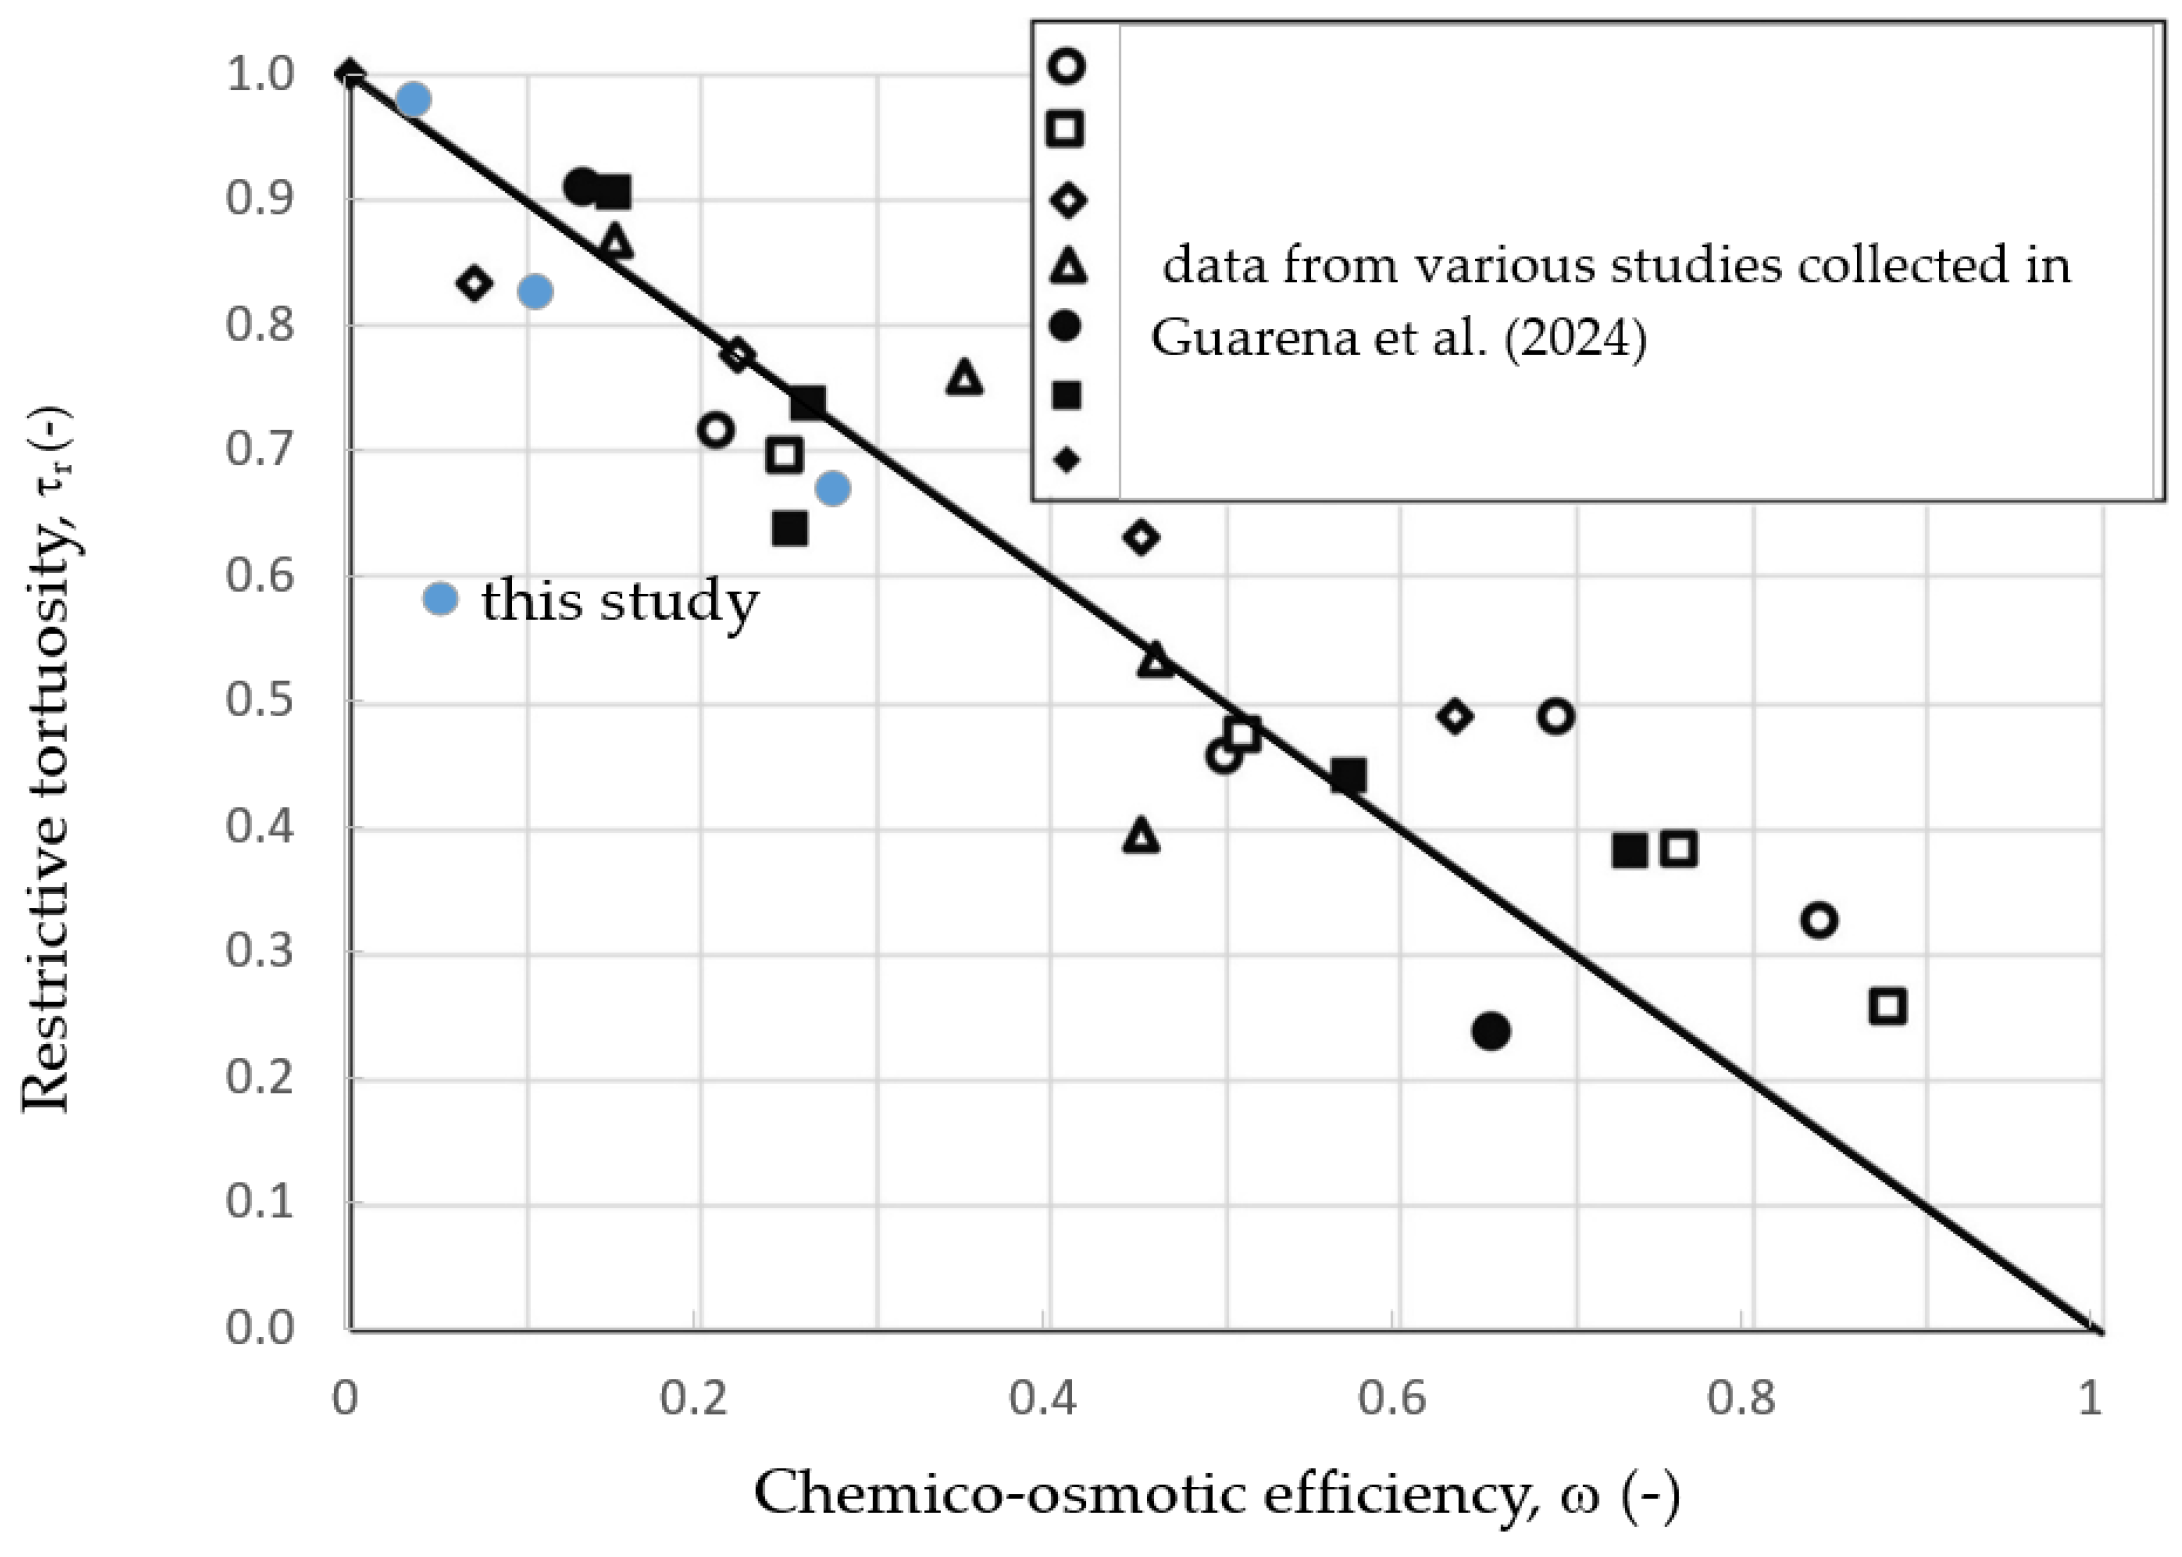
The values of the chemo-osmotic diffusion coefficients calculated for each stage from the measured solute fluxes by Equation (6) are listed in Table 2. Plotting the calculated values vs. the chemical-osmotic efficiency coefficient of the corresponding stage (Figure 8), it is observed that the trend can be conveniently interpolated with a linear law (dotted line in Figure 8). Extrapolating the trend of the chemico-osmotic diffusion coefficient to the value corresponding to ω = 0, it is possible to estimate the effective diffusion coefficient of the electrolyte, Ds* (1.84 × 10⁻¹⁰ m2/s), that accounts only for the geometric restriction to the diffusive flux of solutes. Using Equation (8) it is possible to estimate the values of the restrictive tortuosities for each stage of the test (values in Table 2). In Figure 9 the calculated restrictive tortuosities are plotted (blue circles) versus the chemico-osmotic efficiency along with several literature data [39]. The data points align relatively well along the straight line, providing further evidence that, as hypothesized based on pore scale modelling [24], the relationship between the restrictive tortuosity τr and the chemico-osmotic efficiency ω can be conveniently approximated by the linear law [40,41,42]:
Figure 8.
Chemico-osmotic diffusion coefficient of the electrolyte (KCl) as a function of the osmotic efficiency coefficient and linear interpolation (R2 = 0.95).
Figure 9.
Comparison of the restrictive tortuosities calculated for GCL-2 with literature data for various GCLs (base plot modified from Guarena et al. 2024, ref. [39]).
6. Conclusions
The semi-permeable membrane behaviour of GCLs is of significant interest for containment applications as it can improve their performance as barrier to pollutant migration. As part of a broader research into barriers for pollutant containment, a customized apparatus was designed, devoted to the investigation of chemico-osmotic behaviour of clays and GCLs. The main novelty introduced in this study is that the apparatus allows for the implementation of both testing approaches described in the literature to conduct closed-system chemico-osmotic diffusion testing. In particular, the apparatus allows testing under no volume change condition, as in most prior studies, or monitoring the total stress acting on the specimen owing to the introduction of a load cell, as introduced in one previous study.
The measured osmotic efficiency coefficients were in the range of magnitude expected (i.e., 0 ≤ ω ≤ 1), although somewhat lower than the values described in the literature for the selected GCLs, which may also depend on inherent variability of the GCL properties across different manufacturing lots, as noted also in other studies. The data indicate that the osmotic response of GCLs varies even among products of apparently similar typology, depending on the mass rate and properties of bentonite. Pre-hydrated and polymer-enhanced (DPH) GCLs showed generally higher ω values than conventional products, confirming previous studies. The multistage test highlighted the influence of the solute concentration on the efficiency coefficient and to determine, owing to total stress measurement, the swell coefficient. Finally, although the range of obtained experimental values for ω and is rather limited and more data would be required for a more robust match, a preliminary application of the theoretical model simulated closely both experimental dataset by entering one single value of the fitting parameter C’sk,o.
Author Contributions
Conceptualization, M.D.S., E.F. and D.B.; methodology, D.B. and F.M.; investigation, D.B.; writing—original draft preparation, D.B. and F.M.; writing—review and editing, E.F. and M.D.S.; supervision, F.M. and M.D.S.; project administration, F.M. and M.D.S.; funding acquisition, F.M. All authors have read and agreed to the published version of the manuscript.
Funding
Financial support for this work was provided by Marche Technical University (Italy) under Grant PSA (Progetto Strategico di Ateneo) Call 2017.
Data Availability Statement
The data presented in this study are available on request from the corresponding author. The data are not publicly available due to privacy restrictions.
Conflicts of Interest
The authors declare no conflicts of interest.
References
- Bouazza, A. Geosynthetic Clay Liners. Geotex. Geomem. 2002, 20, 3–17. [Google Scholar] [CrossRef] [Scilit]
- Von Maubege, K.P. Investigation of bentonite requirements for geosynthetic clay barriers. In Clay Geosynthetic Barriers; Gartung, E., Zanzinger, H., Koerner, R.M., Eds.; CRC Press: Boca Raton, FL, USA, 2002; ISBN 9058093808. [Google Scholar] [CrossRef] [Scilit]
- Rowe, K.R.; Quigley, R.M.; Brachman, R.W.I.; Booker, J.R. Barrier Systems for Waste Disposal Facilities, 2nd ed.; Spon Press: London, UK, 2004; 587p. [Google Scholar]
- Kolstad, D.C.; Benson, C.H.; Edil, T.B.; Jo, H.Y. Hydraulic conductivity of a dense prehydrated GCL permeated with aggressive inorganic solutions. Geosynth. Int. 2004, 11, 233–241. [Google Scholar] [CrossRef] [Scilit]
- Katsumi, T.; Ishimori, H.; Onikata, M.; Fukagawa, R. Long-term barrier performance of modified bentonite materials against sodium and calcium permeant solutions. Geotex. Geomem. 2008, 26, 14–30. [Google Scholar] [CrossRef] [Scilit]
- Malusis, M.A.; Shackelford, C.D.; Olsen, H.W. A laboratory apparatus to measure the chemico-osmotic efficiency for clay soils. Geotech. Test. J. 2001, 24, 229–242. [Google Scholar] [CrossRef] [Scilit]
- Kang, J.-B.; Shackelford, C.D. Clay membrane testing using a flexible-wall cell under closed-system boundary conditions. Appl. Clay Sci. 2009, 44, 43–58. [Google Scholar] [CrossRef] [Scilit]
- Mazzieri, F.; Di Emidio, G.; Van Impe, P.O. Diffusion of calcium chloride in modified bentonite: Impact on osmotic efficiency and hydraulic conductivity. Clays Clay Min. 2010, 58, 351–363. [Google Scholar] [CrossRef] [Scilit]
- Mazzieri, F.; Van Impe, P.O.; Di Emidio, G. Chemico-osmotic behaviour of modified “Multiswellable” bentonite. In Proceedings of the 16th International Conference on Soil Mechanics and Geotechnical Engineering, Osaka, Japan, 11 September 2005. [Google Scholar] [CrossRef] [Scilit]
- Yeo, S.S.; Shackelford, C.D.; Evans, J.C. Membrane behavior of model soil–bentonite backfills. J. Geotech. Geoenviron. Eng. 2005, 131, 418–429. [Google Scholar] [CrossRef] [Scilit]
- Tang, Q.; Katsumi, T.; Inui, T.; Li, Z. Membrane behaviour of bentonite-amended compacted clay. Soils Found. 2014, 54, 329–344. [Google Scholar] [CrossRef] [Scilit]
- Fu, X.L.; Zhang, R.; Reddy, K.; Li, Y.C.; Yang, Y.L.; Du, Y.J. Membrane behavior and diffusion properties of sand/SHMP-amended bentonite vertical cutoff wall backfill exposed to lead contamination. Eng. Geol. 2021, 284, 106037. [Google Scholar] [CrossRef] [Scilit]
- Bonhoff, G.; Shackelford, C.D. Improving membrane performance via bentonite polymer nano-composite. Appl. Clay Sci. 2013, 86, 83–98. [Google Scholar] [CrossRef] [Scilit]
- Dominijanni, A.; Guarena, N.; Manassero, M. Laboratory assessment of semipermeable properties of a natural sodium bentonite. Can. Geotech. J. 2018, 55, 1611–1631. [Google Scholar] [CrossRef] [Scilit]
- Sample-Lord, K.M.; Shackelford, C. Membrane behavior for unsaturated bentonite barriers. In Proceedings of the Geo-Congress 2014, Atlanta, Georgia, 23–26 February 2014. [Google Scholar] [CrossRef] [Scilit]
- Rahman, S.A.B.; Sample-Lord, K.M.; Bohnhoff, G.L. Advancing the State-of-the-Art in Bentonite Barrier Research: Measuring Membrane Behavior and Diffusion at Elevated Temperatures. In Geo-Congress 2022; ASCE: Reston, VA, USA, 2022; pp. 100–110. [Google Scholar] [CrossRef] [Scilit]
- Di Emidio, G. Hydraulic and Chemico-Osmotic Performance of Polymer-Treated Clays. Ph.D. Dissertation, Ghent University, Ghent, Belgium, 2010; 249p. [Google Scholar]
- Dominijanni, A.; Guarena, N.; Manassero, M. Strain-controlled oedometer test for the measurement of the chemico-osmotic properties of bentonites. In Proceedings of the 17th ECSMGE 2019, Reykjavik, Iceland, 1–6 September 2019. [Google Scholar] [CrossRef] [Scilit]
- Mazzieri, F.; Bernardo, D. Chemico-osmotic coefficients of geosynthetic clay liners under different confinement conditions. In Proceedings of the Geo-Congress 2023: Soil Improvement, Geoenvironmental, and Sustainability, Los Angeles, CA, USA, 26–29 March 2023; Rathje, E., Montoya, B., Wayne, M., Eds.; ASCE: Reston, VA, USA, 2023. [Google Scholar]
- Bernardo, D.; Domizi, J.; Fratalocchi, E.; Mazzieri, F. Semi-permeable membrane behaviour of conventional and enhanced Geosynthetic Clay Liners. In Proceedings of the Eurogeo 2025 E3S Web of Conferences, Lille, France, 15–18 September 2025; Volume 644. [Google Scholar] [CrossRef] [Scilit]
- Kemper, W.D.; Rollins, J.B. Osmotic efficiency coefficients across compacted clays. Soil. Sci. Soc. Am. J. 1966, 30, 529–534. [Google Scholar] [CrossRef] [Scilit]
- Guarena, N. Relevance of Chemical and Electrical Phenomena to the Semipermeable Properties of Natural and Modified Bentonites. Ph.D. Dissertation, Politecnico di Torino, Torino, Italy, 2022. [Google Scholar]
- Manassero, M.; Dominijanni, A. Modelling the osmosis effect on solute migration through porous media. Géotechnique 2003, 53, 481–492. [Google Scholar] [CrossRef]
- Dominijanni, A.; Manassero, M. Modelling the swelling and osmotic properties of clay soils. Part II: The physical approach. Int. J. Eng. Sci. 2012, 51, 51–73. [Google Scholar] [CrossRef] [Scilit]
- ASTM D2216; Standard Test Methods for Laboratory Determination of Water (Moisture) Content of Soil and Rock by Mass. ASTM International: West Conshohocken, PA, USA, 2019; (last revision).
- ASTM D5993; Standard Test Method for Measuring Mass per Unit Area of Geosynthetic Clay Liners. ASTM International: West Conshohocken, PA, USA, 2022; (last revision).
- ASTM D5890; Standard Test Method for Swell Index of Clay Mineral Component of Geosynthetic Clay Liners. ASTM International: West Conshohocken, PA, USA, 2019; (last revision).
- ASTM D854; Standard Test Methods for Specific Gravity of Soil Solids by the Water Displacement Method. ASTM International: West Conshohocken, PA, USA, 2023; (last revision).
- EUBA. Methodology for the Determination of the Methylene Blue Value of Bentonite; European Bentonite Association: Brussels, Belgium, 2002. [Google Scholar]
- Rhoades, J.D. Salinity: Electrical Conductivity and Total Dissolved Solids. In Method of Soil Analysis Part 3; Sparks, D.L., Ed.; Soil Science Society of America: Madison, WI, USA, 1996; pp. 417–435. [Google Scholar]
- Malusis, M.; Shackelford, C.D. Chemico-osmotic efficiency of a geosynthetic clay liner. J. Geotech. Geoenv. Eng. 2002, 128, 97–106. [Google Scholar] [CrossRef] [Scilit]
- ASTM D5887; Standard Test Method for Measurement of Index Flux Through Saturated Geosynthetic Clay Liner Specimens Using a Flexible Wall Permeameter. West Conshohocken, PA, USA, 2022; (last revision).
- Malusis, M.A.; Daniyarov, A.S. Membrane efficiency and diffusive tortuosity of a dense prehydrated geosynthetic clay liner. Geotex. Geomem. 2016, 44, 719–730. [Google Scholar] [CrossRef] [Scilit]
- Mazzieri, F.; Bernardo, D. Permeability and solute sorption of unamended and polymer-enhanced geosynthetic clay liners. Env. Geotech. 2024, 11, 77–89. [Google Scholar] [CrossRef] [Scilit]
- Polat, F.; Rahman, S.; Sample-Lord, K.; Yesiller, N.; Hanson, J.L.; Malusis, M.A. Variability in Membrane Behavior of Geosynthetic Clay Liners. In Proceedings of the GeoCongress 2024, Vancouver, BC, Canada, 25–28 February 2024. [Google Scholar] [CrossRef] [Scilit]
- Shackelford, C.D. Membrane behaviour in engineered bentonite-based containment barriers: State of the art. In Proceedings of the International Symposium on Coupled Phenomena in Environmental Geotechnics, Torino, Italy, 1–3 July 2013; CRC Press/Balkema, Taylor & Francis Group: London, UK; pp. 45–60. [Google Scholar] [CrossRef] [Scilit]
- Petrov, R.J.; Rowe, R.K.; Quigley, R.M. Selected Factors Influencing GCL Hydraulic Conductivity. J. Geotech. Geoenviron. Eng. 1997, 123, 683–695. [Google Scholar] [CrossRef] [Scilit]
- Bernardo, D. Migrazione di Soluti e Fenomeni Chimico-Osmotici Nelle Barriere Bentonitiche Per il Contenimento di Inquinanti. Ph.D. Thesis, Università Politecnica delle Marche, Ancona, Italy, 2024. [Google Scholar]
- Guarena, N.; Dominijanni, A.; Manassero, M. Pores scale mechanisms underlying the behaviour of enhanced bentonites exposed to aggressive inorganic solutions. Appl. Clay Sci. 2024, 251, 107318. [Google Scholar] [CrossRef] [Scilit]
- Malusis, M.A.; Kang, J.B.; Shackelford, C.D. Restricted salt diffusion in a geosynthetic clay liner. Environ. Geotech. 2015, 2, 68–77. [Google Scholar] [CrossRef] [Scilit]
- Dominijanni, A.; Manassero, M.; Puma, S. Coupled chemical-hydraulic mechanical behaviour of bentonites. Géotechnique 2013, 63, 191–205. [Google Scholar] [CrossRef] [Scilit]
- Mazzieri, F.; Di Emidio, G. Hydraulic conductivity of a dense prehydrated geosynthetic clay liner. Geosynth. Int. 2015, 22, 138–148. [Google Scholar] [CrossRef] [Scilit]

Disclaimer/Publisher’s Note: The statements, opinions and data contained in all publications are solely those of the individual author(s) and contributor(s) and not of MDPI and/or the editor(s). MDPI and/or the editor(s) disclaim responsibility for any injury to people or property resulting from any ideas, methods, instructions or products referred to in the content. |
© 2025 by the authors. Licensee MDPI, Basel, Switzerland. This article is an open access article distributed under the terms and conditions of the Creative Commons Attribution (CC BY) license.