Abstract
The chemical composition of bottom sediments in the northern part of Lake Umbozero, located in close proximity to a closed rare metal mine in the Murmansk Region, was studied. This study is a continuation of our research into the impact of closed rare metal mines and tailings on the environment. Samples were collected using an open gravity sampler in two sections of the lake in three replicates. The content of rare earth elements was determined using inductively coupled plasma mass spectrometry. The total content of elements was determined both in the surface layers of bottom sediments and in the deep layers that were formed in the preindustrial period and, thus, characterize the geochemical background of the study area. The average ∑REE in the surface layers of bottom sediments of Lake Umbozero in the wastewater reception area (Site 1) reaches 774 mg/kg, while for the area located north of the discharge site (Site 2), ∑REE was 208 mg/kg. The enrichment factor (EF), the geoaccumulation index (Igeo), the coefficient of the index of potential ecological risk (Eir) and the index of potential ecological hazard (RI) were calculated. Assessing the total pollution of bottom sediments of Lake Umbozero with rare earth elements, the value of potential ecological risk reaches values corresponding to the level of low and moderate ecological risk of pollution (RISite 1 = 164; RISite 2 = 104). The conducted correlation analysis allowed us to establish the main phases containing rare earth elements in the bottom sediments of Lake Umbozero—oxyhydroxide complex compounds with iron and manganese.
1. Introduction
Large mining and processing enterprises are powerful sources of negative impact on the environment all over the world [1,2,3,4,5]. Extraction and enrichment of ores is accompanied by the formation of a huge amount of waste: solid mineral waste is a source of serious pollution of the atmosphere, soil, surface and groundwater with potentially toxic elements, as wastewater from enterprises is often not purified from pollutants to standard values (standard for permissible wastewater discharges). Evidently, the development of rare metal ore deposits can pose a threat to the environment, increasing the concentration of rare earth elements (REEs) in the components of the environment [6,7,8]. In this regard, monitoring the state of environmental components in the zone of influence of mining enterprises in the conditions of a subarctic climate and ecosystems with a low capacity for self-restoration is an important scientific and practical task [9].
It is known that surface water bodies, in particular, lakes, are collectors of pollution of various genesis, and bottom sediments (BSs) are the main depositing environment, allowing for the duration and intensity of the entry of elements into the biosphere to be determined [10]. The analysis of vertical sections of BSs allows us to reconstruct the history of accumulation and migration of elements over time. Geochronometric dating of layers helps to establish the chronology of changes in the chemical composition of BSs and identify periods of increased anthropogenic load on aquatic ecosystems [11,12].
Recently, scientists have been actively studying the issues of REE geochemistry in BSs and lake water, paying special attention to the consequences of anthropogenic impact on water bodies [13,14,15,16]. High REE content in surface waters and BSs of water bodies is naturally found in industrially developed areas [17,18,19]. At the same time, this indicator can be influenced by geogenic factors, such as the natural geological structure of rocks in the study area [20].
Previously, we selected and studied BS samples from lakes Ilma, Krivoe and Lovozero, which were subject to varying degrees of anthropogenic pollution from the rare metal enterprise operating in the Lovozero district of the Murmansk region [4].
The aim of this study is to determine the levels of REE content in the sediments of the northern part of Lake Umbozero and to assess the impact of industrial activity on the change in REE composition in sediments in the zone of influence of the closed rare metal mine “Umbozero”.
2. Materials and Methods
2.1. Brief Description of the Study Area
The Lovozero alkaline massif is located in the central part of the Kola Peninsula, between 67°45′–67°55′ north latitude and 32°20′–35°0′ east longitude (from Greenwich) [21]. The massif is a complex multiphase intrusion with an area of 650 km2, belonging to the Late Devonian Kola alkaline province, which unites massifs of alkaline-ultramafic rocks and nepheline syenites. The host rocks are Archean gneisses and an effusive-sedimentary sequence of Devonian age [22].
The climate (Dfc) is subarctic. The average annual temperature in Revda, based on observations, is estimated at 0.2 °C. The month when the temperature is highest is July with an average temperature of 15.2 °C. The month with minimum temperatures is January; its daily average temperature is −13.0 °C. The upper temperature limit is set in July up to 24.2 °C, and the minimum can be up to −24.0 °C in January. During one calendar year: sunny and clear days—39; days with snow—153; days with rain—122; cloudy days—52 [23].
The object of the study was the territory of the rare metal mine “Umbozero”. The company developed the deposit since 1984. The mine and the processing plant mined and processed loparite ((Na, Ce, Ca)(Ti, Nb)O3) ores. Due to a rock burst in 1999, the Umbozero mine was flooded, and in 2009 it was closed [24]. Currently, the mine has ceased operations. During the operation of the enterprise, wastewater flowed into Lake Umbozero, which is the second largest body of water in the Murmansk region [25].
The rivers in the territory of the study area belong to the group of small mountain rivers flowing down from mountain heights and emptying into lakes Umbozero and Lovozero [4,26]. Their width is insignificant, up to 5 m; the depth on the rapids and rifts is 0.1–0.8 m, up to 3 m on the reaches, and the flow speed is 0.2–0.7 m/s, up to 2.7 m/s on the rapids. The riverbeds are meandering rapids, and the bottom is sometimes rocky. The banks are predominantly steep and up to 1 m high. Creeks Alluive (6.5 km), Azimuth (8.7 km), Sengisyavr (9.2 km) and Tavayok (11.7 km) flow into Lake Umbozero. In the upper reaches, they are characterized by a rapid creek and numerous rapids, while in the lower reaches, they flow through forests and swampy areas. The rivers receive numerous tributaries along their entire length [4].
2.2. Sampling and Analysis
Lake Umbozero is a large freshwater lake in the Lovozero District of the Murmansk Region, in the southwestern part of the Kola Peninsula, and is classified as a fishery water body of the highest category. Samples of BSs were collected in 2025 at two points: near the site of the enterprise’s wastewater intake (Site 1) and to the north, at a considerable distance from the mine (Site 2) (Figure 1).
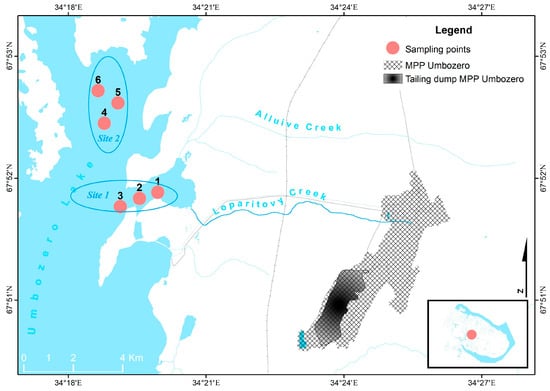
Figure 1.
Layout of BS sampling sites.
Samples of BSs were taken using an open-gravity-type bottom sediment core sampler in triplicate. Samples of BSs were disassembled into layers 1 cm high, then dried, ground with a rubber pestle in a mortar to a powdery state and submitted for analysis to the Center for Collective Use of the Institute of Problems of Industrial Ecology of the North, KSC RAS.
The samples were ashed at 550 °C and the absolutely dry sample was placed in a glassy carbon crucible. The samples were decomposed by an open acid method in hydrofluoric acid with evaporation to wet salts. Then, the sample was dissolved in concentrated nitric acid with heating, followed by dilution with 2% HNO3 with heating. After the sample solution cooled, it was quantitatively transferred to plastic test tubes with screw caps, 4–5 drops of H2O2 were added and brought to a fixed volume of 20–30 mL, and 2% HNO3 (distilled from “os.ch”) was used as a dilution solution and a blank sample.
The concentrations of microelements, namely, Mn and Fe, were determined in the resulting solutions with inductively coupled plasma mass spectrometry (ELAN 9000 (PerkinElmer, Waltham, MA, USA)) [27]. The analysis of the organic matter content was determined following the state standard № R57065-2016 [28] by loss on ignition, which was calculated by weight after the calcination of samples at a temperature of 550 °C in a muffle furnace [17]. The control and quality of the analysis was ensured by the simultaneous decomposition and analysis of certified standard samples of the BSs of Lake Baikal BIL-2 (GSO 7176-95) [4]. The measurement error did not exceed 0.5% at p = 0.95.
A certain content of elements in samples of BSs was compared, along with Clarke Numbers of elements in the Earth’s crust according to [29], limits of contents in BSs of freshwater ecosystems according to [30], average contents in BSs of Lake Imandra [19] and average contents in BSs of Lake Lovozero, studied by us earlier [4].
2.3. REE Contamination and Risk Assessment
The enrichment factor (EFi), geoaccumulation index (Igeo), potential ecological risk index factor (Eir) and potential ecological hazard index (RI) [31] were calculated by the following equations:
where Ci is the metal concentration, measured for each investigated sample; Cbi is the background concentration of the metal.
where Cn is the measured total concentration of heavy metals (HM), in our case—TE, determined in a soil (mg/kg); Bn is the geochemical background value of the elements.
where Ti is a factor of the toxic reaction of an individual toxic element. The Ti values of 15 REEs were calculated: La = 1; Ce = 1; Pr = 5; Nd = 2; Sm = 5; Eu = 10; Gd = 5; Tb = 10; Dy = 5; Ho = 10; Er = 5; Tm = 10; Yb = 5; Lu = 20; Y = 2 [31].
EFi = Ci/Cbi
Igeo = log2 (Cn/1.5Bn)
Eir = Ti × Cn/Bn
RI = ∑ Eir
EF [32,33]:
- -
- No enrichment (<1);
- -
- Minor enrichment (1–3);
- -
- Moderate enrichment (3–5);
- -
- Moderately severe enrichment (5–10);
- -
- Severe enrichment (10–25);
- -
- Very severe enrichment (25–50);
- -
- Extremely severe enrichment (>50).
The Igeo values were interpreted as suggested [34,35,36] (Igeo value–Igeo class–pollution level):
≤0–0—unpolluted;
0–1–1—unpolluted to moderately polluted;
1–2–2—moderately polluted;
2–3–3—moderately polluted to highly polluted;
3–4–4—highly polluted;
4–5–5—highly polluted to very highly polluted;
>5–6—very highly polluted.
The potential ecological risk index factor and potential ecological hazard index were interpreted as suggested [37,38,39,40] for the Er value:
- -
- Low ecological risk (<40);
- -
- Moderate ecological risk (40–80);
- -
- Appreciable ecological risk (80–160);
- -
- High ecological risk (160–320);
- -
- Serious ecological risk (>320).
For the RI value:
- -
- Low ecological risk (<150);
- -
- Moderate ecological risk (150–300);
- -
- High ecological risk (300–600);
- -
- Significantly high ecological risk (>600).
2.4. Data Processing
Statistical analysis was performed in the OriginPro 9.1 software package. The hypothesis about the normality of the distribution of the obtained data was preliminarily tested using the Shapiro–Wilk test. The relationship between certain contents of chemical elements was assessed by correlation analysis using the Spearman coefficient (the samples do not obey the law of normal distribution).
3. Results and Discussion
3.1. Subsection
The average sedimentation rate in the lakes of the Kola Peninsula is about 0.1 cm per year [41]. Since the enterprise began its operations in 1984, the content of elements in the layers of sediment cores more than 4–5 cm thick can be considered conditionally background, reflecting the preindustrial geochemical environment. It should be noted that in this case we consider the “preindustrial background” to be only the time before the mine began to operate and, accordingly, before the start of the flow of wastewater from the enterprise into Lake Umbozero.
The results of the chemical analysis of the samples are presented in Table 1. Additionally, the Clarke contents of REE in the earth’s crust are given [29], as are the limits of contents in the sediments of freshwater ecosystems [30] and the average contents in the sediments of Lake Imandra, subject to anthropogenic pollution from the enterprise developing the apatite-nepheline ore deposit, which includes REE [19], and Lake Lovozero at the site of the Sergevan River intake, which also experiences anthropogenic load and was determined in our previous study [4]. For clarity, the obtained data are also presented in Figure 2.

Table 1.
The content of REEs in BSs of the studied sites and other objects, mg/kg.
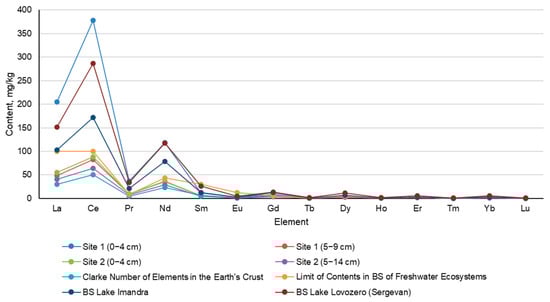
Figure 2.
∑REE in different objects.
As can be seen in Table 2 and Figure 2, the average REE contents in the BS samples of Site 1 of the northern part of Lake Umbozero significantly exceed the element Clarkes in the earth’s crust, the limits of content in the BSs of freshwater ecosystems and the average content in the BSs of Lakes Imandra and Lovozero. Evidently, high REE levels were found in the upper layers of the selected cores—0–4 cm—which is due to the operation of the rare metal enterprise. It should be noted that the average contents of REEs in the BSs of the studied sites are distributed in accordance with the Oddo–Harkins rule [42].
Table 2.
Enrichment factor, geoaccumulation index, potential ecological risk index factor and potential ecological hazard index.
The vertical distribution of the ∑REE in the selected samples of BS of Lake Umbozero is shown in Figure 3.
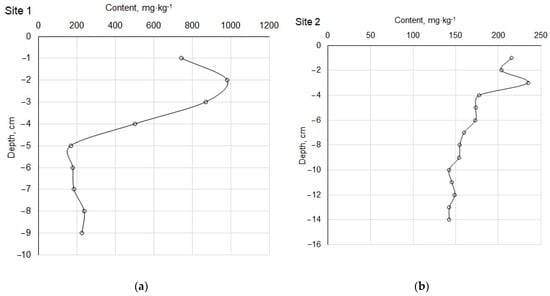
Figure 3.
The vertical distribution of the content of the ∑REE in the selected samples of BSs of Lake Umbozero: (a) Site 1; (b) Site 2.
The diagrams of vertical distribution of the ∑REE in the BS of Lake Umbozero are qualitatively similar with insignificant variability of metal contents in deeper layers. In the past 40 years, a sharp increase in the ∑REE in the upper layers of the BS can be observed. Evidently, the lowest ∑REE are characteristic of Site 2, and the highest ones are characteristic of Site 1. It was previously reported that the Azimut and Loparitovy creeks were the collectors of wastewater from the operating enterprise [25].
It should be noted that the tendency for the ∑REE level to decrease in the uppermost layer of the BS. This is probably due to the closure of the processing plant. On the other hand, one cannot exclude the possible influence of not only the creeks flowing into Lake Umbozero, but also the probability of dust particles from the tailing storage facility of the closed plant [43]. As we have shown previously, elevated ∑REE in the sediments of lakes located near mining enterprises may be a consequence of both the entry of elements into water bodies in dissolved form with wastewater and due to dusting of finely dispersed enrichment tailings [4].
The continuing negative impact is evidenced by the fact that water bodies continue to be polluted with fluorides. Last year, we conducted a geoecological assessment of the pollution of environmental components with fluorides. The source of watercourse pollution is villiaumite, which is present in the composition of the developed deposit. Increased fluoride content was detected in samples from the Loparitovy creek and a watercourse from the mines that formed after a rock burst. The concentrations were lower than they were 20 years ago during the operation of the enterprise. However, the excess of the maximum permissible concentration (MPC) is still significant—up to 15 mg/L with an established MPC of 0.75 mg/L [44].
3.2. Contamination Level and Potential Ecological Risk
Based on the data of chemical analysis of samples of BSs of the sites, the enrichment factor, geoaccumulation index, potential ecological risk index factor and potential ecological hazard index were calculated to assess the contamination of BSs with REEs (Table 2).
According to the calculated EF values, a minor enrichment of the BSs of Site 2 of Lake Umbozero with all REEs and of Site 1 with heavy REEs was revealed. A level of “moderate enrichment” was found for the BSs of Site 1 with light REEs (La-Eu), with the highest EF values of 4.57 for Ce and 4.27 for La.
According to the calculated Igeo value, the pollution of the BSs of Site 2 of Lake Umbozero belongs to the unpolluted category. At the same time, for Site 1, the level of pollution of the BSs with light REEs varies from unpolluted to moderately polluted.
The calculated values of the coefficient of the index of potential ecological risk for the BSs of both sites approach the lower limit of values corresponding to low ecological risk, but do not cross it.
At the same time, the calculated values of the index of potential ecological hazard of the BSs of Site 2 (RI = 103.9) correspond to the category of low ecological risk, and for Site 1 (RI = 163.9) moderate ecological risk.
The uneven enrichment of REE deposits is obviously due to the geological structure of the massif, which is a deposit of rare metal ores of the cerium group (Figure 4) [43].
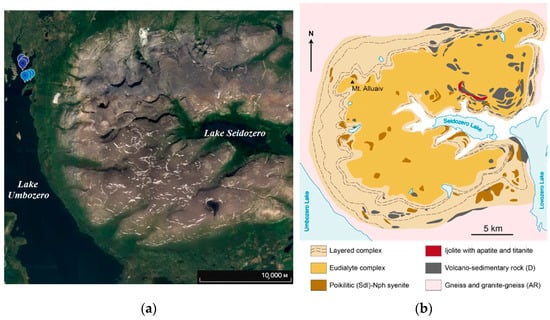
Figure 4.
Maps of the study area: (a) geographical; (b) geological [45].
3.3. Correlation Matrix
In order to establish possible relationships between REEs and determine their main sources in the BSs of Lake Umbozero, the Spearman correlation coefficient was calculated (Table 3) [46,47].
Table 3.
Matrix of Spearman correlation coefficients for BSs of Site 1 (lower triangle on the left) and Site 2 (upper triangle on the right).
In the samples of the BSs of Site 1 of Lake Umbozero, a very strong positive correlation is observed between both light and heavy REEs (r = 0.97–0.99), which indicates a point source of anthropogenic impact [40]. In the samples of the BSs of Site 2 of Lake Umbozero, an equally strong positive correlation was found between light REEs. These same elements are part of the developed deposit and the tailings of rare metal ore enrichment, which suggests that the lake is contaminated by previously incoming wastewater from the enterprise during its years of operation and dusting of waste stored in the tailing storage facility.
The absence of moderate or strong positive correlations of organic carbon with REEs for the BS samples of Site 1 indicates that organic complexes with these metals are not formed [48]. Moderate positive correlations of REEs were found with manganese and iron. Similar trends were previously found by us for the BSs of other lakes in the study area [4]. Apparently, oxyhydroxide complex compounds with these elements are the main REE phases for this area. It was reported that trivalent light REEs are predominantly absorbed by (oxyhydroxy)oxides of manganese in surface waters [49]. The BS columns of Site 1 were collected from a depth of up to 2 m, which is consistent with the observations of the authors of the aforementioned study.
A strong positive correlation of REEs and iron and manganese, and a moderate correlation of REEs and organic carbon were found for the samples of Site 2. Evidently, it can be concluded that some of the main phases of REEs are complex compounds with iron and manganese oxyhydroxides and possible organic complexes with these metals [47,50].
4. Conclusions
In the course of this study, samples of BS from the northern part of Lake Umbozero, located in close proximity to a closed rare metal mine in the Murmansk region, were collected and analyzed. Using inductively coupled plasma mass spectrometry, the REE content was determined both in the surface layers of BSs and in the deep layers, characterizing the geochemical background of the studied area.
A level of “moderate enrichment” was found for the BSs of Site 1 with light REEs, with the highest EF values of 4.57 for Ce and 4.27 for La; the remaining samples correspond to the level of “minor enrichment”. For the same Site 1, the level of pollution of BSs with light REEs was determined, varying from unpolluted to moderately polluted.
It should be noted that the calculated values of the potential ecological hazard index of BSs of Site 2 (RI = 103.9) correspond to the low ecological risk category, and for Site 1 (RI = 163.9) moderate ecological risk.
In general, the analysis of the obtained results allows us to reach an unambiguous conclusion that the increased ∑REE in the surface layers of the BSs are a consequence of anthropogenic impact (dusting of the tailing storage facility and the influx of suspended particles with the mine wastewater flows), and despite the fact that the enterprise has been closed for more than ten years, the negative impact on ecosystems continues.
Of particular relevance to this study is the fact that Lake Umbozero belongs to the water bodies of fishery importance of the highest category, and one of the types of economic activity that determines the features of the Lovozero district is fishing. The results obtained during the study can be used in the work of environmental organizations and for the development of a strategy for the environmental policy of mining enterprises developing deposits of rare metal ores.
Author Contributions
Methodology, formal analysis, and investigation: E.K., S.S., I.E., M.M., and N.K.; writing—review and editing: E.K., S.S., and D.M.; funding acquisition: E.K., D.M., and N.K. All authors have read and agreed to the published version of the manuscript.
Funding
The study was carried out with the support of the grant of the Russian Science Foundation No. 25-17-20012 “Development of scientific foundations for the complex processing of tailings from the enrichment of loparite ores with a simultaneous reduction in the technogenic impact on the environment in the Arctic zone of the Russian Federation”, https://rscf.ru/project/25-17-20012/ (accessed on 11 September 2025).
Institutional Review Board Statement
Not applicable.
Informed Consent Statement
Not applicable.
Data Availability Statement
All data are available within the article.
Acknowledgments
The authors are grateful to A.A. Cherepanov for his assistance in the collection of BSs samples and to N.L. Alfertyev for compiling the map.
Conflicts of Interest
The authors declare no conflicts of interest. The founding sponsors had no role in the design of the study; in the collection, analyses, or interpretation of data; in the writing of the manuscript or in the decision to publish the results.
Abbreviations
The following abbreviations are used in this manuscript:
| BS | Bottom sediment |
| REE | Rare earth element |
References
- Derome, J.; Lindroos, A.J. Effects of heavy metal contamination on macronutrient availability and acidification parameters in forest soil in the vicinity of the Harjavalta Cu-Ni smelter, SW Finland. Environ. Pollut. 1998, 99, 225–232. [Google Scholar] [CrossRef]
- Zhang, X.; Yang, L.; Li, Y.; Li, H.; Wang, W.; Ye, B. Impacts of lead/zinc mining and smelting on the environment and human health in China. Environ. Monit. Assess. 2011, 184, 2261–2273. [Google Scholar] [CrossRef]
- Liang, J.; Feng, C.; Zeng, G.; Gao, X.; Zhong, M.; Li, X.; Li, X.; He, X.; Fang, Y. Spatial distribution and source identification of heavy metals in surface soils in a typical coal mine city, Lianyuan, China. Environ. Pollut. 2017, 225, 681–690. [Google Scholar] [CrossRef]
- Krasavtseva, E.; Sandimirov, S.; Elizarova, I.; Makarov, D. Assessment of Trace and Rare Earth Elements Pollution in Water Bodies in the Area of Rare Metal Enterprise Influence: A Case Study—Kola Subarctic. Water 2022, 14, 3406. [Google Scholar] [CrossRef]
- Krasavtseva, E.A.; Maksimova, V.V.; Elizarova, I.R.; Malysheva, M.B. Assessment of Soil Pollution by Rare Earth Elements in the Area Affected by the Rare Metal Plant in Russia. Eurasian Soil Sci. 2023, 56 (Suppl. S2), S194–S201. [Google Scholar] [CrossRef]
- Huang, X.; Deng, H.; Zheng, C.; Cao, G. Hydrogeochemical signatures and evolution of groundwater impacted by the Bayan Obo tailing pond in northwest China. Sci. Total Environ. 2016, 543 Pt A, 357–372. [Google Scholar] [CrossRef]
- Schreiber, A.; Marx, J.; Zapp, P.; Hake, J.; Voßenkaul, D.; Friedrich, B. Environmental Impacts of Rare Earth Mining and Separation Based on Eudialyte: A New European Way. Resources 2016, 5, 32. [Google Scholar] [CrossRef]
- Wang, L.; Liang, T.; Zhang, Q.; Li, K. Rare earth element components in atmospheric particulates in the Bayan Obo mine region. Environ. Res. 2014, 131, 64–70. [Google Scholar] [CrossRef] [PubMed]
- Sengupta, M. Environmental Impacts of Mining: Monitoring, Restoration, and Control, 2nd ed.; CRC Press: Boca Raton, FL, USA, 2021; p. 374. [Google Scholar] [CrossRef]
- Ovsyany, E.I.; Kotel’yanets, E.A.; Orekhova, N.A. Arsenic and heavy metals in the bottom sediments of the Balaklava Bay (Black Sea). Phys. Oceanogr. 2009, 19, 254–266. [Google Scholar] [CrossRef]
- Taylor, S.R.; McLennan, S.M. The Continental Crust: Its Composition and Evolution. Phys. Earth Planet. Inter. 1985, 42, 196–197. [Google Scholar] [CrossRef]
- Sousa, T.A.; Venancio, I.M.; Marques, E.D.; Figueiredo, T.S.; Nascimento, R.A.; Smoak, J.M.; Albuquerque, A.L.S.; Valeriano, C.M.; Silva-Filho, E.V. REE Anomalies Changes in Bottom Sediments Applied in the Western Equatorial Atlantic Since the Last Interglacial. Front. Mar. Sci. 2022, 9, 846976. [Google Scholar] [CrossRef]
- Traore, M.; He, Y.; Wang, Y.; Gong, A.; Qiu, L.; Bai, Y.; Liu, Y.; Zhang, M.; Chen, Y.; Huang, X. Research progress on the content and distribution of rare earth elements in rivers and lakes in China. Mar. Pollut. Bull. 2023, 191, 114916. [Google Scholar] [CrossRef] [PubMed]
- Sojka, M.; Choiński, A.; Siepak, M. Spatial distribution of trace and rare earth elements of bottom sediments in Lake Ostrowite, Bory Tucholskie National Park, Poland. Land. Degrad. Dev. 2024, 35, 3407–3421. [Google Scholar] [CrossRef]
- Wang, S.; Wang, Z.; Gao, S.; Zhang, X.; Zeng, J.; Wu, Q. Rare earth elements in lake sediments record historic environmental influences from anthropogenic activities. Ecol. Indic. 2024, 159, 111680. [Google Scholar] [CrossRef]
- Slukovskii, Z.I.; Guzeva, A.V.; Dauvalter, V.A. Rare earth elements in surface lake sediments of Russian arctic: Natural and potential anthropogenic impact to their accumulation. Appl. Geochem. 2022, 142, 105325. [Google Scholar] [CrossRef]
- Slukovskii, Z.I.; Dauvalter, V.A.; Shelekhova, T.S. Anomalies of rare earth elements and heavy metals/metalloids in modern sediments of small lakes in the north of Karelia (Arctic): Geology and technogenesis influence. Env. Environ. Earth Sci. 2025, 84, 68. [Google Scholar] [CrossRef]
- Liang, T.; Li, K.; Wang, L. State of rare earth elements in different environmental components in mining areas of China. Environ. Monit. Assess. 2014, 186, 1499–1513. [Google Scholar] [CrossRef]
- Dauvalter, V.; Moiseenko, T.; Rodyushkin, I. Geochemistry of Rare Earth Elements in Imandra Lake, Murmansk Area. Geochem. Int. 1999, 37, 376–383. [Google Scholar]
- Fang, X.; Peng, B.; Guo, X.; Wu, S.; Xie, S.; Wu, J.; Yang, X.; Chen, H.; Dai, Y. Distribution, source and contamination of rare earth elements in sediments from lower reaches of the Xiangjiang River, China. Environ. Pollut. 2023, 336, 122384. [Google Scholar] [CrossRef]
- Gerasimovsky, V.I.; Volkov, V.P.; Kogarko, L.N.; Polyakov, A.I.; Saprykina, T.V.; Balashov, Y.A. Geochemistry of the Lovozero Alkaline Massif; GEOKHI AN USSR; Nauka: Moscow, Russia, 1996; p. 392. (In Russian) [Google Scholar]
- Lalomov, A.V.; Grigorieva, A.V.; Zaitsev, V.A. Mineral composition of rare metal placers of the Lovozero massif. Geol. Ore Depos. 2022, 64, 485–497. [Google Scholar] [CrossRef]
- Climate Data for the Study Area. Available online: https://goodmeteo.ru/pogoda-revda-lovozerskiy-murmanskaya/god/ (accessed on 22 June 2025).
- Lovchikov, A.V. The Strongest Rock Burst in Underground Mines and Shafts of Russia: Umbozero Mine, August 17, 1999 (Magnitude m = 5, Energy Class k = 11.8); Publishing House of the Kola Science Center: Apatity, Russia, 2022; p. 127. (In Russian) [Google Scholar]
- Dauvalter, V.A.; Yashchishina, S.I. Chalcophile elements in water and bottom sediments of Lake Umbozero. Bull. Mosc. State Tech. Univ. 2008, 11, 415–422. (In Russian) [Google Scholar]
- Atlas of the Murmansk Region; Murmansk Press: Murmansk, Russia; Murmansk Press: Murmansk, Russia, 1971; p. 33. Available online: https://www.kolamap.ru/img/1971/1971.html/ (accessed on 11 September 2025). (In Russian)
- Methodology PND F 16.2.2:2.3.71-2011. Methodology for Measuring Mass Fractions of Metals in Sewage Sludge, Bottom Sediments, Samples of Plant Origin by Spectral Methods. Available online: http://gostrf.com/normadata/1/4293793/4293793107.pdf (accessed on 22 June 2025). (In Russian).
- № R57065-2016; Resources Saving. Waste Treatment. Determination of Loss on Ignition in Waste, Sludge and Sediments. Available online: https://docs.cntd.ru/document/1200139170?marker=7D20K3 (accessed on 11 September 2025). (In Russian)
- Vinogradov, A. Average contents of chemical elements in the main types of igneous rocks of the earth’s crust. Geochem. Int. 1962, 7, 555–571. (In Russian) [Google Scholar]
- Nikanorov, A.M.; Zhulidov, A.V. Biomonitoring of Metals in Freshwater Ecosystems; Gidrometeoizdat: Leningrad, Russia, 1991; p. 312. (In Russian) [Google Scholar]
- Chen, H.; Chen, Z.; Chen, Z.; Ou, X.; Chen, J.J. Calculation of Toxicity Coefficient of Potential Ecological Risk Assessment of Rare Earth Elements. Bull. Environ. Contam. Toxicol. 2020, 104, 582–587. [Google Scholar] [CrossRef] [PubMed]
- Chen, C.-W.; Kao, C.-M.; Chen, C.-F.; Dong, C.-D. Distribution and accumulation of heavy metals in the sediments of Kaohsiung Harbor, Taiwan. Chemosphere 2007, 66, 1431–1440. [Google Scholar] [CrossRef] [PubMed]
- Soliman, N.F.; Nasr, S.M.; Okbah, M.A. Potential ecological risk of heavy metals in sediments from the Mediterranean coast, Egypt. J. Environ. Health Sci. Eng. 2015, 13, 70. [Google Scholar] [CrossRef] [PubMed]
- Muller, G. Index of geoaccumulation in sediments of the Rhine River. Geojournal 1969, 2, 108–118. [Google Scholar]
- Yang, Q.; Li, Z.; Lu, X.; Duan, Q.; Huang, L.; Bi, J. A review of soil heavy metal pollution from industrial and agricultural regions in China: Pollution and risk assessment. Sci. Total. Environ. 2018, 642, 690–700. [Google Scholar] [CrossRef]
- Loska, K.; Wiechuła, D.; Korus, I. Metal contamination of farming soils affected by industry. Environ. Int. 2004, 30, 159–165. [Google Scholar] [CrossRef]
- Zhang, Y.; Li, S.; Chen, Z.; Wang, F.; Chen, J.; Wang, L. A systemic ecological risk assessment based on spatial distribution and source apportionment in the abandoned lead acid battery plant zone, China. J. Hazard. Mater. 2018, 354, 170–179. [Google Scholar] [CrossRef]
- Hakanson, L. An ecological risk index for aquatic pollution control. Sedimentol. Approach Water Res. 1980, 14, 975–1001. [Google Scholar]
- Xu, Z.Q.; Ni, S.J.; Tuo, X.G.; Zhang, C.J. Calculation of Heavy Metals’ Toxicity Coefficient in the Evaluation of Potential Ecological Risk Index. Environ. Sci. Technol. 2008, 31, 112–115. [Google Scholar]
- Hou, D.; He, J.; Lü, C.; Ren, L.; Fan, Q.; Wang, J.; Xie, Z. Distribution characteristics and potential ecological risk assessment of heavy metals (Cu, Pb, Zn, Cd) in water and sediments from Lake Dalinouer, China. Ecotoxicol. Environ. Saf. 2013, 93, 135–144. [Google Scholar] [CrossRef]
- Dauvalter, V.A.; Kashulin, N.A.; Denisov, D.B. Tendencies in the content change of heavy metals in lake sediments in Northern Fennoscandia over the last centuries. Trans. Karelian Res. Cent. Russ. Acad. Sci. 2015, 9, 62–75. (In Russian) [Google Scholar]
- Nikanorov, A.M. Oddo-Harkins rule and the abundance of chemical elements in freshwater ecosystems. Rep. Acad. Sci. 2009, 426, 110–114. (In Russian) [Google Scholar]
- Krasavtseva, E.A.; Maksimova, V.V. Specificity of Composition and Properties of Umbozero Loparite Concentration Tailings. J. Min. Sci. 2024, 60, 639–648. [Google Scholar] [CrossRef]
- Krasavtseva, E.A.; Kaganovich, N.I. Geoecological assessment of fluoride pollution of environmental components in the zone of influence of an abandoned rare metal mine in the Murmansk region. Ecol. Ind. Russ. 2024, 28, 66–71. (In Russian) [Google Scholar] [CrossRef]
- Mikhailova, J.A.; Ivanyuk, G.Y.; Kalashnikov, A.O.; Pakhomovsky, Y.A.; Bazai, A.V.; Yakovenchuk, V.N. Petrogenesis of the Eudialyte Complex of the Lovozero Alkaline Massif (Kola Peninsula, Russia). Minerals 2019, 9, 581. [Google Scholar] [CrossRef]
- Habib, S.B.; Hossain, M.B.; Hossain, M.S.; Jolly, Y.N.; Sarker, S. Ecological risk evaluation in bottom-surface sediments and sub-surface water in the subtropical Meghna estuarine system. Heliyon 2021, 7, e08324. [Google Scholar] [CrossRef] [PubMed]
- Mohamed, I.A.I.; Laila, A.M.; Manal, G.M.; Kholoud, S.S.; Mamdouh, A.F.; Mahmoud, H.E. Potential ecological hazards assessment and prediction of sediment heavy metals pollution along the Gulf of Suez, Egypt. Egypt. J. Aquat. Res. 2019, 45, 329–335. [Google Scholar] [CrossRef]
- Peng, J.F.; Song, Y.H.; Yuan, P.; Cui, X.Y.; Qiu, G.L. The remediation of heavy metals contaminated sediment. J. Hazard. Mater. 2009, 161, 633–640. [Google Scholar] [CrossRef] [PubMed]
- Tachikawa, K.; Handel, C.; Dupré, B. Distribution of rare earth elements and neodymium isotopes in settling particulate material of the tropical Atlantic Ocean (EUMELI site). Deep Sea Res. Part I Oceanogr. Res. Pap. 1997, 44, 1769–1792. [Google Scholar] [CrossRef]
- Rath, P.; Panda, U.C.; Bhatta, D.; Sahu, K.C. Use of sequential leaching, mineralogy, morphology and multivariate statistical technique for quantifying metal pollution in highly polluted aquatic sediments-a case study: Brahamani and Nandirarivers, India. J. Hazard. Mater. 2009, 163, 632–644. [Google Scholar] [CrossRef] [PubMed]
Disclaimer/Publisher’s Note: The statements, opinions and data contained in all publications are solely those of the individual author(s) and contributor(s) and not of MDPI and/or the editor(s). MDPI and/or the editor(s) disclaim responsibility for any injury to people or property resulting from any ideas, methods, instructions or products referred to in the content. |
© 2025 by the authors. Licensee MDPI, Basel, Switzerland. This article is an open access article distributed under the terms and conditions of the Creative Commons Attribution (CC BY) license (https://creativecommons.org/licenses/by/4.0/).