Article

Composition, Properties, and Flotation Reagent Regimes of Carbonaceous Material

1
Centre of Physico-Chemical Methods of Research and Analysis, Al-Farabi Kazakh National University, Almaty 050000, Kazakhstan
2
Department of Mineral Processing and Industrial Wastes Recycling, College of Mining, National University of Science and Technology “MISIS” (NUST MISIS), Moscow 119049, Russia
*
Authors to whom correspondence should be addressed.
Minerals 2025, 15(9), 974; https://doi.org/10.3390/min15090974
Submission received: 18 July 2025 / Revised: 7 September 2025 / Accepted: 9 September 2025 / Published: 14 September 2025
(This article belongs to the Special Issue Mineral Processing and Recycling Technologies for Sustainable Future)

Abstract

The novelty of this study lies in the first comparative characterisation of five carbonaceous materials: three monophase carbons (wood charcoal, carbon, graphite) and two ore-derived CM samples from polymetallic sulphide and oxidised lithium ores. The methodology included IR spectroscopy, XPS, acid–base adsorption centres identified by colour indicators, chemical composition analysis, and kinetic flotation tests. Bulk and surface compositions differed significantly: although the ash content of ore-derived CM reached 84.4%, XPS revealed carbon-enriched surfaces with thin films of about 1–2 nm. IR spectra confirmed multiphase structures with carbonate, silica, and aluminosilicate bands, and showed an identical composition of CM from different industrial ore types. Flotation kinetics confirmed high floatability (recoveries 80%–99%, k up to 1.95 min−1). Even with sodium lignosulphonate at 500 mg/L, recovery only decreased from 83.02% to 52.54%, showing the limited efficiency of depressants. These results provide a basis for the preliminary removal of CM prior to rough (bulk) flotation in the processing of different ore types, improving concentrate quality, reducing reagent consumption, and lowering metallurgical losses.

Graphical Abstract

1. Introduction

CM is commonly found in various types of ores, and its presence negatively impacts the technological performance of flotation and cyanidation processes [1,2,3]. Processing CM is a critical challenge in mineral processing, as it can be either recovered by flotation into a froth concentrate (similar to apolar substances and minerals), depressed during flotation, or subjected to decomposition by microorganisms [4,5,6,7,8].
Previously, it was established [3] that CM is multicomponent in nature, consisting of charcoal and graphite remains, along with quartz and dolomite inclusions. Microscopic studies have revealed that CM has a multiphase composition, including graphite, amorphous carbon (such as kerogen), and other mineral inclusions [2,8,9,10].
In sulphide ores, natural CM often contains significant graphite structures with varying crystalline grain sizes, orientations, levels of disorder, and surface functional groups [11,12,13]. Surface studies using modelling and instrumental techniques have shown that the face surface of graphite exhibits natural hydrophobicity, while the edge surface contains oxidised functional groups such as C-O-C and C=O [14,15,16].
In the flotation of sulphide ores, butyl or amyl xanthates are commonly used as collectors. These compounds oxidise to form dixanthogenide molecules, which enhance CM floatability [1,17,18,19,20,21,22]. Furthermore, CM, due to its high floatability, can be floated using a frother alone [23,24,25]. Despite this activity, efforts to depress CM using polymolecular compounds of either natural (carbohydrate derivatives) or synthetic origin (polyethyleneoxides and polyacrylamides) have not yielded sustainable depressant effects [26,27,28].
Lee S. et al. [3] highlighted the controversy between the amount of fixed apolar collectors and the flotation rate. For simpler ores containing CM, kerosene has been shown to achieve higher recovery rates and faster flotation as compared to transformer oil. IR-Fourier spectroscopy analysis revealed stronger interactions between transformer oil and coal surfaces compared to kerosene.
The relationship between apolar reagent viscosity and flotation performance was addressed in the monograph [29], stating that the higher-viscosity apolar collectors require lower reagent consumption but longer mixing times before flotation.
Despite extensive research efforts, approaches to CM processing via flotation, whether by recovery into concentrate or tailings, remain inconsistent. However, the negative impact of CM on metallurgical balance during flotation or cyanidation processes has been unequivocally recognised. The present work has identified causal relationships between the composition of carbon-containing samples, their surface properties, and their flotation behaviour.

2. Materials and Methods

2.1. Samples

Five carbon-bearing samples were studied, including three monophase substances: wooden charcoal (sample 1W_C), obtained by pyrolysis for household use; carbon (sample 2A_C), used as an adsorbent for organic floating reagents during desorption operations prior to bulk flotation concentrate selection; and graphite (sample 3G_C), a monophasic mineral that forms the base of CM and determines CM floatability [16]. Two additional samples were derived from non-sulphide lithium micaceous ore (sample 4Li_C) from the Shavazsay deposit in Uzbekistan and polymetallic sulphide ore (sample 5S_C) from the Shalkiya deposit in Kazakhstan.
The three monophase carbon-bearing materials were manually crushed using an agate mortar, and the narrow particle-size fraction (41–71 µm) was separated using a mechanical sieve set for subsequent analyses of elemental composition, specific surface area, and adsorption properties. In contrast, the two carbonaceous samples derived from ore deposits (sample 4Li_C from the Shavazsay deposit in Uzbekistan and sample 5S_C from the Shalkiya deposit in Kazakhstan) were prepared by grinding averaged ore batches (10 kg each) in a Knelson Gravity Solutions rod mill at a ratio of S:R:W = 1:6:0.7, until 35%–40% of the material passed 71 µm. The entire ground product was then air-dried at room temperature, disaggregated in a mortar, and subjected to gravitational separation in a spiral separator SL-500 with a water flow rate of 3 L/min. The light fraction was floated at natural alkalinity without flotation reagents, and the froth product was again air-dried. After homogenisation in an agate mortar, the narrow size fraction (41–71 µm) was separated by mechanical sieving for further investigation.
The elemental composition of the carbonaceous samples was determined using a combination of instrumental methods. C, H, N, and S elements were analysed with a Leco CHN-628 analyser (LECO Corporation, St. Joseph, MI, USA, while oxygen content was measured using the GOST2408.3-90 method [30]. Non-organic ash elements in Li_C and S_C samples were analysed using the MLA Quanta650 system (FEI Company, Hillsboro, OR, USA), which includes a scanning electron microscope (SEM Quanta650) equipped with an energy-dispersive detector EDAX Silicon Drift controlled by Genesis software integrated into MLA Suite. Specific surface area measurements were performed using the BET method on a SORBTOMETR analyser by ZAO Katakon, Novosibirsk, Russia. Ash content was determined according to the GOST11022-95 method, with samples burned in a muffle furnace at 840 °C [31].
The chemical composition and specific surface area of the studied sample fractions are presented in Table 1:
The highest carbon content was observed in graphite (G_C), which contained 98% of carbon. Carbon (A_C) exhibited the largest specific surface area, measured at 318.1 m2/g. The specific surface area values for carbonaceous samples separated from ores (S_C and Li_C) were significantly higher than those typically found in similar narrow fractions of sulphides, which are generally much less than 1 m2/g, and rock minerals, which tend to be slightly more than 1 m2/g.
CM samples separated from ores (Li_C and S_C) showed notably high ash contents, with values of 90.5% for Li_C and 84.4% for S_C. Table 2 presents the elemental composition of ash obtained after burning these CM samples using the EDAX Silicon DriftSEM Quanta 650 system.
Lead (Pb) was not detected in the ash composition of the S_C CM (Table 2), consistent with the analytical methodology outlined in the reference. Electron microscopy confirmed the multiphase nature of the CM and its heterogeneous mineral composition, with ash components consisting of oxide, silicate, and sulphate mineral forms.

2.2. Reagents of Flotation

The study employed diesel oil (apolar collector) and butyl xanthate (ionogenic sulphhydryl collector), with pine oil as the frother. Ligninosulphonate (Polyplast Ligno) was used as a depressant.
Butyl xanthate was selected for the tests as it is a typical sulphhydryl collecting agent commonly used in the reagent regimes of sulphide and complex ores. A thiol collector (potassium butyl xanthate) served as the conventional sulphide collector and benchmark [32].
An apolar collector (diesel oil) was included to represent the hydrophobisation of graphitic CM [33].
Polyplast Ligno (PL) was used as a depressor to reduce the flotation activity of the carbonaceous samples [34]. This depressor is a modified liquid lignosulphonate product, appearing as a brown liquid with 50% activity. Lignosulphonates are derivatives of lignin and byproducts of wood processing, consisting of high-molecular compounds with molecular masses starting from 200 g/mol. In this experiment, solutions were prepared assuming 100% activity.
In general, sodium lignosulphonate (LS) was tested with each collector as a low-toxicity depressant; prior studies document LS adsorption/depression on MoS2 and on xanthate-treated chalcopyrite with pronounced pH/lime dependence [35,36], and its greener use in Cu–Mo separation with collector-dependent effects on chalcopyrite [37]; and selective wettability effects in LS/frother media further support LS applicability [38].

2.3. Research Methods

2.3.1. IR Spectroscopy

The molecular composition of carbonaceous samples was analysed using a two-ray spectrophotometer (Specord M-80, Carl Zeiss, Jena, Germany) equipped with an Eberth monochromator and diffraction grating for spectral decomposition. IR spectra were processed using Soft Spectra software. Samples were ground in an agate mortar, mixed with two drops of butanol, and applied onto KBr glass. Measurements were conducted in the 4000–400 cm−1 range with three integrations (IT = 3) in transmission mode (T, %).

2.3.2. X-Ray Photoelectron Spectroscopy Analysis

X-ray photoelectron spectroscopy (XPS) was performed on the 41–71 µm fraction of samples to determine the elemental composition of the surface layer (2 nm depth) and assess oxygen/carbon states in coal and graphite. Analyses were conducted using a PHI5000 VersaProbeII spectrometer (ULVAC-PHI, ULVAC-PHI Inc., Chigasaki, Japan) with monochromatized Al Kα radiation (hν = 1486.6 eV, 50 W power, 200 µm beam diameter). Integral intensities were measured for core-level lines: C 1s, O 1s, Si 2s, Mg 1s, Al 2p, Ca 2p, Zn 2p, F 1s, Pb 4d5, Fe 2p, K 2p, Na 1s, S 2s, F 1s, and N 1s. High-resolution spectra for C 1s and O 1s were acquired at 23.5 eV analyser transmission energy with a 0.2 eV step. Peak fitting used a nonlinear least-squares method with Gaussian–Lorentzian functions, including asymmetry correction for sp2 carbon in C 1s peaks. The binding energy (Eb) scale was calibrated using Au 4f (83.96 eV) and Cu 2p3 (932.62 eV).

2.3.3. Acid–Base Centres

For the direct determination of Lewis–Brønsted active acid–base centres on the surface, colour (Gammet) indicators with different pKa values were employed [39,40,41,42]. According to Tanabe, Lewis base centres (electron donors) contain unshared electron pairs and are capable of capturing protons during the hydrolytic dissociation of water molecules. This is demonstrated by the selective adsorption of Gammet indicators with negative pKa values. Brønsted acid centres are characterised by the selective adsorption of indicators with pKa values between 1 and 7, which is attributed to surface OH-groups. The presence of Brønsted base centres is indicated by the adsorption of indicators with pKa values between 7 and 14. Lewis acid centres correspond to the selective adsorption of indicators with pKa values ≥ 14.
Table 3 provides the characteristics of the Gammet indicators used to identify the types of acid–base centres on the surface of the studied carbonaceous samples based on their adsorption behaviour.
Indicator solutions were prepared at a concentration of 10−4 mol/L in a water–ethanol solution (60:40). Adsorption studies were conducted using carbonaceous samples from the −71 + 41 μm fraction.
The quantitative test for determining the dominant type of acid–base centre was based on changes in the absorption intensity of characteristic indicator bands, corresponding to specific pKa values, after mixing with carbonaceous samples for two hours. A blank sample was prepared by conditioning the carbonaceous sample with distilled water for two hours, followed by careful decantation of water and subsequent addition of an indicator solution with the same pKa value to create an equivalent indicator concentration. The absorption intensity of characteristic bands was then measured for comparison. The concentration of specific surface-active centres, equivalent to the amount of adsorbed colour indicator (gpKa), was calculated as follows:
g pK a = C V I 0 / I 0 I / m s ± / I 0 I bl . s / m bl . s s
g pK a —amount of indicator adsorbed on sample surface, mol/m2;
C—indicator solution concentration, mol/mL;
V—indicator solution volume, ml;
s—carbonaceous sample specific surface area, m2/g;
m, mbl.s—mass of sample weight in main and blank parts, g;
I0, I, Ibl.s—intensity of initial indicator solution adsorption after interaction with carbonaceous sample in blank experiment, respectively, Abs.
A UV-VIS-NIR Cary 6000i spectrophotometer (Agilent Technologies, Santa Clara, CA, USA) with a wavelength range of 175–1800 nm was used to monitor changes in absorption intensity before and after interaction with carbonaceous samples.
Figure 1 illustrates an example of determining the adsorption intensity for CM from lead–zinc ore. As shown in Figure 1, the adsorption intensity of the indigo carmine indicator increased after contact with CM from ore, indicating electronic transition activation during interaction between the indicator and acid–base centres on the S_C surface.

2.3.4. Froth Flotation

The flotation kinetics of the samples were studied using a specific fraction of 41–71 µm and a sample weight of 5 g in a laboratory mechanical flotation machine, FML-0.3 (Mekhanobr, St. Petersburg, Russia), equipped with a 50 mL chamber. In the mechanical cell, suspension mixing and air dispersion were generated by an impeller, and a foam removal device was used to collect the froth. The flotation reagent regime (Table 4) was conducted under natural environmental conditions created by distilled water. The flotation reagents included diesel oil, butyl xanthate, and pine oil as the frother.
Table 4 presents the details of the reagent flotation regime.
In the flotation cell, the carbonaceous sample was mixed with distilled water for 2 min, followed by sequential mixing with the collecting agent for 1 min and the frother for another minute. When lignosulphonate was used as a depressor for carbonaceous samples, an additional 2 min of mixing was performed before adding the collecting agent.
After specific time intervals, froth fractions were skimmed into separate cups at 0.1 min (1 stroke of froth scraper), 0.5, 1, 2, 3, and 5 min. The concentrate fractions and tails were dried and weighed, and the material balance of the experiment was calculated. The concentrate yield in each fraction corresponded to recovery (ε), assuming α = β = 100%. The flotation rate constant (k) was calculated similarly to the rate constant of a first-order chemical reaction, where the reaction product is represented by a “particle-air bubble” flotation complex:
ε = εmax(1 − e−kt)
k is the rate constant (min−1), εmax is the maximum recovery, and t is the flotation time (min).
Figure 2 illustrates an example of graphite (G_C) flotation kinetics using only a frother (left) and its transformed dependence in semilogarithmic coordinates ln 100 100 ε = f ( t ) (right).
The flotation rate constant (k) was determined from the linear equation y = ax, where ln(ε) = kt (Figure 2, right). In this example of graphite flotation with only a frother, the calculated rate constant was k = 1.17 min−1. To ensure the reliability and reproducibility of the results, each flotation kinetics experiment was repeated three times. The average values of these experimental results were used for data analysis.

3. Results and Discussion

3.1. IR Spectroscopy

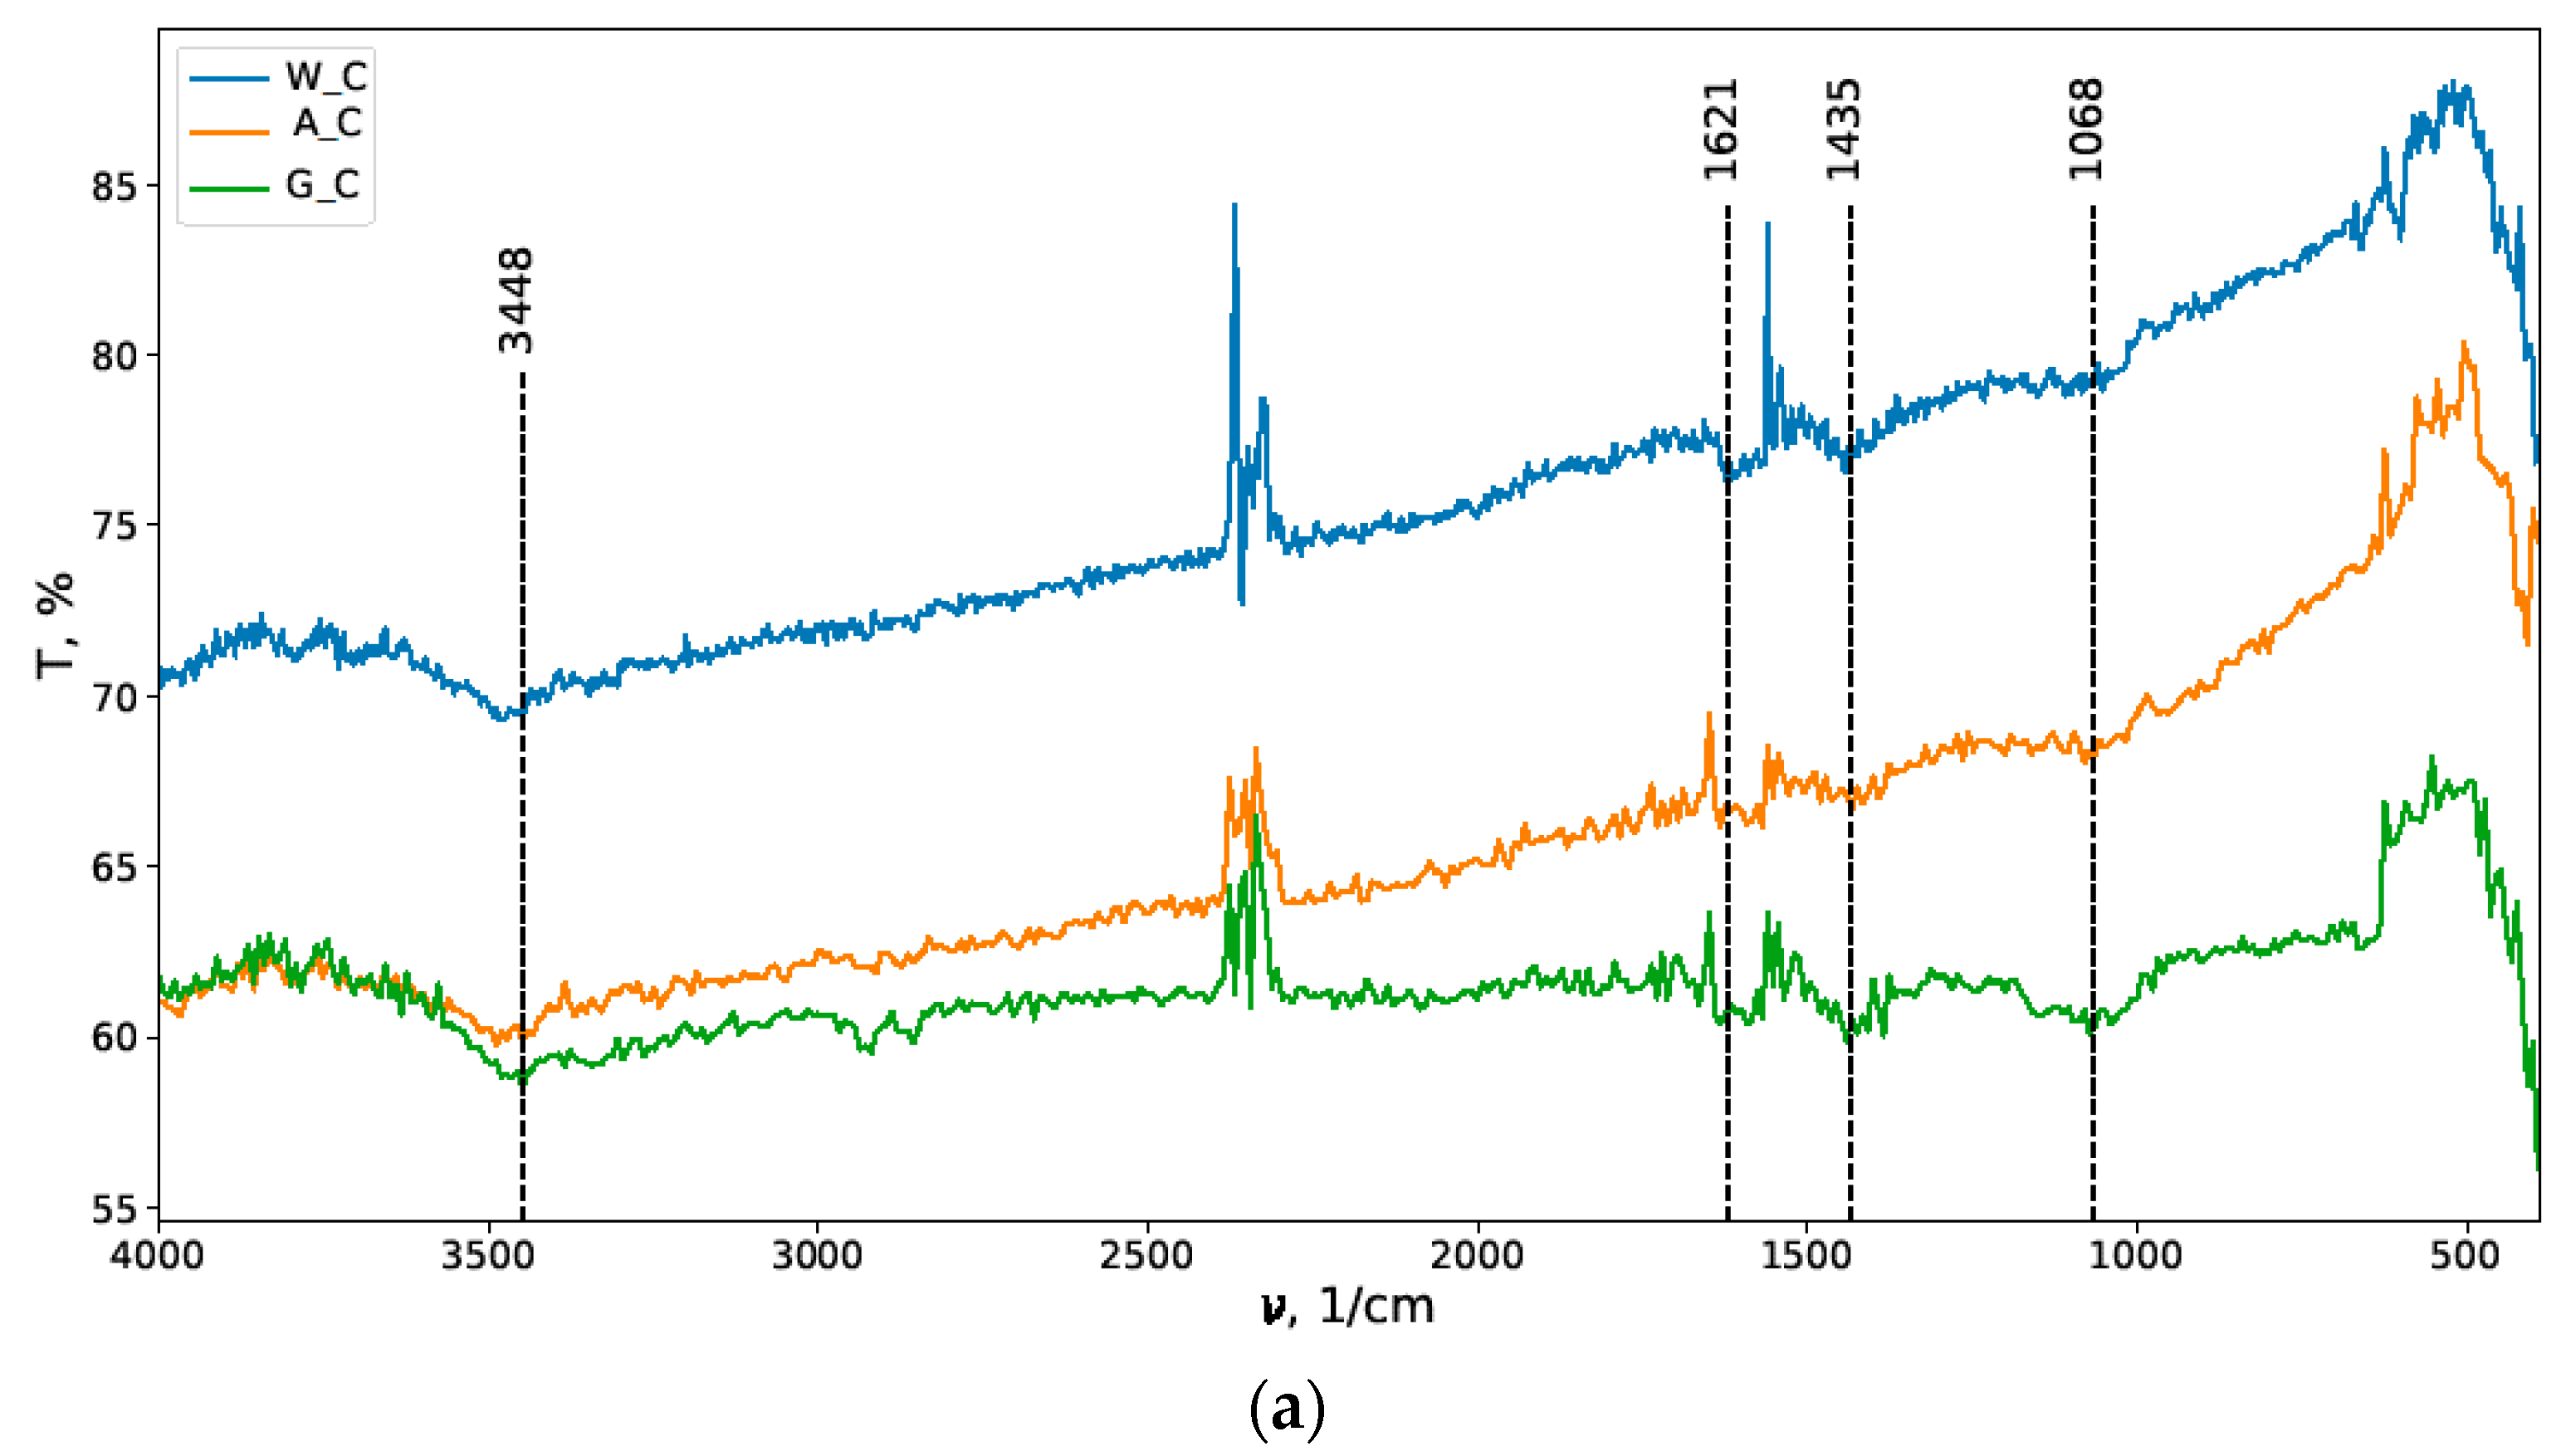
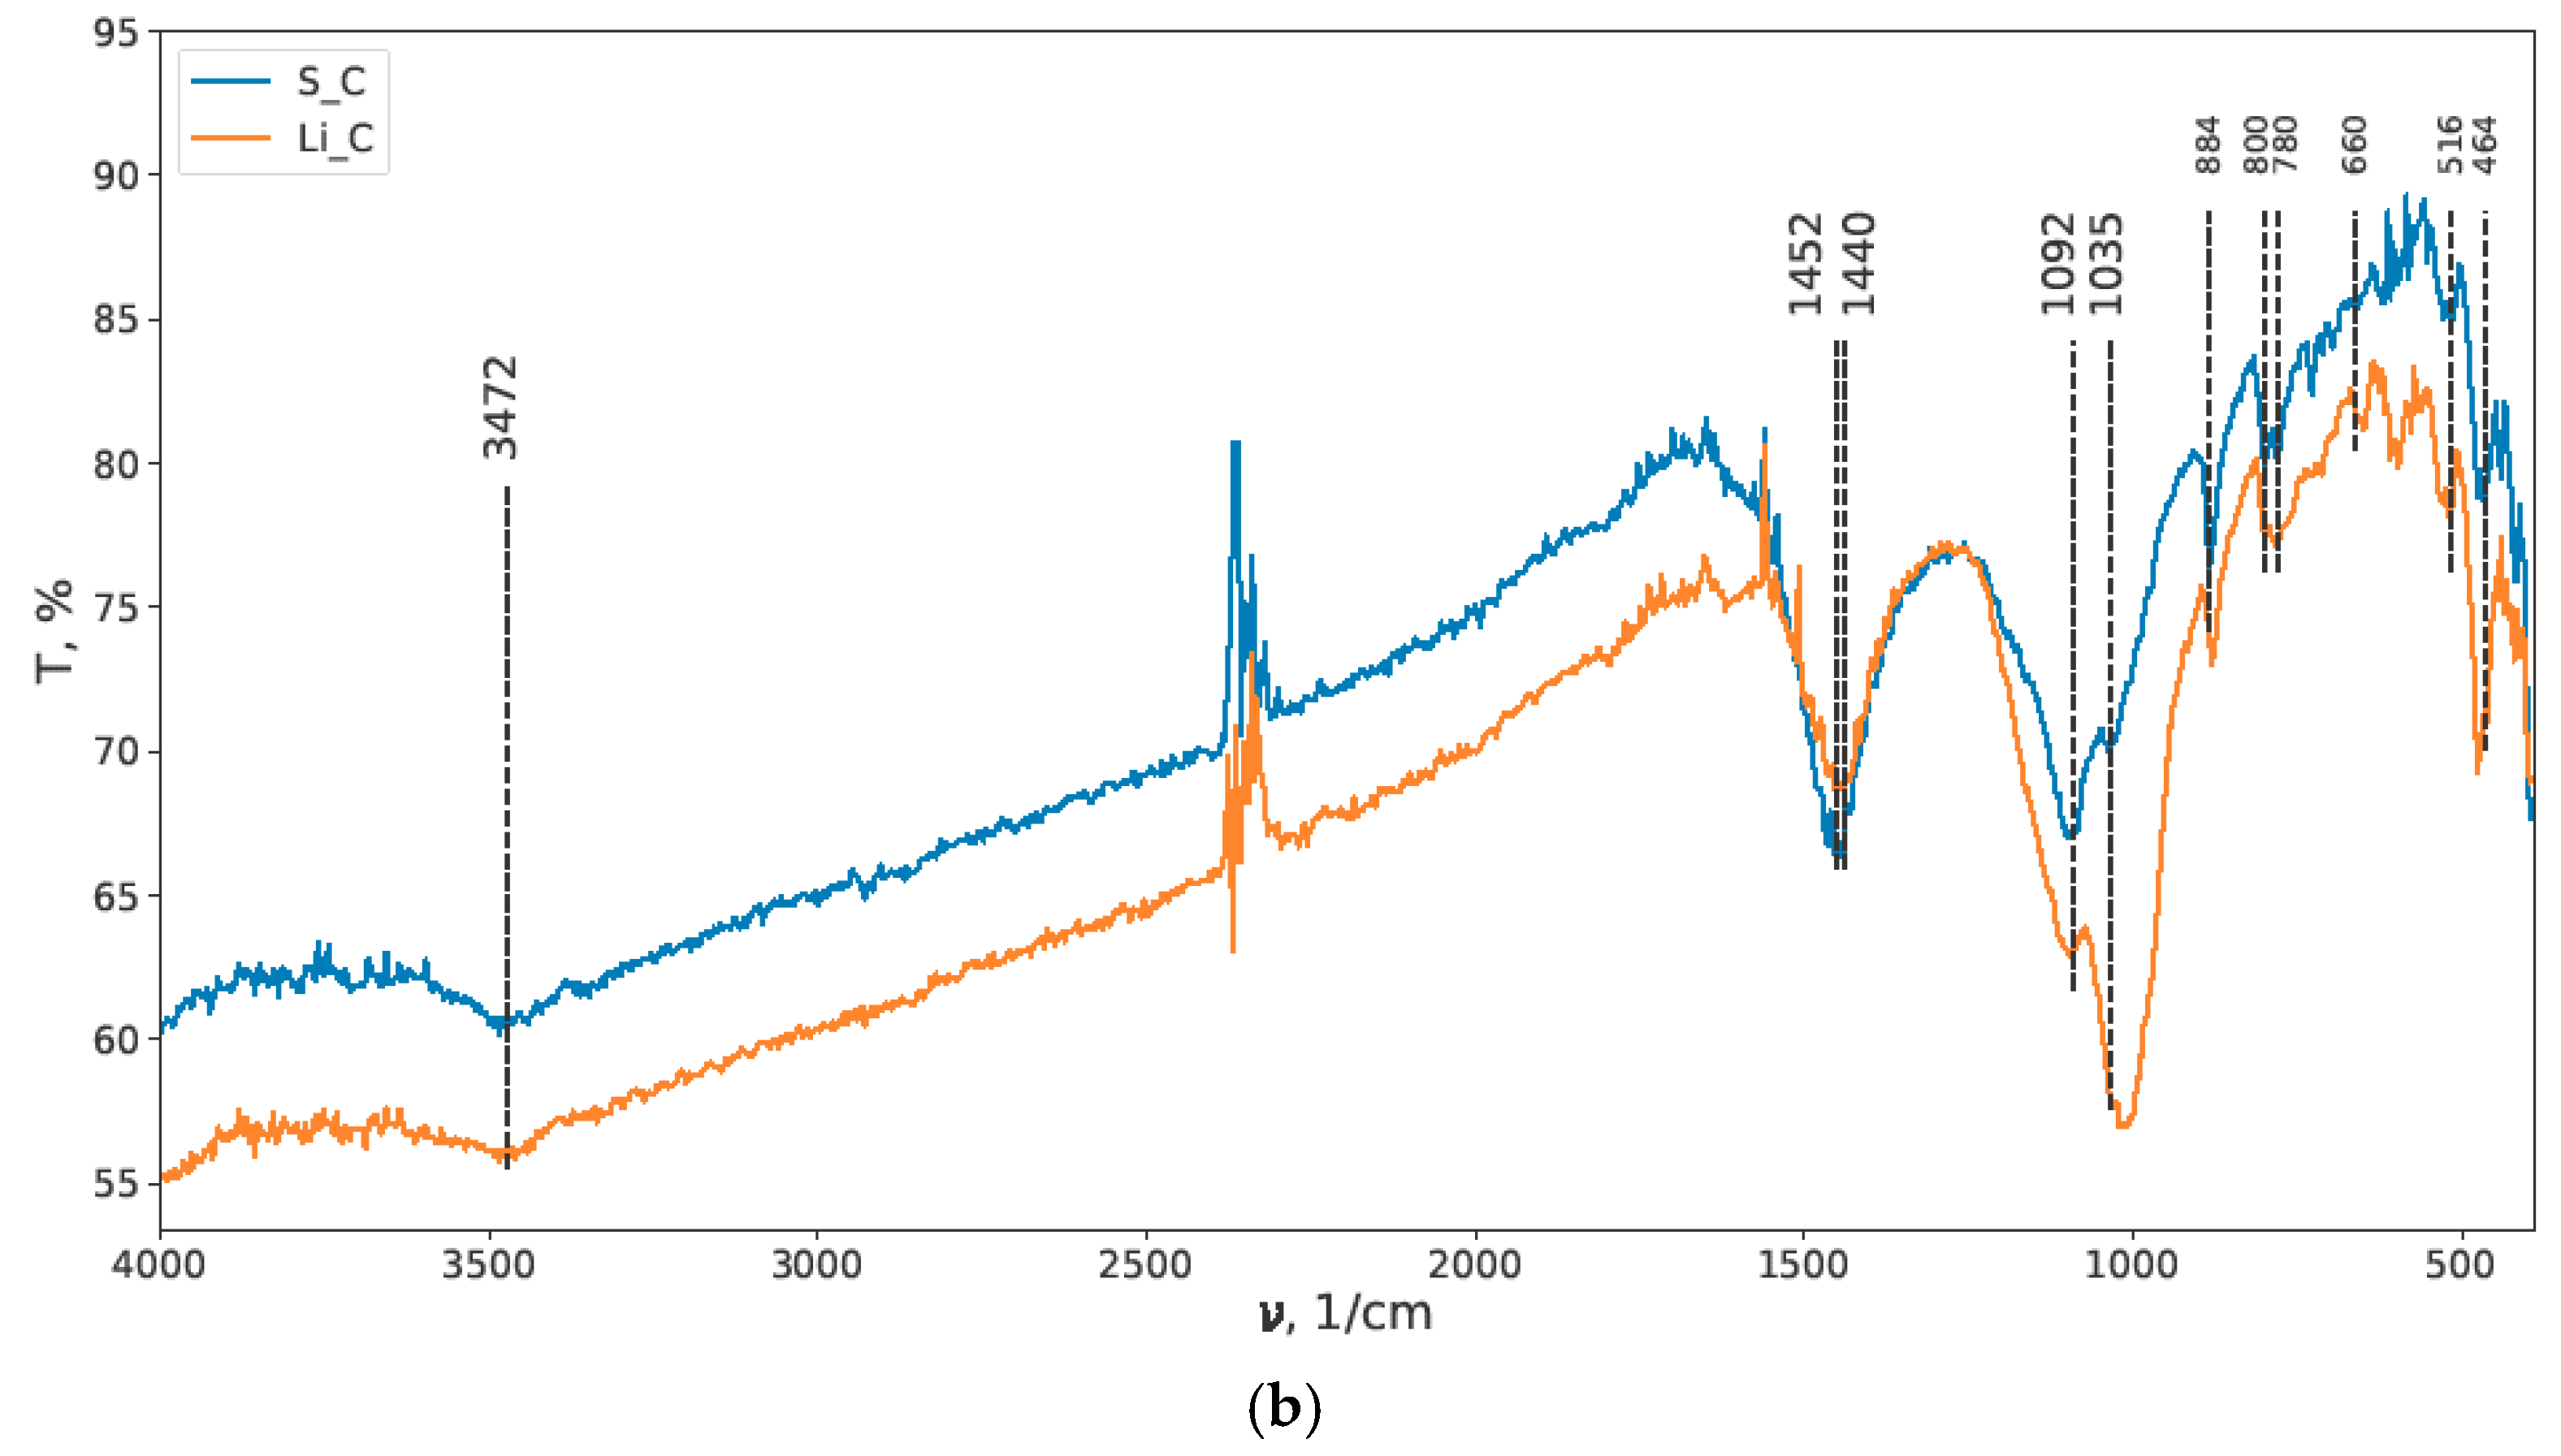
Figure 3 presents the overall IR spectra of wooden charcoal, carbon (W_C, A_C), graphite (G_C) (Figure 3a), and carbonaceous samples from Pb-Zn sulphide ore (S_C) and Li micaceous ore (Li_C) (Figure 3b).
The IR spectra of the monophase samples (Figure 3a), including wooden charcoal (W_C), carbon (A_C), and graphite (G_C), exhibit stretching vibrations of bound water (νOH) at 3448 cm−1 and deformation vibrations (δOH) at 1621 cm−1. Additionally, stretching vibrations of the C-O bond (νCO) are observed at 1435 cm−1, along with νCO at 1068 cm−1, indicating the presence of oxidised centres within the structure of coal and graphite.
Of particular interest is the similarity in the characteristic bands of the CMs S_C and Li_C (Figure 3b), which were recovered from sulphide and non-sulphide ores, respectively. IR spectroscopy reveals that multiphase CM from various types of ores can be identified within the wave number range of 1600–400 cm−1. This includes carbonate (C-O stretching vibrations at νCO = 1452 cm−1 and deformation vibrations at 884 cm−1), silica (Si-O bond vibrations at 1008 cm−1 and out-of-plane vibrations at 464 cm−1), and aluminosilicates (Si-O bond vibrations at 1092 and 1035 cm−1, deformation vibrations at 880 and 780 cm−1, and out-of-plane vibrations at 516 cm−1). These bands correspond to X-O bonds, where X can be Si, C, or other elements present in the carbonaceous sample.
The presence of multiple bands within the range of 1570–700 cm−1 suggests a distorted tetrahedral structure. A broader characteristic band with maximum transmission at 3472 cm−1 corresponds to O-H bond stretching vibrations (νOH), while deformation vibration bands δOH within the range of 1620–1600 cm−1 indicate the presence of bound water.
Despite the presence of bound water and hydrophilic components, such as silica, in carbonaceous samples S_C and Li_C, these materials are naturally hydrophobic and exhibit high flotation activity. This behaviour highlights their unique structural properties, which contribute to their flotation performance.

3.2. XPS

The elemental composition of the surface of the studied samples was analysed using XPS (Table 5).
Comparing the elemental composition of the samples (Table 5), it is evident that the carbon concentration on the surface of CMs from Li_C (18.9%) and S_C (49.2%) is significantly lower than that of other carbonaceous samples (85.1%–98.5%). In contrast, the oxygen concentration is higher for Li_C (49.3%) and S_C (34%) compared to other samples, which range from 1.5% to 12.0%. Additionally, noticeable concentrations of elements such as Si, Mg, Al, Ca, and Zn are observed in these samples.
Graphite (G_C) is identified as the purest sample among those studied. The C 1s spectrum of graphite consists of an asymmetrical narrow peak (Eb = 284.4 eV, FWHM = 0.69 eV) and a wide π-π* satellite shifted by 6.2 eV, which is characteristic of sp2 hybridisation in graphite atoms. In contrast, the A_C sample contains carbon associated with sp3 hybridised atoms (non-crystalline carbon) and functional groups bonded with oxygen.
The C 1s spectrum of W_C differs significantly from that of graphite. Its approximation reveals two main peaks: an asymmetrical peak at 284.9 eV and a symmetrical peak at 287.2 eV, along with a third peak at 289.9 eV. The location of Peak 1 differs from similar peaks in G_C and A_C, and asymmetry is observed in this peak as well. The distance between Peaks 1 and 2 is 2.3 eV, suggesting that Peak 2 may correspond to epoxy groups. Peak 3 is attributed to carbon atoms in specific functional groups:
Minerals 15 00974 i001
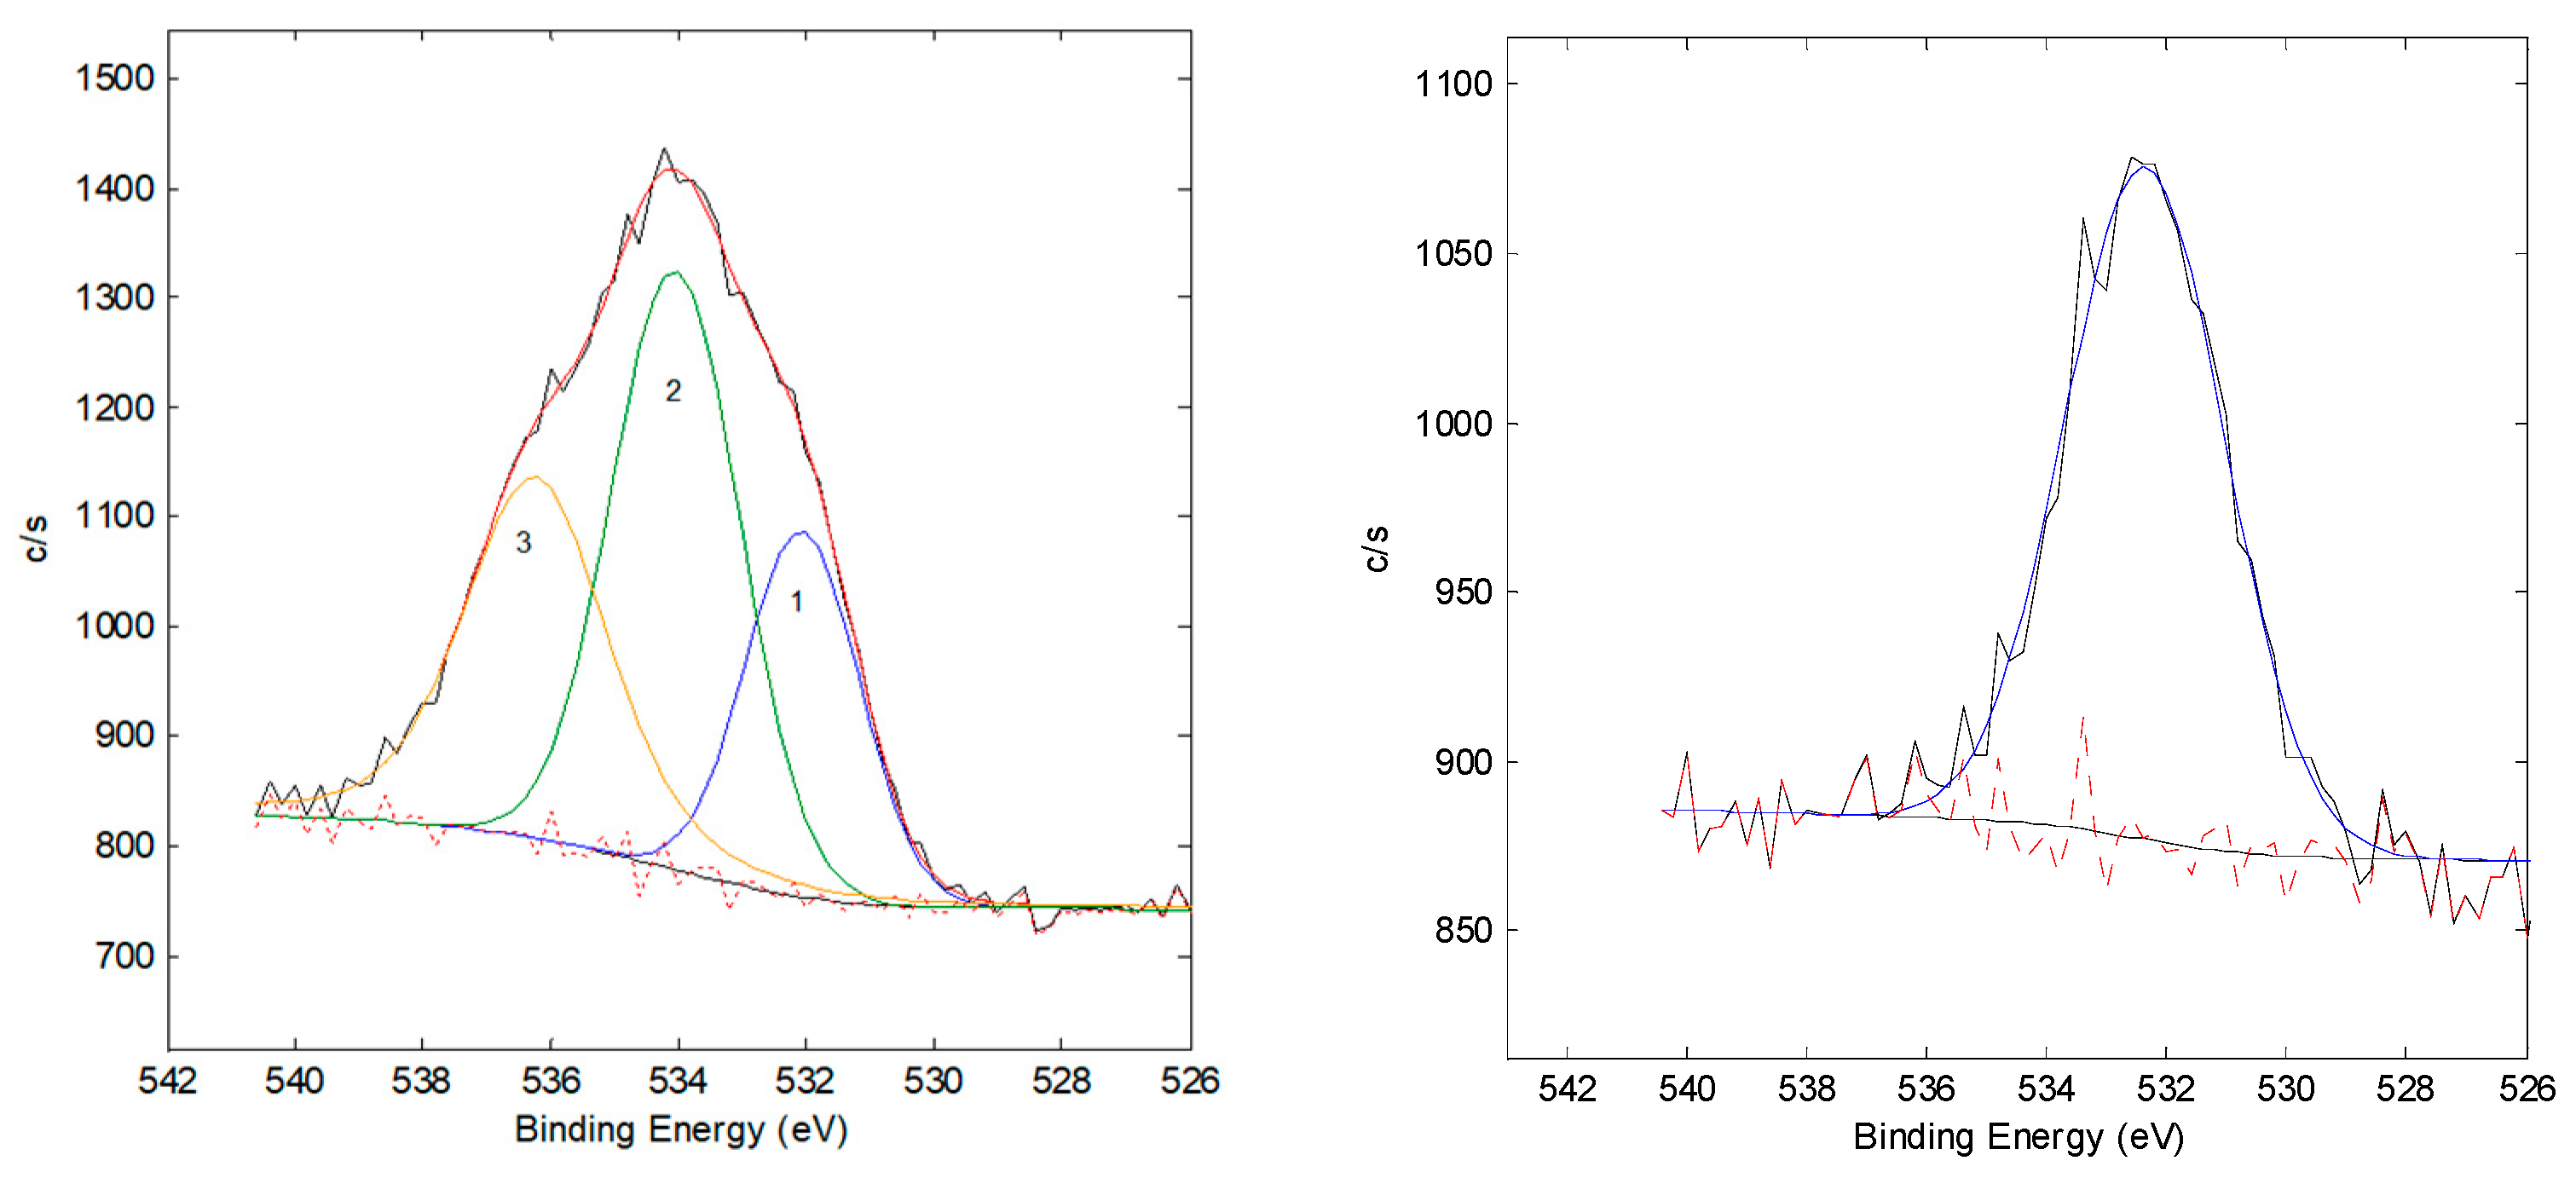
Figure 4 presents the O 1s spectra for activated carbon W_C (left) and graphite G_C (right), highlighting their differences.
The analysis of the O 1s spectrum for W_C shows a complex form with three distinct peaks at 532.0 eV, 534.0 eV, and 536.0 eV. The binding energy (Eb) of the first peak corresponds to adsorbed oxygen, while the second peak can be associated with adsorbed water molecules. The binding energy of Peak 3 exceeds the typical upper limit for O 1s spectrum values, which may be explained by differential charge effects or molecular oxygen trapped between carbon layers.
The composition of CM from ores (Li_C and S_C) is notably more complex than that from coal (W_C), carbon (A_C), or graphite (G_C). Ash content determination results (Table 1) indicate predominantly non-organic content in Li_C (A = 90.5%) and S_C (A = 84.4%). The discrepancy between chemical analysis results and XPS surface data (Table 5) suggests that carbon adheres to the surfaces of silicates and other rock minerals.
The IR spectra of Li_C and S_C samples (Figure 3b) exhibit common features such as Si-O bond vibration bands within the range of 1100–800 cm−1, indicative of silicates, and C-O vibration bands within the ranges of 1500–1350 cm−1 and 800–780 cm−1, characteristic of carbonate minerals.
These findings suggest the formation of tight associations between silicate rock mineral surfaces and monophase carbon, which possesses naturally hydrophobic properties. This association contributes to the flotation activity observed in multiphase mineral assemblages (CM) during flotation and explains the challenges in depressing CM effectively.
It can be hypothesised that reducing ore grinding fineness prior to flotation would lead to homogenisation of CM within the pulp, making selective froth recovery or selective depression of carbonaceous substances impractical.

3.3. Acid–Base Centres

XPS data confirm the presence of O, C, and additional elements such as N (in W_C and Li_C), F (in Li_C), and S (in S_C) on the surface of all studied samples. These elements can act as active donor–acceptor centres, facilitating the fixation of flotation agents on the surface. IR spectra further reveal the presence of chemical and hydrogen bonds involving carbon, silicon, and hydrogen with oxygen (C-O, Si-O, and O-H) in the samples. Table 6 presents the results of experimental determination of active acid–base centres at respective acidity constants (pKa).
The highest concentration of active centres on the surface of carbonaceous samples was observed for material from sulphide ore (S_C). This sample exhibited Brønsted-type base centres at pKa = 12.8 and pKa = 7.3, with concentrations of gpKa = 31.34 μmol/m2 and gpKa = 4.40 μmol/m2, respectively. Additionally, S_C showed active Lewis base centres at pKa = −4.4 with a concentration of gpKa = 3.84 μmol/m2, as well as Lewis acid centres at pKa = 16.8 in the amount of gpKa = 4.27 μmol/m2.
For CM extracted from non-sulphide ore (Li_C), the highest concentration of active centres (gpKa = 3.86 μmol/m2) corresponded to Lewis-type acid centres at pKa = 12.8. In wooden charcoal (W_C), Lewis base centres at pKa = −4.4 were found in a concentration of gpKa = 2.45 μmol/m2, while Brønsted base centres at pKa = 12.8 were present in a concentration of gpKa = 1.95 μmol/m2.
Activated carbon (A_C) exhibited Brønsted-type acid active centres at pKa = 6.4 with a concentration of gpKa = 3.87 μmol/m2, while graphite (G_C) showed a lower concentration of similar centres at gpKa = 0.70 μmol/m2. Among all samples, graphite demonstrated the lowest adsorption of indicators with different pKa values, aligning with its low impurity content as determined by XPS (Table 5). However, the presence of O-H hydrogen bonds was confirmed for graphite through IR spectroscopy (Figure 2, left).
Quantitative adsorption of Gammet indicators across different pKa values highlights the diversity of acid–base centres on the surface of carbonaceous samples. The predominant centres are Brønsted and Lewis bases, which act as potential electron donors in donor-acceptor interactions, including those involving water dipoles. These findings are consistent with IR spectroscopy results indicating bound water presence and XPS data identifying water within the layers.
Thus, the surface of CM samples contains active centres capable of fixing flotation agents through various donor–acceptor mechanisms via intermolecular interactions or complex formation. CM sourced from ores can interact with different types of surface-active compounds (collectors and frothers), reducing the contrast in surface technological properties during flotation processes.

3.4. Flotation Kinetics

Mao, L., and Yoon, R.-H [43] detailed that the flotation rate constant reflects the combined response of all subprocesses in the elementary flotation act—collision, fixation, and conservation.
In the flotation kinetics tests conducted on narrow fractions of carbonaceous samples using the studied reagent schemes, a linear relationship was observed in semilogarithmic coordinates. Table 7 summarises the flotation parameters, including the flotation rate constant k (min−1), R-squared value (R2), and overall carbonaceous samples recovery εmax.
As shown in Table 7, graphite (G_C) and wooden charcoal (W_C) exhibit the highest flotation activity based on their flotation rate constants and maximum recovery within 5 min of the process. The presence of the sulphhydryl collector ButX in the reagent scheme enhances flotation parameters for all samples except graphite (G_C), where it decreases from 1.95 min−1 (diesel oil collector) to 1.21 min−1 (ButX collector). However, graphite maintains high froth product recovery (εmax) at 99%–100%. Preliminary mixing of graphite with PL depressor at two concentrations reduces the flotation rate constant to 0.94 min−1 (50 mg/L) and 0.84 min−1 (500 mg/L), while maximum extraction into froth concentrate remains at 99%.
Table 8 provides data on pH measurements in the final tailings under different reagent schemes.
For most samples (Li_C, A_C, and W_C), there is a typical shift toward alkaline pH due to hydrolysis of base centres. However, for polymetallic sulphide ore-derived CM (S_C), a shift toward acidic pH is observed, likely due to the presence of sulphide sulphur on the surface, which lowers pulp pH through hydrolysis. Graphite (G_C) exhibits minimal pH change during flotation, consistent with its purity and low concentration of acid–base centres on the surface (Table 5).
Figure 5 illustrates two diagrams: one showing the flotation rate constants for carbonaceous samples under different reagent schemes (Figure 5a) and another depicting the impact of PL concentration on k (min−1) (Figure 5b) and εmax using diesel oil as a collector (Figure 5c).
The obtained flotation rate constants indicate that graphite has the highest k, consistent with its low impurity content and minimal indicator adsorption (gpKa = 0.70 μmol/m2) at pKa = 6.4 in comparison with other CMs (Table 5). The high flotation rate constant for graphite when using apolar collectors is attributed to its perfect edge cleavage and strong adhesion to apolar collectors. When butyl xanthate is used as a collector (k = 1.21 min−1), its flotation performance is comparable to that achieved with only a frother (k = 1.17 min−1). For other samples, k min−1 values are significantly lower, ranging from 0.15 to 0.46 min−1, with maximum recovery during 5 min varying between 61.10% and 93.51%. CMs derived from ores contain hydrophilic silicates but exhibit maximum recovery levels around 80% due to carbon adhesion on their surfaces. Higher surface carbon concentrations—49.2% for S_C compared to 18.9% for Li_C—correlate with higher froth product recovery (εmax = 81%–84%) for S_C versus (εmax = 61%–80%) for Li_C.
The use of butyl xanthate in reagent schemes increases εmax for carbonaceous samples of various origins due to multiple active centres on their surfaces interacting with collectors and molecular dixanthogenide adhesion. However, a decrease in k is noted for graphite under these conditions.
The application of PL as depressors before adding collectors reduces graphite’s flotation rate constant by approximately half (Figure 5b), while maintaining high maximum extraction at 99% (Figure 5c). Conversely, depressor use increases both k and maximum extraction for wooden charcoal.
In current flotation practice, diverse industrial ore types—including sulphide (including precious-metal-bearing), oxidised, and complex polymetallic ores—commonly contain CM. The combined evidence from IR spectroscopy, XPS, the acid–base indicator method for surface centres, and froth-flotation tests in this study shows that selective depression of CM is not a reliable primary solution. CM retains high floatability and is only partially depressed; its presence in saleable concentrates complicates downstream metallurgy by lowering the grade of target-metal concentrates, increasing slag burden and reagent consumption, and, in hydrometallurgical routes, enabling preg-robbing of metal complexes [2,19,44,45]. These observations are consistent with our recent findings [46], which further demonstrated that CM remains highly floatable even under depressing conditions.
Based on these findings, it is recommended to prioritise preliminary extraction of CM through coarse grinding from ores using apolar collectors during flotation washing of sulphide and non-sulphide ores rather than relying on depressors for CM depression.

4. Conclusions

Chemical composition analysis, ash content measurements, specific surface area studies, and XPS and IR spectroscopy reveal that CM from two distinct industrial ores is multiphase in nature. These ores predominantly contain silicate and carbonate minerals, which exhibit strong surface coalescence with carbon. This compositional feature influences the natural hydrophobic behaviour and adsorption capacity of the material. IR spectroscopy effectively identifies CM through characteristic bands in the wavenumber range of 1600–400 cm−1.
Brønsted solid acid–base centres are the most prevalent active sites for CM within the pKa range corresponding to flotation pH conditions. The high reactivity of CM is attributed to oxygen centres in silicate and carbonate tetrahedra, which interact via proton transfer, combined with the natural hydrophobicity provided by carbon on the surface.
Flotation kinetics studies demonstrate that graphite exhibits the highest floatability in the presence of an apolar collector (k = 1.97min−1), primarily due to adhesion facilitated by its perfect cleavage edges. Other carbon-containing samples show flotation rate constants ranging from 0.20 to 0.46 min−1 across all reagent regimes studied, including butyl xanthate as a collector, with maximum recovery into froth products reaching 80%–94%. The floatability of CMs is strongly correlated with the carbon concentration in their surface layers.
PL derivatives used as depressors for wood charcoal increased its flotation rate constant from 0.23 min−1 to 0.50–0.69 min−1, depending on depressor concentration in the liquid phase, while maintaining high recovery, approximately 96%–98%. For other carbon-containing samples, PL slightly reduced flotation rate constants but preserved a high maximum recovery to concentrates (over 50%).
The recovery of CM using apolar collectors within flotation reagent regimes for sulphide and non-sulphide ores is demonstrated to be a more rational and effective approach compared to relying on depressors for reducing floatability.

Author Contributions

Conceptualisation, V.I., R.T., and M.N.; methodology, V.I.; validation, M.K., A.Y.; investigation, A.Y., M.K., and T.K.; resources, R.T. and M.N.; data curation, V.I.; writing—original draft preparation, A.Y., V.I., and T.K.; writing—review and editing, A.Y., V.I., T.K., and R.T.; supervision, M.N.; project administration, R.T. and T.K.; funding acquisition, R.T. All authors have read and agreed to the published version of the manuscript.

Funding

This research was funded by the Science Committee of the Ministry of Science and Higher Education of the Republic of Kazakhstan, grant number AP19680419.

Data Availability Statement

Data is contained within the article.

Conflicts of Interest

The authors declare no conflicts of interest.

References

  1. Sousa, R.; Futuro, A.; Pires, C.S.; Leite, M.M. Froth flotation of Aljustrel sulphide complex ore. Physicochem. Probl. Miner. Process. 2017, 53, 758. [Google Scholar] [CrossRef]
  2. Adams, M.D.; Burger, A.M. Characterization and blinding of carbonaceous preg-robbers in gold ores. Miner. Eng. 1998, 11, 919. [Google Scholar] [CrossRef]
  3. Lee, S.; Gibson, C.; Borschneck, A.; Ghahreman, A. Transformer oil vs. kerosene: Selective collectors for C-matter flotation from a double refractory gold ore. Miner. Eng. 2023, 191, 107951. [Google Scholar] [CrossRef]
  4. Tabatabaei, R.H.; Nagaraj, D.R.; Vianna, S.M.; Napier-Munn, T.J.; Gorain, B. The effect of non-sulphide gangue minerals on the flotation of sulphide minerals from Carlin-type gold ores. Miner. Eng. 2014, 60, 26. [Google Scholar] [CrossRef]
  5. Wieniewski, A.; Skorupska, B. Technology of Polish copper ore beneficiation—Perspectives from the past experience. E3S Web Conf. 2016, 8, 01064. [Google Scholar] [CrossRef]
  6. Kowalczuk, P.B.; Zaleska, E.; Danczak, O. Flotation of carbonaceous copper shale–quartz mixture with poly(ethylene glycol) alkyl ethers. Trans. Nonferr. Met. Soc. China 2015, 25, 314. [Google Scholar] [CrossRef]
  7. Magwaneng, R.S.; Haga, K.; Batnasan, A.; Shibayama, A.; Kosugi, M.; Kawarabuki, R.; Kawata, M. Investigation for removal of organic carbon from carbonaceous copper sulphide ore and improving the recovery of copper through flotation. In Characterization of Minerals, Metals, and Materials; Springer: Cham, Switzerland, 2018; p. 343. [Google Scholar] [CrossRef]
  8. Miller, J.D.; Wan, R.Y.; Diaz, X. Preg-robbing gold ores. In Gold Ore Processing; Elsevier: Amsterdam, The Netherlands, 2016; p. 885. [Google Scholar] [CrossRef]
  9. Feng, D.; Van Deventer, J.S.J. Preg-robbing phenomena in the thiosulphate leaching of gold ores. Miner. Eng. 2001, 14, 1387. [Google Scholar] [CrossRef]
  10. Pan, Z.; Xiong, J.; Cui, Y.; Wei, Q.; Jia, W.; Zhang, Z.; Qin, W. Effect mechanism of CMs on the flotation separation of lead–zinc ore. Sep. Purif. Technol. 2022, 294, 121101. [Google Scholar] [CrossRef]
  11. Niu, H.; Yang, H.; Tong, L.; Zhong, S.; Liu, Y. Spectral study of humic substance extract from pressurized oxidizing slag of Carlin-typed gold deposit. J. Phys. Conf. Ser. 2019, 1347, 012027. [Google Scholar] [CrossRef]
  12. Moroz, T.N.; Ponomarchuk, V.A.; Goryainov, S.V.; Palchik, N.A.; Edwards, H.G.; Zhmodik, S.M. Raman spectra of natural CMs from a black shale formation. J. Raman Spectrosc. 2015, 46, 959. [Google Scholar] [CrossRef]
  13. Heckmann, A.; Fromm, O.; Rodehorst, U.; Münster, P.; Winter, M.; Placke, T. New insights into electrochemical anion intercalation into CMs for dual-ion batteries: Impact of the graphitization degree. Carbon 2018, 131, 201. [Google Scholar] [CrossRef]
  14. Morcos, I. On contact angle and dispersion energy of the cleavage graphite/water system. J. Colloid Interface Sci. 1970, 34, 469. [Google Scholar] [CrossRef]
  15. Bhattacharyya, D.; Depci, T.; Assemi, S.; Prisbrey, K.; Miller, J.D. The nature of graphene surfaces as determined from the wettability studies of basal and edge planes. ECS Trans. 2015, 66, 45. [Google Scholar] [CrossRef]
  16. Sime, F.M.; Jin, J.; Wang, X.; Wick, C.D.; Miller, J.D. Characterization and simulation of graphite edge surfaces for the analysis of CM separation from sulphide ores by flotation. Miner. Eng. 2022, 182, 107590. [Google Scholar] [CrossRef]
  17. Spieth, V. Zechstein Kupferschiefer at Spremberg and Related Sites: Hot Hydrothermal Origin of the Polymetallic Cu–Ag–Au Deposit. Ph.D. Thesis, Universität Stuttgart, Stuttgart, Germany, 2019. [Google Scholar] [CrossRef]
  18. Smith, T.; Lin, D.; Lacouture, B.; Anderson, G. Removal of organic carbon with a Jameson Cell at Red Dog Mine. In Proceedings of the 40th Annual Canadian Mineral Processors Conference, Ottawa, ON, Canada, 22–24 January 2008; Available online: https://www.glencoretechnology.com/.rest/api/v1/documents/ed2ef91249f47c139df4a66f1f12ec0e/Removal-of-Organic-Carbon-with-a-Jameson-Cell-at-R.pdf (accessed on 17 August 2025).
  19. Konieczny, A.; Pawlos, W.; Krzeminska, M.; Kaleta, R.; Kurzydlo, P. Evaluation of organic carbon separation from copper ore by pre-flotation. Physicochem. Probl. Miner. Process. 2013, 49, 189. [Google Scholar] [CrossRef]
  20. Gredelj, S.; Zanin, M.; Grano, S.R. Selective flotation of carbon in the Pb–Zn carbonaceous sulphide ores of Century Mine, Zinifex. Miner. Eng. 2009, 22, 279. [Google Scholar] [CrossRef]
  21. Brooke, K.; Bullock, N.; Harvey, R.; O’Sullivan, R.; Phan, C.; Tan, P.; Telford, P.; Edgar, M. Mount Isa and Townsville operations. In Australasian Mining and Metallurgical Operating Practices, 3rd ed.; Rankin, W.J., Ed.; AusIMM: Carlton, Australia, 2013; Volume 1, p. 931. [Google Scholar]
  22. Martinez-Esparza, G. Productive Versus Non-Productive Porphyry Systems Surrounding the Peñasquito Diatreme-Porphyry System. Ph.D. Thesis, University of Nevada, Reno, NV, USA, 2020; p. 288. Available online: https://search.proquest.com/openview/203d4bda5c89adb9da0e377d657fb9f4/1?pq-origsite=gscholar&cbl=51922&diss=y (accessed on 17 August 2025).
  23. Polat, M.; Polat, H.; Chander, S. Physical and chemical interactions in coal flotation. Int. J. Miner. Process. 2003, 72, 199–213. [Google Scholar] [CrossRef]
  24. Xu, M.; Li, C.; Wang, Y.; Zhang, H. Investigation on mechanism of intensifying coal fly ash froth flotation by pretreatment of non-ionic surfactant. Fuel 2019, 254, 115601. [Google Scholar] [CrossRef]
  25. Kadagala, M.R.; Nikkam, S.; Tripathy, S.K. A review on flotation of coal using mixed reagent systems. Miner. Eng. 2021, 173, 107217. [Google Scholar] [CrossRef]
  26. Mierczynska-Vasilev, A.; Beattie, D.A. Adsorption of tailored carboxymethyl cellulose polymers on talc and chalcopyrite: Correlation between coverage, wettability, and flotation. Miner. Eng. 2010, 23, 985–993. [Google Scholar] [CrossRef]
  27. Chimonyo, W.; Fletcher, B.; Peng, Y. The differential depression of an oxidised starch on the flotation of chalcopyrite and graphite. Miner. Eng. 2020, 146, 106114. [Google Scholar] [CrossRef]
  28. Chen, X.; Liu, S.; Peng, Y. A new approach to selectively reject naturally hydrophobic gangue in the flotation of base metal sulphide minerals. Min. Metall. Explor. 2021, 38, 713–720. [Google Scholar] [CrossRef]
  29. Glembozkii, V.A.; Dmitrieva, G.M.; Sorokin, M.M. Nonpolar Reagents and Their Effect during Flotation; Nauka: Moscow, Russia, 1968. (In Russian) [Google Scholar]
  30. State Standard 2408.3-90; Solid Fuel. Methods for Determination of Oxygen; Standartinform: Moscow, Russia, 1990; 16p. (In Russian)
  31. State Standard 11022-95; Solid Mineral Fuels. Methods for Determination of Ash; Standartinform: Moscow, Russia, 2006; 8p. (In Russian)
  32. Fuerstenau, M.C.; Clifford, K.L.; Kuhn, M.C. The role of zinc–xanthate precipitation in sphalerite flotation. Int. J. Miner. Process. 1974, 1, 307–318. [Google Scholar] [CrossRef]
  33. Pugh, R.J. Macromolecular organic depressants in sulphide flotation—A review, 1. Principles, types and applications. Int. J. Miner. Process. 1989, 25, 101–130. [Google Scholar] [CrossRef]
  34. Sosipatorov, A.I.; Panchenko, G.M.; Vysotin, V.V.; Vinokurova, M.A.; Chikin, A.Y. Application prospects of domestic depressor reagent under carbonaceous gold-bearing ore flotation. Proc. Irkutsk. State Tech. Univ. 2018, 22, 184–193. (In Russian) [Google Scholar]
  35. Ansari, A.; Pawlik, M. Floatability of chalcopyrite and molybdenite in the presence of lignosulfonates. Part I. Adsorption studies. Miner. Eng. 2007, 20, 600–608. [Google Scholar] [CrossRef]
  36. Ansari, A.; Pawlik, M. Floatability of chalcopyrite and molybdenite in the presence of lignosulfonates. Part II. Hallimond tube flotation. Miner. Eng. 2007, 20, 609–616. [Google Scholar] [CrossRef]
  37. Gutiérrez, L.; Uribe, L.; Hernández, V.; Vidal, C.; Mendonça, R.T. Assessment of the use of lignosulfonates to separate chalcopyrite and molybdenite by flotation. Powder Technol. 2020, 359, 216–225. [Google Scholar] [CrossRef]
  38. Kelebek, S.; Yoruk, S.; Smith, G.W. Wetting behaviour of molybdenite and talc in lignosulphonate/MIBC solutions and their separation by flotation. Sep. Sci. Technol. 2001, 36, 145–157. [Google Scholar] [CrossRef]
  39. Nechiporenko, A.P. Acid-Base Properties of the Surface of Solid Substances: Methodical Instructions; LTI im. Lensoveta: Leningrad, Russia, 1989. (In Russian) [Google Scholar]
  40. Nechiporenko, A.P. Donor-Acceptor Properties of the Surface of Solid-Phase Systems. In Indicator Method: Tutorial; Lan: St. Petersburg, Russia, 2017. (In Russian) [Google Scholar]
  41. Atchabarova, A.A.; Abdimomyn, S.K.; Abduakhytova, D.A.; Zhigalenok, Y.R.; Tokpayev, R.R.; Kishibayev, K.K.; Khavaza, T.N.; Kurbatov, A.P.; Zlobina, Y.V.; Djenizian, T.J. Role of carbon material surface functional groups on their interactions with aqueous solutions. J. Electroanal. Chem. 2022, 922, 116707. [Google Scholar] [CrossRef]
  42. Tanabe, K. Solid Acids and Bases: Their Catalytic Properties; Elsevier: Amsterdam, The Netherlands, 2012. [Google Scholar]
  43. Mao, L.; Yoon, R.-H. Predicting flotation rates using a rate equation derived from first principles. Int. J. Miner. Process. 1997, 51, 171–181. [Google Scholar] [CrossRef]
  44. Kijewski, P.; Leszczyński, R. Węgiel organiczny w rudach miedzi—Znaczenie i problemy. Zesz. Nauk. Inst. Gospod. Surowcami Miner. Energią PAN 2010, 79, 131–146. (In Polish) [Google Scholar]
  45. Chimonyo, W.; Peng, Y. Review of the Influence of Native and Modified Biopolymers on Carbonaceous Gangue Depression in Selective Flotation. Miner. Process. Extr. Metall. Rev. 2025, 46, 593–610. [Google Scholar] [CrossRef]
  46. Yergeshev, A.; Tokpayev, R.; Karmeeva, M.; Khavaza, T.; Yergesheva, N.; Atchabarova, A.; Nauryzbayev, M.; Ignatkina, V. Technological Properties Contrast of Galena, Sphalerite, CM and Choice of Flotation Technology. Minerals 2025, 15, 883. [Google Scholar] [CrossRef]
Figure 1. Example of defining characteristic strip absorption intensity for indigo carmine on S_C.
Minerals 15 00974 g001
Figure 2. G_C graphite flotation kinetics with frother (left) and graphic definition k, min−1 (right).
Minerals 15 00974 g002
Figure 3. IR spectra of carbon-containing samples: (a) monophased (W_C, A_C, G_C), (b) multiphased CM.
Minerals 15 00974 g003aMinerals 15 00974 g003b
Figure 4. O 1s XPS scans of W_C (left) and G_C (right); 1 (≈ 532.0 eV)—C–O; 2 (≈ 534.0 eV)—adsorbed H2O and/or strongly H-bonded –OH; 3 (≈ 536.0 eV)—above the typical O 1s range for carbon surfaces, attributed to differential charging; a contribution from interlayer molecular O2 cannot be ruled out but requires verification (mild UHV bake-out and/or charging control).
Minerals 15 00974 g004
Figure 5. Diagram of flotation rate constant (a) k, min−1 of carbonaceous samples at different reagent schemes and influence of depressor PL on (b) flotation rate constant k·102 and (c) εmax, %.
Minerals 15 00974 g005
Table 1. Chemical composition and specific surface area ± standard deviation, %.
SampleC
±2.0
H
±3.1
N
±0.2
O
±0.5
S
±0.2
Ash Content A, %, ±0.5Specific Surface Area, m2/g,
±2.00
1Wood charcoal (W_C)81.14.10.39.90.24.410.34
2Carbon (A_C)84.05.01.57.00.32.2318.10
3Graphite (G_C)98.0--1.0-1.09.98
4Li mica (Li_C)2.5-1.06.00.190.523.36
5Pb-Zn-S ore (S_C)10.2--4.70.784.412.93
Table 2. Elemental composition of CM ash, %.
CMO
±2.0
Si
±1.0
Mg
±0.6
Al
±0.2
Ca
±3.0
Zn
±2.3
Fe
±2.6
K
±0.6
Na
±0.6
S
±1.7
Li_C65.110.10.85.86.7-5.21.70.93.7
S_C56.95.113.30.35.05.24.6-3.66.0
Table 3. Gammet indicators’ characteristics to define types of acid–base centres.
IndicatorFormulaMolecular Massλ, nmpKaActive Centre Type
DinitroanilineC6H5N3O4183.12340−4.4Lewis base
Brilliant greenC27H34N2O4S482.646101.3Brønsted acid
Bromphenol blueC19H10Br4O5S669.975904.1
Bromocresol purpleC21H16Br2O5S540.225906.4
Bromthymol blueC27H28Br2O5S624.394307.3Brønsted base
Indigo carmineC16H8N2Na2O8S2466.3661012.8
M-DinitrobenzeneC6H4N2O4168.1124016.8Lewis acid
Table 4. Carbonaceous samples reagent flotation regime.
Flotation AgentFrother–Pine OilDiesel Oil and FrotherButyl Xanthate and FrotherDepressor (PL)
Concentration, mg/L1020 and 1020 and 1050 and 500
Table 5. Sample surface elemental composition, ± standard deviation, %.
C
±1.0
O
±1.0
Si
±0.5
Mg
±0.5
Al
±0.5
Ca
±0.5
P
±0.1
N
±0.3
F
±0.5
Zn
±0.5
Fe
±0.3
K
±0.1
Na
±0.1
S
±0.2
Pb
±0.1
W_C87.810.2---0.70.10.9---0.3---
A_C85.112.01.4-0.80.7---------
G_C98.51.5-------------
Li_C18.949.312.95.94.22.3-1.13.6-0.71.00.1--
S_C49.234.55.12.51.92.5---2.80.4--0.70.4
Table 6. Data overview on amount of active Brønsted–Lewis centres on carbonaceous samples’ surface at different pKa, ± standard deviation %.
IndicatorActive Centre TypepKagpKa, μmol/m2, ±0.25%
W_CA_CG_CLi_CS_C
DinitroanilineLewis base−4.42.450.770.080.243.84
Brilliant greenBrønsted acid1.30.680.060.330.040.21
Bromphenol blueBrønsted acid4.10.060.170.020.130.37
Bromocresol purpleBrønsted acid6.40.973.870.700.540.27
Bromthymol blueBrønsted base7.30.311.300.360.684.40
Indigo carmineBrønsted base12.81.950.410.533.6331.34
M-DinitrobenzeneLewis acid16.81.610.330.213.864.27
Table 7. Experiment results on flotation kinetics.
SampleFlotation Parameters k, min−1/R2max
Pine OilDiesel Oil + Pine OilButX + PineoilPL + Diesel Oil + Pine Oil
50 mg/L500 mg/L
1W_C0.53/0.90/93.510.44/0.98/92.370.46/0.99/90.570.69/0.95/98.000.50/0.87/95.7
2A_C0.23/0.94/68.430.27/0.90/77.670.29/0.99/83.920.26/1.00/72.830.24/1.00/69.50
3G_C1.08/0.94/99.391.95/0.93/99.981.21/0.88/99.400.94/0.92/99.390.84/0.94/98.98
4Li_C0.18/0.96/61.100.30/1.00/78.570.32/0.97/79.500.23/0.99/68.290.17/0.99/56.53
5S_C0.15/0.87/81.150.33/0.96/83.020.36/0.98/84.070.26/1.00/72.000.14/0.99/52.54
Table 8. pH values at studied reagent schemes.
Reagent SchemepHinitialpHfinal
W_CA_CG_CLi_CS_C
pine oil5.6 ± 0.46.207.305.408.565.53
diesel oil + pine oil5.6 ± 0.46.207.255.708.615.66
ButX + pineoil5.6 ± 0.45.967.405.768.565.84
Disclaimer/Publisher’s Note: The statements, opinions and data contained in all publications are solely those of the individual author(s) and contributor(s) and not of MDPI and/or the editor(s). MDPI and/or the editor(s) disclaim responsibility for any injury to people or property resulting from any ideas, methods, instructions or products referred to in the content.