Abstract
In order to identify the distribution pattern of radionuclides in the surface soil in the area of a sandstone-type uranium deposit, and to explore its spatial relationship with the location of the orebody, soil radon measurements and ground gamma-ray spectroscopy were carried out in the Barun study area, and soil properties were analyzed. The results show that the soil radon concentrations exhibited a bimodal feature, while the uranium content showed a decreasing trend along the tendency direction of the orebody. In the ground projection area of the orebody, radon concentration showed a positive correlation with uranium content, with both showing relatively low values. Combined with the results of field geological observation and soil property analysis, it is believed that the relatively low radon concentration and uranium content above the orebody is related to the soil being mainly sandy soil. Relatively high uranium values are distributed within approximately 1.5 km north of the northern boundary of the orebody and near the southern boundary of the orebody. High-value radon anomalies occur within about 2 km north of the northern boundary of the orebody and within about 1.3 km south of the southern boundary of the orebody.
1. Introduction
In the 1950s, China applied soil radon measurement to the exploration of hard rock-hosted uranium deposits and achieved good application results [1]. As the development of exposed surface and shallow surface uranium deposits has been exhausted, sandstone-type uranium deposits have become the key objects of uranium exploration in China due to their shallow burial depth, wide distribution range, and ability to be leached in situ. In recent decades, some Chinese scientists have studied the application effect of soil radon measurement in sandstone-type uranium exploration. On the basis of previous survey results, it was found that there were significant differences in the spatial coupling relationship between the abnormal soil radon concentration and the location of orebodies in different uranium mining areas. Among them, the uranium deposits in Saihan Gobi and Bayan Ula in the Erlian Basin in Inner Mongolia were usually located in the area of low-value radon anomalies. There were high-value anomalies or high halos on both sides of the orebody, forming traps (halo) [2]. The study of the Hadatu uranium deposit, a large sandstone-type uranium deposit in the Erlian Basin, revealed that the soil radon concentrations above the orebody were predominantly low, while a high-value zone or anomalous zone was distributed along the southern edge of the deposit [3]. In the Qiaoergu uranium mining area of the Erlian Basin, the orebody was located in a low-value zone, transitioning from high soil radon concentrations to low concentrations [4]. However, the survey results of Tan, Zhang, Shen, etc. in the sandstone-type uranium deposit area showed that the orebodies were located in the high radon concentration anomaly area [5,6,7]. A few scientists from other countries have also conducted soil radon measurements in sandstone-type uranium mining areas, and the results showed that the area above the sandstone-type uranium deposits often exhibits high value anomalies [8,9,10,11,12]. For example, a large area of high radon anomaly was found above the orebody in the “Uuraven mineral belt” of the Colorado Plateau and Northern Wyoming [8,9,10,11]. A uranium-rich paleochannel area in Pakistan showed an obvious high-value radon anomaly above a sandstone uranium deposit [12]. Of course, there were exceptions. In the Grant Mine Belt area of New Mexico, there was an offset between the high value of soil radon concentration and the location of the orebody [13].
Soil radon concentration mainly depends on the content of uranium and radium in the soil. In addition, some studies have pointed out that soil humidity, soil porosity, and soil gas permeability are the key factors influencing soil radon concentration [14,15]. Due to the thick overburden layer on the surface of sandstone-type uranium deposits, the use of soil radon measurement for uranium exploration is greatly affected by surface coverings. Therefore, this study selected the Barun sandstone-type uranium mining area as the study area, and soil radon measurements and ground gamma-ray spectroscopy were carried out. Combined with field geological observation and laboratory analysis of soil properties, the distribution characteristics of radionuclides in surface coverings were studied, and the spatial coupling of surface radionuclide anomalies with uranium orebody locations was performed.
2. Materials and Methods
2.1. Study Area
The study area is located in the Tabei Sag in the west of the Manite Depression in the northeast of Erlian Basin, Inner Mongolia, China (Figure 1) [16]. A large area of intermediate acid-intrusive rocks and volcanic sedimentary rocks with high uranium content are distributed in the Bayinbulige uplift and Sonid uplift on the north and south sides of the study area, providing abundant uranium sources for the mining area [16,17]. The stratigraphy encountered in the borehole from bottom to top is the lower section of the Lower Cretaceous Saihan Formation (K1s1), the upper section of the Saihan Formation (K1s2), and the Paleogene Irdin Manha Formation (E2y), as shown in Figure 2 [17]. The top of the lower section of Saihan Formation is composed of mudstone and black lignite coal seam, which constitute the regional water-resisting floor of ore-bearing aquifer in this region. It is also an important coal-bearing strata in the basin. The upper section of the Saihan Formation is the main uranium-bearing layer, and its lithology is composed of composite sand bodies. The floodplain deposits above it form a stable water-repellent roof.
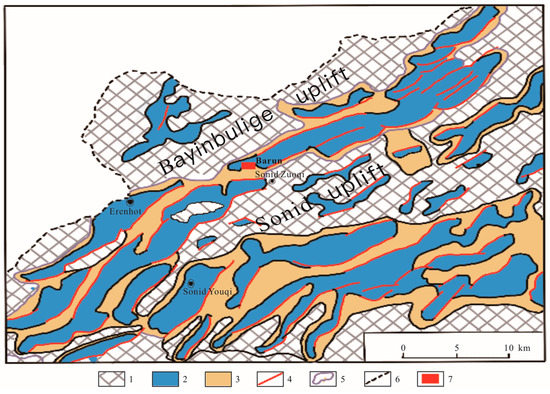
Figure 1.
Structural map of Erlian Basin in Inner Mongolia, modified from [16]: 1—uplift area; 2—Cretaceous depression area; 3—Cretaceous slope belt development area; 4—fault; 5—basin boundary; 6—national boundary; 7—Barun uranium deposit.
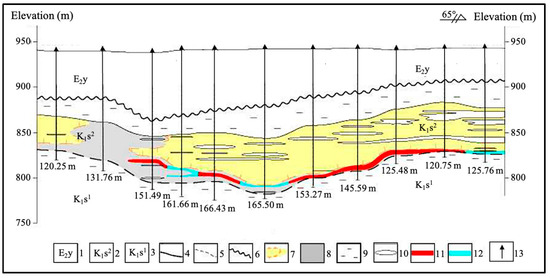
Figure 2.
Cross-section of one of the exploration lines in the study area [17]: 1—Irdin Manha Formation; 2—upper section of Saihan Formation; 3—lower section of Saihan Formation; 4—lithological boundary; 5—parallel unconformity boundary; 6—angular unconformity boundary; 7—oxidation zone, front line; 8—gray sandstone; 9—regional impermeable layer; 10—mudstone interlayer; 11—uranium deposit; 12—uranium mineralization; 13—drilling.
Uranium orebodies are controlled by phreatic interlayer oxidation zones developed in paleochannel sandstone bodies, and they mainly occur in the oxidation–reduction transition zone sand bodies that are dominated by interlayer oxidation development and adjacent to unaltered zones [17,18]. The orebody is distributed in a northeast–southwest direction, which is basically consistent with the spreading pattern of the paleochannel. In the plane, the orebody is irregularly shaped, and its shape is controlled by the oxidation zone interface. In the vertical direction, the orebody is plate-shaped, controlled by a plate-shaped oxidation zone. The orebody is mainly located in the residual gray sand body at the lower section of the oxidation–reduction zone interface, basically parallel to the aquifer floor [17,18]. The burial depth of the orebody is about 100 m, with a thickness range of 1.5–14.4 m and an average grade of 0.02% [17,19]. The surface of the study area is mainly covered by thin layers of Quaternary sands and gravel [17,18]. Field geological observations revealed differences in surface sediments in the study area. The surface of the northern part of the orebody along the direction of the exploration line is sandy soil containing gravels and pebbles, with a particle size of 2–10 mm, sparse vegetation, and relatively dense soil. The surface of the southern part of the orebody is sandy soil with little or no gravel, and the soil is relatively loose. The surface soil above the orebody is consistent with the southern part of the orebody. Parts of the onsite surface soil observation maps and soil sample states are shown in Supplementary Figure S1.
2.2. Field Measurements
The principle of the survey line layout in the study area was parallel or perpendicular to the previous exploration line. According to the projection position of the orebody on the ground, eight survey lines were arranged in the study area, as shown in Figure 3. The distance between survey lines was 200 m, and the distance between survey points was 100 m. The distance between the points was encrypted according to the change in the measured soil radon concentration during the measurement process. The number of measurement points in this survey was 281, and each measurement point simultaneously measured soil radon concentration and ground gamma spectrum. We also measured the soil radon concentration at different depths in the ground projection area of the orebody, with a depth increment of 20 cm. In addition, after removing surface weeds and floating soil at each measurement point, two surface soil samples were collected at each measurement point using a circular constant-volume soil extractor for the measurement of soil properties in the laboratory. The collected soil samples were sealed in storage bags.
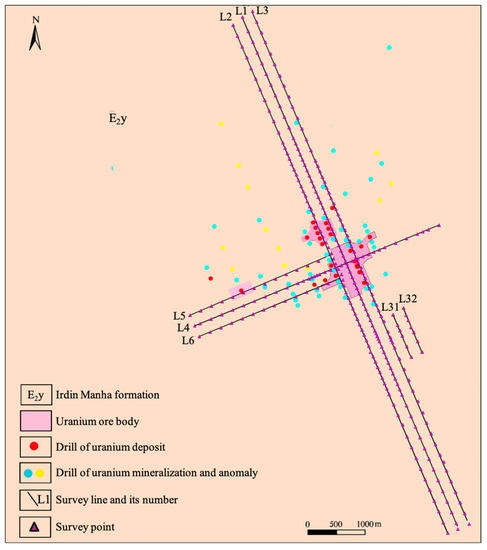
Figure 3.
Distribution map of measurement points in the study area.
The actual measurement map in the field is shown in Figure 4. Measurement of radon in soil was carried out using an RAD 7 electronic radon meter produced by DURRUDGE. The RAD 7 was calibrated in the standard radon chamber in the National Institute of Metrology, China, before conducting field measurements. Soil radon measurement mainly included two steps: first, a stainless-steel gas probe with inner diameter of 8 mm and 15 mm outer diameter was drilled into each measurement point to a measurement depth of 80 cm; second, the soil probe was connected to the air inlet of the RAD 7 measurement system. The soil gas entered the instrument measurement chamber through a dust filter, a CaSO4 drying tube, and an inlet filter. Then, the measurement was initiated using the 3 min sniff mode. Each sampling point was continuously measured 10 times, and the average value of the stable measurement value was taken as the soil radon concentration of the sampling point. The specific measurement steps refer to Wang (2012) [20]. RAD 7 is a widely used instrument for measuring radon concentrations in various environmental settings, including soil. When conducting soil radon concentration measurements, the RAD 7 instrument may require a certain measurement time to achieve stable readings. Typically, during field measurements, it takes approximately 30 min to finish one measurement point. This may not be efficient for rapid exploration purposes. Additionally, the RAD 7 is sensitive to humidity. Therefore, during measurements, it is necessary to connect a drying tube to dehumidify the gas entering the measurement chamber, ensuring that the relative humidity is below 10% to maintain the accuracy of the measurement results.
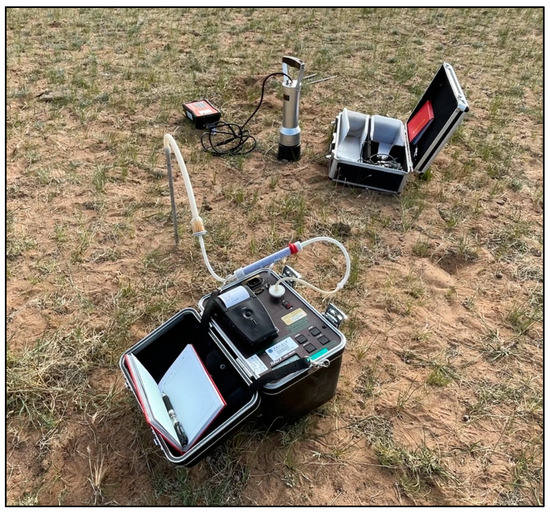
Figure 4.
Field measurements of soil radon concentration and ground gamma spectrum.
The instrument used for field gamma spectrum measurement was digiDART, a multichannel gamma spectrometer with a NaI(Tl) crystal size of φ75 mm × φ75 mm. The energy resolution was 7.43% (for the 662 keV energy peak of 137Cs). To ensure the accuracy of the measurement results, the instrument was calibrated in the Airborne Survey and Remote Sensing Center of Nuclear Industry, Shijiazhuang, Hebei Province, China. Five calibration pads (K-pad, U-pad, Th-pad, M1-pad, and M2-pad, where M1-pad and M2-pad are two mixed sources consisting of U, Th, and K in different proportions) were applied to determine stripping ratios. Each pad comprised a cylinder (2.20 m in diameter and 0.50 m in height) enclosed within a thin iron sheet (on the sides and bottom side), and an epoxy resin sealing (on the top side). The instrument calibration and calculation of conversion coefficients referred to the IAEA (1989) and Li (2016) [21,22]. When performing field measurements, the NaI(Tl) detector is susceptible to spectral drift due to environmental temperature variations. Therefore, before measuring new measurement points, we performed a stabilization procedure on the spectrometer. In the field, the potassium content in the surface soil was relatively high, allowing us to use soil as a reference source. By combining it with a cesium source, we achieved spectrometer stabilization, ensuring the accuracy of onsite measurement results. The detector of the gamma-ray spectrometer was placed on the surface of ground, corresponding to the calibration condition. The sampling time for each measuring point was 600 s, and two spectral lines were collected continuously. The instrument was capable of collecting the full-energy peak counts of uranium (1.76 MeV for 214Bi), thorium (2.62 MeV for 208Tl), and potassium (1.46 MeV for 40K) in the soil in the field, and then calculating the uranium, thorium, and potassium contents using the full-energy peak count rates of the collected individual peaks and combining them with the conversion coefficients obtained at the instrument calibration. The calculation method referred to Wang (2005) [23].
2.3. Calculation of Soil Properties
The calculation of soil properties included soil humidity (), soil water saturation (), soil density (), soil bulk density (dry density ), soil particle density (), and soil porosity (). Soil humidity was measured using the drying method, which is the ratio of the water content in the soil to the dry mass of the soil. Soil bulk density was calculated on the basis of soil density and soil humidity, as shown in Equation (1). Dr. Liu in our laboratory compared the calculation results under two methods of soil porosity (particle density method and empirical formula method) in his PhD thesis and found that the relative error of the average value of the results obtained using the two calculation methods was only 3.81% [24]. Therefore, the calculation of soil porosity was carried out using the empirical formula shown in Equation (2) [25]. Soil water saturation was calculated according to Equation (3). Soil particle density was measured using the pycnometer method [26], which is based on the relative density method, as shown in Equation (4). The specific measurement procedure of the pycnometer method was carried out as described in Liu (2018) [24]. In this study, the empirical formula method was also used to calculate the soil particle density for comparison with the actual measurement results. The empirical formula is shown in Equation (5) [24,25].
where denotes the soil bulk density (g·cm−3), is the soil density (g·cm−3), is the soil humidity (%), is the soil porosity (%), is the soil water saturation (%), represents the particle density of the soil (g·cm−3), is the weight of the pycnometer plus soil sample corrected to oven-dried water content (g), is the weight of the pycnometer filled with water (g) at temperature t, is the weight of the pycnometer filled with water and soil (g) at temperature t, and is the density of water (g·cm−3) at temperature t.
2.4. Soil Radon Diffusion Coefficient and Calculated Radon Concentration
The calculation of the diffusion coefficient of soil radon is shown in Equation (6) [25,27]. Gamma spectroscopy characterizes the information of radionuclides in shallow soil. Assuming that the radon gas in the soil layer originates from the decay of uranium in the soil layer, the uranium content measured by the gamma spectrum has a linear relationship with the background value of the radon concentration in the soil. The radon concentration calculated using the measured uranium content (called calculated radon) can reflect the information characteristics of the shallow radon concentration distribution, while the ratio of the measured radon concentration to the calculated radon concentration can be used to evaluate whether there is Supplementary Information of radon from other sources [28]. The calculation formula is given in Equation (7) [29].
where is the diffusion coefficient (cm2·s−1), is the diffusion coefficient of radon in the air (taken as 0.11 cm2·s−1), is the soil radon concentration calculated from the soil uranium content (Bq·m−3), is the measured soil uranium content (×10−6), is the emanation coefficient of radon in soil (%), is the decay constant of radon (taken as 2.1 × 10⁻⁶·s−1), and represents the sampling depth (cm) of soil radon measurement.
3. Results
The soil radon concentration in the study area followed a log-normal distribution. The original data of soil uranium content followed a normal distribution according to “EJ/T 363-2012: Specifications for ground γ-ray spectrometric survey” [30] after eliminating outliers. In order to ensure the accuracy of the measurement results, several inspection points were set in each survey line during the field survey. The number of inspection points exceeded 5% of the basic survey, and the relative error between the basic survey result and the inspection survey result was within 20%.
3.1. Characteristics of the Planar Distribution of Soil Radon Concentrations
The statistical results of the soil radon concentration are presented in Table 1 (See Table S1 for original data), after the removal of outliers according to the Pauta criterion method (3σ criterion) [31]. The mean value of radon concentration in the study area was 9.46 ± 4.50 kBq·m−3, ranging from 2.50 kBq·m−3 to 21.38 kBq·m−3. Among the three measurement lines (L1, L2, and L3) passing through the orebody in the north–south direction (the tendency direction of the orebody), the values of various statistical parameters of the measured radon concentration values in each measurement line were close. The inverse distance weighted (IDW) method was used to plot the measured radon concentration values into the contour map shown in Figure 5. It can be clearly seen that the radon concentration along the tendency direction of the orebody was characterized by “double peaks”. The high-value anomalies were distributed on the north and south sides of the ground projection area of the orebody, while the orebody was located in the low-value anomaly area sandwiched by the high-value anomalies. The average radon concentrations on the north and south sides of the orebody were about 12.83 kBq·m−3 and 9.28 kBq·m−3 respectively, while the average radon concentration above the orebody was only 5.92 kBq·m−3.

Table 1.
Summary statistics of soil radon concentrations (kBq·m−3) in the study area.
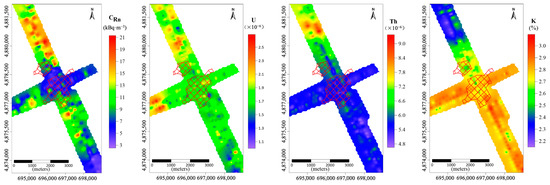
Figure 5.
Contour maps of radon concentration, uranium, thorium, and potassium content in the study area. Note: The red frame range in the figures denotes the ground projection area of known orebodies; the same applies below.
By comparing the survey results of this study with the existing investigation results in other sandstone-type uranium mining areas in the Erlian Basin, Inner Mongolia [2,3,4], it was found that there were differences in the surface soil radon concentrations among different research areas, but all of them exhibited low radon concentrations above the orebodies. The previous survey results are summarized below.
The background soil radon concentrations in the Saihan Gobi uranium mining area and Bayan Ula uranium mining area were 3.68 kBq·m−3 and 3.52 kBq·m−3, respectively. The orebodies were mostly located within the low radon halo or within the background values, while the soil radon concentrations on both sides of the orebodies exceeded 10.00 kBq·m−3 [2]. The soil radon concentration above the orebody in the Hadatu uranium mining area showed background values of approximately 3.71 kBq·m−3, with the maximum anomaly value near the southern edge of the deposit reaching nearly 14.00 kBq·m−3 [3]. The variations of soil radon concentrations directly above the Qiaoergu uranium deposit were 3.00–6.00 kBq·m−3, while one side of the orebody exhibited high radon concentrations ranging from 7.00 to 12.00 kBq·m−3 [4].
The variation law of soil radon concentration with measurement depth in the ground projection area of the uranium orebody is shown in Figure 6 (See Table S3 for original data). The radon concentration at each measuring point showed an exponential growth trend with the increase in measurement depth. The goodness of fit of the change curve was greater than 0.9. However, with the increase in measurement depth, the slope of the growth curve of radon concentration first increased and then decreased.
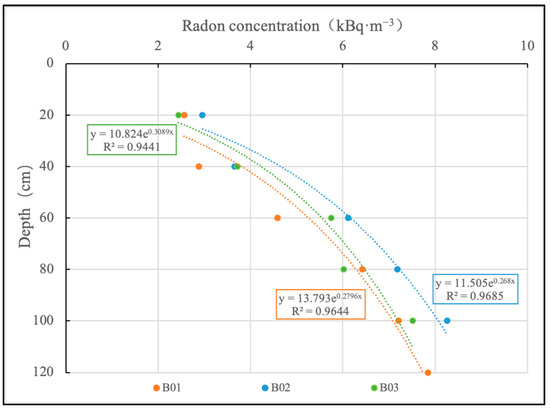
Figure 6.
Changes in radon concentration at different depths in the ground projection area of the orebody.
3.2. Characteristics of the Planar Distribution of Soil Uranium, Thorium, and Potassium Contents
The average contents of uranium, thorium, and potassium in the surface soil of the study area were 1.78 × 10⁻⁶, 5.84 × 10⁻⁶, and 2.69%, respectively, with ranges of 0.90 × 10⁻⁶–2.69 × 10⁻⁶, 4.15 × 10⁻⁶–9.75 × 10⁻⁶ and 2.10–3.10%, respectively (Table 2, See Table S2 for original data). Among the three measurement lines (L1, L2, and L3) passing through the orebody in the tendency direction of the orebody, the values of various statistical parameters of the measured uranium, thorium, and potassium contents of each measuring line were similar. Combined with the uranium, thorium, and potassium content contour maps (Figure 5), it can be seen that the change characteristics of uranium and thorium content along the tendency direction of the orebody were consistent, and both showed locally high values on the north side of the orebody. The contents of uranium and thorium above the orebody and on the south side of the orebody were similar, and the average values were comparable to the overall average values in the study area. The variation characteristics of potassium content were the complete opposite, showing low values on the north side of the orebody, while relatively high values were located above the orebody and the south side of the orebody.
Table 2.
Statistical table of field measurements of soil uranium, thorium, and potassium content (for 238U and 232Th, the units are both ×10−6; the unit for 40K is %).
3.3. Profile Distribution Characteristics of Soil Radionuclide Content and Soil Properties and Their Correlation
Considering that the values of various statistical parameters of measured radon concentration, uranium, thorium, and potassium contents were similar among the three measurement lines (L1, L2, and L3), the L1 measurement line was taken as an example. The values of soil property at each measurement point were calculated by combining Equations (1)–(6), and the theoretical radon concentration values (called calculated radon concentration) were further calculated by combining with Equation (7). The goodness of linear fit between the soil particle density values obtained using the laboratory pycnometer method and the results calculated using the empirical formula reached 0.83, and the relative error was less than 20%.
The profile distribution characteristics of soil radon concentration (CRn), calculated radon concentration (CRn’), uranium content (U), and uranium–thorium ratio (U/Th) at each measurement point are shown in Figure 7. In the ground projection area of the orebody, the variation pattern of CRn and CRn’ was the same, but CRn was 28% lower than CRn’. There were significant differences between the variation patterns of CRn and CRn’ on the north and south sides of the orebody, and there were continuous areas where CRn was greater than CRn’. Furthermore, CRn at measurement point L1-43 was approximately 3.5 times higher than CRn’. The variation pattern of U and U/Th along the profile direction was consistent, and U and U/Th showed a significant positive correlation with a correlation coefficient of 0.83 (p < 0.01) obtained by Pearson correlation analysis. There were mutations in U and U/Th near the orebody boundary, and the maximum changes of both reached 63% and 55%, respectively. Pearson correlation analysis between CRn and U in the ground projection area of the orebody showed a positive correlation with a correlation coefficient of 0.57 (p < 0.05).
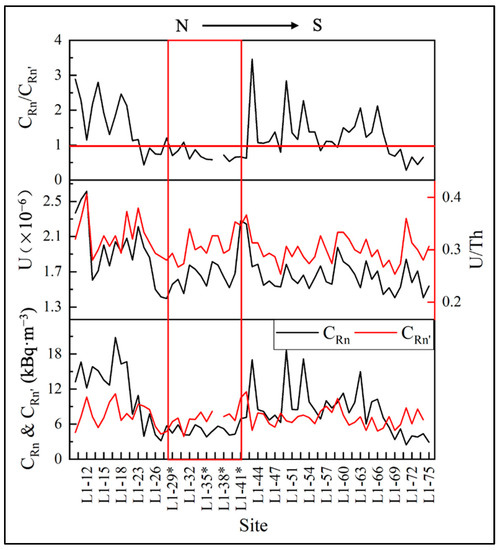
Figure 7.
Profiles of soil radionuclide content and soil properties in the L1 measurement line. Note: The red box is the area above the orebody. CRn—measured soil radon concentration; CRn′—calculated radon concentration. * Denotes that the sampling point is located directly above the ore body.
We also performed multiple linear regression analysis using SPSS for CRn, U, and soil properties, and the results are shown in Table 3 (See Table S4 for the original soil property data). The regression equation was significant (F = 5.116, p < 0.05). The uranium content (β = 0.367, p = 0.005) and soil humidity (β = 0.608, p = 0.004) significantly positively influenced the radon concentration, whereas soil porosity (β = −0.848, p < 0.05) significantly negatively influenced the radon concentration. These variables together explained 24.90% of the variation in radon concentration.
Table 3.
Results of multiple linear regression analysis of radon concentration with uranium content and soil properties.
4. Discussion
Uranium is a relatively active element, which is prone to activation, migration, and re-enrichment under the influence of the geochemical environment, while thorium has better chemical stability and is basically not lost under surface environmental conditions [32,33,34]. Therefore, observing the relative change in U/Th can highlight the possible activation and migration of U in the stratum [35]. As can be seen from Figure 7, relatively high values of U/Th existed at the northern and southern boundaries of the orebody, which were about 33% higher than the mean value of the study area, indicating the presence of enrichment of U in this area. The significant positive correlation between U and U/Th in the study area with a correlation coefficient of 0.83 indicates that the relative changes of U in the soil were affected by the activation, migration, and re-accumulation of U. Relatively high values of U were distributed within an area of about 1.5 km north of the northern boundary of the orebody and near the southern boundary of the orebody.
The variation patterns of CRn and CRn’ in the ground projection area of the orebody were consistent, and CRn showed a positive correlation with U, indicating that the radon in the soil in this area mainly came from the decay of uranium in the soil. The CRn was 28% lower than CRn’, related to the fact that the theoretical calculation formula of radon only considers the diffusion effect of soil radon, but ignores the convective effect of radon. From the field geological observation, we found that the soil above the orebody was dominated by the sand body with better soil permeability [36]. The change in atmospheric temperature and pressure would affect the escape of radon gas from the soil to the atmosphere [37], which would make the measured value deviate from the calculated value. In addition, the growth curve of soil radon concentration in the ground projection area of the orebody gradually flattened with the increase in measurement depth (Figure 6), which also reflects that the radon concentration in this area was mainly related to soil properties and soil uranium content [31]. On both sides of the orebody, there were continuous areas where CRn was significantly higher than CRn’. Combined with the multiple linear regression analysis results of radon concentration with uranium content and soil properties, it can be known that the radon concentration was significantly influenced by uranium content, soil humidity, and soil porosity, but its influence could only explain 24.90% of the variation of radon concentration, indicating that the CRn anomalies on both sides of the orebody were not only influenced by the surface soil. The abnormally high radon concentration was distributed within about 2 km north of the northern boundary of the orebody and within about 1.3 km south of the southern boundary of the orebody.
5. Conclusions
In this study, we thoroughly considered the influence of surface soil when investigating the distribution patterns of radionuclides in the surface soil and their spatial coupling relationship with the uranium deposit. Our results can serve as a reference for future exploration of sandstone-type uranium deposits using ground radiometric methods. The main conclusions of this study are as follows:
- Along the tendency direction of the orebody, the soil radon concentration showed a “double peak” characteristic, with the ground projection area of the orebody showing a relatively low value. Relatively high values were present on the north and south sides of the orebody. The uranium content in the soil showed the background value in the ground projection area of the orebody, and there were local relatively high values on the north side of the orebody and near the southern boundary of the orebody.
- The low value of soil radon concentration in the ground projection area of the orebody was related to the fact that the soil was mainly sand body with high permeability, and that the uranium content in the soil was relatively low. The soil radon concentration and soil uranium content showed a positive correlation. The abnormally high radon concentration on the north and south sides of the orebody was not only affected by soil uranium content and soil properties. The anomalously high radon concentration occurred within about 2 km north of the northern boundary of the orebody and within about 1.3 km south of the southern boundary of the orebody.
- The relative change in uranium in the soil in the study area was related to the activation and re-enrichment of uranium in the soil. Relatively high uranium values were distributed within about 1.5 km north of the northern boundary of the orebody and near the southern boundary of the orebody.
Supplementary Materials
The following supporting information can be downloaded at https://www.mdpi.com/article/10.3390/min13070973/s1: Figure S1: Surface soil conditions in the northern part of the orebody (L1-8, L1-17) and the southern part of the orebody (L1-57, L1-74) in the study area. Table S1: Original data of radon concentration; Table S2: Original data of ground gamma-ray spectrum; Table S3: Data of soil radon concentration at different depth; Table S4: Data of Soil Property
Author Contributions
Conceptualization, N.W.; data curation, C.Y., B.J., L.S., and M.H.; formal analysis, C.Y.; funding acquisition, N.W.; investigation, C.Y., B.J., L.S., and N.W.; methodology, C.Y. and N.W.; project administration, N.W.; resources, N.W.; supervision, N.W.; validation, C.Y.; visualization, C.Y.; writing—original draft, C.Y.; writing—review and editing, M.H. and N.W. All authors have read and agreed to the published version of the manuscript.
Funding
This research was funded by the National Natural Science Foundation of China, grant number U2067204.
Data Availability Statement
The data presented in this study were uploaded as Supplementary Materials.
Acknowledgments
The authors wish to thank the Beijing Research Institute of Chemical Engineering and Metallurgy for their contribution to the smooth implementation of this field work. The authors also wish to acknowledge the strong support of the No. 208 Geological Party of China National Nuclear Corporation for field work. The authors specially acknowledge the reviewers, whose comments significantly improved this research.
Conflicts of Interest
The authors declare no conflict of interest.
References
- Wu, H.S.; Lin, Y.F.; Bai, Y.S. Radon Measuring Method and Application; Atomic Energy Press: Beijing, China, 1995. [Google Scholar]
- Liu, W.S.; Li, B.H.; Shi, Q.P.; Jia, L.C.; Zhao, X.Q. Model and application of radon anomaly in soil of sandstone type uranium deposits in Erlian Basin. Geophys. Geochem. Explor. 2015, 39, 234–239. (In Chinese) [Google Scholar] [CrossRef]
- Shi, L.C.; Zhang, X.; Yang, Y.Q.; Han, P.H.; Niu, J.J.; Lv, Y.Y.; Zhou, Z.J.; Shen, Z.X. Comprehensive geophysical and geochemical characteristics of the Hadatu uranium deposit in Erlian Basin and their prospecting significance. Geol. Explor. 2022, 58, 0274–0285. (In Chinese) [Google Scholar] [CrossRef]
- Wu, Q.B.; Chen, C.; Yang, L.Q.; Yu, X.; Gao, L.J.; Zhou, J.J.; Liu, W.S. Study of integrated geophysical characteristics of paleo-valley sandstone-type uranium deposits in the middle of the Erenhot basin. Acta Geol. Sin. 2021, 95, 2521–2536. (In Chinese) [Google Scholar] [CrossRef]
- Tan, C.L.; Xie, H.N.; Tang, S.X. The experiment of seven radioactive methods in the exploration of sandstone-type uranium deposits. World Nucl. Geosci. 2007, 3, 172–177. (In Chinese) [Google Scholar]
- Zhang, L.; Guo, L.; Liu, L.L.; Yuan, L.; Li, Y.F.; Bai, S.H. The application of activated carbon radon measurement method for sandstone-type uranium exploration in Shuanglong area, southern Ordos basin. World Nucl. Geosci. 2018, 3, 154–160. (In Chinese) [Google Scholar] [CrossRef]
- Shen, Z.X. The Application of Radon Survey by Activated Carbon in the Exploration of Sandstone-type Uranium Deposit in Teguidda, Niger. Uranium Geol. 2012, 4, 250–256. (In Chinese) [Google Scholar] [CrossRef]
- Card, J.W.; Bell, K. Collection of radon decays products—A uranium exploration technique. J. Geochem. Explor. 1982, 17, 63–76. [Google Scholar] [CrossRef]
- Gingrich, J.E.; Fisher, J.C. Uranium exploration using the Track Etch method. In Proceedings of the Exploration of Uranium Ore Deposits, Vienna, Austria, 29 March–2 April 1976. [Google Scholar]
- Khan, H.A.; Akber, R.A.; Ahmad, I. The use of Alpha Sensitive Plastic Films (ASPF) for uranium/thorium exploration and prospecting. Radiat. Phys. Chem. 1978, 11, 295–297. [Google Scholar] [CrossRef]
- Pedersen, C.P.; Donbier, J.; Gingrich, J.E. Experience with the Track Etch Method for Uranium Exploration in Northern Australia. In Uranium in the Pine Creek Geosyncline; Ferguson, J., Goleby, A.B., Eds.; IAEA: Vienna, Austria, 1980; pp. 351–356. [Google Scholar]
- Qureshi, A.A.; Beg, M.S.; Ahmed, F.; Khan, H.A. Uranium exploration in Pakistan using alpha sensitive plastic films (ASPF). Int. J. Radiat. Appl. Instrum. Part D Nucl. Tracks Radiat. Meas. 1988, 15, 735–739. [Google Scholar] [CrossRef]
- Fleischer, R.L.; Hart, H.R.; Mogro-Campero, A. Radon emanation over an ore body: Search for long-distance transport of radon. Nucl. Instrum. Methods 1980, 173, 169–181. [Google Scholar] [CrossRef]
- Wang, N.; Xiao, L.; Li, C.; Liu, S.; Huang, Y.; Liu, D.; Peng, M. Distribution and Characteristics of Radon Gas in Soil from a High-Background-Radiation City in China. J. Nucl. Sci. Technol. 2011, 48, 751–758. [Google Scholar] [CrossRef]
- Seyis, C.; İnan, S.; Yalçın, M.N. Major factors affecting soil radon emanation. Nat. Hazards 2022, 14, 2139–2162. [Google Scholar] [CrossRef]
- Liu, X.Y. Prospecting direction of sandstone type uranium deposits in Erlian Basin. Uranium Geol. 2021, 37, 51–60. (In Chinese) [Google Scholar] [CrossRef]
- Huang, Q.F. Uranium Metallogenic Characteristics and Prospecting Direction in the Barun Area, The left County Sunite, Inner Mongolia. Master’s Thesis, Jilin University, Changchun, China, 2018. [Google Scholar]
- Kang, S.; Yang, J.; Qiao, P.; Lv, Y.; Liu, W.; Zhao, X. Mineralization characteristics and potential of paleo-valley type uranium deposit in Central Erlian Basin, Inner Mongolia. Uranium Geol. 2017, 33, 206–214. (In Chinese) [Google Scholar] [CrossRef]
- Chen, S.; Wang, W.X.; Peng, Y.B.; Huang, Q.F. Uranium metallogenic characteristics of Barun area manit depression of Erlian Basin. West. Resour. 2018, 5, 63–65. (In Chinese) [Google Scholar] [CrossRef]
- Wang, N.; Peng, A.; Xiao, L.; Chu, X.; Yin, Y.; Qin, C.; Zheng, L. The level and distribution of 220Rn concentration in soil-gas in Guangdong province, China. Radiat. Prot. Dosim. 2012, 152, 204–209. [Google Scholar] [CrossRef] [PubMed]
- TECDOC-309; Construction and Use of Calibration Facilities for Radiometric Field Equipment. IAEA: Vienna, Austria, 1989.
- Li, B.; Wang, N.; Wan, J.; Xiong, S.; Liu, H.; Li, S.; Zhao, R. In-suit gamma-ray survey of rare-earth tailings dams—A case study in Baotou and Bayan Obo Districts, China. J. Environ. Radioact. 2016, 151, 304–310. [Google Scholar] [CrossRef]
- Wang, N.P.; Xiao, L.; Li, C.P. Determination of radioactivity level of 238U, 232Th and 40K in surface medium in Zhuhai city by in-suit gamma-ray spectrometry. J. Nucl. Sci. Technol. 2005, 42, 888–896. [Google Scholar] [CrossRef]
- Liu, H.T. Study on the Numerical Simulation of Soil Radon Migration and Soil Radon Convective Velocity. Ph.D. Thesis, China University of Geosciences (Beijing), Beijing, China, 2018. [Google Scholar]
- TECDOC-474; Measurement and Calculation of Radon Releases from NORM Residues. IAEA: Vienna, Austria, 2013.
- Flint, A.L.; Flint, L.E. Methods of Soil Analysis: Part 4 Physical Methods; Soil Science Society of America, Inc.: Madison, WI, USA, 2002; pp. 229–240. [Google Scholar]
- Rogers, V.C.; Nielson, K.K. Correlations for predicting air permeabilities and 222Rn diffusion coefficients of soils. Health Phys. 1991, 61, 225–230. [Google Scholar] [CrossRef]
- Li, B.; Liu, W.; Wen, Z.; Su, D.; Shi, Q. Study on deep uranium information of radon anomaly extraction technology. Acta Geol. Sin. Engl. Ed. 2014, 88, 1366–1367. [Google Scholar] [CrossRef]
- Liu, Q.C. Research on the Land-Atmosphere Radon Exchange Model, and the Variation Law and Influencing Factors of Environmental Radon Concentration. Ph.D. Thesis, China University of Geosciences (Beijing), Beijing, China, 1996. [Google Scholar]
- EJ/T 363-2012; Specifications for Ground γ-ray Spectrometric Survey. State Administration of Science, Technology and Industry for National Defense, PRC: Beijing, China; Institute for Standardization of Nuclear Industry: Beijing, China, 2012.
- EJ/T 605-2018; Specifications for Radon and Its Progeny Survey in Uranium Exploration. State Administration of Science, Technology and Industry for National Defense, PRC:: Beijing, China; Institute for Standardization of Nuclear Industry: Beijing, China, 2018.
- Darnley, A.G. Airborne Gamma-Ray Techniques-Present and Future. In Uranium Exploration Methods; Panel International Atomic Energy Agency: Vernna, Austria, 1973; pp. 67–108. [Google Scholar]
- Boyle, R.W. Geochemical Prospecting for Thorium and Uranium Deposits; Elsevier: Amsterdam, The Netherlands; New York, NY, USA, 1982; p. 498. [Google Scholar]
- Suna, A. Investigation of natural radionuclide variations and the possible uranium migration by testing with gamma-ray spectrometer: An example from Tuğlu Tepe and Deliler Sites in Şefaatli/Yozgat, Central Anatolia Region, Turkey. J. Appl. Geophys. 2022, 207, 104866. [Google Scholar] [CrossRef]
- TECDOC-1363; Guidelines for Radioelement Mapping Using Gamma Ray Spectrometry Data. IAEA: Vienna, Austria, 2003.
- Garg, A.; Huang, H.; Cai, W.; Reddy, N.G.; Chen, P.; Han, Y.; Zhu, H.H. Influence of soil density on gas permeability and water retention in soils amended with in-house produced biochar. J. Rock Mech. Geotech. Eng. 2021, 13, 593–602. [Google Scholar] [CrossRef]
- Yang, J.; Busen, H.; Scherb, H.; Hürkamp, K.; Guo, Q.; Tschiersch, J. Modeling of radon exhalation from soil influenced by environmental parameters. Sci. Total Environ. 2019, 656, 1304–1311. [Google Scholar] [CrossRef] [PubMed]


Disclaimer/Publisher’s Note: The statements, opinions and data contained in all publications are solely those of the individual author(s) and contributor(s) and not of MDPI and/or the editor(s). MDPI and/or the editor(s) disclaim responsibility for any injury to people or property resulting from any ideas, methods, instructions or products referred to in the content. |
© 2023 by the authors. Licensee MDPI, Basel, Switzerland. This article is an open access article distributed under the terms and conditions of the Creative Commons Attribution (CC BY) license (https://creativecommons.org/licenses/by/4.0/).