Abstract
This study focuses on the damage caused by salt crystallization and the associated weathering processes in Crazannes limestone during storage. The main objective was to understand the factors contributing to the limestone’s observed flaking and granular disintegration, which cannot be attributed to frequent salt crystallization cycles experienced in outdoor exposure. Porosity and chemical analyses were performed to identify the salt minerals and their distribution within the stone’s microstructure. Chemical analyses revealed the presence of gypsum on the powdery weathered residues and stone surface, while halite was consistently found throughout the samples, with higher concentrations on the surface. The storage of the blocks in a closed room led to moisture evaporation and an increase in relative humidity (RH) ranging from 60% to 75%. Under these conditions, the gypsum crust remained relatively stable. The threshold for halite crystallization decreased to 65% RH in the presence of other salts. Consequently, even slight fluctuations in RH (%) caused by seasonal variations could induce cycles of NaCl crystallization and dissolution, resulting in damage behind the gypsum crust that protects the surface. Despite gypsum and halite not being the most aggressive salts, the porous nature of Crazannes limestone made it highly susceptible to salt-induced deterioration, leading to significant damage during storage, even with a minimal number of cycles. These results highlight the importance of controlling the storage conditions when stones are contaminated by salts.
1. Introduction
Over time, exposed materials inevitably undergo deterioration due to the effects of both time and the surrounding environment. In the case of stones, natural landscapes bring forth new erosion patterns and shapes, often without significant associated complications [1,2]. However, when protected or inhabited areas are subject to weathering, it becomes necessary to undertake measures that ensure the preservation and safeguarding of the environment. One such scenario pertains to built heritage, wherein various types of stones have been utilized worldwide for cultural, religious, and residential purposes, thus constituting an integral part of human heritage. The long-term preservation of these stones from the impact of harsh environments is a matter not confined to contemporary times; even today, the pursuit of individualized solutions for each structure remains a priority.
The intensity and characteristics of weathering patterns depend on various interconnected parameters. The type of stone is a primary factor influencing the deterioration process. The mineralogy and microstructure of the stones, particularly the distribution of their porous system, are essential to understanding the progression of decay [3,4,5].
Within a specific location, the weathering agents and stone type determine the degree of degradation, with exposure time playing a crucial role. Historical quarries have been utilized since prehistoric times, persisting through the medieval era and up to the present day, with the effects of time manifesting in the diverse architectural structures [6]. Different geographical regions experience varying weathering agents. For instance, continental regions are often subject to alterations resulting from the combined influence of temperature and humidity, including thermal fatigue, wetting–drying cycles, and rapid temperature variations leading to thermal shocks [4,5,7]. In coastal environments, salts from sea spray are added to the mentioned weathering agents [1,8]. In both cases, anthropogenic sources of pollutants interact with the stone as well, creating visible and damaging decay patterns [8,9,10].
The conservation of cultural heritage faces significant challenges posed by the detrimental effects of salt crystallization, as has been extensively documented [9,11,12,13,14]. Salts can infiltrate stone structures through various moisture-related pathways [15]. The most prevalent phenomenon is capillary water uptake, which includes rising dampness in walls caused by groundwater [3,4,5,16,17,18]. Groundwater can possess varying levels of acidity, resulting in the presence of ionic compounds that may subsequently precipitate within the stone structure [19], leading to the formation of efflorescence or subflorescence at the capillary fringe threshold [16,20]. Another pathway for salt infiltration is through atmospheric aerosols, whose composition exhibits a strong correlation with the geographical location.
Stones located in coastal areas are the most intense examples of weathering. The combination of temperature, humidity, particle impact, and salt crystallization from sea spray produce a weakening of the stone structure. That leads to different weathering forms [14,21]. Some of them are principally aesthetic, affecting mainly the surface, such as efflorescence, color, and roughness variations [16,22,23,24]. Others are more intense, originating from subflorescence crystallization, such as contour scaling [25], granular disaggregation [25,26], detachments or alveolizations [27,28].
Marine aerosols can be categorized as primary and secondary. Primary marine aerosols are formed as a result of wind interaction with the ocean surface. These aerosols are primarily composed of sodium chloride, although other chemical compounds such as sulfates and nitrates may also be present. Secondary aerosols, on the other hand, are formed through the interaction of primary aerosols with atmospheric SO2, NOx, and CO2, leading to variations in their final composition [10,29]. The composition of sea-generated aerosols depends on relative humidity and particle dimensions, and they can exist in the atmosphere as seawater drops, brine drops, and sea-salt particles. The initial chemical compounds, transport pathways, and environmental factors all influence the aerosol composition and behavior and the subsequent salt crystallization process observed inland. The intensity of sea spray is particularly pronounced along coastal areas, as observed in monuments in the Basque Country, Cádiz, and Malta [9,30,31]. Generally, the concentration of dissolved salts gradually decreases with increasing distance from the sea and higher altitude [8]. However, depending on the geomorphology and air currents, marine salts can sometimes be found inland between 6–100 km from the coast [8,27]. In certain cases, buildings located near the coast or a few kilometers away show little to no presence of marine chlorides, as observed in Bari and Eleusis, where anthropogenic emissions have a greater influence [19,30]. In terms of environmental conditions, Zezza and Macri (1997) [8] found that sulfate and chloride particles were minimal during the summer, while chloride exhibited the highest concentration during the winter, suggesting a preference for continental particulates during the summer and marine particulates during the winter. Furthermore, in summer conditions, coastal landscape denudation is exacerbated by the combined effects of halite crystallization and thermal expansion [1].
According to existing literature, the most prevalent soluble salts commonly found in historical structures near the sea often manifest as carbonates, sulfates, nitrates, and even mixed sulfate–nitrates with varying numbers of crystallization waters [9,10]. Depending on their concentration and the original composition of sea spray, it is possible to determine whether salts have a marine, anthropogenic, or mixed origin using enrichment factors (EF’s) [27,32]. For instance, salts with different compositions may precipitate as a result of chemical reactions with concrete [29], incompatible mortars [33,34,35], or the composition in artificial stones [20].
When salts crystallize in a polluted area, even close to the sea, there is a higher proportion of SO2 and NOx compounds compared to NaCl. The nature and concentration of pollutants are influenced by the proximity to rural or urban areas. Nitrates from pesticides in rural regions [19,36] and sulfates/nitrates from urban areas, resulting from vehicles, heating systems, and industrial activities, primarily react with limestones through dry or wet deposition [37,38]. Dry deposition involves the dissolution of carbonate stones or minerals and the precipitation of sulfates such as gypsum and nitrates [39,40,41]. If organic matter is present in the atmosphere, these particles become trapped within the gypsum crystals, leading to unsightly patinas and black crusts [27,32,37,42,43,44,45]. Wet deposition, on the other hand, occurs when acid rain interacts with the stone surface, causing leaching and mineral dissolution [40,41,46].
The investigation of salt crystallization effects on cultural heritage requires comprehensive knowledge of salt composition to understand the crystallization conditions specific to each salt or salt association [14,47,48,49]. Advanced chemical analyses have been employed to determine the composition of damaged areas, including X-ray diffraction (XRD) for salt mineralogy [29,32,34], X-ray fluorescence (XRF) for elemental composition [27,50], ionic chromatography (IC) and inductively coupled plasma spectrometry (ICP) for ionic composition [8,19,27,32,40,46], scanning electron microscope with energy dispersive X-ray analyzer (SEM-EDX) for visualization and determination of elemental composition in specific crystals [8,29,32,51], Raman spectroscopy for identifying different hydration and weathering phases [29,52], and X-ray microtomography for locating crystallized salts [41,53].
The software ECOS RUNSALT [54,55,56] utilizes the ionic composition of salts and their thermodynamic conditions to determine the nature of salts and their order of crystallization. This allows for the extrapolation of the number of cycles of crystallization–dissolution that salts undergo under known or modeled conditions [49,57]. Additionally, the presence of salts in minor concentrations can be determined [23].
Damage caused by salt crystallization primarily stems from repeated cycles of crystallization–dissolution occurring within voids in the stone. The crystallization generates pressure within the pores and fissures [58,59,60]. If this pressure exceeds the stone’s tensile strength or stress corrosion index, depending on void configuration and its relation to the solution and the growing crystal, it can lead to fissure creation or growth, respectively [61,62]. Irregularities or heterogeneities in the stone can also reduce its resistance to salt crystallization pressure. Laboratory experimental simulations and numerical modeling are used to replicate these cyclic crystallization processes and simulate damage due to fatigue i.e., [13,23,24,48,57,63].
It may seem that removing the stone from its environment and placing it in stable conditions would prevent further cycles of salt crystallization and ensure its safety. However, the reality could be somewhat different, as this article will demonstrate.
Saint Sauveur Church, situated in the city center of La Rochelle on the West Coast of France (Figure 1), is a religious edifice constructed using Crazannes limestone as the principal material. It has been adversely affected by salts originating from the nearby coast, as well as reactions with pollutants. Previous studies on the weathering condition of the church were conducted by Cardell et al. (2003, 2002) [27,51]. In 2007, as part of the church’s restoration, certain blocks were replaced with new ones, some of these decayed blocks were recovered for analysis, while the remaining blocks were stored in an underground cellar. After one year, the blocks exhibited significant granular disaggregation and surface powdering, primarily concentrated within the alveoli due to gravity. By 2023, the blocks had experienced further weathering, with detachment of material and the formation of thick layers up to 1 cm width of granular substance on the bottom of alveoli. Although some variations in temperature or humidity may have occurred between the summer and the winter within the cellar, the frequency of the cyclic changes was minimal if compared with outdoor exposure.
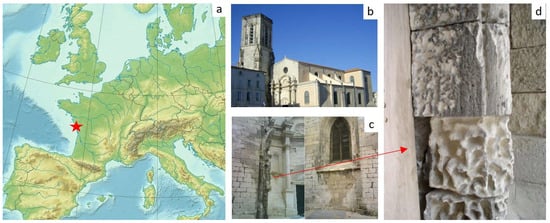
Figure 1.
(a) La Rochelle location in western France; (b) Saint Sauveur Church; (c) walls and columns showing severe weathering; (d) detail of black crusts and alveolizations on one column. Red Star: La Rochelle location.
The primary objective of this study is to comprehend the decay mechanisms that occurred during the period when the blocks were stored in the cellar. To achieve this, a comprehensive characterization of the stone’s mineralogy and microstructure was performed, and the composition, concentration, and evolution of the salts were compared between the years 2007, 2023, and the previous investigations conducted by Cardell et al. in 2003 and 2002 [27,51].
2. Materials and Methods
2.1. Saint Sauveur Church
The Saint Sauveur Church is situated in the picturesque coastal town of La Rochelle, on the Atlantic coast of France (Figure 1a,b). This notable edifice holds a prominent position near the bustling port and the city center, making it vulnerable to both marine aerosols and traffic pollution. Its initial construction dates to 1152, but unfortunately, it has endured two devastating fires and witnessed the ravages of human conflicts, resulting in four reconstructions, the most recent one being in 1720. In the late 19th century, a significant restoration effort was undertaken, followed by another restoration in 2007 due to the deteriorated state of the structure (Figure 1c,d). The church is predominantly built from Crazannes limestone, a microsparitic stone with a light hue and approximately 25% porosity, originating from the Upper Turonian geological period.
2.2. Sampling
During the restoration campaign in 2007, certain blocks were removed and replaced with new ones (Figure 2a). The fresh samples analyzed in 2007 were obtained from remnants of the new and fresh replacement blocks. The weathered blocks extracted from the church were the subject of investigation in 2007 and 2023. These blocks, exhibiting significant alveolization, were cut into slices (Figure 2b,c).

Figure 2.
(a) Block replacement in Saint Sauveur Church; (b) sample slice preparation; (c) slice showing an irregular surface; (d) zone selection, top of the alveoli (TA) and bottom of the alveoli (BA); (e) sample preparation and nomenclature from slices. Small samples were always sawed following depth direction, making the differentiation of TA and BA zones in the 2007 campaign.
In 2007, a vertical series of samples were prepared, categorized based on whether the surface belonged to the top alveoli (SS-TA) or the bottom alveoli (SS-BA) (Figure 2d,e). The samples were prepared at regular intervals, either 1 or 3 cm apart, depending on the specific analysis envisaged (Figure 2e). For the 2023 campaign, samples were prepared from slices of the same block. In this case, the relative distance from the surface was grouped at 3 cm intervals (SS-0, SS-3, SS-6, Figure 2e). Additionally, two samples of powdered material resulting from granular disaggregation, concentrated at the bottom of alveoli, were collected (SS-P1, SS-P2). The size of the samples varied according to the specific analysis conducted.
Cardell et al. (2003) [27] performed a comprehensive study on limestone weathering along the western coast of France. Some of their samples corresponded to the stones used in this study, as fresh Crazannes stone (referred to as CR-1 and CR-4) and one sample from a severely alveolized area of the Saint Sauveur Church (referred to as CR-M5). Whenever possible, these three samples were included in the analysis comparison, maintaining their original reference names.
2.3. Methodology
During the two analysis campaigns, several complementary analyses were carried out. The aim was to understand the textural and mineralogical features, together with the composition of the weathering products. The analysis conducted by Cardell et al., 2002, 2003 [27,51], were included to complete the information about the stone decay (Table 1).

Table 1.
Analyses performed during the two campaigns and from references.
2.3.1. Petrographic Description
Two thin sections corresponding to the surface (SS-0) and from 3 cm depth (SS-3) from the specimen were prepared and analyzed with a polarized microscope OLYMPUS BX51 with a color camera QImaging QICAM Fast 1394 at GEGENAA (Reims, France). The samples were permeated with blue resin to facilitate the image analysis of the porosity. JMicrovision software was used for the image analysis.
2.3.2. Water Absorption Porosity
Open porosity was obtained following the standard EN 1936 [64]. The dried samples were weighed and placed in a desiccator, from which a vacuum pump was employed to extract air from the pores. Degassed water was then gradually introduced until the samples were fully submerged. After that, atmospheric pressure was restored, and the samples were left immersed in water for a duration of 24 h. With the dry, saturated, and hydrostatic weight, the open porosity could be easily quantified.
An exhaustive analysis of open porosity was conducted in 2007. Several samples of 2 cm × 1 cm × 1 cm were prepared and grouped at intervals of 3 cm from the surface. The total number of samples in each group depended on the height of the block within the selected zone. This variation implied that, for SS-TA, extreme values were excluded from the calculation, and a total of six samples for depth and zone were kept, as recommended in the standard. SS-BA-0 comprised six samples, and SS-BA-3 had only four samples due to insufficient material. Additionally, two samples of fresh stone used for the replacement were also quantified.
2.3.3. Water Vapor Sorption
Water vapor sorption isotherms (WVSI) were determined during the second analysis campaign in 2023 for the three solid samples SS-0, SS-3, and SS-6. The samples were dried in an oven at 40 °C for 24 h and then degassed under air vacuum to complete the drying. Then, the dry mass was obtained through weighing. The Belsorp aqua-3® device was used to perform the measurements. The used device method is manometric [65,66], and it reaches its technical limit at 95% relative humidity. It is based on the calculation of the quantity of adsorbed water by the acquisition of the vapor pressures and uses the perfect gases formula. Samples analyzed were of 10 mm in length, 5 mm in width, and 3 mm in thickness. The stabilization time was fixed at t = 500 s.
2.3.4. Mercury Intrusion Porosimetry
Porosity information was obtained in 2023 using mercury intrusion porosimetry analysis. The device was a Micromeritics Autopore IV 9500, with mercury injection pressures that ranged from 0.004 to 228 MPa, giving corresponding pore access radii of 180 to 0.003 μm, respectively. The porosity and pore distribution were conducted on the three samples, SS-0 on the top of the alveolar surface, and the other two from 3 and 6 cm depth, respectively (SS-3, SS-6).
2.3.5. X-ray Diffraction (XRD)
The mineralogy of the stone and alteration products was examined in 2023 using X-ray diffraction (XRD). The device was a BRUKER D2 equipped with a LYNXEYE XE-T detector at GEGENAA (Reims, France). In total, five samples were prepared, grinding them into powder form for evaluation. This included the three samples from the solid slice at different depths (SS-0, SS-3, and SS-6), as well as granular detritus from the two alveolar cavities (SS-P1, SS-P2).
2.3.6. X-ray Fluorescence (XRF)
The chemical quantification was measured in 2023 at GEGENAA (Reims, France) with a Thermo Scientific Niton XL3t 980 portable X-ray fluorescence analyzer with a geometrically optimized large area drift detector (GOLDD+) energy-dispersive XRF (EDXRF). The analyzer works up to 50 kV and 40 μA. The calculation of elemental concentrations was made from the “Test All Geo” integrated algorithm specific for stone materials. The samples were the same five powders prepared for XRD analysis.
2.3.7. Ion Chromatography (IC)
Anion analysis was conducted in 2023 to determine the salt-related ion content in the five samples. The samples were powdered, brought into solution in 1 mL of ultrapure water, agitated during 12 h, and centrifuged at 13,400 rpm for 10 min. The liquid phase was collected, and the process was repeated once to dissolve all the anions. The quantity of chlorides Cl−, nitrates NO3−, and sulfates SO24− was measured with a Dionex ICS 2000 liquid chromatograph fitted with a pump, an eluent generator (EGC III) with a potassium hydroxide (KOH) cartridge, an AS50 injector, and a DS6 conductivity cell at GEGENAA (Reims, France). The separation of anions was performed on a 2-mm Dionex IonPac AS17 column coupled to a 2-mm Dionex ASRS 300 suppressor. Instrument control and data acquisition were performed using Chromeleon 6.2® software. The samples were the same five powders prepared for XRD.
2.3.8. Inductively Coupled Plasma–Atomic Emission Spectroscopy (ICP-AES)
In 2023, the concentrations of cations present in the five samples were measured using inductively coupled plasma–atomic emission spectrometry at GEGENAA (Reims, France) (ICP-AES, Iris Advantage, Thermo Fisher Scientific). The analysis was conducted through three measurements of 10 mL of each solution. The samples were the same five powders prepared for XRD analysis.
2.3.9. Thermogravimetric Analysis (TGA)
Mass variation during heating was measured using TGA/DTA. The main purpose of this analysis was to determine the presence of gypsum and its original state of hydration. The device was a SETSYS Evolution 1750 with the software SETSOFT2000, located at LaSIE laboratory (La Rochelle, France). Three samples were analyzed, the two powders recovered from the surface (SS-P1, SS-P2) and the sample from the surface (SS-0) transformed into powder for this analysis.
Gypsum dehydration shows two endothermic processes. The first between 100–150 °C is the dehydration of calcium sulfate dihydrate or gypsum to calcium sulfate hemihydrate or bassanite. The second reaction takes place between 150 and 250 °C and is the complete dehydration to anhydrite [67,68,69]. Another structural change takes place at much higher temperatures but is not of interest for this study. The exact temperature at which these dehydration reactions take place depends on the experimental conditions, the physical properties such as the composition and the microstructure of the investigated gypsum, and the presence of other compounds or impurities in the studied sample [67,69].
The heating rate was set at 10 °C and the maximal temperature to 300 °C, enough for the complete dehydration of gypsum.
2.3.10. Micro-Raman Spectroscopy (µ-RS)
Raman spectroscopy can be a very useful technique to detect mineral phases that can present several hydration phases, as in this study, gypsum. µ-RS analysis was performed at LaSIE (La Rochelle, France), at room temperature using a Jobin Yvon High Resolution Raman spectrometer (LabRam HR) equipped with a confocal microscope and a Peltier-based cooled charge-coupled device (CCD) detector. The used laser source for most of the analyses was of 785 nm. The acquisition time was generally equal to 30 s, enough to detect the presence or absence of salts. The samples analyzed were the two granular samples (SS-P1, SS-P2).
2.3.11. Chloride Titration
The evolution of chloride concentration inside the stone was also determined using the method known as chloride titration. Precisely weighed 5 g of stone powder was placed in a beaker and then 50 milliliters of distilled water added. This first solution was stirred for 2 min using a magnetic stirrer. Then, 100 mL of a solution containing 80% distilled water and 20% nitric acid HNO3 was also added to the initial solution. This second solution was heated slowly while using the magnetic stirrer again for 30 min, and posteriorly cooled down freely for 5 min. This solution was filtered using a funnel containing a filter paper and transferred into a 250 mL volumetric flask. The filter was rinsed with deionized water, and this water was also added to the already filtered solution up to the 250 mL mark. The determination of chloride (Cl−) concentrations using the titration station was completed by combining potentiometric titration and volumetric Karl Fischer titration, utilizing the full functionalities of both titrators on a single analysis station. The results were obtained in terms of the mass fraction of CaCO3 in the stone. Samples every 1 cm in depth were prepared and measured in 2007, from TA and BA zones. Depending on the material, for TA zones, there are up to seven samples while for BA zones up to three.
2.3.12. Scanning Electron Microscopy and Energy-Dispersive X-ray Spectroscopy (ESEM/SEM + EDX)
General images of the solid samples were captured with an SEM HITACHI TM-1000 at GEGENAA (Reims, France) and high details of the powdered samples with a Philips-FEI-Quanta 200 ESEM/FEG at La Rochelle University (La Rochelle, France). Elementary composition was determined and eventually mapped with EDX. Additionally, a detailed study of the salt elements’ distribution with depth was conducted. In 2007, samples every cm from the surface were prepared and analyzed using EDX.
3. Results
3.1. Petrographic Description
Crazannes limestone, also known as Crazannes sparite, is mainly composed of sparry calcite cement [27]. Micrite is also observed between bigger crystals (Figure 3a,b). The sample from the surface (SS-0) clearly shows calcite crystals within a darker matrix, which can be initially micrite combined with weathering products. In the sample from depth SS-3, the polarized tonalities revealed different sizes, even very small, of calcite crystals and micrite counts with a lower proportion due to the lower exposure to the weathering. The two samples showed a similar accessory proportion of round or oval quartz grains, as well as scarce fossils such as Lamellibranches or Bryozoa (Figure 3a).
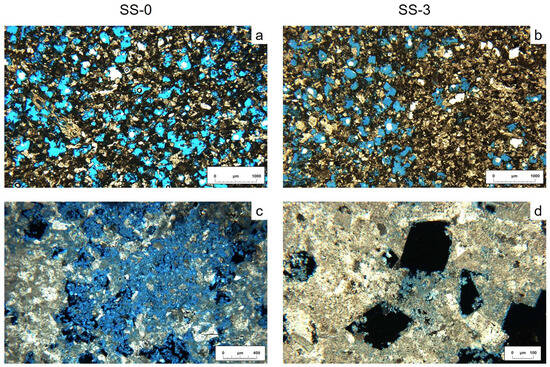
Figure 3.
Crazannes limestone observed with a polarizing microscope. The samples were permeated with blue resin to for pore quantification. (a) Sample SS-0 shows calcite crystals, dark areas of micrite or altered zones, and homogeneous repartition of porosity; (b) sample SS-3, with a higher proportion of bigger and cleaner crystals and a heterogeneous repartition of porosity due to cemented areas; (c) sample SS-0, pore filled by salt crystals; (d) sample SS-3, geometric pores formed by dissolution. Salt crystals can be observed with blue tonalities on the pore edges.
The blue resin allowed image analysis for porosity identification and quantification. White spots corresponded to closed porosity and bubbles from trapped resin. In a general view, there is already a remarkable difference between the two samples, with more blue areas and homogeneous repartition in the surface sample SS-0 than in the SS-3, with cemented areas (Figure 3a,b). In SS-0, an open porosity of 20% ± 0.5% was detected on the image (accessible to the blue resin), while we measured a closed porosity of only 0.2% ± 0.02%. In SS-3, the area of blue resin is visually smaller, with a result from the image analysis quantification of 17% ± 0.5%. In this case, the closed porosity is higher, with a 4.5% ± 0.2%. Thus, image analysis gives similar values for both samples, with around 20%–22% of total porosity.
The pores predominantly exhibit an intergranular nature, often possessing a geometric morphology, occasionally even displaying a rhombohedral shape, indicating a dissolution process (Figure 3d). The pore sizes demonstrate a considerable degree of uniformity, with average diameters measuring around 200 µm, although the recorded measurements range from 50 to 1000 µm. In certain instances, the dissolution creates pathways between multiple crystals, resulting in larger pores that are discernible to the naked eye. Along the edges of these pores, small transparent crystals are evident, corresponding to salt precipitates. These salts have partially filled the pores in SS-0 (Figure 3c). In SS-3, small crystals can be observed exclusively at the very edge, and only in a few cases does the crystallization continue into the interior of the pores (Figure 3d). As the salts are transparent, the blue resin is observed through them; consequently, they were included as part of the pore count in the image analysis. As a result, it is likely that the porosity of SS-0 is lower than what is calculated by this method. Additionally, in some fossils, intragranular porosity has also been observed.
3.2. Water Porosity
Figure 4 presents the mean porosity and standard deviation of the samples categorized based on the sampling area (TA or BA) and depth from the surface. Concurrently, fresh stones obtained from the replacement blocks were also subjected to testing.
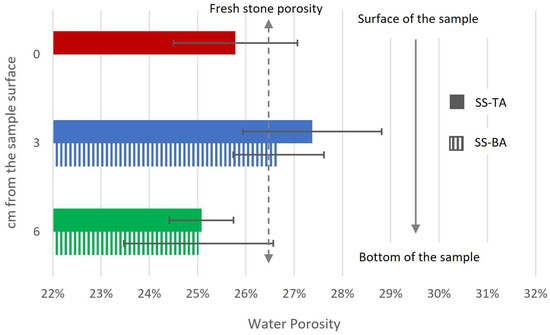
Figure 4.
Mean and standard deviation of porosity obtained by water absorption. Dark colors correspond to top alveoli samples, and lighter colors to the bottom alveoli samples. The dotted line represents the porosity of the fresh stones. Six samples were used for all the tests except for SS-BA-3, for which only four samples could be prepared.
The Crazannes limestone displayed a water porosity of 26.4% ± 0.9% for the fresh stones. As for the samples derived from the weathered blocks of Saint Sauveur, the water absorption exhibited negligible variations between them, with porosity values ranging between 25% and 27%. Notably, no discernible trend was observed with respect to depth, likely owing to the significant deviation observed among the samples.
3.3. Water Vapor Sorption Isotherms
The sorption–desorption isotherms obtained clearly demonstrate a distinction between the surface sample and the two samples taken from different depths (Figure 5). The internal samples, SS-3 and SS-6, exhibit lower water vapor adsorption, with values around 2 wt% at 95% RH, whereas the surface sample, SS-0, reaches over 4 wt% at 95% RH. The hysteresis observed in the three isotherms during desorption is generally assumed to be produced by an ‘ink-bottle-effect’, where moisture gets trapped inside large pores surrounded by smaller pores. This hysteresis is remarkable for the surface sample.
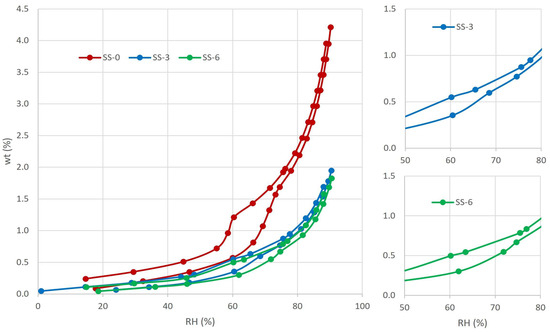
Figure 5.
Water vapor adsorption isotherms for weathered Crazannes limestone at different depths. SS-0 showed a pore blockage, evidenced by the marked hysteresis. In SS-3 and SS-6, water vapor circulates easily.
The three isotherms can be classified as a combination of type III and V [70]. The measures are defined by a lack of inflection at the beginning of the test that indicated an extremely weak interaction between the adsorbate and the adsorbent, a characteristic shared by type III and V isotherms. In agreement with the type V, the shape of the measured isotherms shows a slow increase at low relative pressures, indicating poorly developed micropores (<2 nm), followed by a sharp rise that reveals the presence of numerous mesopores (2–50 nm). Around 70%–75% RH, there is an inflexion point, leading to a new behavior resembling type III. At high RH%, and in accordance with the studied material, which indicated that the adsorbed molecules cluster around the most favorable sites on the surface of the macroporous solid. For the Crazannes limestone, the first weak slope indicated the creation of a water molecular layer on the surface, while the steeped part can be translated as the pore filling with liquid droplets [3]. The adsorption isotherm does not stabilize at 95% and, considering visual observation and analysis, it is evident that a macroporous region (>50 nm) is present (type III), although not measurable by this technique.
During the desorption, vapor leaves the stone almost freely during the first decreases of RH. From 95% to around 70%, the three samples showed a weak hysteresis type H3 [70], indicating that the pore network consists of macropores which are not completely filled with pore condensate. Sample SS-3 showed the beginning of a more marked hysteresis around 65% and SS-6 a bit before, around 75%. The sample SS-0 from the surface exhibits a stronger loop although with similar shape than the rest of the samples. According to the classification IUPAC [70], the shape could correspond to H2b or H5. Hysteresis loops of Type H2 are given by more complex pore structures in which network effects are important. The H2b loop is associated with pore blocking, but the size distribution of neck widths is large. The type H5 loop is associated with pore structures containing both open and partially blocked mesopores. Labani et al. (2013) [71] relate the hysteresis shape with the pore shape. According to them, the determined hysteresis for the studied material could correspond to a type B/E. The hysteresis of Type B is wide, and the desorption curve is steeper than that of the adsorption branch. These samples have various distributions of pore types and pore diameter, which usually happen to slit-like pores and two parallel-plate cracks. Type E shows an inflection point with a sudden drop of desorption branch associated with bottleneck pores.
3.4. Pore Size Distribution by Mercury Intrusion Porosimetry
Porosity and pore size distribution obtained by mercury intrusion porosimetry are shown in Table 2. One noteworthy observation is the disparity between the weathered surface sample SS-0 and the samples taken from deeper depths, SS-3 and SS-6. The porosity determined by this technique was lower in the surface samples, with values around 16%. However, as the samples go deeper, porosity increases to values exceeding 20%.
Table 2.
Porosity and pore size distribution obtained with mercury intrusion porosimetry. P (%): porosity accessible to mercury; * results from [27].
Regarding the pore size distribution (Figure 6), it can be observed that the depth samples showed peaks of porosity in the larger pores over 5 µm, which are absent in the surface sample. Calculations provide that the SS-0 sample has a porosity over 5 µm slightly exceeding 25%, whereas the interior samples demonstrate values closer to 50% of the measured porosity (Table 2).

Figure 6.
Pore size distribution obtained with mercury intrusion porosimetry, showing pore clogging in inner samples.
A further categorization was performed to facilitate a comparison with the results obtained by Cardell et al. (2003) [27], based on pore size ranges: over 10 µm, between 10–0.1 µm, and under 0.1 µm (Table 2). These groups reveal that a significant amount, ranging from approximately 70%–85% of the porosity of Crazannes, falls within the 0.1–10 µm interval. The surface samples (SS-0, CR-1, CR-M5) showed a lower quantity of pores over 10% in relation to the samples from deeper areas. Nevertheless, the differences between SS-3 and SS-6 do not allow for a conclusive statement regarding this variation.
The category under 0.1 µm was created to differentiate the fluid flow driven by capillary forces or by adsorption. In this case, all the samples from Saint Sauveur Church presented values around 5%, while the fresh sample from the quarry (CR-1) displayed values close to 12%. This difference could potentially be attributed to facies variation.
3.5. X-ray Diffraction
The diffraction patterns of the five samples, three prepared from the solid slice and two from the powder, are presented in Figure 7. Differences can be observed between the samples prepared from the rock (SS-0, SS-3 and SS-6) and the weathering products (SS-P1, SS-P2). All the samples showed a predominantly calcitic composition, with a small amount of halite present. Peaks appearing around 31–32° and 57° can indeed be attributed to halite, although variations in intensity and additional smaller peaks could correspond to gypsum or calcite. The powder recovered from the alveoli showed quartz and gypsum, with characteristic and distinct peaks for each mineral. The mineralogy of the powder samples (SS-P1, SS-P2) is comparable, and in both cases, the calcite peaks exhibit a slight shift toward the left in comparison to the samples from the stone. According to the database, these peaks fit well with calcite compositions containing around 3%–4% magnesium.
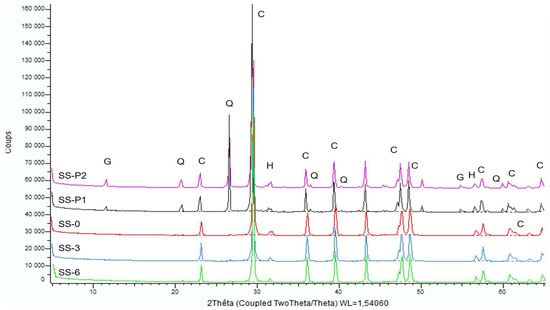
Figure 7.
X-ray diffraction patterns from the five analyzed samples. G: gypsum; Q: quartz; C: calcite; H: halite.
3.6. X-ray Fluorescence
The result of the analysis of the main elements involved in this study is shown in Table 3. Except for strontium, which is inherently present in the limestone formation, all elements exhibited higher concentrations in the powdered samples compared to the solid stone blocks. Chlorine, sulfur, and potassium, salt-forming minerals, displayed notably higher levels in the powdered samples. From the sliced block, the surface samples exhibited higher proportions of these elements compared to the samples obtained from deeper areas, with chlorine levels reaching twice as high and sulfur levels reaching up to five times higher. Silicon and iron are also ten and five times higher, respectively, in the samples of weathering grains than those prepared from the stone.
Table 3.
XRF results of the main elements involved in this study for the five samples of Crazannes limestone. Units expressed in mg/g.
3.7. Ion Chromatography and ICP-AES
The results of the ionic analyses conducted using ion chromatography (IC) and inductively coupled plasma (ICP-AES) are presented in Table 4, alongside the results from the study by Cardell et al., 2003 [27]. Calcium is also included in the table, although it cannot be directly compared, as it originates from the stone itself.
Table 4.
Chemical results of the main elements involved in this study for the five samples of Crazannes limestone expressed in mg/g.
The two samples derived from weathering processes (SS-P1 and SS-P2) exhibited elevated values of all salt-forming elements, with SS-P2 showing higher concentrations of chlorine and nitrates, while SS-P1 displayed higher levels of sulfate.
The surface sample (SS-0) displayed high chlorine concentrations, and the values of other elements fell between the values observed in the powdered samples and those obtained from the interior of the stone. Nitrates, in particular, exhibited similar levels across all samples from the stone slice, and sulfur dioxide (SO2) was not detectable within the stone (SS-3 and SS-6). A comparison with the results reported by Cardell reveals that the fresh stone (CR-1, CR-4) exhibited very low concentrations of all the elements considered in the analysis. Notably, the sample obtained from Saint Sauveur Church (CR-M5) displayed abnormal concentrations of SO2, indicating a potential accumulation of gypsum.
3.8. Thermogravimetric Analysis
Figure 8a,b presents the outcomes of the thermogravimetric analysis (TGA) in terms of absolute and differential mass loss, respectively. Despite the similar trend of the two dehydration processes observed in the three samples, there were variations in their intensity. The initial peak, occurring around 110 °C, involves the release of bound water, which can even be detected at temperatures as low as 85 °C [68]. Additionally, gypsum dehydration to bassanite can appear at temperatures as low as 105–107 °C [69]. The sample SS-P2 displayed a higher mass loss at this temperature, potentially due to a higher water content or a previous partial dehydration of sample SS-P1. The second peak, observed at 150 °C–160 °C, signifies the transition to anhydrite and represents complete dehydration. Interestingly, both samples SS-P1 and SS-P2 exhibited similar mass loss during complete dehydration, confirming the differences in water content prior to the test. The surface sample SS-0 showed also both peaks although with very weak intensity (only in Figure 8b) that indicated the low proportion of gypsum on the sample.
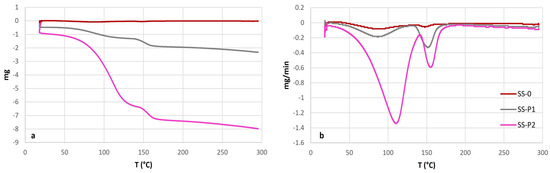
Figure 8.
(a) TGA and (b) DTA results of powder from alveoli and the surface sample. Gypsum peaks of dehydration are visible on the three samples, although much more pronounced in the alteration products.
3.9. Micro Raman Spectrometry
The objective of this analysis was to identify the presence of gypsum in the powdered samples and determine its hydration state based on the characteristic peaks associated with specific water molecules. The majority of observed grains were identified as calcite, exhibiting characteristic peaks at 155, 280, 712, and 1086 cm−1, as documented in the RRUFF database. Although gypsum crystals were rare, their analysis confirmed the presence of the dehydrated phase, corresponding to gypsum crystals. The peaks observed at 413, 492, and 1008 cm−1 provided further confirmation of the presence of this mineral.
3.10. Chloride Titration
The progression of chlorine penetration within the specimens is depicted in Figure 9. Across all samples, whether sourced from the upper or lower regions of the alveoli, the surface exhibits a higher chlorine concentration compared to the inner layers. In the initial samples, analyzed at approximately 0.5 cm from the surface, consistently elevated values were observed, ranging from 2 to 2.5 times greater than those found in the samples at 1.5 cm depth. The deeper samples exhibited relatively constant values akin to those at 1.5 cm.

Figure 9.
Chloride distribution in depth of Crazannes samples. The first analyzed sample had the highest concentration, independently of the position, which is the top (red color, surface at 0.5 cm) or bottom (blue color, surface at 3.5 cm from TA surface) of the alveoli. The second analyzed sample, at approximately 1.5 cm from the surface, revealed lower concentrations that remained stable in depth.
3.11. Scanning Electron Microscopy
The direct observation through electron microscopy has provided further confirmation of the findings obtained from previous analyses. Examination of the surface sample, referred to as SS-0 and illustrated in Figure 10, has unveiled the presence of calcite crystals exhibiting varying sizes and conditions. Notably, larger crystals displaying visible signs of dissolution are frequently enveloped by smaller ones, indicating reprecipitation processes (Figure 10a). This phenomenon of calcite precipitation is also evident in Figure 10b, where the halite crystals, initially formed on or beneath the stone surface due to marine aerosol deposition during the stone’s tenure at Saint Sauveur Church, are likewise covered by diminutive calcite crystals. Furthermore, Figure 10c displays gypsum crystals with their characteristic disc and needle shapes, which were also subjected to thorough examination and analysis. Upon closer inspection of powdered samples at higher resolutions, the presence of halite in small cubic crystals and gypsum with diverse morphologies was unveiled (Figure 10d). Energy-dispersive X-ray spectroscopy (EDX) analysis verified the composition of these crystals, characterized by their high sulfur content, while also detecting the presence of chlorine in specific regions.
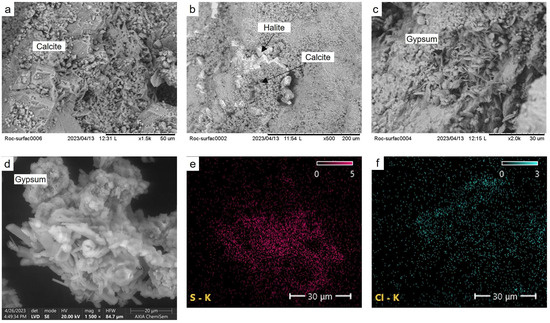
Figure 10.
SEM images and EDX analysis of samples from the surface and the recovered powder from alveoli. (a) Calcite crystals with signs of dissolution and precipitation; (b) halite crystals covered by precipitated calcite; (c) gypsum crystals on the sample surface; (d) gypsum crystal, high resolution image; (e) sulfur distribution analyzed by EDX; (f) chlorine distribution analyzed by EDX.
4. Discussion
A weathered block, affected mainly by salt crystallization and with evident alveolization, was recovered from Saint Sauveur Church (La Rochelle). Its chemical and microstructural changes were studied at different depths from the surface to the inner stone, in order to understand salt migration and the produced damage.
4.1. Microstructure Variations
The stone block corresponds to Crazannes, a microsparitic limestone consisting mainly of almost pure calcite with few fossils. The porosity is mainly intergranular, with polygonal shapes indicating crystal dissolution. Further dissolution leads to the connection between pores, promoting solution migration. However, the presence of precipitated salts within the pores and access may reduce the moisture transfer.
In terms of porosity and pore distribution in the weathered samples, it is important to note that the fresh stone has a porosity of approximately 26%, calculated through water absorption. These values do not significantly differ from those of the weathered samples, mainly due to dispersion. Measuring porosity using water absorption implies that salts clogging some pores may dissolve and migrate, clearing the pathway. Image analysis was also used to quantify porosity without considering salt crystals. Despite visual differences, with surface samples showing salt crystals filling the pores and inner stone samples exhibiting salt crystals only on the pore edges, the colored resin stained the salt, and allowed them to be quantified as pores. In this case, a slightly lower porosity was obtained, with values ranging between 20%–22% for all the samples. This small difference is attributed to the image resolution. Mercury intrusion porosimetry revealed lower values than these two techniques, since salts are not dissolved and remain filling and closing the pores, and it also revealed that macropores are not concerned by this technique contrarily to water absorption.
To determine variations in smaller pores, vapor water isotherms and mercury intrusion porosimetry techniques were employed. Both methods showed differences between the surface sample and the inner samples, attributable to a higher amount of salts within the pores and variations in the porous network due to the dissolution process. Vapor isotherms revealed a complex pore structure, with bottleneck and blocked pores, particularly prominent in the surface sample. This increased specific surface leads to a higher vapor adsorption, coupled with pronounced hysteresis, which can be explained by salt crystallization. Crystallization of certain salts such as gypsum or other sulfates and nitrates are preceded by calcite dissolution [40,41], creating an enlarged specific surface. Some salts, like chlorides, can readily dissolve and migrate at high humidity levels, precipitating during desorption and creating a new specific surface area, potentially clogging some pores. In addition, certain salts are hygroscopic and retain water molecules, resulting in hysteresis and preventing the desorption from returning to its original values [3]. Mercury intrusion porosimetry, as shown in Figure 5, clearly exhibited a reduction in porosity for the surface sample (SS-0), with approximately 16% porosity and the disappearance of a significant amount of pores with radii greater than 5 µm. The larger pores were filled with salts on the surface, as observed under the polarizing microscope. These porosity values for the weathered stone agree with those obtained by Cardell et al. (2003) [27] for the weathered sample from Saint Sauveur Church, as well as for the fresh stone.
The porous network plays a crucial role in salt susceptibility [24,58,62,72,73,74]. Salts crystallize or hydrate within the pores, leading to an increase in volume that generates pressure within the pore. If this pressure exceeds the tensile strength of the stone, cracks may develop. For Crazannes stone, the tensile strength was measured around 0.9 MPa, while crystallization pressures were calculated to range between 35.5 and 200 MPa [27]. This indicates that crystallization pressure is a significant mechanism contributing to Crazannes degradation. Limestone usually also shows a variety of textural irregularities such as stylolite, fossil cavities, or laminations, which facilitate crack development [8]. Crazannes stone, with its irregular pores resulting from dissolution, scarce fossils, and irregular crystal shapes and sizes with intergranular grain boundaries, may serve as weak points prone to crack. This may explain the low tensile strength of this stone.
For stones with similar total porosity and, in this case, with regard to pore size, smaller pores play a crucial physical role in deterioration caused by salt crystallization [3,60]. Pores smaller than 0.05–0.1 µm are critical for salt crystallization damage [74,75], although pores under 5 µm are also essential in capillary flow and the quantity of solution absorbed. Other researchers have determined critical thresholds of 1 µm [73] or 2.5 µm [76]. Specific studies considering the nature of salt have stated that pores over 10 µm have the greatest influence on NaCl crystallization, leading to flacking, while macropores can cause granular disaggregation [63]. Regardless of the damage, solution fill and salts crystallize first in larger pores, progressively moving into smaller pores until pore access may also be clogged [3,58], as observed through optical microscopy and SEM, in Crazannes limestone (Figure 3c).
Considering the significant number of pores under 5 µm in Crazannes stone, Yu and Oguchi’s susceptibility index (SSI) [74] seems to be the most appropriate measure for determining resistance to salt crystallization. Therefore, SSI was calculated by taking into account the total porosity, the percentage of pores under 5 µm, and two factors related to total porosity and pores under 0.1 µm. This index was calculated for the stone samples less affected by salts or the environment, that is, SS-3 and SS-6. The SSI values obtained were 17.6 and 23.2, respectively, indicating an “exceptionally salt prone stone” in both cases.
Furthermore, cyclic processes of volume expansion during crystallization or hydration–dissolution can result in mechanical fatigue, decreasing the required tensile strength for crack development, especially in larger pores. In the presence of water, corrosion at the tip of a preexisting crack or irregular pore edge can also accelerate subcritical crack growth, leading to stone breakage at a lower pressure than the tensile strength [61].
4.2. Mineralogy of the Crystallized Salts and Weathering Products
The stone under investigation was exposed to a coastal and urban environment, which entails the interaction of sea spray and pollutant molecules. In such environments, two salts, gypsum and halite, are expected to be present in higher proportions.
Gypsum, a hydrated calcium sulfate compound, forms as a result of the interaction between SO24− ions and calcium from the stone. The SO24− ions originate from marine sea spray and urban pollution. When combined with water and other anions, gypsum creates an acidic environment that leads to the dissolution of the stone surface, primarily affecting calcium minerals. Following the dissolution, Ca2+ cations react and result in the crystallization of gypsum, typically forming a crust [41]. Other studies have identified gypsum precipitation occurring around 1 cm below the surface [45], which is associated with detachment or flaking mechanisms. The variation in crystallization location is attributed to the petrophysical properties of the materials involved and the prevailing environmental conditions. Sulfates are characterized by low solubility, meaning that they do not migrate within the stone, and precipitation occurs exclusively on or below the surface. In this study, the analysis conducted on the different samples corroborated this observation. X-ray diffraction (XRD) confirmed the presence of gypsum only in the powdered samples collected from the stone’s alveoli. It is important to note that the blocks were initially stored intact, and the granular disaggregation from which the SS-P1 and SS-P2 powders were obtained occurred during storage. Hence, gypsum was originally present on the surface of the solid stone and subsequently persisted in the weathered material. Further evidence was provided by X-ray fluorescence (XRF), which indicated high concentrations of sulfur in both powdered samples (Table 3). Although present in lesser amounts, a higher sulfur content was also observed in the surface sample (SS-0) compared to the samples from inside the stone. The same trends were observed in the chloride ion (IC) analysis, where SO24− was not detected in the samples from inside the stone (SS-3, SS-6) (Table 4). These findings were further supported by thermogravimetric analysis (ATG and DTG), which exhibited intense peaks for the two powders and weaker ones for the surface sample.
The crystallization of gypsum is known to be a slow process [77]. However, in laboratory tests with slightly higher concentrations, gypsum crystals appeared on the surface within one day and formed a stable crust within 5 to 10 days, which remained relatively unchanged regardless of the subsequent exposure time [24,39,40,41,46,78]. The thermodynamics of gypsum, especially the transition between hydrated and dehydrated phases, are not yet fully understood. Some authors propose that gypsum formation occurs through the prior crystallization of anhydrite, where CO2 interacts with the carbonate, dissolving the calcium and enabling subsequent hydration to gypsum [9]. However, in wet and dry deposition, moisture is present, and the sulfate compounds dissolved. As evaporation occurs, the concentration increases, and gypsum precipitates first [77]. Gypsum is a highly stable salt under environmental conditions. At temperatures below 42 °C, anhydrite is the stable phase, and gypsum becomes metastable. However, the dehydration process of gypsum is very slow and does not always occur in monuments [77]. Some authors [9,30] have found both anhydrite and gypsum in the analysis of weathered stones exposed to the environment for several years. However, in the analysis of Saint Sauveur Church, no trace of this transformation was found. Raman spectra confirmed the presence of the dihydrate calcium sulfate phase, and thermogravimetric analysis (TGA) showed two slopes corresponding to the two steps of gypsum dehydration [67,68,69,77]. The temperature at which these processes occur in TGA analysis can vary depending on numerous factors. In this study, both slopes were observed at the lower limits, which can be easily explained by the presence of other salts in the sample, particularly chlorides. Chlorides accelerate dehydration due to the lower water vapor pressure of these solutions [69,77]. Another explanation is the possibility that some water molecules from the surface have already been lost, especially in poor crystallized structures [77], as dehydration is a progressive process [79]. This may have also accelerated the transformations without affecting the overall structure.
Nitrates are compounds present in the atmosphere solely due to anthropogenic sources such as fertilizers or vehicle emissions [9,10,36,37,38,44,52]. They are known to catalyze the formation of gypsum. While reproducing and detecting nitrates in the laboratory is challenging [39,40,41,46], several studies have found different nitrates, particularly calcium and sodium, on coastal monuments as well as those located far from the coast [8,29,30]. In this study, NO3 was detected with similar concentrations throughout the stone, regardless of the depth, indicating its high solubility and facility to migrate.
Halite is the main salt present in the samples, which primarily originates from sea spray. It is a highly soluble salt capable of migrating within the stone and then returning to the surface during evaporation, crystallizing on the stone’s surface. This salt is known for forming a colorless crust on the surface of the stone. X-ray diffraction (XRD) analysis conducted on samples from various depths revealed the presence of halite in all the samples and powders, including the sample collected from a depth of 6 cm. This finding confirms the significant migration of this salt within the stone [51]. Specific analyses were also performed to determine the chlorine concentration (XRF, IC, chloride titration) with consistent results regarding the presence of chloride ions in all the samples. The concentration distribution was as follows: higher concentrations in the powders, lower content in the surface sample, and even lower concentrations in the samples from inside the stone.
As previously mentioned, chlorides are highly soluble compounds that can migrate deep into the stone. In cases of rapid evaporation, NaCl crystals may precipitate within the stone without sufficient time to migrate outward. Research by Godts et al. (2021) [80], revealed a dissolution time for NaCl of approximately 30 min, with crystallization occurring even faster. This finding aligns with the hypothesis that rapid evaporation serves as a trigger for crystallization, as suggested in the present study. The solubility of NaCl is not significantly affected by temperature variations, but small changes in humidity have a significant impact since they create convection movements that facilitate the migration of the enriched solution [81]. The threshold for NaCl crystallization as a single salt is set at RHeq = 75.5%, while in the presence of mixed ions as found in this study, the RHeq of NaCl decreases to 65.5% [18,80]. If the environmental relative humidity (RH%) is lower than RHeq, the solution migrates towards the exterior, resulting in crystallization on the stone surface [82]. However, if the RH is higher, the salt may dissolve very fast. These variations in humidity may create the crystallization–dissolution cycles that create the highest damage on the stones. Additionally, the creeping process common to these salts implies that highly concentrated solutions can spread and crystallize as efflorescence, with NaCl growth occurring at the interface between air and liquid [83], potentially leading to the clogging of surface pores [84].
4.3. Salt Crystallization Modeling
The software ECOS RUNSALT allows for a deeper understanding of the thermodynamics of well-detected salts and the crystallization of minor salts [23,49,54,55,56]. As the stone block was stored in a closed chamber, the temperature and humidity conditions were more stable compared to outdoor exposure, and the block was protected from rain events. Temperature and humidity were only measured recently, as the stored stone was not initially the focus of any further investigation. The storage room conditions may vary between 15–25 °C and 60%–75% RH in the winter and the summer, respectively. This storage room is located adjacent to a laboratory, where the temperature is similar but with RH values of 42% in the summer. Therefore, for the model, the temperature range was set between 15 °C and 25 °C and the RH% went from 40% to 98%. Thus, the interpretation of the results considers a lower RH% in the winter and the eventual possibility of the door connecting to the laboratory being open for a short time, which would create humidity circulation and also a decline in RH%.
Due to the limitations of ECOS-RUNSALT in accurately calculating compositions that include complex ions such as Ca2+ and SO24−, the software suggests removing gypsum from the equation. However, since gypsum is one of the main salts found in the analysis and its thermodynamics are crucial for understanding the deterioration of Crazannes, two separate calculations were performed [49]. Firstly, a simplified model was tested, including only Ca2+, SO24−, Na+, and Cl−. This was carried out to understand the thermodynamic parameters of the main salts present (gypsum and halite) and the sequence of their crystallization. Secondly, gypsum was removed from the equation, and the remaining ions obtained from the analysis were added to determine the complementary salts that could potentially form within the stone. According to Menendez (2017) [49], the measured ionic composition resulted in a largely positive charge balance, with a high concentration of Ca2+. Since the software does not consider CO32− ions, it was assumed that some of the Ca2+ ions originated from carbonates and bicarbonates. The ion composition was adjusted by removing excess Ca2+ ions until the charge balance reached zero.
The first calculation, which included gypsum, used two powder samples from the alveoli as well as the surface sample, as they exhibited the presence of SO24−. Stable gypsum is present until approximately 60% RH, below which anhydrite becomes the stable phase. However, it has been mentioned that the dehydration process is extremely slow under the studied conditions, and neither Raman analysis nor thermogravimetric analysis (TGA) observed any signs of dehydration. NaCl was detected in all the tested samples, with its appearance occurring from evaporation at around 62%–65% RH due to the presence of other salts, including gypsum [18,80]. Considering the dissolution time, the relatively high RH of almost 75% in the summer of 2023 could have resulted in the dissolution of NaCl.
In addition to these salts, glauberite, a mixed salt containing sodium and calcium sulfates, was identified in SS-P1. This salt crystallizes around 72% RH in SS-P1, following a similar behavior to NaCl. The absence of this salt in the other powder sample indicates that its occurrence is not common. However, with an excess of sulfur and chlorine, and if Ca dissolution and Na concentration are sufficiently high, its occurrence becomes possible based on the thermodynamic conditions.
If gypsum is excluded from the input conditions, the presence of sulfur and calcium may still be observed in small quantities. NaCl is consistently present across all the samples. The two powder samples exhibited distinct salt compositions. SS-P1 contained an abundance of nitrates and sulfates, including various hydrated magnesium sulfates, blödite (a sodium and magnesium sulfate), niter, and NaNO3. All of these salts were found to crystallize at RH levels above 40%. On the other hand, SS-P2 displayed a high concentration of chlorides, with carnallite being the predominant salt that precipitated at RH levels exceeding 40%. The samples collected from the solid block exhibited minoritary salts similar to those in SS-P2, indicating a chloride-rich composition. In addition to NaCl, carnallite was also present at all three depths and crystallized at RH levels above 40%. Niter, as evidence of nitrate migration, was detected in the two deepest samples, SS-3 and SS-6.
4.4. Origin of the Salts
Crazannes stone was exposed to saline aerosols and atmospheric pollutants. In order to discern the salt origin, enrichment factors (EFs) [32] can be calculated regarding the seawater composition. The most common calculation is to compare the ions to Na+, common in seawater [27]. Thus, values close to unity indicate marine origin, and over unity anthropogenic or continental enrichment.
EF soluble salt (X) = (X/Na+) soluble salt/(X/Na+) seawater.
The average composition of seawater was taken from the Naval Group Research Lab in Cherbourg and led to the following composition: Cl− = 19 g/kg, SO42− = 2.7 g/kg, HCO3− = 0.14 g/kg, Na+ = 10 g/kg, Mg2+ = 1.3 g/kg, Ca2+ = 0.41 g/kg, and K+ = 0.4 g/kg [85].
The results are expressed in Table 5.
Table 5.
EFs of the main external compounds.
The enrichment factors (EFs) have been computed for the three primary elements that may also originate from external sources, and which are not inherent to the stone’s composition. The chlorine EFs exhibit minimal values, indicating the absence of significant anthropogenic sources. Conversely, the EFs for sulfur dioxide (SO24−) in the powder and the CR-M5 sample indicate a notably high presence, suggestive of a non-marine origin. In the case of CR-M5, the elevated EF for potassium (K+) can be attributed to pigeon droppings, whereas the values for the studied samples and fresh stones slightly exceed 1 but remain comparable across all samples. The association of K+ with chlorides or nitrogen enables their facile migration within the stone, thereby accounting for the observed compositional similarities. Aluminum was not detected as a factor assimilating this potassium into feldspar or clays, while silica exhibited concentration on the surface as recrystallized quartz [27].
Figure 11 depicts a ternary diagram, providing a visual representation of the composition of the three major salt-forming anions, allowing for a comparison with the enrichment factors (EFs). The fresh stone samples CR-1 and CR-4 demonstrate an absence of nitrates in their composition, with chlorides comprising 70%–75% and sulfates comprising 25%–30% of the salts. This composition suggests a predominant influence from the marine environment and a lesser impact from anthropogenic sources. The solid samples obtained from deeper areas (SS-3 and SS-6) within Saint Sauveur Church exhibit a high concentration of chlorides and nitrates, with sulfates being scarce to non-existent. The presence of approximately 70% chlorides suggests a significant marine influence, while the occurrence of nitrates indicates a potential additional source. The solid sample taken from the surface of the block likewise displays around 70% chlorides, indicating a strong marine influence. Moreover, it exhibits a similar proportion of nitrates and sulfates, suggesting a mixture of anthropogenic and marine origins for these pollutants. The powder samples collected from the alveoli, as well as the weathered sample CR-M5 [27], exhibit varying proportions of the three compounds. However, in all cases, there are lower levels of chlorides and a higher proportion of sulfates, primarily accompanied by the presence of nitrates. These findings indicate a stronger influence from anthropogenic sources in these three samples.

Figure 11.
Ternary diagram from IC analysis with the three main anions that form salts.
4.5. Weathering of Crazannes Limestone during Storage
The specific storage conditions experienced by the Crazannes block over a span of 15 years remain unknown. However, we can infer them from the institutional location of the storage room and its associated climatic conditions. As previously mentioned, a humidity level of 75% was measured within the storage room during the summer, which could decrease to around 60 or 65% during the winter. The room occupies an area of approximately 10 m2 and contains little material apart from three large blocks of Crazannes stone. The samples, however, were not dried before storage, and the combination of evaporation and limited air circulation led to an increase in relative humidity (RH%) within the room. The adjacent room keeps its RH around 40%, and the occasional opening of the communicating door could result in a rapid decrease in RH%.
The primary hypothesis proposed to explain the severe damage observed during storage is the combined effect of different crystallization patterns involving the two main salts: halite and gypsum due to a slight variation in RH (%). Based on ECOS RUNSALT modeling, this slight variation in RH% between 60%–75% can trigger cyclic processes of crystallization–dissolution for NaCl, along with other minor salts. Therefore, it is necessary to consider at least seasonal cycles of NaCl crystallization over the course of the 15-year storage period, as well as additional isolated cycles resulting from air circulation with the adjacent room during door openings.
Figure 12 shows the process that could explain the damage produced by salt crystallization during storage. The stored blocks were removed from Saint Sauveur Church due to significant weathering, including partial surface coverage by gypsum and Na+ and Cl− probably dissolved in the stone moisture (Figure 12b). At the beginning of storage, as moisture evaporated, sulfates, chlorides, and nitrates migrated from inside the stone to its surface. Calcite easily dissolves under cold conditions, and if the solution is slightly acidic, the matrix can dissolve readily, creating new pore connections, as observed under a microscope [41]. Sulfur in combination with CO2 from the air can create an acidic environment that dissolves the carbonate, and gypsum may form slightly inside the stone, within the first few millimeters [45,78]. At room temperature and an RH% below 65%, gypsum predominantly crystallizes on the surface of the stone forming a crust and may crystallize in the narrow subsurface, creating gypsum layers (Figure 12c). Nunberg and Charola, 2001 [86], observed that even slight changes in humidity, such as 43%–55% RH over six months, can induce damage. That confirms that small humidity variations induce changes in gypsum crystallization. NaCl migrates to the surface and precipitates initially in the outer layers together with gypsum (Figure 12c). At higher RH% levels, gypsum gradually crystallizes deeper and thicker within the stone [45,78], while NaCl dissolves and migrates into the stone (Figure 12d). With a new reduction in RH%, these anions move to the surface. However, the existing gypsum crust can impede halite efflorescence due to partial pore clogging. Both gypsum and halite exert pressure on the stone primarily through crystallization [53,77,87]. Consequently, the crystallization of halite beneath the gypsum crust may generate pressure (Figure 12e).
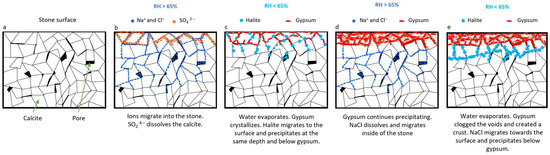
Figure 12.
Scheme of salt migration and crystallization with differences in RH (%).
The decrease in RH% within the storage room is influenced by two factors. The seasonal decrease in humidity prompts migration towards the rock surface and subsequent crystallization of chlorides beneath the crust and within the stone. Additionally, rapid evaporation due to door openings or isolated extreme climatic variations can occur, causing chlorides and nitrates to crystallize deeper within the stone due to the sudden humidity change, resulting in a new episode of pressure.
Crazannes stone possesses a microstructure that renders it highly susceptible to salt crystallization [74]. Due to its low tensile strength, alternating crystallization pressures of both salts can lead to granular disaggregation, concealed by the gypsum crust. The weathering products observed within the alveoli cavities were microspalling [81], characterized by the formation of small flakes, approximately 1mm thick, resulting from salt crystallization pressure within the smaller pores, along with powdering or granular disintegration, which is a typical alteration process in macropores [45,63,81]. Scaling and flaking caused by gypsum crystallization often exhibit a slightly powdered surface when detached [45]. Although halite and gypsum are generally not associated with significant crystallization pressure and damage [9,10,53,59,72,77], their effective stress depends not only on crystallization pressure but also on the quantity of salt crystals, determined by their distribution within the porous material, the crystallization kinetics [87], and the low strength of Crazannes limestone. Consequently, the outer weathered layer, abundant in gypsum, may become dislodged through flaking, initiating a new cycle of gypsum formation and chloride migration.
Furthermore, the slow pace of these cycles allowed the salts to crystallize in larger and more detrimental forms compared to the natural environmental cycles, resulting in significant damage.
Accelerated aging tests [2,13,45,78,81] showed damage to certain porous stones after a few cycles, which could correspond to the seasonal cyclic processes occurring within the storage room over the course of 15 years.
5. Conclusions
The main damage caused by salt crystallization is due to the repetitive cycles of state change, such as crystallization–dissolution or hydration–dehydration, depending on the types of salt present. However, severe weathering was observed in the Crazannes limestone during storage. In order to find an explanation for this decay, porosity and chemical analyses were conducted to identify the salt minerals and their distribution within the microstructure of the stone.
The chemical analyses revealed the presence of gypsum in the powdery weathered residues and on the stone surface, although not at depths exceeding 1 cm. Halite was found in all samples and throughout the rock, although with higher concentrations on the surface. The storage of the blocks in a closed room resulted in moisture evaporation and an increase in relative humidity within the room, ranging from 60% to 75%. Under these conditions, gypsum remained relatively stable, although slow crystallization within the outer layers of the stone was able to occur. The threshold for halite crystallization decreased to 65% in the presence of other salts. As a result, slight fluctuations in RH between 60% and 75% could have taken place caused by seasonal variations or human activity in the storage room, and possibly induced a few cycles of crystallization and dissolution, leading to damage. Despite gypsum and halite not being the most destructive salts since they crystallize on the stone surface, the porous distribution of Crazannes stone made it highly susceptible to salt-induced deterioration, resulting in significant damage during storage, even with minimal cycles.
The formation of a gypsum crust on the stone surface and the circulation of salt-enriched solutions within and to the surface, but behind the gypsum crust, caused damage beneath the gypsum crust. After several cycles, the pressure became sufficient to crack the crust, and the detached material fell into alveoli. This process was able to repeat over the years, as the saline solution remained trapped inside the stone and continued moving within the stone due to small humidity fluctuations. These findings could explain the observed granular disaggregation beneath the gypsum crust, which can also occur during storage conditions. Moreover, the slow pace of these supposed cycles enabled the salts to crystallize in larger and more well-defined forms compared to environmental cycles, resulting in significant damage.
The conditions of storage of weathered blocks affected by salts must be controlled if further analyses are expected. Small variations in humidity for gypsum and halite or temperature for other salts may produce a phase change and continue the cycles of crystallization–dissolution leading to an unexpected decay.
Author Contributions
Conceptualization, P.V.; methodology, P.V. and J.L.; validation, P.V. and J.L.; formal analysis, P.V. and J.L.; resources, J.L.; data curation, P.V. and J.L.; writing—original draft preparation, P.V.; writing—review and editing, P.V. and J.L. All authors have read and agreed to the published version of the manuscript.
Funding
This research received no external funding.
Data Availability Statement
Data are available by contacting the authors.
Acknowledgments
The authors acknowledge the technical support of Alexandra Guillaneuf, Julien Hubert, Ameur Hamami, Laura Michel, and Philippe Turcry.
Conflicts of Interest
The authors declare no conflict of interest.
References
- Mottershead, D.N. Rates and Patterns of Bedrock Denudation by Coastal Salt Spray Weathering: A Seven-Year Record. Earth Surf. Process. Landf. 1989, 14, 383–398. [Google Scholar] [CrossRef]
- Matsukura, Y.; Matsuoka, N. Rates of Tafoni Weathering on Uplifted Shore Platforms in Nojima-Zaki, Boso Peninsula, Japan. Earth Surf. Process. Landf. 1991, 16, 51–56. [Google Scholar] [CrossRef]
- Camuffo, D. Physical Weathering of Stones. Sci. Total Environ. 1995, 167, 1–14. [Google Scholar] [CrossRef]
- Winkler, E. Stone in Architecture: Properties, Durability; Springer Science & Business Media: Berlin/Heidelberg, Germany, 1997; ISBN 978-3-540-57626-6. [Google Scholar]
- Siegesmund, S.; Snethlage, R. Stone in Architecture: Properties, Durability; Springer: Berlin/Heidelberg, Germany, 2011; ISBN 978-3-642-14474-5. [Google Scholar]
- Freire-Lista, D.M.; Gonçalves, G.V.; Vazquez, P. Weathering Detection of Granite from Three Asynchronous Historical Quarries of Sabrosa Municipally (North Portugal). J. Cult. Herit. 2022, 58, 199–208. [Google Scholar] [CrossRef]
- Huby, E.; Thomachot-Schneider, C.; Vázquez, P.; Fronteau, G. Use of Micro-Climatic Monitoring to Assess Potential Stone Weathering on a Monument: Example of the Saint-Remi Basilica (Reims, France). Environ. Monit. Assess. 2020, 192, 796. [Google Scholar] [CrossRef]
- Zezza, F.; Macrì, F. Marine aerosol and stone decay. Sci. Total Environ. 1995, 167, 123–143. [Google Scholar] [CrossRef]
- Morillas, H.; de Mendonça Filho, F.F.; Derluyn, H.; Maguregui, M.; Grégoire, D.; Madariaga, J.M. Decay Processes in Buildings Close to the Sea Induced by Marine Aerosol: Salt Depositions inside Construction Materials. Sci. Total Environ. 2020, 721, 137687. [Google Scholar] [CrossRef]
- Morillas, H.; Maguregui, M.; Gallego-Cartagena, E.; Marcaida, I.; Carral, N.; Madariaga, J.M. The Influence of Marine Environment on the Conservation State of Built Heritage: An Overview Study. Sci. Total Environ. 2020, 745, 140899. [Google Scholar] [CrossRef]
- Goudie, A.; Cooke, R.; Evans, I. Experimental Investigation of Rock Weathering by Salts. Area 1970, 2, 42–48. [Google Scholar]
- Doehne, E. Salt Weathering: A Selective Review. Geol. Soc. Lond. Spec. Publ. 2002, 205, 51–64. [Google Scholar] [CrossRef]
- Alves, C.; Figueiredo, C.A.M.; Sanjurjo-Sánchez, J.; Hernández, A.C. Salt Weathering of Natural Stone: A Review of Comparative Laboratory Studies. Heritage 2021, 4, 1554–1565. [Google Scholar] [CrossRef]
- Oguchi, C.T.; Yu, S. A Review of Theoretical Salt Weathering Studies for Stone Heritage. Prog. Earth Planet. Sci. 2021, 8, 32. [Google Scholar] [CrossRef]
- Goudie, A.S.; Viles, H.A. (Eds.) Salt Weathering Hazard; John Wiley & Sons: Chichester, UK, 1997. [Google Scholar]
- Zehnder, K.; Arnold, A. Crystal Growth in Salt Efflorescence. J. Cryst. Growth 1989, 97, 513–521. [Google Scholar] [CrossRef]
- Moreno, F.; Vilela, S.A.G.; Antunes, Â.S.G.; Alves, C.A.S. Capillary-Rising Salt Pollution and Granitic Stone Erosive Decay in the Parish Church of Torre de Moncorvo (NE Portugal)-Implications for Conservation Strategy. J. Cult. Herit. 2006, 7, 56–66. [Google Scholar] [CrossRef]
- Godts, S.; Hayen, R.; De Clercq, H. Investigating Salt Decay of Stone Materials Related to the Environment, a Case Study in the St. James Church in Liège, Belgium. Stud. Conserv. 2017, 62, 329–342. [Google Scholar] [CrossRef]
- Gómez-Laserna, O.; Prieto-Taboada, N.; Morillas, H.; Arrizabalaga, I.; Olazabal, M.Á.; Arana, G.; Madariaga, J.M. Analytical Study to Evaluate the Origin and Severity of Damage Caused by Salt Weathering in a Historical Palace House: The Attack of Infiltration Water. Anal. Methods 2015, 7, 4608–4615. [Google Scholar] [CrossRef]
- Thomachot-Schneider, C.; Gommeaux, M.; Lelarge, N.; Conreux, A.; Mouhoubi, K.; Bodnar, J.L.; Vázquez, P. Relationship between Na2SO4 concentration and thermal response of reconstituted stone in the laboratory and on site. Environ. Earth Sci. 2016, 75, 762. [Google Scholar] [CrossRef]
- Urosevic, M.; Sebastián, E.; Cardell, C. An experimental study on the influence of surface finishing on the weathering of a building low-porous limestone in coastal environments. Eng. Geol. 2013, 154, 131–141. [Google Scholar] [CrossRef]
- Theoulakis, P.; Moropoulou, A. Salt Crystal Growth as Weathering Mechanism of Porous Stone on Historic Masonry. J. Porous Mater. 1999, 6, 345–358. [Google Scholar] [CrossRef]
- Vazquez, P.; Luque, A.; Alonso, F.J.; Grossi, C.M. Surface changes on crystalline stones due to salt crystallisation. Environ. Earth Sci. 2013, 69, 1237–1248. [Google Scholar] [CrossRef]
- Vázquez, P.; Menéndez, B.; Denecker, M.F.C.; Thomachot-Schneider, C. Comparison between Petrophysical Properties, Durability and Use of Two Limestones of the Paris Region. Geol. Soc. Lond. Spec. Publ. 2016, 416, 203–216. [Google Scholar] [CrossRef]
- Chabas, A.; Jeannette, D.; Lefèvre, R.A. Crystallization and Dissolution of Airborne Sea-Salts on Weathered Marble in a Coastal Environment at Delos (Cyclades–Greece). Atmos. Environ. 2000, 34, 219–224. [Google Scholar] [CrossRef]
- Chabas, A.; Jeannette, D. Weathering of Marbles and Granites in Marine Environment: Petrophysical Properties and Special Role of Atmospheric Salts. Environ. Geol. 2001, 40, 359–368. [Google Scholar] [CrossRef]
- Cardell, C.; Delalieux, F.; Roumpopoulos, K.; Moropoulou, A.; Auger, F.; Van Grieken, R. Salt-Induced Decay in Calcareous Stone Monuments and Buildings in a Marine Environment in SW France. Constr. Build. Mater. 2003, 17, 165–179. [Google Scholar] [CrossRef]
- Cardell, C.; Rivas, T.; Mosquera, M.J.; Birginie, J.M.; Moropoulou, A.; Prieto, B.; Silva, B.; Van Grieken, R. Patterns of Damage in Igneous and Sedimentary Rocks under Conditions Simulating Sea-Salt Weathering. Earth Surf. Process. Landf. 2003, 28, 1–14. [Google Scholar] [CrossRef]
- Morillas, H.; Maguregui, M.; García-Florentino, C.; Marcaida, I.; Madariaga, J.M. Study of Particulate Matter from Primary/Secondary Marine Aerosol and Anthropogenic Sources Collected by a Self-Made Passive Sampler for the Evaluation of the Dry Deposition Impact on Built Heritage. Sci. Total Environ. 2016, 550, 285–296. [Google Scholar] [CrossRef] [PubMed]
- Torfs, K.; Van Grieken, R. Chemical Relations between Atmospheric Aerosols, Deposition and Stone Decay Layers on Historic Buildings at the Mediterranean Coast. Atmos. Environ. 1997, 31, 2179–2192. [Google Scholar] [CrossRef]
- Morillas, H.; Vazquez, P.; Maguregui, M.; Marcaida, I.; Silva, L.F.O. Composition and Porosity Study of Original and Restoration Materials Included in a Coastal Historical Construction. Constr. Build. Mater. 2018, 178, 384–392. [Google Scholar] [CrossRef]
- Sabbioni, C. Contribution of Atmospheric Deposition to the Formation of Damage Layers. Sci. Total Environ. 1995, 167, 49–55. [Google Scholar] [CrossRef]
- Perry, S.H.; Duffy, A.P. The Short-Term Effects of Mortar Joints on Salt Movement in Stone. Atmos. Environ. 1997, 31, 1297–1305. [Google Scholar] [CrossRef]
- Lazzarini, L.; Borrelli, E.; Bouabdelli, M.; Antonelli, F. Insight into the Conservation Problems of the Stone Building “Bab Agnaou”, a XII Cent. Monumental Gate in Marrakech (Morocco). J. Cult. Herit. 2007, 8, 315–322. [Google Scholar] [CrossRef]
- Apostolopoulou, M.; Keramidas, V.; Galanaki, N.; Kalofonou, M.; Skoula, C.; Karoglou, M.; Delegou, E.T.; Mouzakis, C.; Bakolas, A.; Moropoulou, A.; et al. A Study on the Historical Materials of the Apollo Pythios Temple in Rhodes and the Evaluation of Potential Restoration Materials. Heritage 2019, 2, 988–1022. [Google Scholar] [CrossRef]
- Graue, B.; Siegesmund, S.; Oyhantcabal, P.; Naumann, R.; Licha, T.; Simon, K. The Effect of Air Pollution on Stone Decay: The Decay of the Drachenfels Trachyte in Industrial, Urban, and Rural Environments—A Case Study of the Cologne, Altenberg and Xanten Cathedrals. Environ. Earth Sci. 2013, 69, 1095–1124. [Google Scholar] [CrossRef]
- Rodriguez-Navarro, C.; Sebastian, E. Role of particulate matter from vehicle exhaust on porous building stones (limestone) sulf ation. Sci. Total Environ. 1996, 187, 79–91. [Google Scholar] [CrossRef]
- Vazquez, P.; Carrizo, L.; Thomachot-Schneider, C.; Gibeaux, S.; Alonso, F.J. Influence of surface finish and composition on the deterioration of building stones exposed to acid atmospheres. Constr. Build. Mater. 2016, 106, 392–403. [Google Scholar] [CrossRef]
- Gibeaux, S.; Martínez-Garrido, M.I.; Vázquez, P.; Thomachot-Schneider, C.; Fort, R. Wireless environmental monitoring coupled to NDT for decay risk analysis (at St. Joseph Chapel in Reims, France). Sens. Actuators A Phys. 2018, 272, 102–113. [Google Scholar] [CrossRef]
- Gibeaux, S.; Thomachot-Schneider, C.; Eyssautier-Chuine, S.; Marin, B.; Vazquez, P. Simulation of acid weathering on natural and artificial building stones according to the current atmospheric SO2/NOx rate. Environ. Earth Sci. 2018, 77, 327. [Google Scholar] [CrossRef]
- Gibeaux, S.; Vázquez, P.; De Kock, T.; Cnudde, V.; Thomachot-Schneider, C. Weathering Assessment under X-ray Tomography of Building Stones Exposed to Acid Atmospheres at Current Pollution Rate. Constr. Build. Mater. 2018, 168, 187–198. [Google Scholar] [CrossRef]
- Bonazza, A.; Brimblecombe, P.; Grossi, C.M.; Sabbioni, C. Carbon in black crusts from the Tower of London. Environ. Sci. Technol. 2007, 41, 4199–4204. [Google Scholar] [CrossRef]
- Fronteau, G.; Thomachot, C.; Mouze, D.; Pascal, A. Black crust growth processes and crust-stone interface in relation with subjacent limestone microfacies. Geophys. Res. Abstr. 2007, 9, 08227. [Google Scholar]
- Török, Á.; Licha, T.; Simon, K.; Siegesmund, S. Urban and Rural Limestone Weathering; the Contribution of Dust to Black Crust Formation. Environ. Earth Sci. 2011, 63, 675–693. [Google Scholar] [CrossRef]
- Janvier-Badosa, S.; Beck, K.; Brunetaud, X.; Al-Mukhtar, M. The Occurrence of Gypsum in the Scaling of Stones at the Castle of Chambord (France). Environ. Earth Sci. 2014, 71, 4751–4759. [Google Scholar] [CrossRef]
- Eyssautier-Chuine, S.; Marin, B.; Thomachot-Schneider, C.; Fronteau, G.; Schneider, A.; Gibeaux, S.; Vazquez, P. Simulation of Acid Rain Weathering Effect on Natural and Artificial Carbonate Stones. Environ. Earth Sci. 2016, 75, 748. [Google Scholar] [CrossRef]
- Grossi, C.M.; Brimblecombe, P.; Menéndez, B.; Benavente, D.; Harris, I.; Déqué, M. Climatology of Salt Transitions and Implications for Stone Weathering. Sci. Total Environ. 2011, 409, 2577–2585. [Google Scholar] [CrossRef]
- Menéndez, B.; Petráňová, V. Effect of Mixed vs Single Brine Composition on Salt Weathering in Porous Carbonate Building Stones for Different Environmental Conditions. Eng. Geol. 2016, 210, 124–139. [Google Scholar] [CrossRef]
- Menéndez, B. Estimators of the impact of climate change in salt weathering of cultural heritage. Geosciences 2018, 8, 401. [Google Scholar] [CrossRef]
- Filho, F.F.M.; Morillas, H.; Derluyn, H.; Maguregui, M.; Grégoire, D. In-Situ versus Laboratory Characterization of Historical Site in Marine Environment Using X-ray Fluorescence and Raman Spectroscopy. Microchem. J. 2019, 147, 905–913. [Google Scholar] [CrossRef]
- Cardell, C.; Yebra, A.; Van Grieken, R.E. Applying Digital Image Processing to SEM-EDX and BSE Images to Determine and Quantify Porosity and Salts with Depth in Porous Media. Microchim. Acta 2002, 140, 9–14. [Google Scholar] [CrossRef]
- Morillas, H.; Marcaida, I.; García-Florentino, C.; Maguregui, M.; Arana, G.; Madariaga, J.M. Micro-Raman and SEM-EDS Analyses to Evaluate the Nature of Salt Clusters Present in Secondary Marine Aerosol. Sci. Total Environ. 2018, 615, 691–697. [Google Scholar] [CrossRef]
- Derluyn, H.; Dewanckele, J.; Boone, M.N.; Cnudde, V.; Derome, D.; Carmeliet, J. Crystallization of Hydrated and Anhydrous Salts in Porous Limestone Resolved by Synchrotron X-ray Microtomography. Nucl. Instrum. Methods Phys. Res. Sect. B Beam Interact. Mater. At. 2014, 324, 102–112. [Google Scholar] [CrossRef]
- Bionda, D. RUNSALT—A Graphical User Interface to the ECOS Thermodynamic Model for the Prediction of the Behaviour of Salt Mixtures under Changing Climate Conditions. 2005. Available online: http://science.sdf-eu.org/runsalt (accessed on 1 September 2023).
- Price, C.A. (Ed.) An Expert Chemical Model for Determining the Environmental Conditions Needed to Prevent Salt Damage in Porous Materials; European Commission Research Report No. 11, (Protection and Conservation of European Cultural Heritage); Archetype Publications: London, UK, 2000. [Google Scholar]
- Godts, S.; Steiger, M.; Orr, S.A.; Stahlbuhk, A.; Desarnaud, J.; De Clercq, H.; Cnudde, V.; De Kock, T. Modeling Salt Behavior with ECOS/RUNSALT: Terminology, Methodology, Limitations, and Solutions. Heritage 2022, 5, 3648–3663. [Google Scholar] [CrossRef]
- Menéndez, B. Estimation of salt mixture damage on built cultural heritage from environmental conditions using ECOS-RUNSALT model. J. Cult. Herit. 2017, 24, 22–30. [Google Scholar] [CrossRef]
- La Iglesia, A.; González, V.; López-Acevedo, V.; Viedma, C. Salt crystallization in porous construction materials I Estimation of crystallization pressure. J. Cryst. Growth 1997, 177, 111–118. [Google Scholar] [CrossRef]
- Benavente, D.; del Cura, M.A.G.; Fort, R.; Ordóñez, S. Thermodynamic Modelling of Changes Induced by Salt Pressure Crystallisation in Porous Media of Stone. J. Cryst. Growth 1999, 204, 168–178. [Google Scholar] [CrossRef]
- Steiger, M. Crystal Growth in Porous Materials—II: Influence of Crystal Size on the Crystallization Pressure. J. Cryst. Growth 2005, 282, 470–481. [Google Scholar] [CrossRef]
- Atkinson, B.K. Subcritical crack growth in geological materials. J. Geophys. Res. Sol. Earth 1984, 89, 4077–4114. [Google Scholar] [CrossRef]
- Scherer, G.W. Crystallization in Pores. Cem. Concr. Res. 1999, 29, 1347–1358. [Google Scholar] [CrossRef]
- Galanaki, N.; Delegou, E.; Bris, T.; Moropoulou, A. Accelerated Ageing Tests of Sodium Chloride for the Evaluation of Stones Durability to Salt Crystallization: A Comparative Study of Selected Restoration Lithotypes. Dev. Built Environ. 2022, 11, 100081. [Google Scholar] [CrossRef]
- EN 1936:2007; Natural Stone Test Method. Determination of Real Density and Apparent Density, and of Total and Open Porosity. European Committee for Standardization: Bruxelles, Belgium, 1936.
- Issaadi, N.; Hamami, A.A.; Belarbi, R.; Aït-Mokhtar, A. Experimental Assessment of the Spatial Variability of Porosity, Permeability and Sorption Isotherms in an Ordinary Building Concrete. Heat Mass Transf. 2017, 53, 3037–3048. [Google Scholar] [CrossRef]
- Issaadi, N.; Nouviaire, A.; Belarbi, R.; Aït-Mokhtar, A. Moisture Characterization of Cementitious Material Properties: Assessment of Water Vapor Sorption Isotherm and Permeability Variation with Ages. Constr. Build. Mater. 2015, 83, 237–247. [Google Scholar] [CrossRef]
- Yu, Q.L.; Brouwers, H.J.H. Thermal Properties and Microstructure of Gypsum Board and Its Dehydration Products: A Theoretical and Experimental Investigation. Fire Mater. 2012, 36, 575–589. [Google Scholar] [CrossRef]
- Engbrecht, D.C.; Hirschfeld, D.A. Thermal Analysis of Calcium Sulfate Dihydrate Sources Used to Manufacture Gypsum Wallboard. Thermochim. Acta 2016, 639, 173–185. [Google Scholar] [CrossRef]
- Álvarez, M.; Ferrández, D.; Morón, C.; Atanes-Sánchez, E. Characterization of a New Lightened Gypsum-Based Material Reinforced with Fibers. Materials 2021, 14, 1203. [Google Scholar] [CrossRef] [PubMed]
- Thommes, M.; Kaneko, K.; Neimark, A.V.; Olivier, J.P.; Rodriguez-Reinoso, F.; Rouquerol, J.; Sing, K.S.W. Physisorption of Gases, with Special Reference to the Evaluation of Surface Area and Pore Size Distribution (IUPAC Technical Report). Pure Appl. Chem. 2015, 87, 1051–1069. [Google Scholar] [CrossRef]
- Labani, M.M.; Rezaee, R.; Saeedi, A.; Hinai, A.A. Evaluation of Pore Size Spectrum of Gas Shale Reservoirs Using Low Pressure Nitrogen Adsorption, Gas Expansion and Mercury Porosimetry: A Case Study from the Perth and Canning Basins, Western Australia. J. Pet. Sci. Eng. 2013, 112, 7–16. [Google Scholar] [CrossRef]
- Rodriguez-Navarro, C.; Doehne, E. Salt Weathering: Influence of Evaporation Rate, Supersaturation and Crystallization Pattern. Earth Surf. Process Landf. 1999, 24, 191–209. [Google Scholar] [CrossRef]
- Benavente, D.; del Cura, M.A.G.; García-Guinea, J.; Sánchez-Moral, S.; Ordóñez, S. Role of Pore Structure in Salt Crystallisation in Unsaturated Porous Stone. J. Cryst. Growth 2004, 260, 532–544. [Google Scholar] [CrossRef]
- Yu, S.; Oguchi, C.T. Role of Pore Size Distribution in Salt Uptake, Damage, and Predicting Salt Susceptibility of Eight Types of Japanese Building Stones. Eng. Geol. 2010, 115, 226–236. [Google Scholar] [CrossRef]
- Ordóñez, S.; Fort, R.; del Cura, M.A.G. Pore size distribution and the durability of a porous limestone. Q. J. Eng. Geol. 1997, 30, 221–230. [Google Scholar] [CrossRef]
- Fitzner, B. Porosity properties of naturally or artificially weathered sandstones. In Proceedings of the VIth International Congress on Deterioration and Conservation of Stone, Torun, Poland, 11–14 September 1988. [Google Scholar]
- Charola, A.E.; Pühringer, J.; Steiger, M. Gypsum: A Review of Its Role in the Deterioration of Building Materials. Environ. Geol. 2007, 52, 339–352. [Google Scholar] [CrossRef]
- Menéndez, B.; David, C. The Influence of Environmental Conditions on Weathering of Porous Rocks by Gypsum: A Non-Destructive Study Using Acoustic Emissions. Environ. Earth Sci. 2013, 68, 1691–1706. [Google Scholar] [CrossRef]
- Bustamante, R.; Vazquez, P.; Prendes, N. Properties of the Ignimbrites in the Architecture of the Historical Center of Arequipa, Peru. Appl. Sci. 2021, 11, 10571. [Google Scholar] [CrossRef]
- Godts, S.; Orr, S.A.; Desarnaud, J.; Steiger, M.; Wilhelm, K.; De Clercq, H.; Cnudde, V.; De Kock, T. NaCl-Related Weathering of Stone: The Importance of Kinetics and Salt Mixtures in Environmental Risk Assessment. Herit. Sci. 2021, 9, 44. [Google Scholar] [CrossRef]
- Gomez-Heras, M.; Fort, R. Patterns of Halite (NaCl) Crystallisation in Building Stone Conditioned by Laboratory Heating Regimes. Environ. Geol. 2007, 52, 259–267. [Google Scholar] [CrossRef]
- Gonçalves, T.D.; Pel, L.; Rodrigues, J.D. Drying of Salt-Contaminated Masonry: MRI Laboratory Monitoring. Environ. Geol. 2007, 52, 293–302. [Google Scholar] [CrossRef]
- Vázquez, P.; Thomachot-Schneider, C.; Mouhoubi, K.; Fronteau, G.; Gommeaux, M.; Benavente, D.; Barbin, V.; Bodnar, J.-L. Infrared Thermography Monitoring of the NaCl Crystallisation Process. Infrared Phys. Technol. 2015, 71, 198–207. [Google Scholar] [CrossRef]
- Birginie, J.-M.; Auger, F.; Brea, T.R. Changes in the Permeability to Gas of Calcareous Stone Core Samples Exposed to Salt Spray. Mater. Struct. 2000, 33, 331–337. [Google Scholar] [CrossRef]
- Refait, P.; Grolleau, A.-M.; Jeannin, M.; Rémazeilles, C.; Sabot, R. Corrosion of Carbon Steel in Marine Environments: Role of the Corrosion Product Layer. Corros. Mater. Degrad. 2020, 1, 198–218. [Google Scholar] [CrossRef]
- Nunberg, S.; Charola, A.E. Salts in ceramics bodies II: Deterioration due to minimal changes in relative humidity. Int. Z. Bauinstandsetz. Baudenkmalpflege 2001, 7, 131–146. [Google Scholar]
- Derluyn, H.; Moonen, P.; Carmeliet, J. Deformation and Damage Due to Drying-Induced Salt Crystallization in Porous Limestone. J. Mech. Phys. Solids 2014, 63, 242–255. [Google Scholar] [CrossRef]
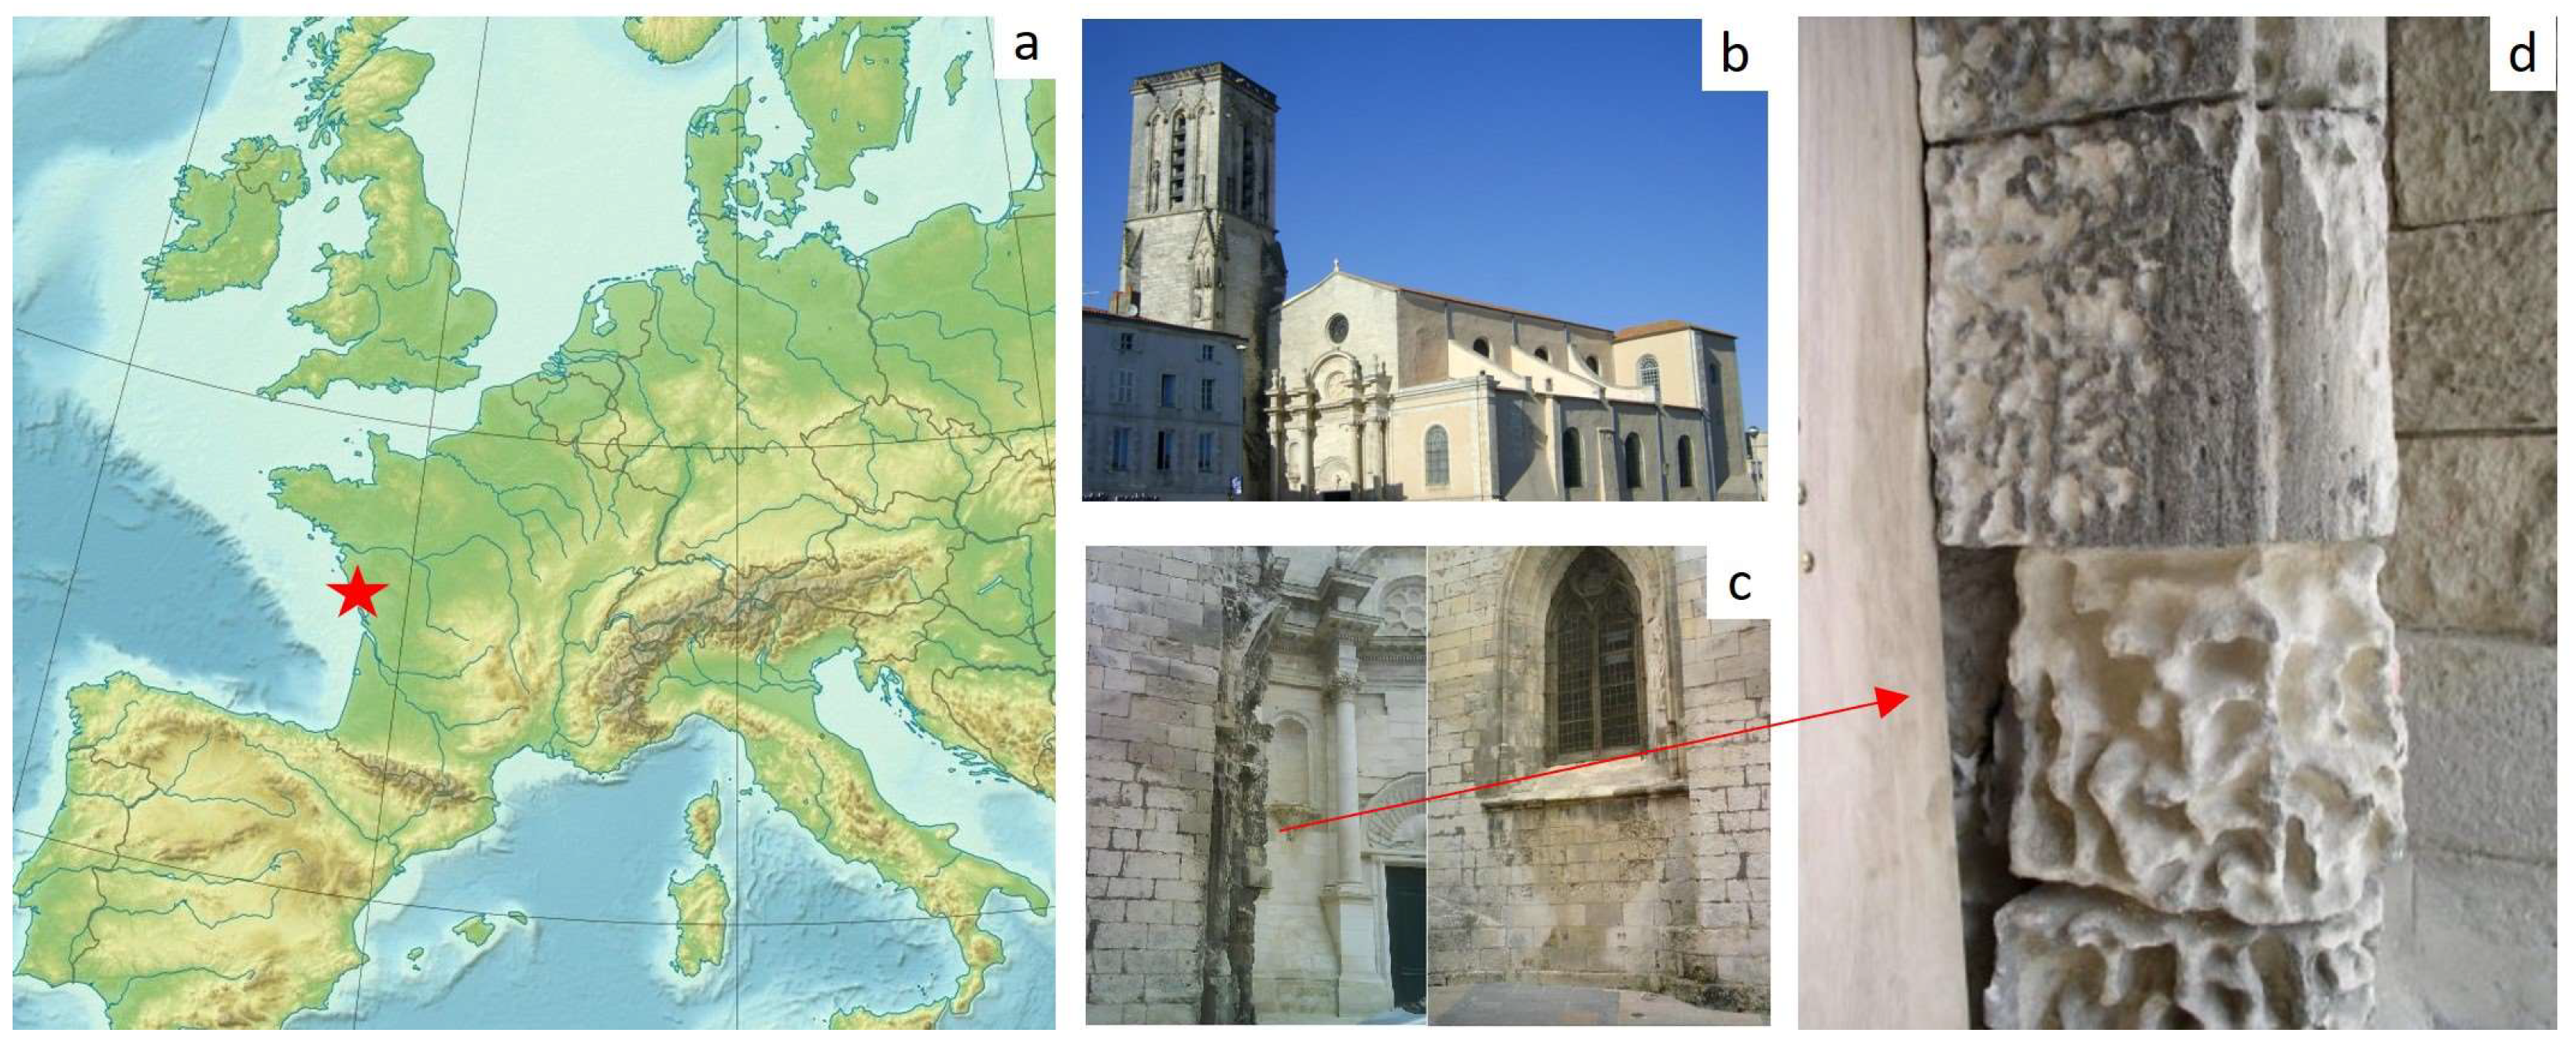
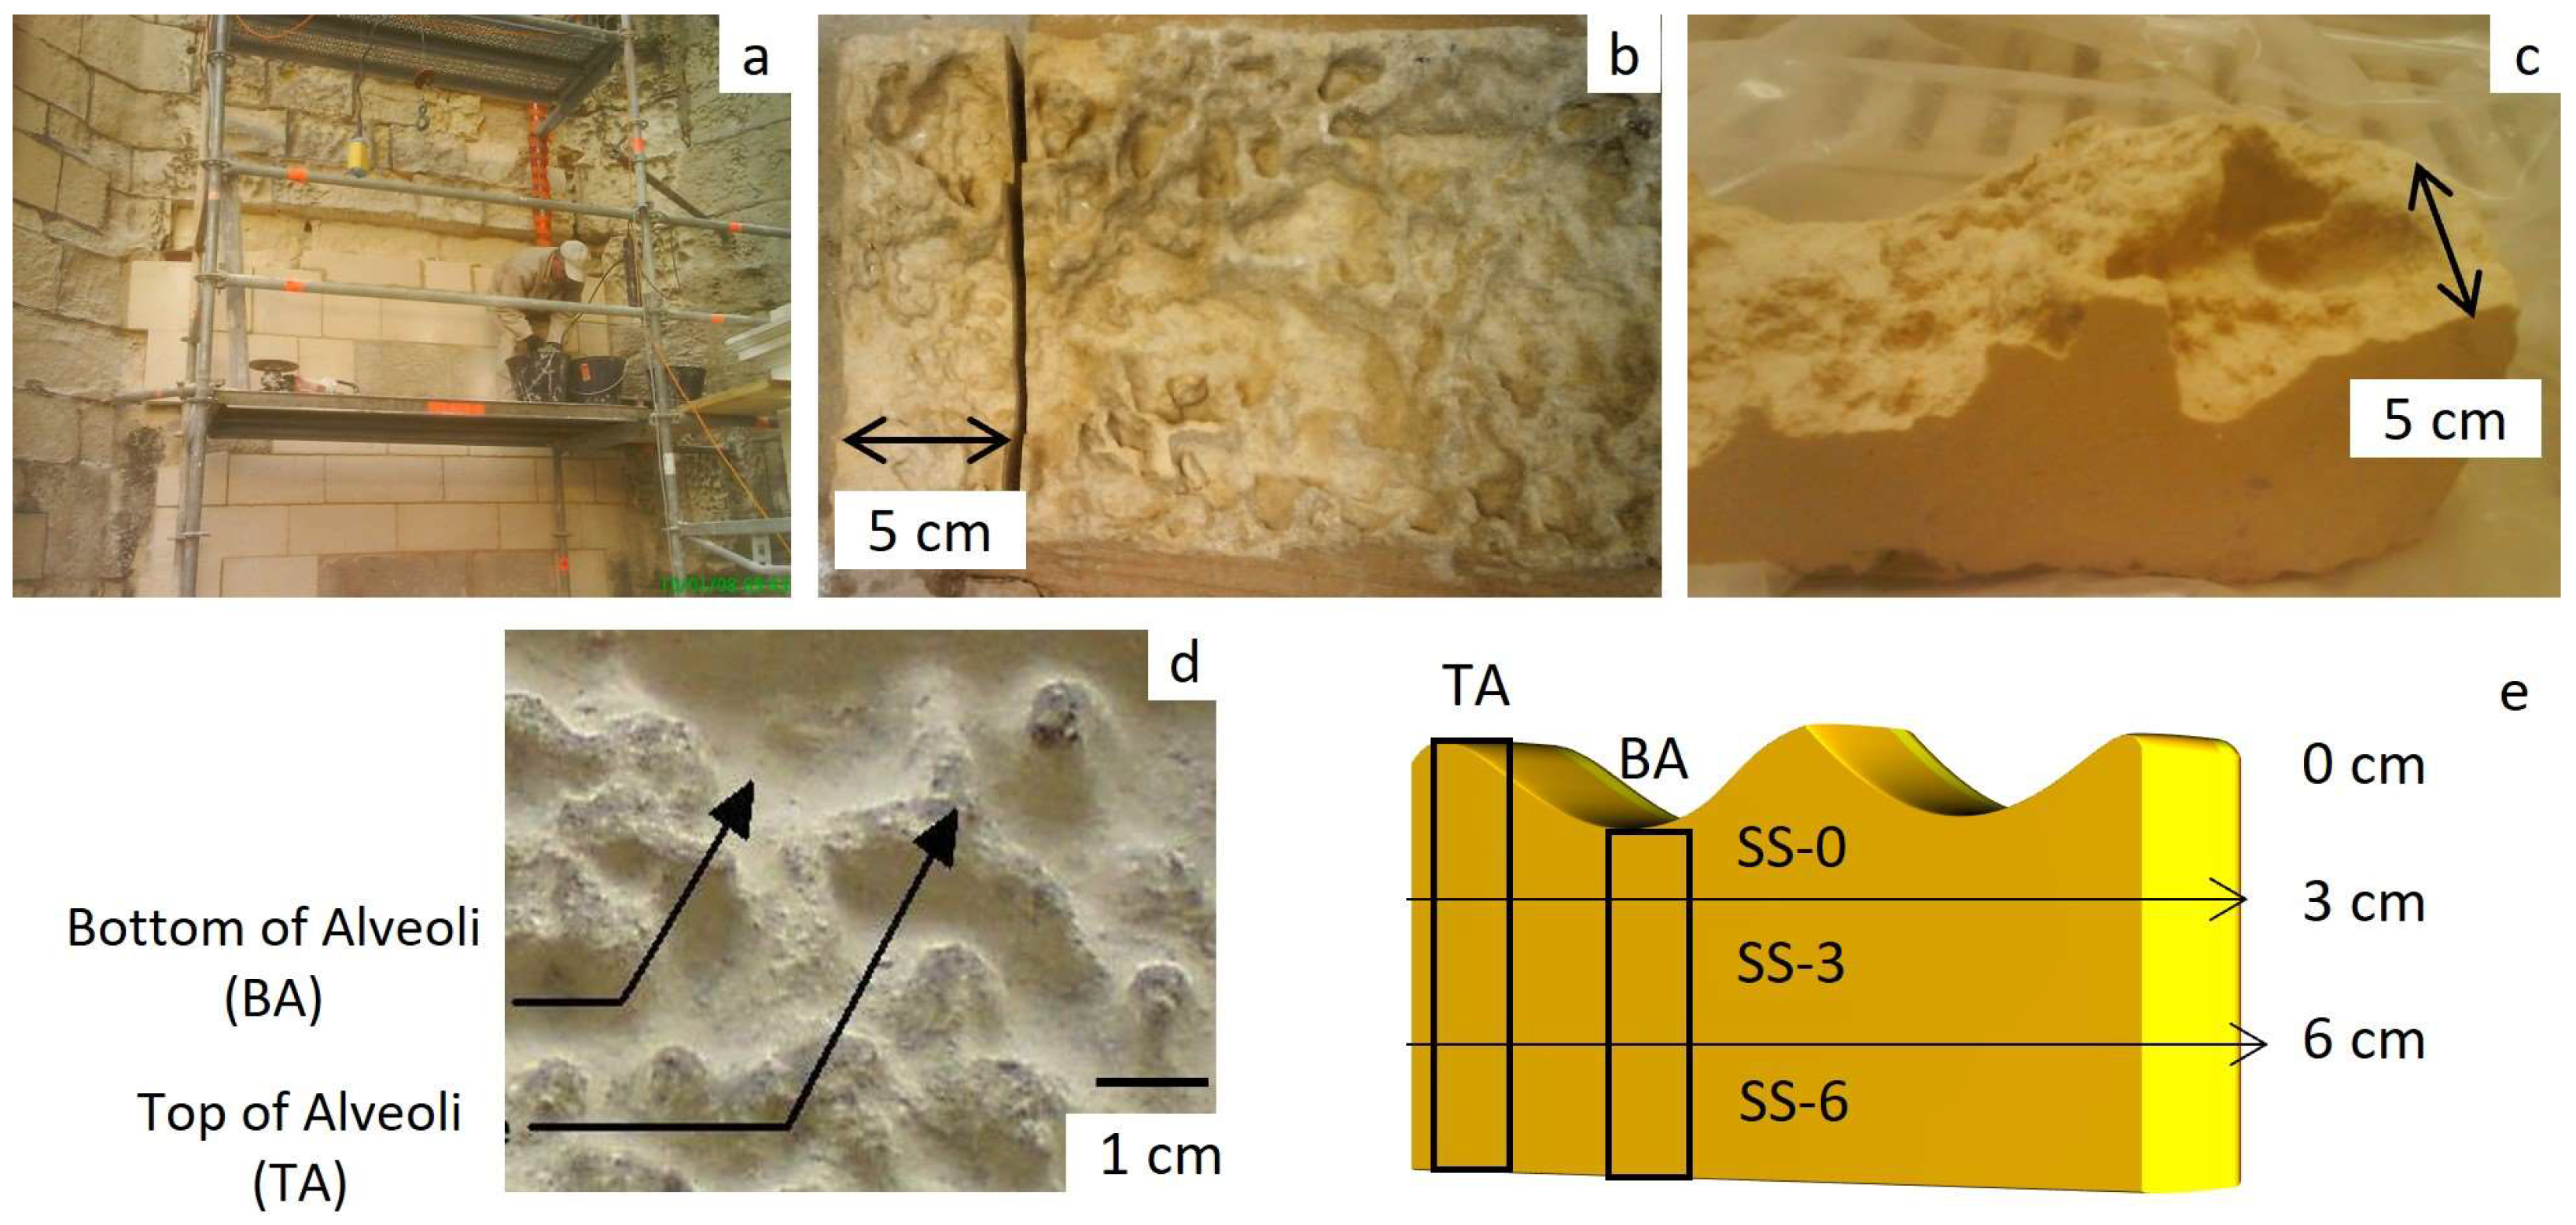
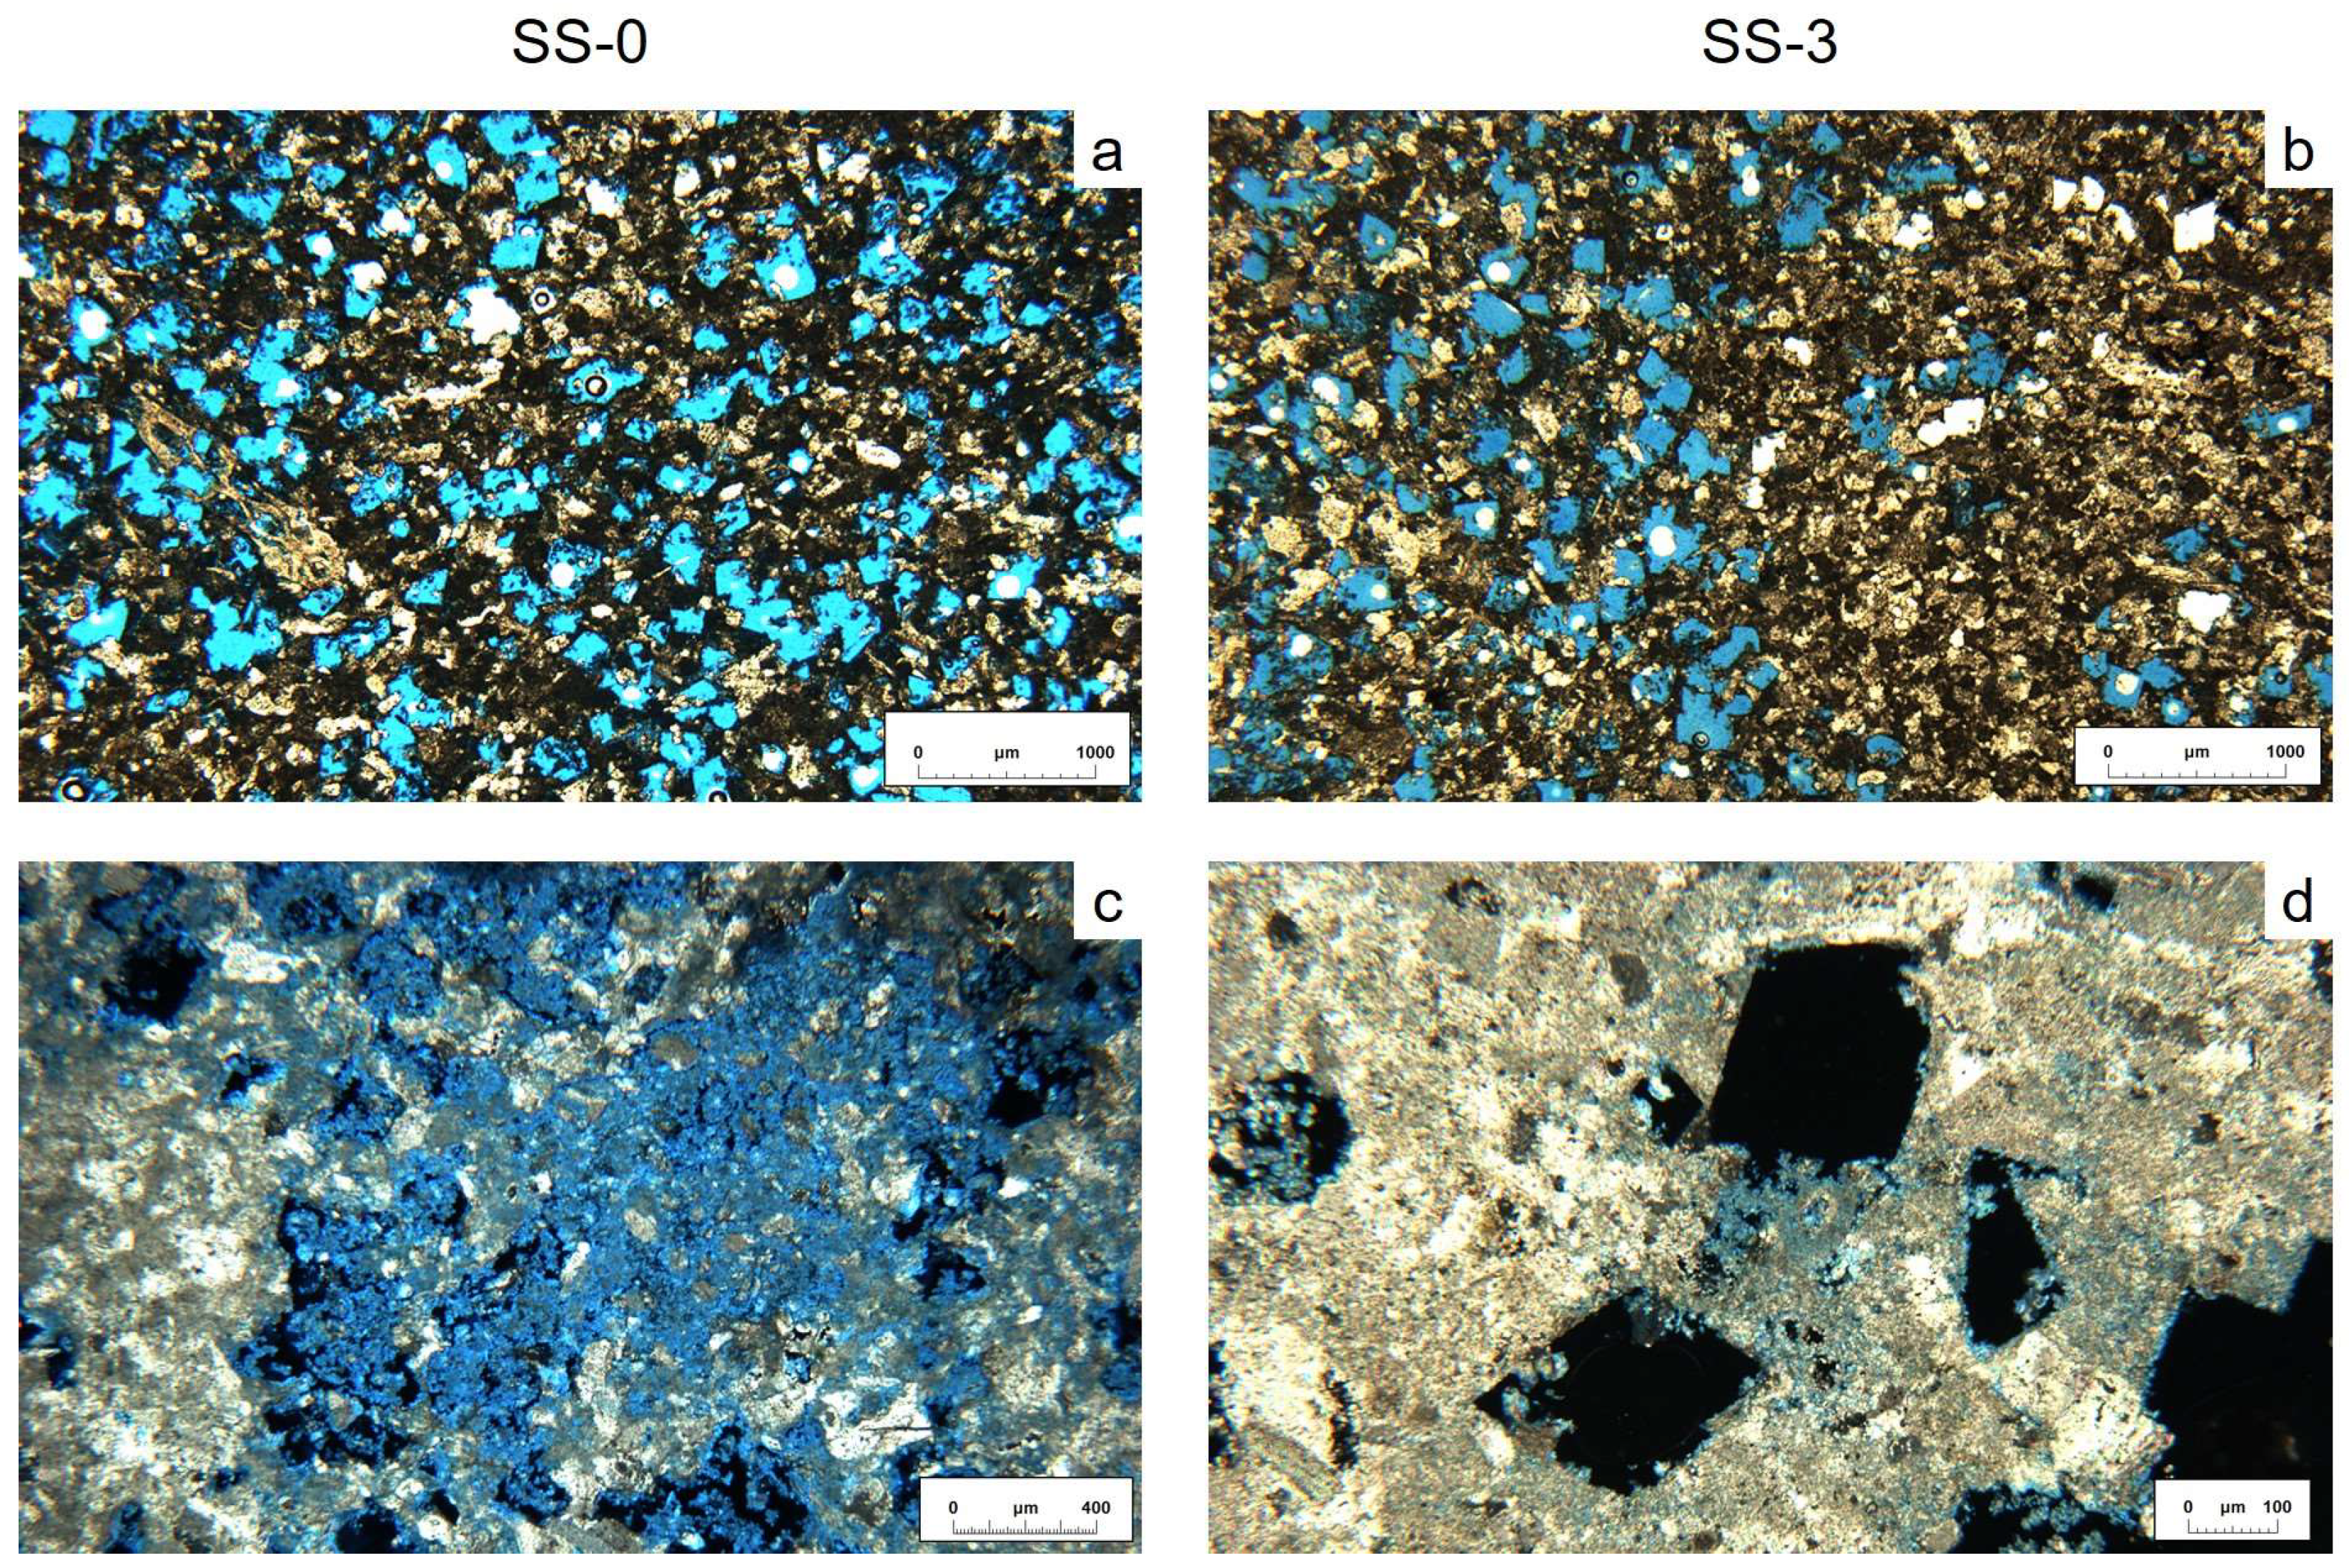


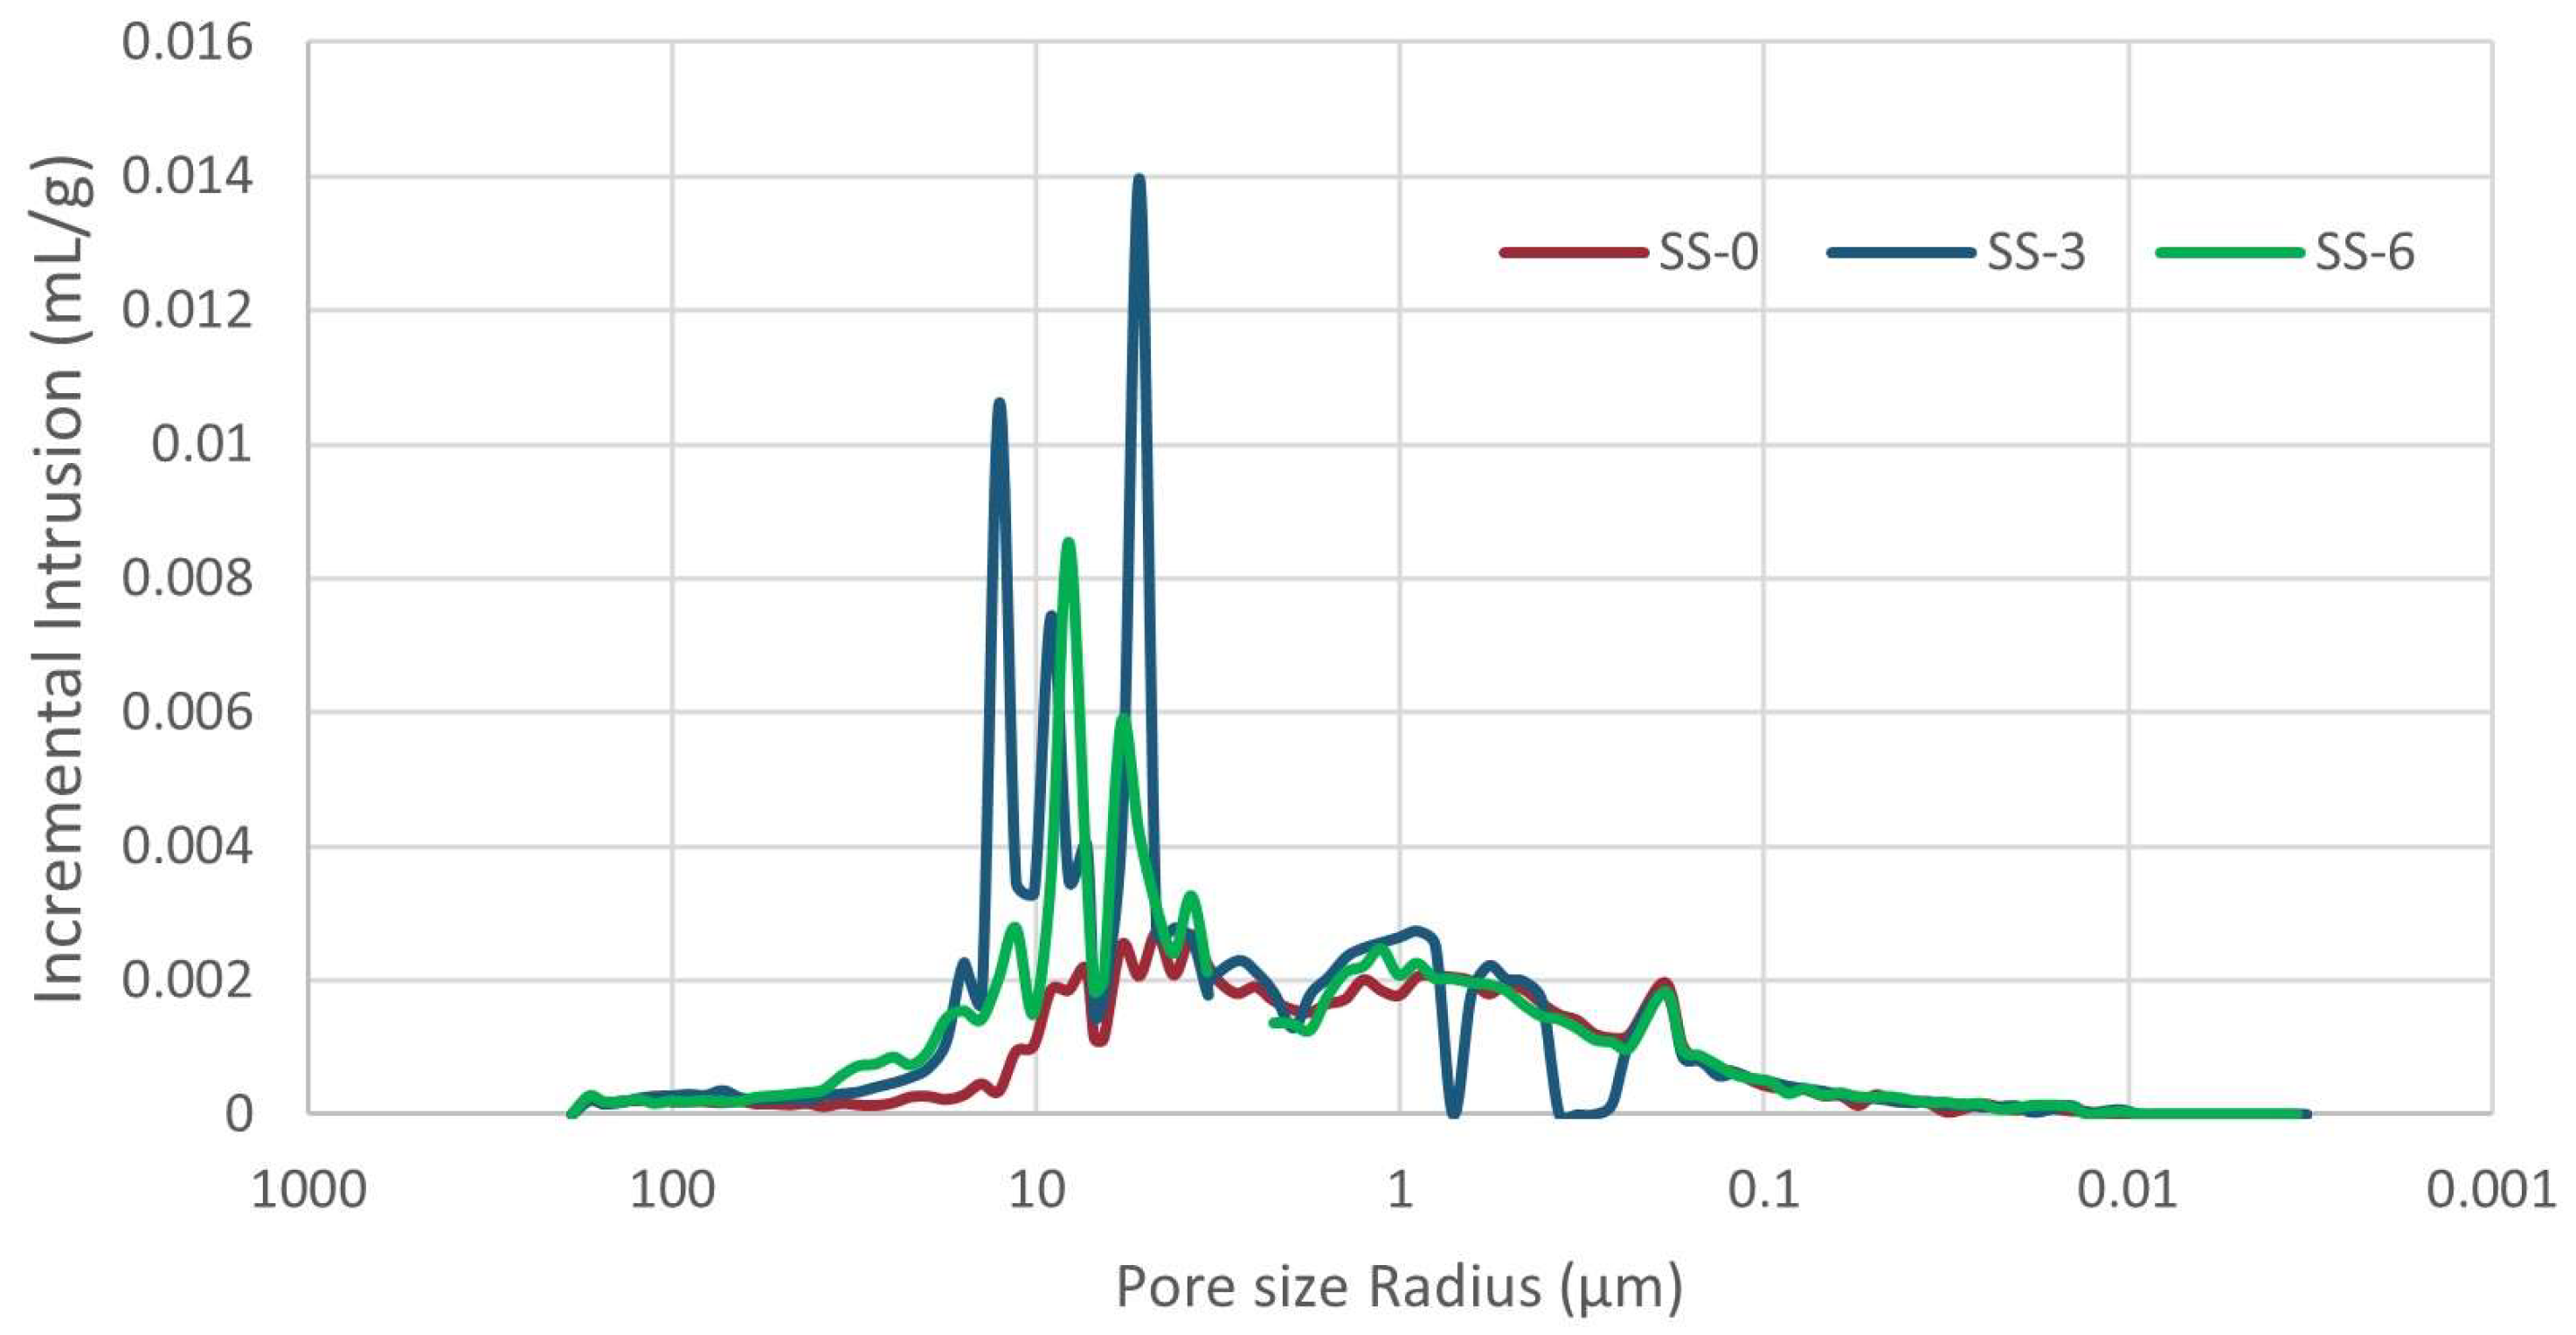
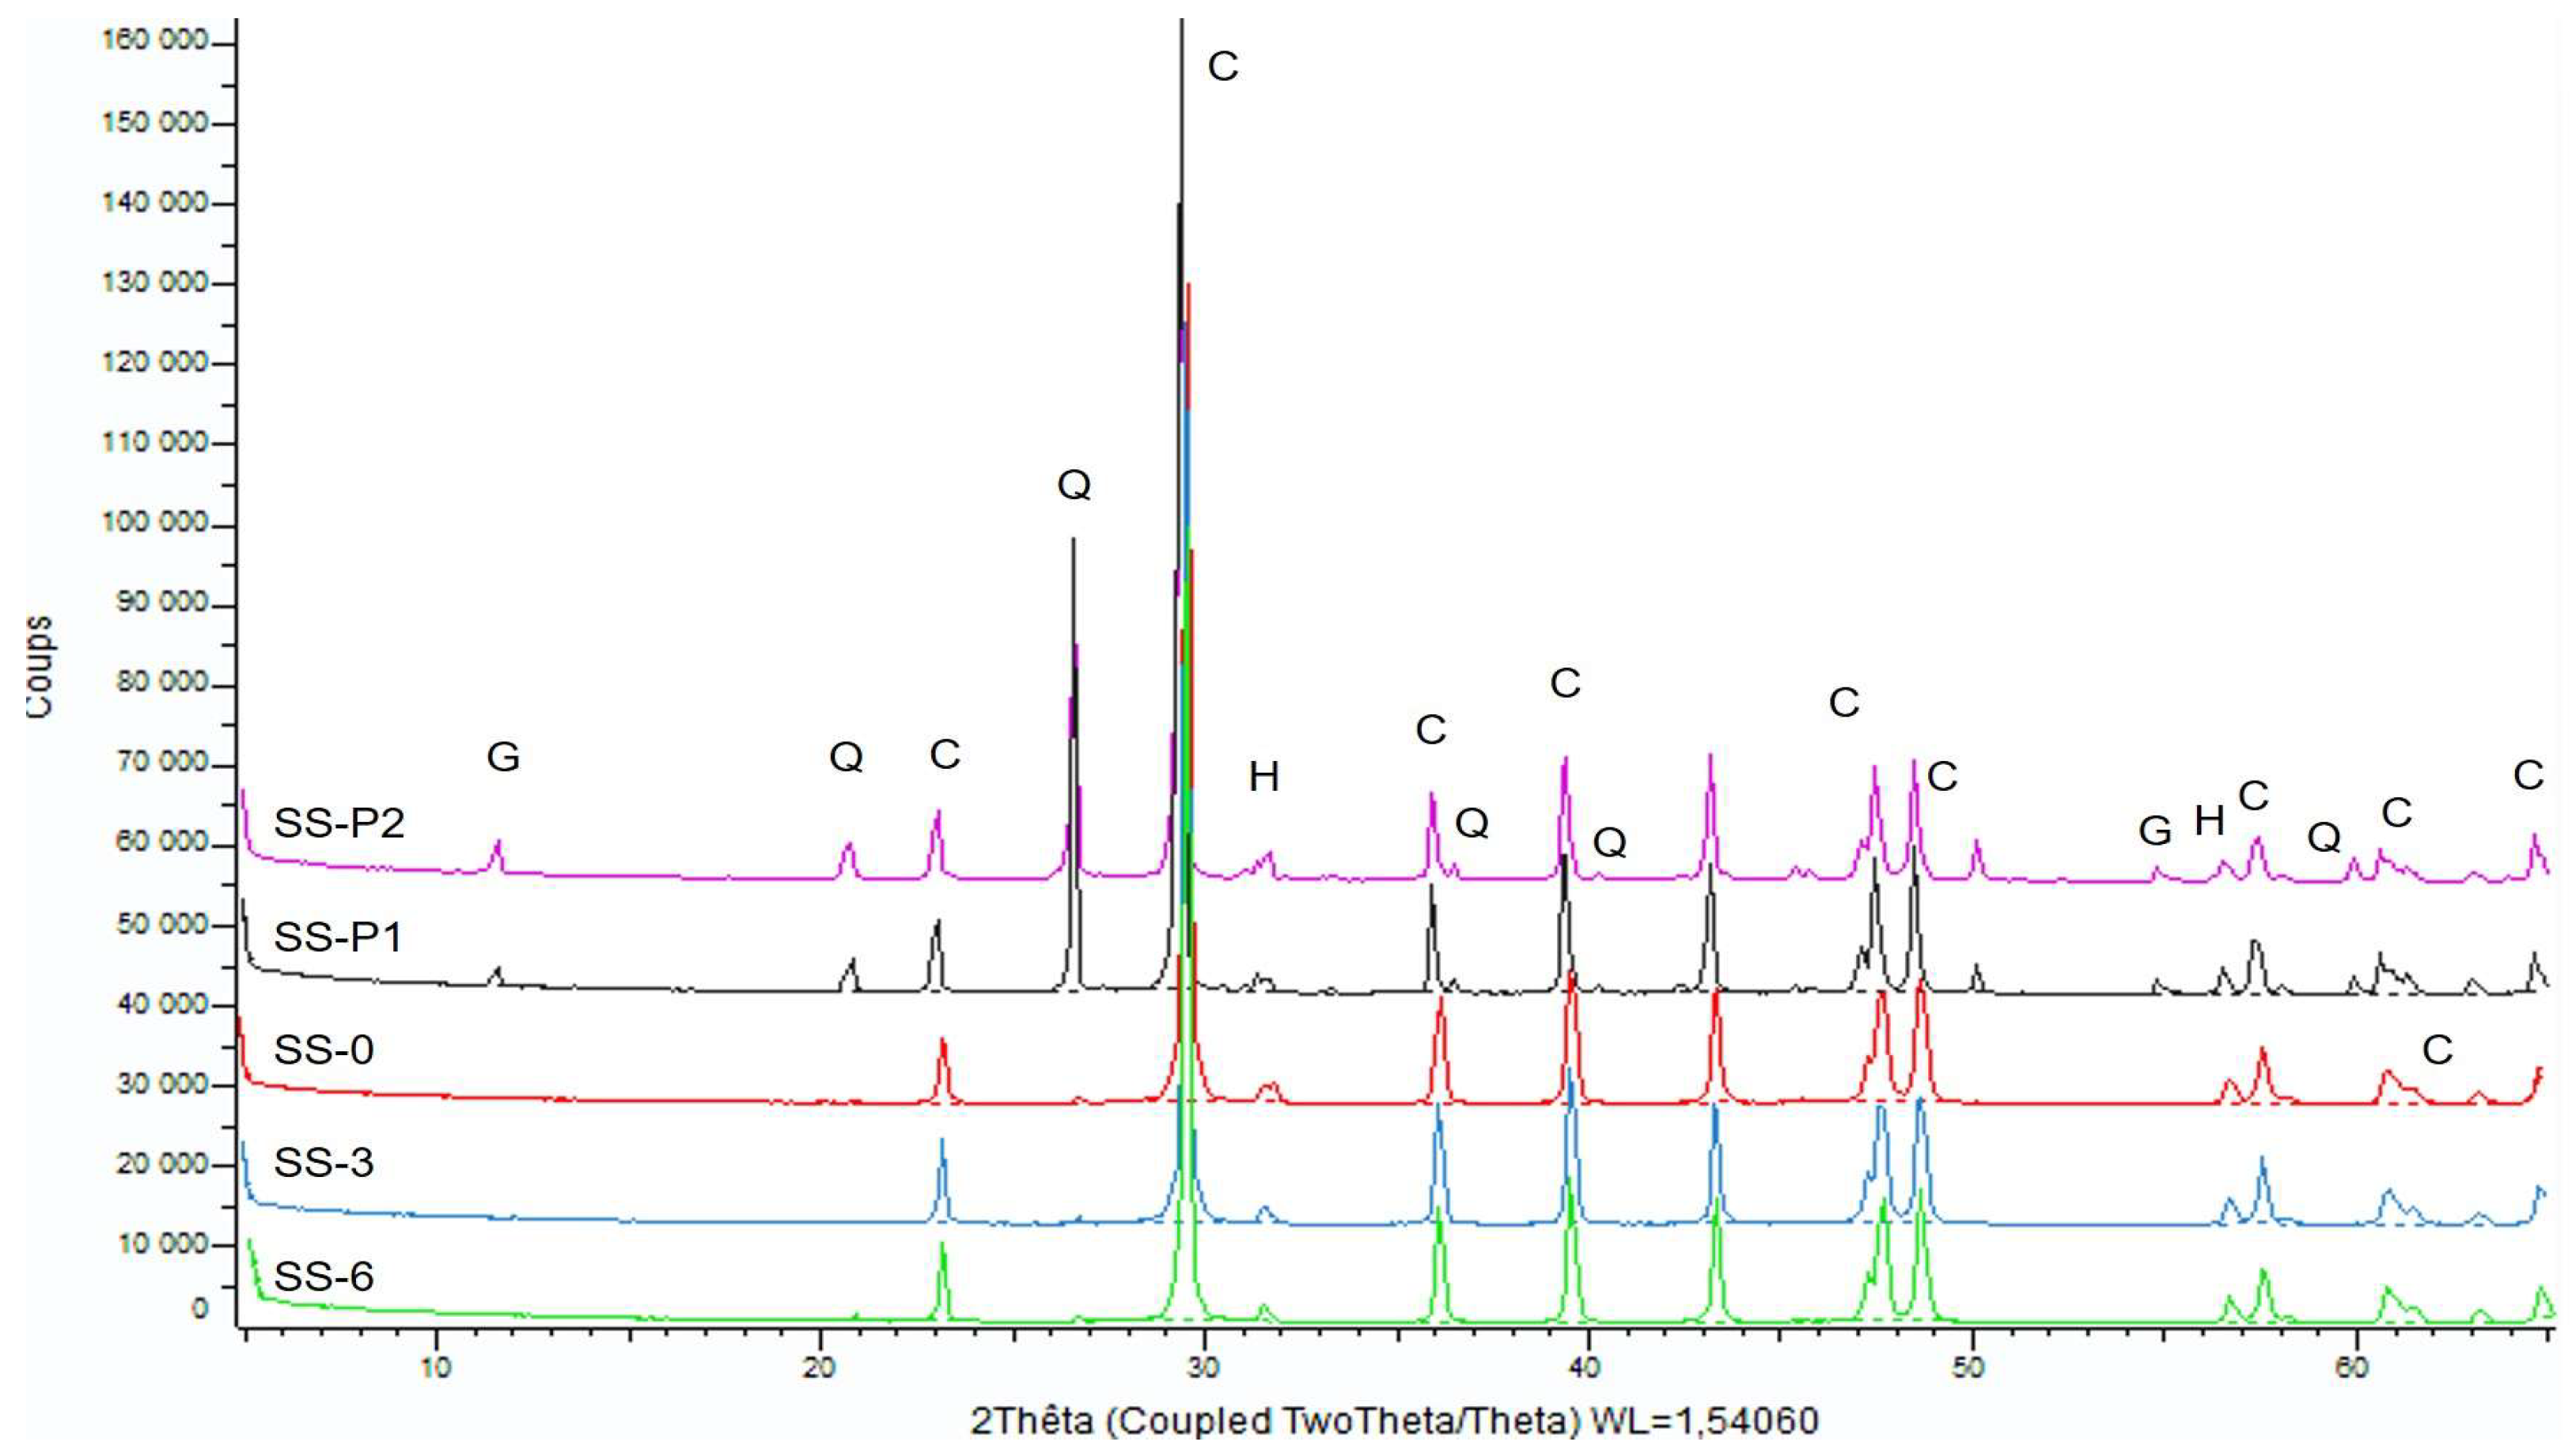
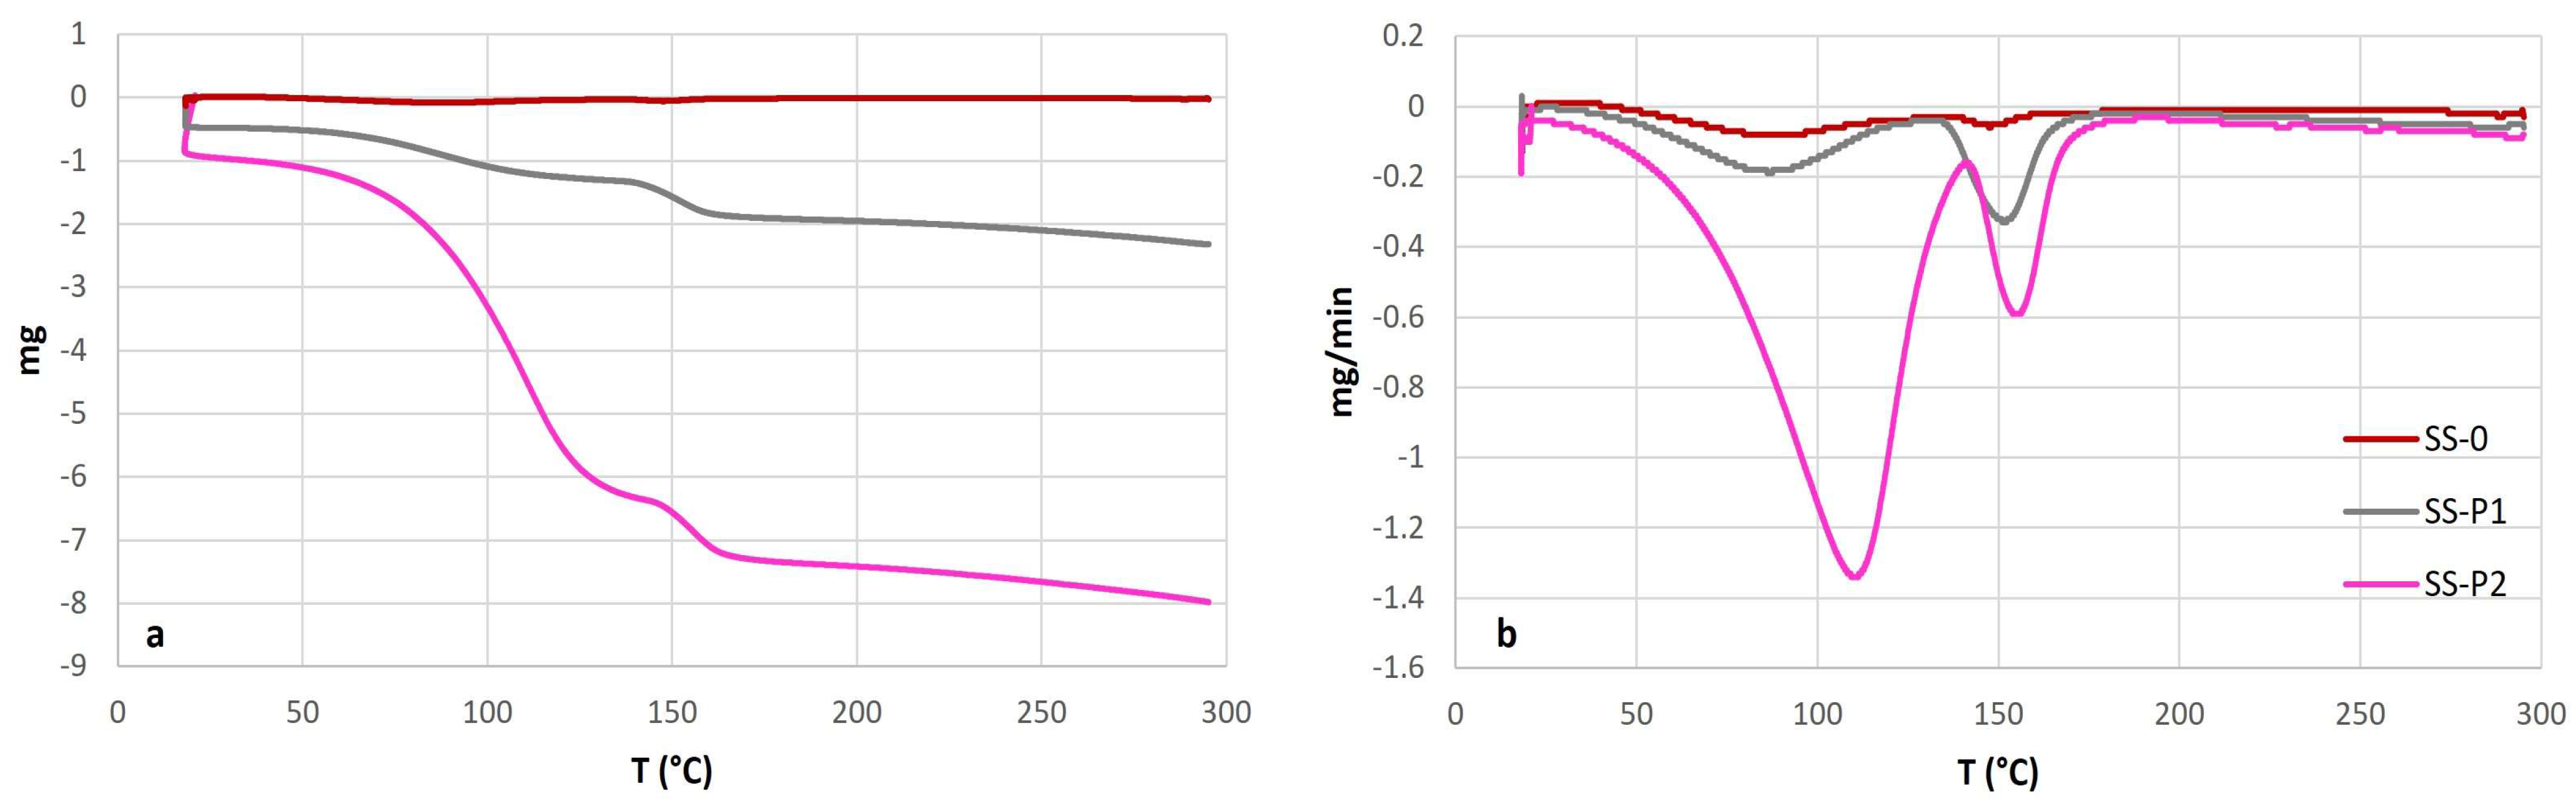
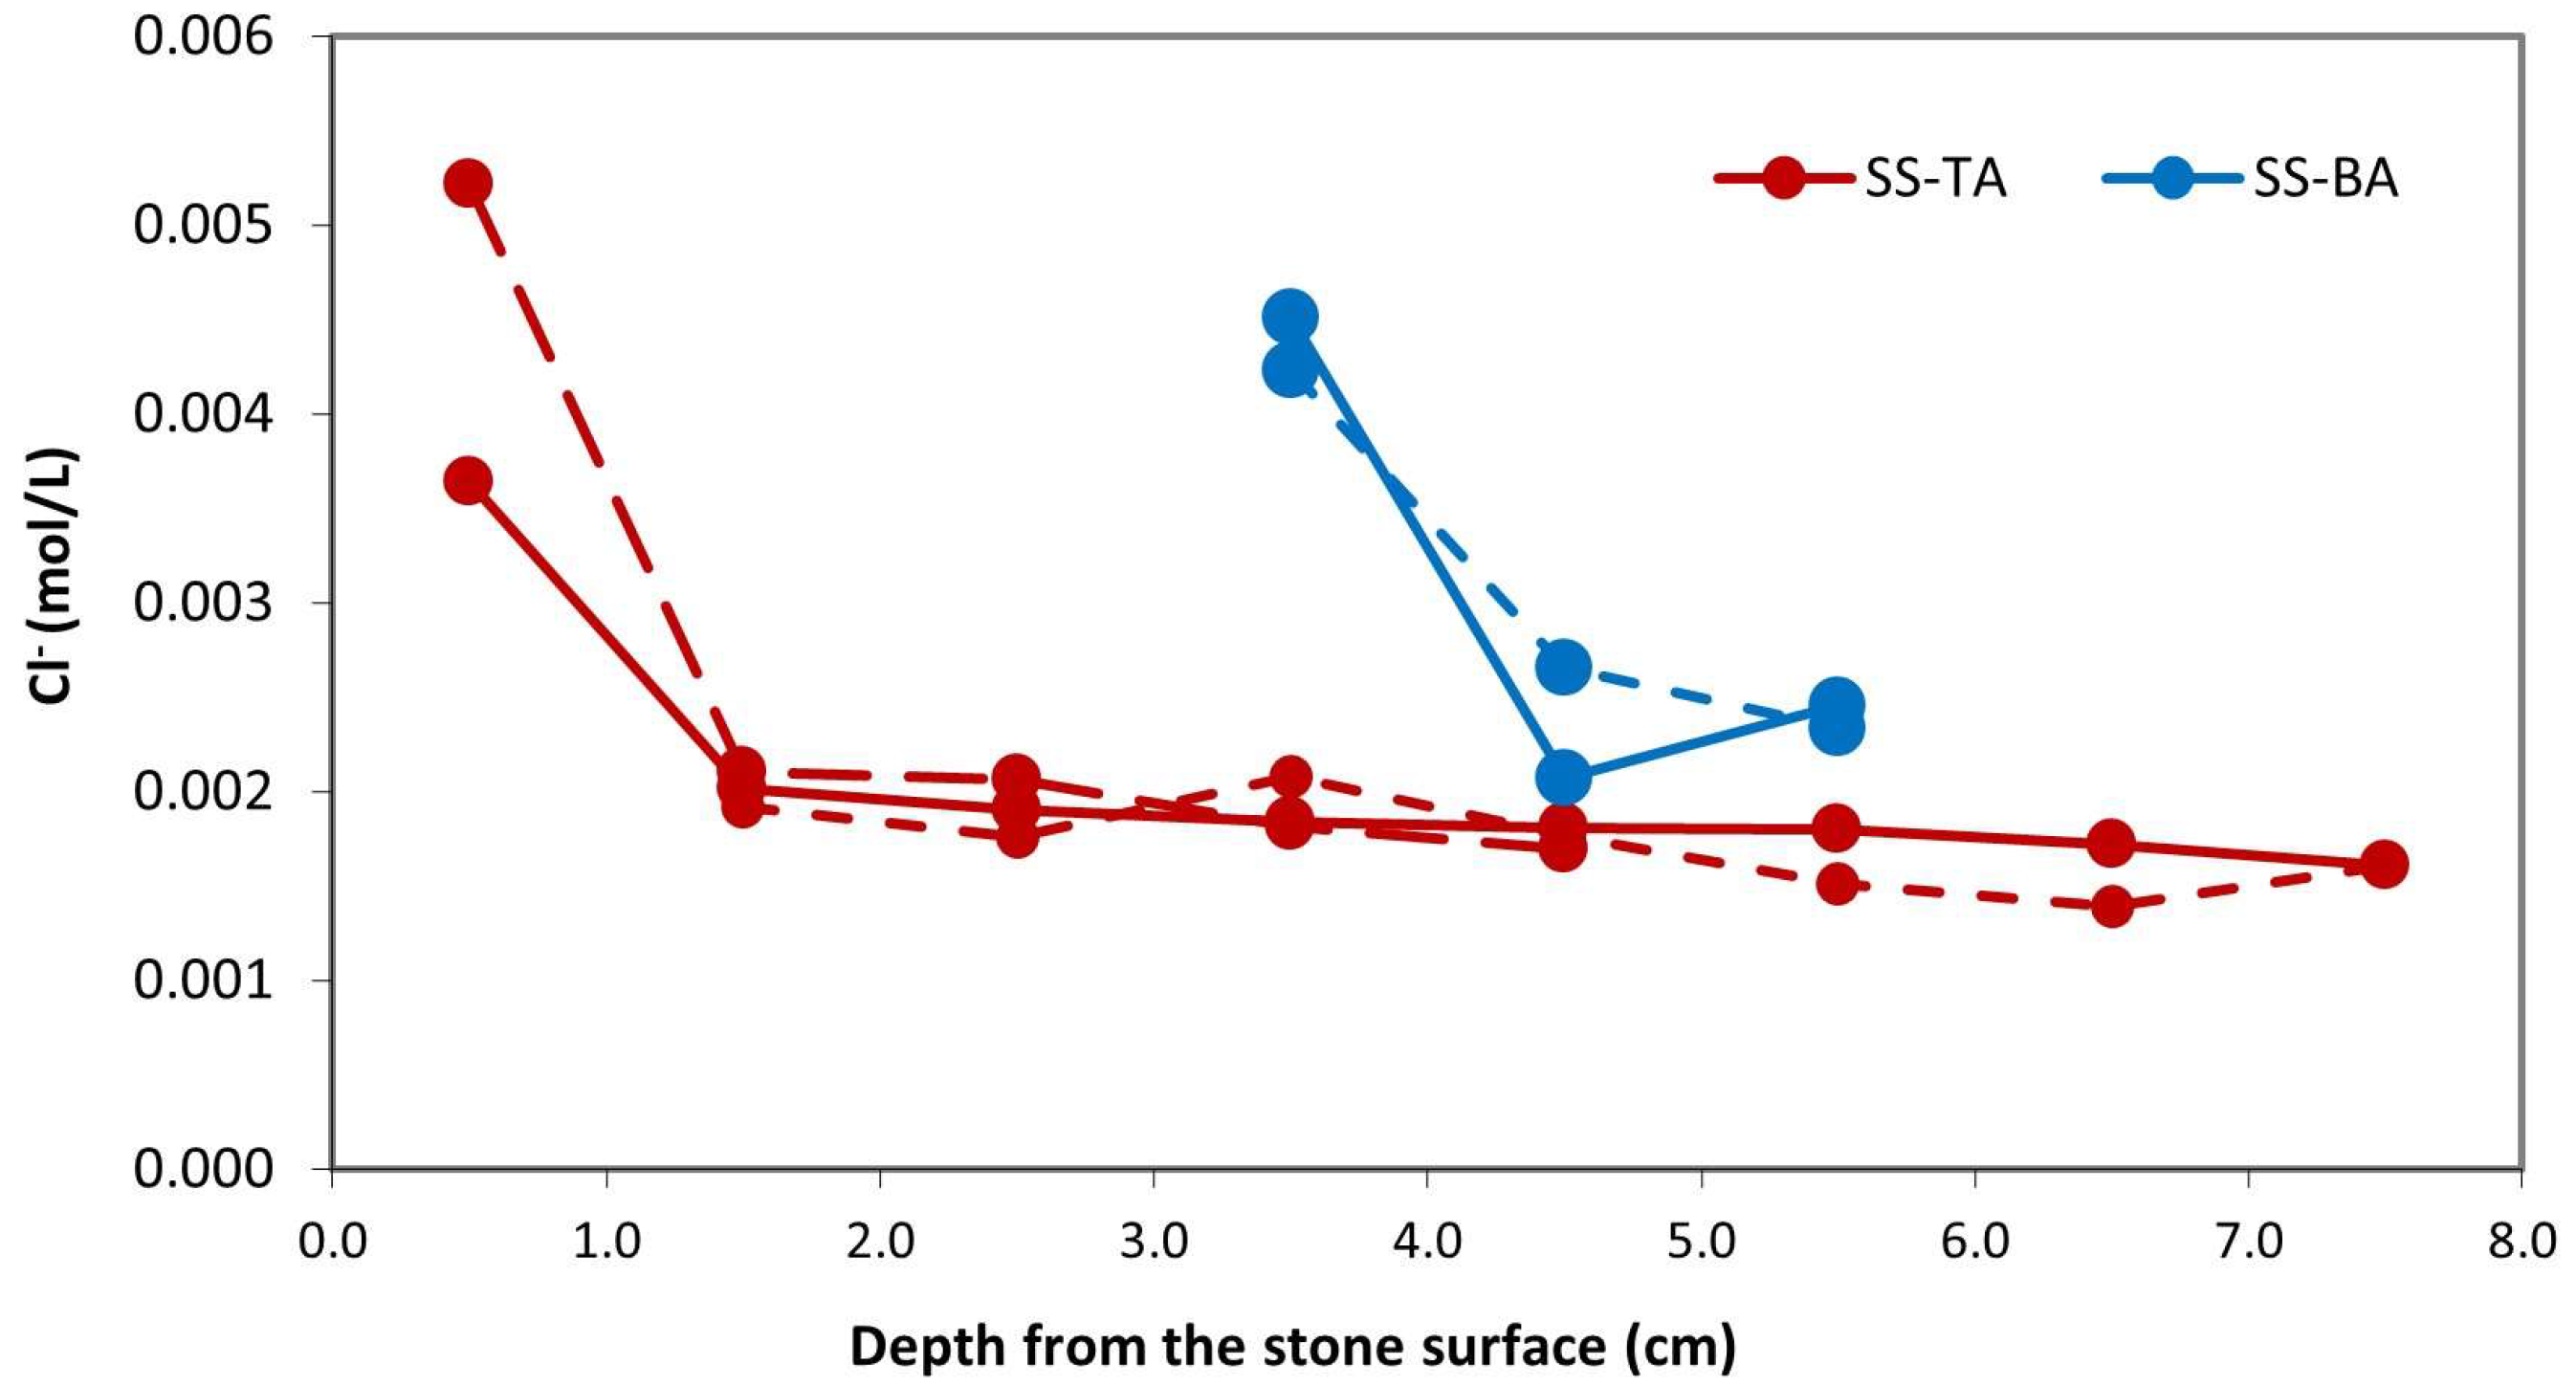
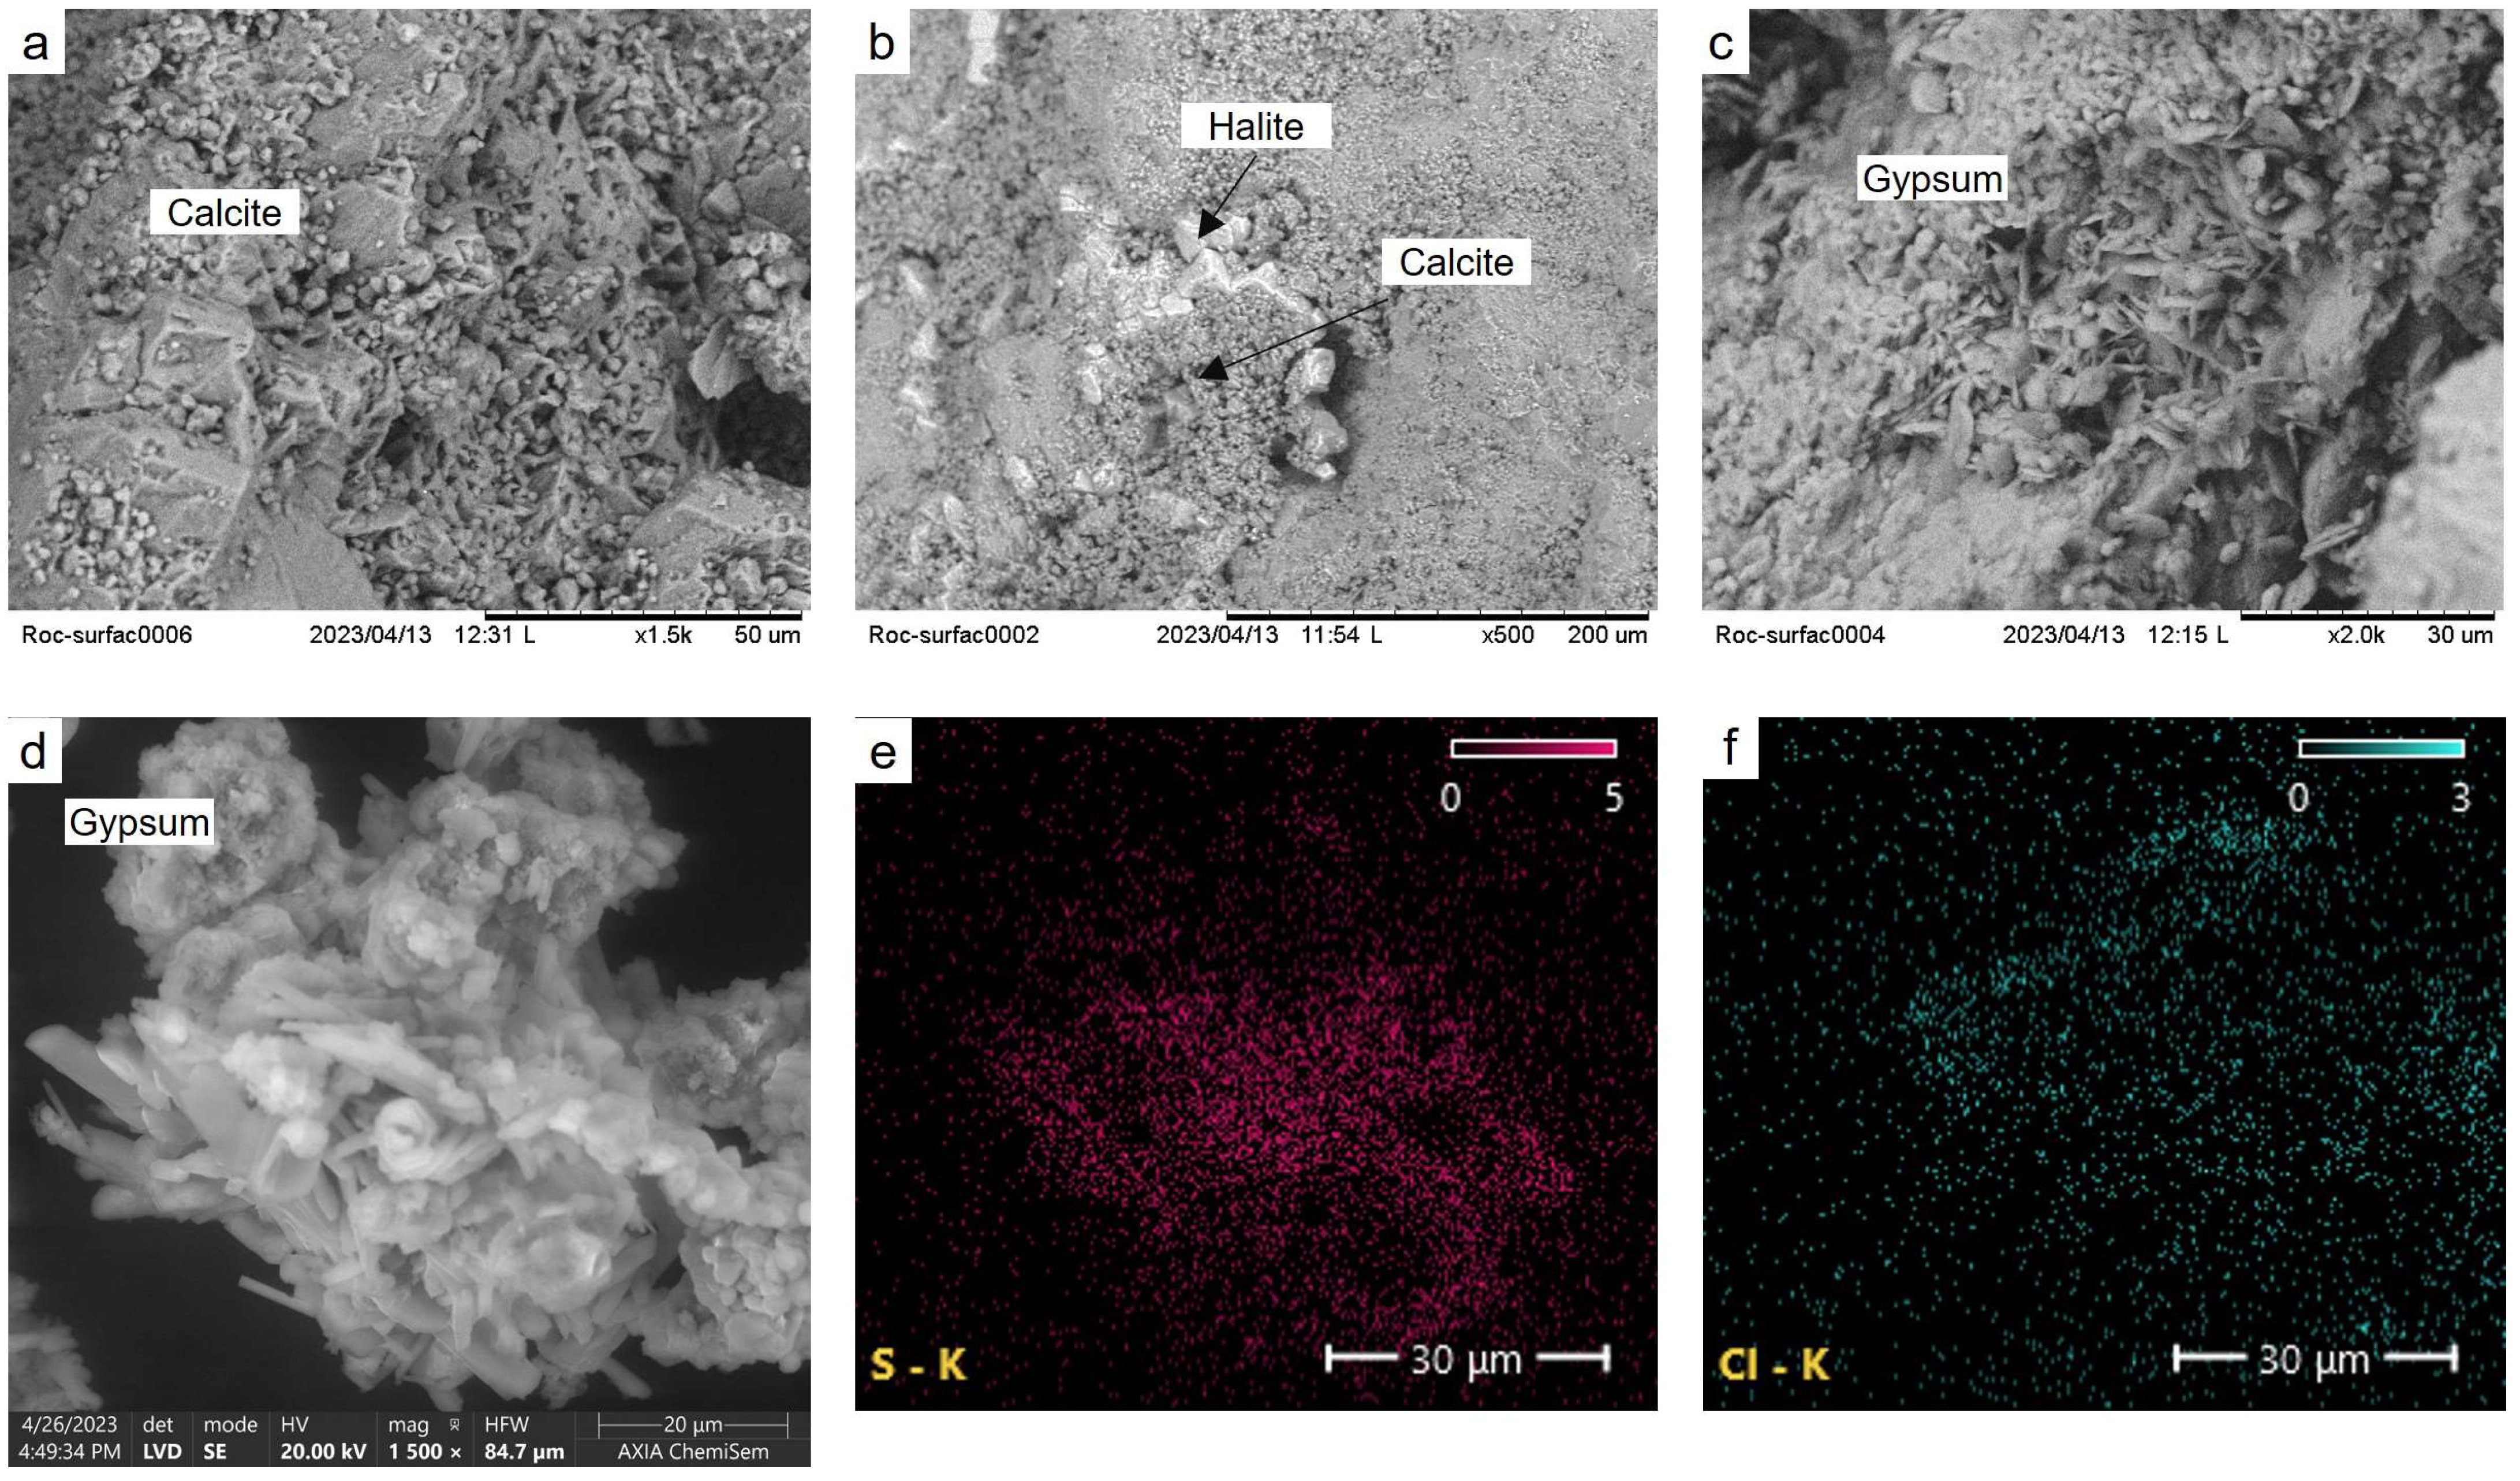
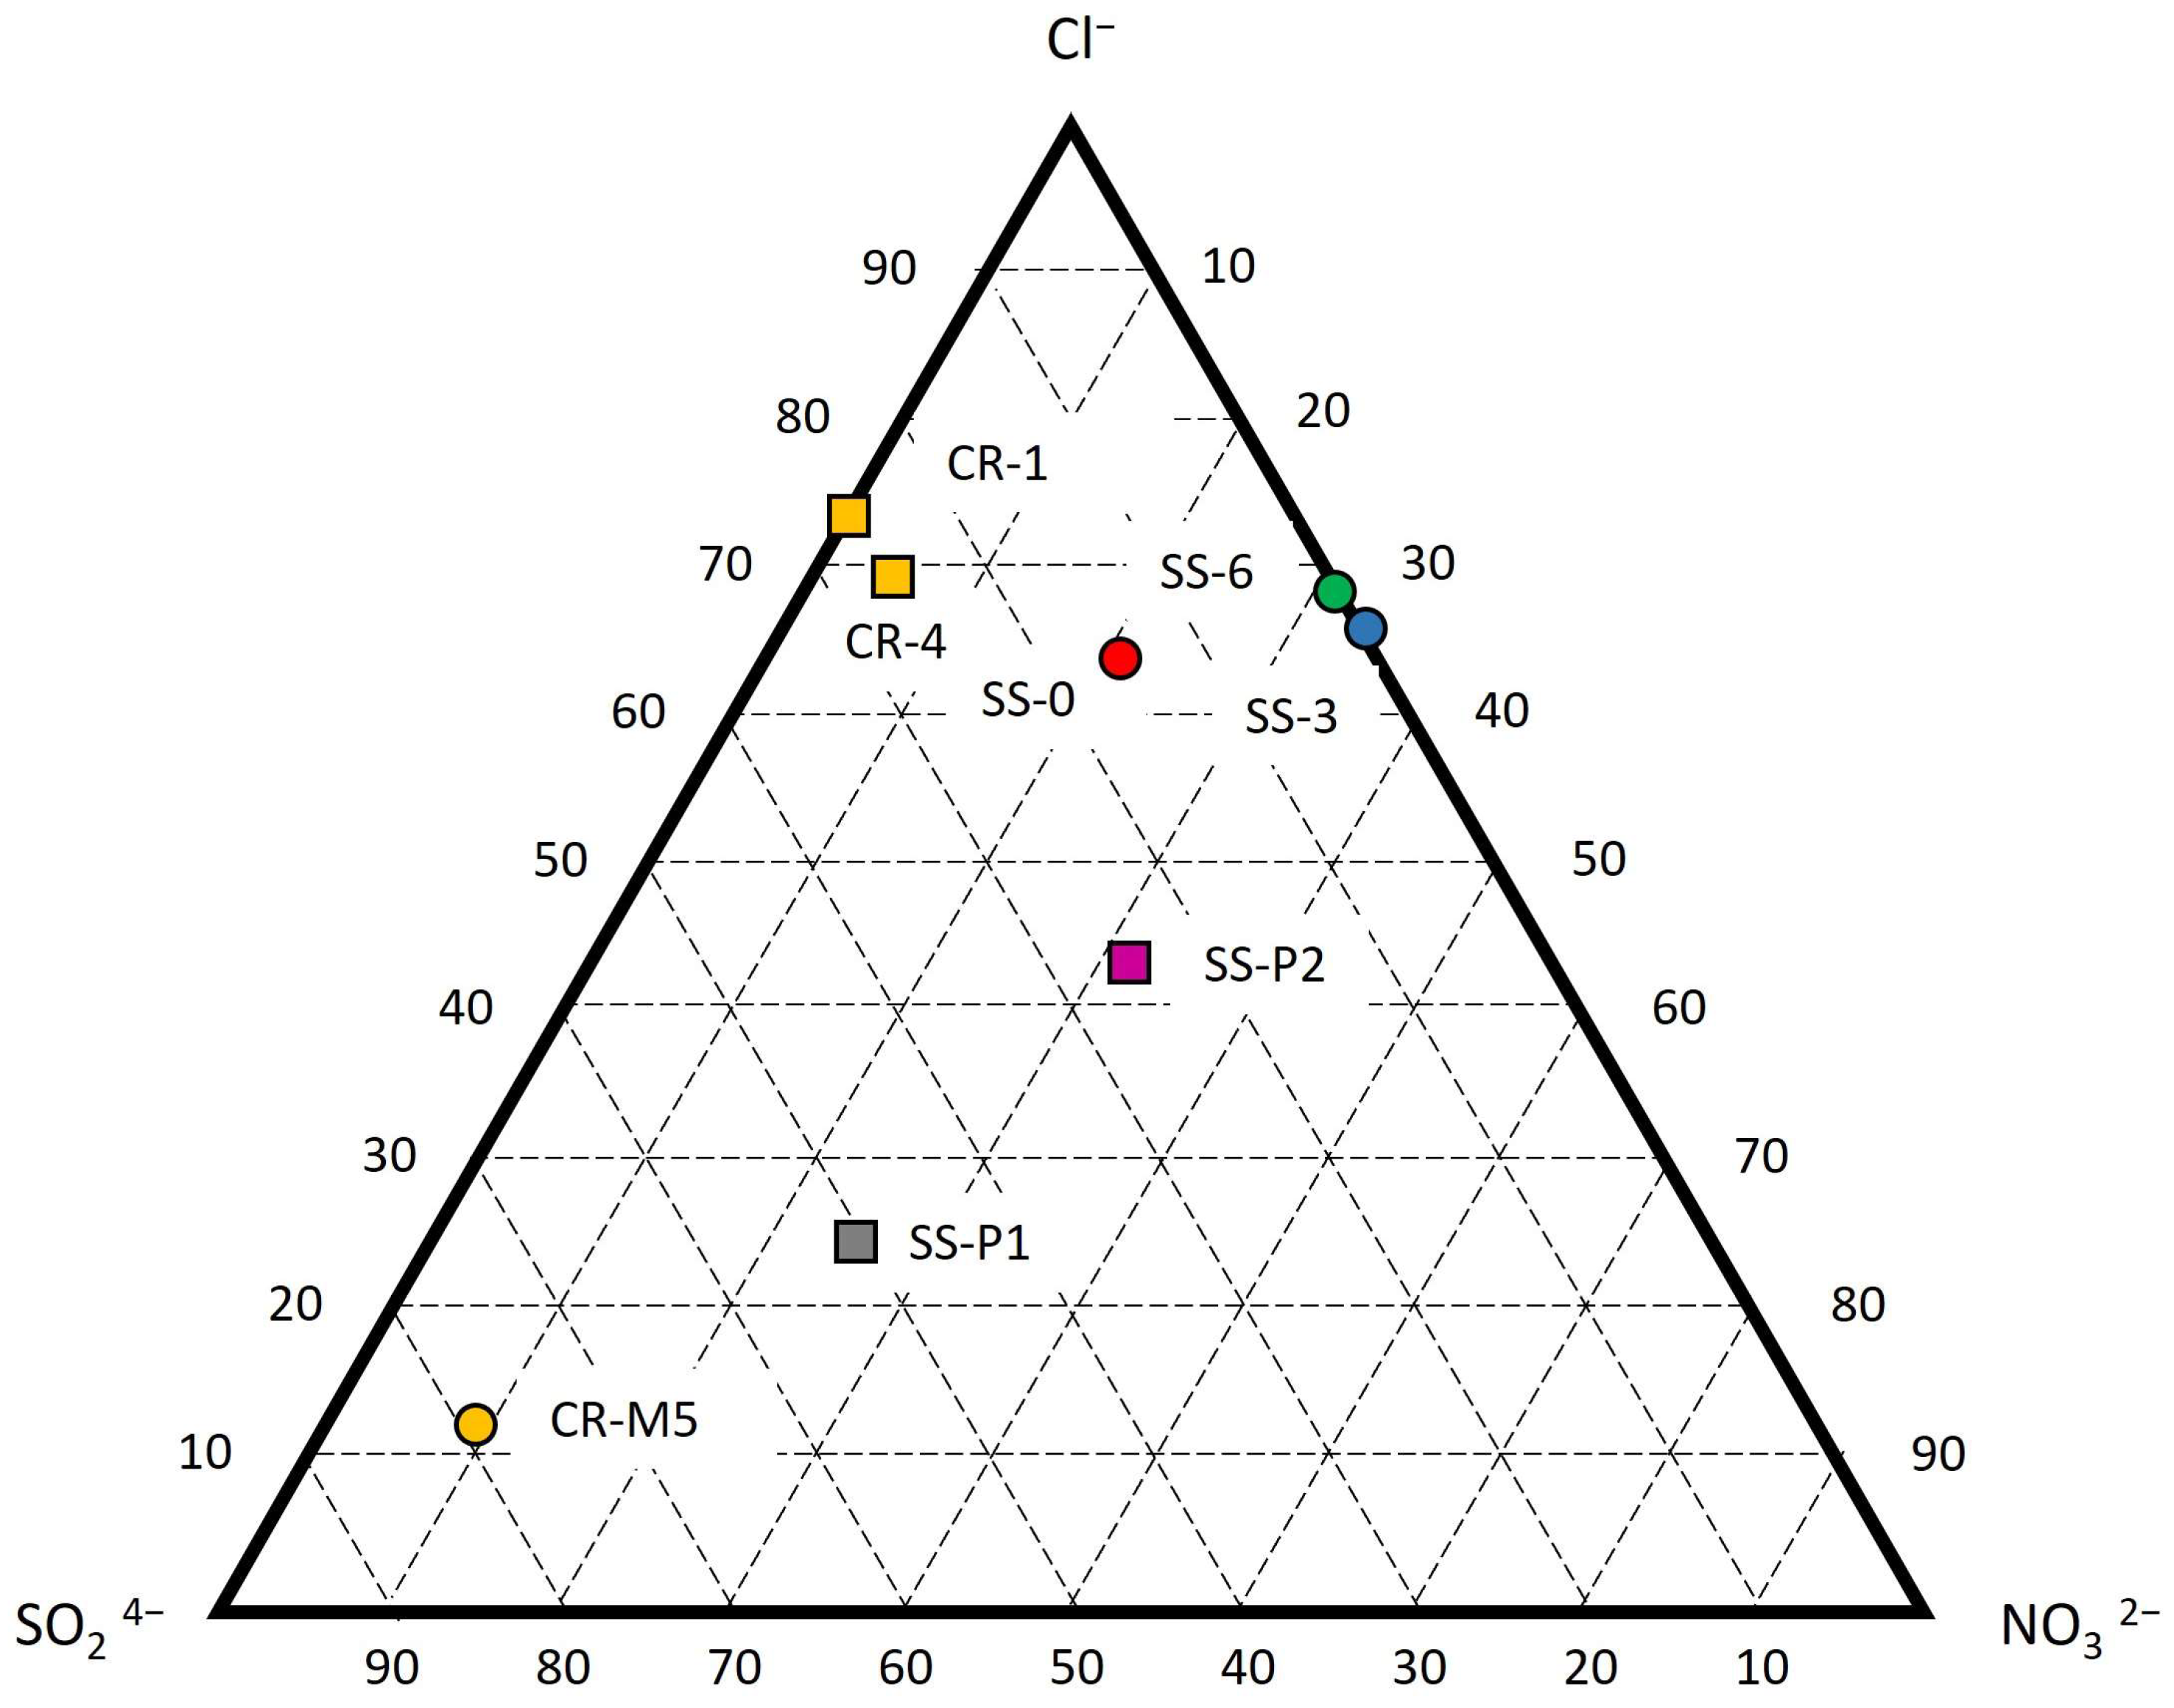
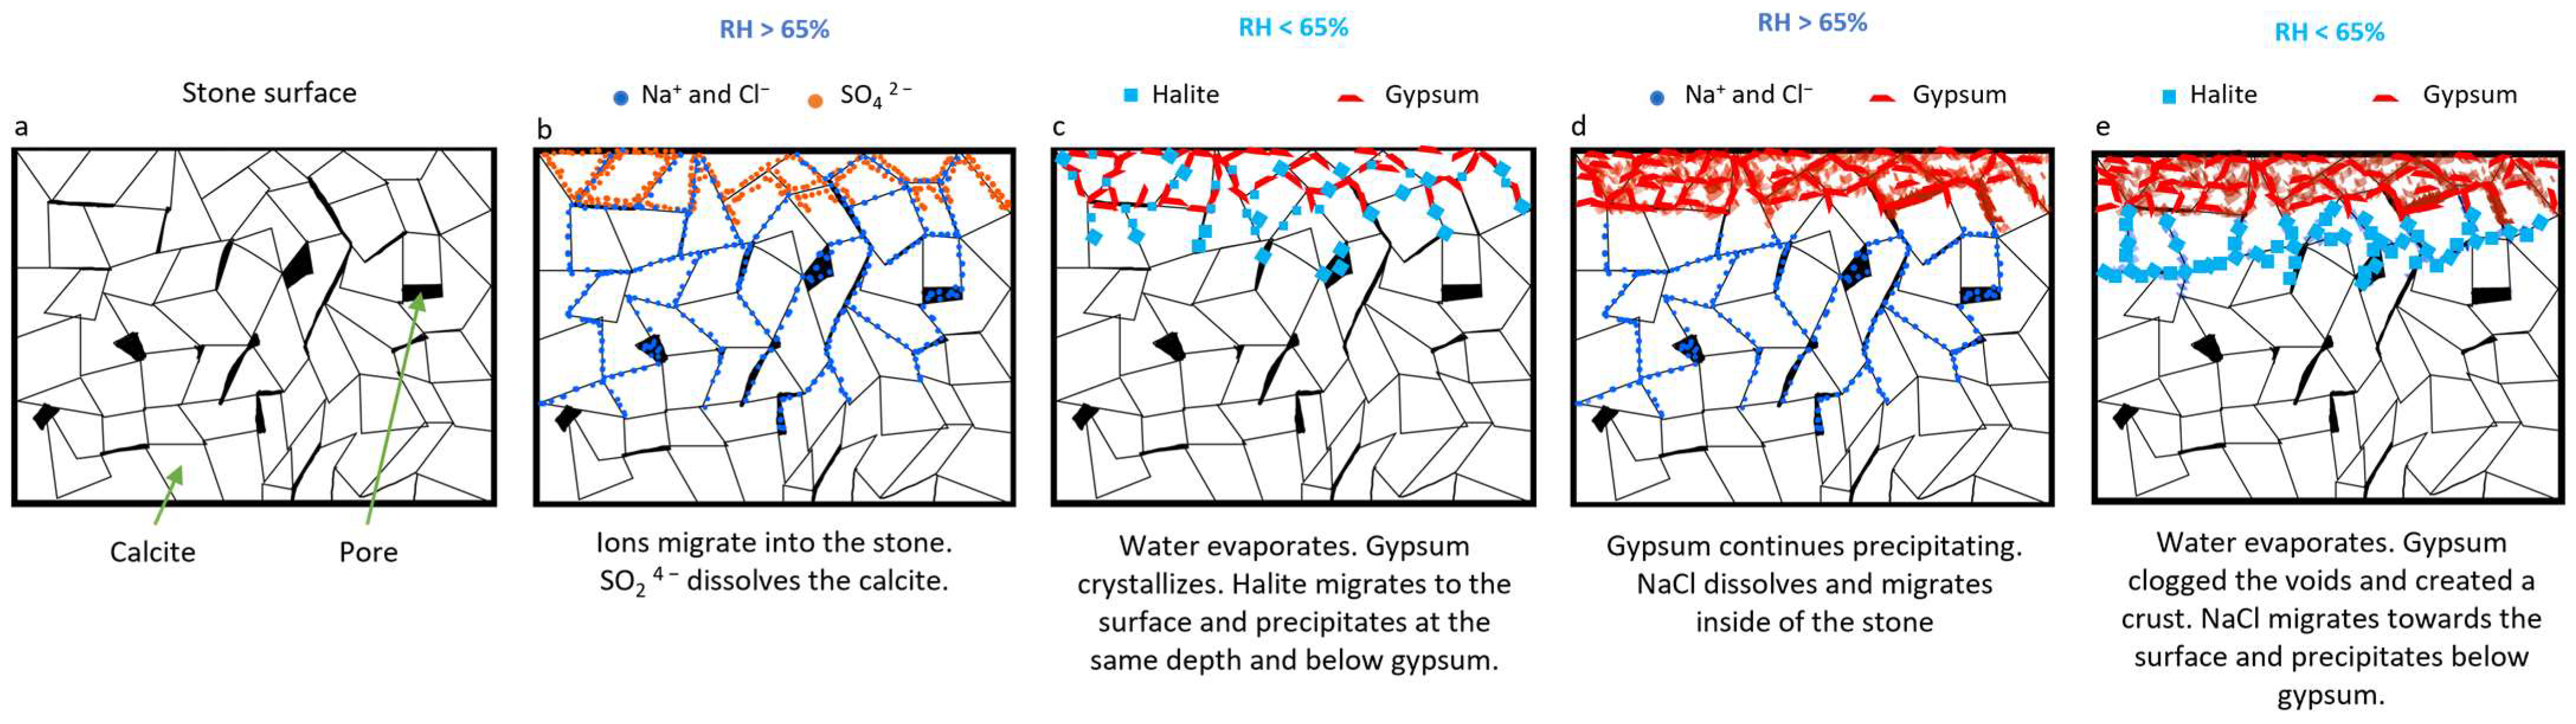
Disclaimer/Publisher’s Note: The statements, opinions and data contained in all publications are solely those of the individual author(s) and contributor(s) and not of MDPI and/or the editor(s). MDPI and/or the editor(s) disclaim responsibility for any injury to people or property resulting from any ideas, methods, instructions or products referred to in the content. |
© 2023 by the authors. Licensee MDPI, Basel, Switzerland. This article is an open access article distributed under the terms and conditions of the Creative Commons Attribution (CC BY) license (https://creativecommons.org/licenses/by/4.0/).