Article

Alterations and Contaminations in Ceramics Deposited in Underwater Environments: An Experimental Approach

by
Uxue Sanchez-Garmendia
1,*,
Javier G. Iñañez
2 and
Gorka Arana
3
1
GPAC (Built Heritage Research Group), Department of Analytical Chemistry, Faculty of Science and Technology, University of the Basque Country (UPV/EHU), 01006 Vitoria-Gasteiz, Spain
2
GPAC (Built Heritage Research Group), Department of Geography, Prehistory and Archaeology, University of the Basque Country (UPV/EHU), 01006 Vitoria-Gasteiz, Spain
3
IBeA (Ikerkuntza eta Berrikuntza Analitikoa), Department of Analytical Chemistry, Faculty of Science and Technology, University of the Basque Country (UPV/EHU), 48940 Leioa, Spain
*
Author to whom correspondence should be addressed.
Minerals 2021, 11(7), 766; https://doi.org/10.3390/min11070766
Submission received: 31 May 2021 / Revised: 9 July 2021 / Accepted: 13 July 2021 / Published: 15 July 2021
(This article belongs to the Special Issue Archaeological Ceramic Diagenesis)

Abstract

:
Ancient ceramics recovered after a long burial period have probably undergone several alterations and contaminations, introducing a chemical variability, affecting the ceramic’s natural variability. That is, the chemical and the mineralogical compositions of the ceramic pastes after their deposition will not be the same as they originally were. Therefore, it is known that the alteration and contamination processes, and the discrimination of some elements, should be considered when studying the ceramics to avoid incorrect interpretations about their provenance, technology and the use of the artefact, as well as its proper preservation. In the present work, the authors performed an experimental approach in order to study the alterations and contaminations that occurred in 60 ceramic cylinders buried in two different underwater environments. Once the pieces were taken out from the water environments, they were characterized by a multi-analytical approach. For this purpose, inductively coupled plasma mass spectrometry (ICP-MS), X-ray diffraction (XRD), scanning electron microscopy–energy dispersive spectrometry (SEM–EDS) and Raman spectroscopy were used. Newly formed minerals of different forms have been identified, with different crystallization grades. Some examples are the needles, flakes, sponges and long and short prisms composed of several elements such as Ca, F, S and O.

1. Introduction

Ancient ceramics recovered after a long burial period have probably undergone several alterations and contaminations. However, these alterations and contaminations not only occur due to the post-depositional period but also because of the firing process, as well as the sample preparation carried out for the study of the ceramics. In consequence, the alterations and contaminations introduce a chemical variability, affecting the natural variability; that is, the chemical and the mineralogical compositions of the ceramic paste after their deposition will not be the same as they originally were [1,2,3,4].
The main post-depositional alteration processes of archaeological ceramics are the result of the action of a set of extrinsic agents (those that define the burial context or the environment), intrinsic agents (those that are part of the object, such as the materials or the technology) and the result of the interaction between both of them [5]. Extrinsic agents include various natural site formation processes such as bioturbation and river transport, as well as some cultural processes (e.g., plowing, looting). In addition, abiotic agents, such as the abrasion produced by wind, are capable of producing various types of alterations on the ceramic, and climate is a crucial factor as it defines several of the mechanisms that take place within the soils where the materials are buried. It is also important to study the sediments and soils to understand the burial conditions and post-depositional processes that occurred in the ceramics, since the behavior of burial contexts is similar to that of soils [6]. The soil is the result of the complex interaction between a variety of physical, chemical and biological processes that act on rocks and sediments, and constitutes a dynamic system in which chemical movements and redistribution of its elements constantly take place. Regarding the study of the material’s preservation, the characteristics of soils affecting materials preservation are texture (granulometry, morphology, etc.), pH (acid, neutral or basic), redox potential (Eh) (reducing or oxidizing the environment), humidity, salts and biologic agents (fauna and flora). The granulometry influences the transport of air and water through the materials, thus influencing also the chemical processes of oxidation and hydrolysis [5,6]. With respect to the pH of the soils, the ceramic materials are preserved better in basic soils that are rich in calcium, sodium and magnesium. The Eh is the capacity of a soil to give or take electrons depending on whether the environment is reducing or oxidizing, and it is related to the pH and the oxygen content of the environment [5,6]. On the other hand, humidity acts as a catalyst in most reactions and will depend on the climate and on edaphochemical factors such as permeability, expansion and contraction capacity and leaching, among others. Regarding flora and fauna, one of the main factors that can cause deterioration in ceramics is the action of the roots. Fauna of a certain size can also produce some physical alterations (e.g., fragmentation), not only in the case of digging animals but also due to other processes such as trampling. Beyond all these aspects of the burial context, it is important to note that the climate is the factor that governs various reactions. For example, tropical climates are particularly harmful for the preservation of ceramics due to the presence of acid soils that favor the dissolution of especially calcareous components [5,6].
Contrariwise, intrinsic agents include the characteristics of the ceramic material under study, which are the raw materials and the manufacturing and firing techniques used. They will determine the strength, durability and the degree of physical vulnerability of an object. Therefore, it will be essential to know the different steps of the ceramic manufacturing (extraction and preparation of raw materials, manufacturing, drying, cooking and usage) to understand their influence in the transformation process of the ceramic [7]. The characteristics that define the material’s preservation are the cohesion degree of the clay fraction acquired during firing, the grade of vitrification, the hardness of the ceramic and the porosity, which are interconnected.
In addition, the material’s preservation will also depend on the interaction between the ceramic and the environment. One of these interactions is, for example, the rehydration of the ceramics; during the firing, the clay particles lose the structural water, however, the ceramics can absorb it from the environment in the deposition context, producing an expansion in the material [8,9]. Another interaction is the salts crystallization; the solutions that circulate in the soil can penetrate into the ceramic through the pores by capillarity. Then, these solutions can evaporate and salts such as sodium, potassium, calcium and magnesium chlorides, sodium, potassium and magnesium sulphates, nitrates, bicarbonates, acetates and phosphates can crystallize on the surface and pores of the ceramics [6]. Furthermore, the interaction between the ceramic and the burial environment can result in the addition, elimination or ion exchange between both of them. The presence of anomalies in the concentration of some elements (in metals, such as K, Na, Mn, Mg, Ca and Fe, and in non-metals, such as, F and P) can be linked to the contamination because of elements fixation [6,8,10,11,12,13,14,15]. This fixation phenomenon can be studied through a diffusion profile in the shape of a “U” along the walls of the ceramic; the surfaces will be more contaminated than the cores [5,6]. Moreover, the circulation of water is the main factor in the alteration of ceramics, allowing cation exchange with the surrounding soil solution, and dependent on the ceramic’s porosity. Other alterations, such as the abrasion of the surface, depend also on the hardness of the paste, porosity, distribution and orientation of the inclusions or tempering materials, etc. The heterogeneity of the constituents of the coating and the paste of the ceramics is also another possible source of alteration. This heterogeneity can contribute to a different thermal behavior of the ceramic, dilating and expanding it, which can cause ceramic fragmentation [5]. However, the coating tends to prevent the penetration of soil solutions, inhibiting the corrosion [8]. Another aspect that may affect their preservation is the functionality of the vessels; the vessels that were used for food storage can be altered by various types of acids (e.g., citric, malic, succinic and acetic) [16,17].
Regarding the state-of-the-art on studies about post-depositional alterations and contaminations, several authors have studied and evaluated these problems through the examination of real cases [3,4,8,10,14,15,18,19,20,21,22,23,24,25,26] and by means of experimental approaches. Among the latter, Bearat and collaborators (1992) [27] studied the physico-chemical alterations of the ceramics after their deposition in seawater. These authors carried out three groups of experiments, each experiment with a different type of clays, all of them fired in different temperatures. The ceramics of the first experiment were converted into powder and the authors submerged them in unrenewed seawater for 6 years. The ceramics of the second experiment were also converted into powder and submerged in seawater for 2 months. On the contrary, some ceramics from the third experiment were converted into powder while others where left as briquettes. They were submerged in renewed and unrenewed seawater for 3, 5, 6 and 10 months. Heimann and Maggetti (1981) [2] also carried out experiments on the simulated burial of ceramics in a humid climate. The authors collected and fired clays from La Peniche and subjected them to solutions simulating natural conditions in Teflon-lined autoclaves. The authors placed these autoclaves in a drying cabinet at 200 °C for 2 weeks to accelerate the reactions and simulate, in that way, a real burial period of the ceramics. In addition, Montana and collaborators (2014) and Belfiore and collaborators (2014) [28,29] carried out an experimental approach to study the alterations and contaminations of ceramics buried in seawater. These authors manufactured six different pastes with calcareous and low-calcareous clays and two different typologies of sand for tempering, all collected in Sicily. These pastes were used to make 150 ceramic briquettes and cylinders. These ceramics were placed in customized holders fixed into the open sea and in a confined system filled with seawater, which was constantly renewed. In addition, physico-chemical parameters such as temperature, pH, conductivity, salinity, total dissolved solids (TDS) and redox potential were monitored weekly. Moreover, Franklin and Vitali (1985) [30] studied the environmental stability of ceramics during burial at ambient temperatures. For this task, authors manufactured and fired calcareous ceramic briquettes of a known composition, and subjected them to a variety of aqueous solutions, which their pH and temperature (at 25 °C and 90 °C) were monitored. Thanks to these studies (real cases and experimental approaches), it is known that alteration and contamination processes and the discrimination of some elements should be considered when studying the ceramics to avoid incorrect interpretations about their provenance, technology and the use of the artefact as well as its proper preservation [1,6,8,13,19,21,30]. In the present work, the authors performed an experimental approach in order to study the alterations and contaminations that occurred in 60 ceramic cylinders buried in two different underwater environments.

2. Materials and Techniques

2.1. Materials

Sixty-nine cylinders were prepared using cylinder molds of 30 mm diameter and 15 mm height. Sixty cylinders were submerged (test-pieces), but 9 were not (control-pieces) since they were used to compare with submerged pieces, chemically and mineralogically. Three types of commercial clays were used to prepare the 69 pieces. The pieces were dried at room temperature and then at 100 °C in a laboratory electric kiln. After that, they were fired in a laboratory kiln at an oxidant environment at 850, 950 or 1100 °C, leaving them for an hour at the maximum temperature. In this way, 3 different pastes and 9 fabrics (3 fabrics for each paste) were produced out of commercial clays (Figure 1, Table 1). It was important to produce several kinds of fabrics to see how the environment affected them. The repeatability of the experiment was also calculated. For this, 3 pieces of each paste were used, all fired at 850 °C and submerged in seawater because these conditions are supposed to be the most extreme. Hence, the repeatability calculated for these 9 ceramics was supposed to be representative of the whole experiment.
Then, test-pieces were submerged for 3 different time periods, in two different water environments created in two containers of polypropylene of 4.7 L; 3 pieces of each fabric were immersed in simulated seawater, which was prepared following the recipe of De Stefano and collaborators (1994) [31], and another 3 pieces of each fabric in tap water (Figure 1). The periods of time were 3, 10 and 18 months, so two test-pieces of each fabric (one from seawater and the other from tap water) were taken in the 3rd month, other two in the 10th month and the other 4 (3 from marine water for repeatability and one from tap water) in the 18th month. The two water environment containers were placed in an electric water bath at 50 °C (more than double the value of the seawater environment temperature), in order to simulate a real burial period, accelerating the alteration reactions (Figure 1). Additionally, different parameters of the experiment, such as pH, conductivity, TDS, salinity and temperature, were monitored, first, once every two weeks to see their variations and then on a monthly basis, as they were quite stable. Since the pH regulates many biological and chemical processes and reactions, it is important to measure this during the experiment [32]. A change in the pH could be an indicator for an environmental attack to the ceramics (dissolution of minerals, for example) [30]. Additionally, since conductivity is the capacity of a solution to conduct an electric current, it is related to the TDS (total dissolved solids) and salinity, providing an indication of the total number of ions. Moreover, salinity is the amount of solids dissolved in one kilogram of seawater, which determines, among other factors, the oxidation-reduction capacity [32].

2.2. Techniques

Once the pieces were taken out from the water environments, they were characterized by a multi-analytical approach. Inductively coupled plasma mass spectrometry (ICP-MS) and X-ray diffraction (XRD) were carried out for the chemical and mineralogical analyses of the test- and control-pieces. In addition, XRD analyses were also performed for the raw clays. ICP-MS is useful for identifying chemical changes, enrichment or leaching cases of the elements. Besides, XRD is useful for identifying and quantifying minerals present in the raw material (primary minerals). Furthermore, new minerals crystallized during firing and minerals formed due to burial alteration processes can be identified as well by XRD. Moreover, microstructural characterization, assessment of the extent of vitrification and the presence of alterations and contaminations have also been studied by scanning electron microscopy–energy dispersive spectrometry (SEM–EDS) and Raman spectrometry. Finally, the 60 test-pieces were analyzed by a colorimeter before and after their immersion because color changes may have been macroscopic indicators of the uses that the pottery had, as well as of post-depositional transformations [6].
The ICP-MS analyses were performed with a NexION 300 ICP-MS (Perkin Elmer, Ontario, Canada), provided with an OneNeb pneumatic concentric nebulizer (Agilent, Santa Clara, CA, USA), cyclonic spray chamber and standard nickel cones. Prior to the analyses, the ceramic shards followed a fusion sample treatment as in Sanchez-Garmendia and collaborators (2020a), based on the method optimized by García de Madinabeitia et al. (2008) [33,34]. The solutions obtained from the fusion of each ceramic were then treated inside a class 100 clean room, following the methodology described in detail in the study carried out by Sanchez-Garmendia and collaborators (2020a) [33]. First, the solutions were diluted gravimetrically 200 times in a 1% HNO3 solution. 10 g of dilution were prepared for each primary solution. The internal standards solution (In) was prepared from 1000 μg/mL stock solutions of Alfa Aesar using Milli-Q quality water for their dilution. Argon was used as carrier gas in the ICP-MS measurements. In total, 42 elements and compounds were measured: Al2O3, Ba, CaO, Ce, Co, Cr, Cs, Cu, Dy, Er, Eu, Fe2O3, Gd, Hf, Ho, K2O, La, Lu, MgO, MnO, Na2O, Nb, Nd, Ni, P2O5, Pb, Pr, Rb, SiO2, Sm, Sn, Sr, Ta, Tb, Th, TiO2, Tm, U, V, Yb, Zn and Zr. The experimental conditions and sample introduction of the ICP-MS are described in the study carried out by Sanchez-Garmendia et al. (2020b) [35].
Besides, a PANalytical X’Pert PRO powder diffractometer (Malvern Panalytical, Malvern, UK) was used for the XRD analyses. For this, powdered ceramic pastes were obtained following the procedure carried out by Sanchez-Garmendia and collaborators (2020a) [33] and were used but calcination was not performed. The instrument was equipped with a copper tube (λCuKαmean = 1.5418 Å), programmable divergence aperture, vertical goniometer (Bragg–Brentano geometry), automatic sample changer, PixCel detector (Malvern Panalytical, Malvern, UK) and secondary graphite monochromator. The operating conditions for the Cu tube were 40 mA and 40 kV. The angular range (2 θ) was scanned between 5° and 70°. The treatment of the diffractogram data was carried out using X’pert HighScore (PANalytical, Malvern Panalytical, Malvern, UK) software in combination with the powder diffraction file database PDF2 (International Centre for Diffraction Data—ICDD, newtown Square, PA, USA).
Regarding the microstructural characterization and examination of the extent of vitrification, alterations and contaminations of the ceramics, they were analyzed using the EVO 40 Carl-Zeiss Scanning Electron Microscopy (SEM) (Zeiss, White Plains, NY, USA) coupled to an energy dispersive X-ray analyzer (EDS) X-Max. This study was conducted on 69 freshly fractured surfaces that were cut perpendicularly to the outer/inner surfaces and gold coated. The working conditions for SEM were the following: 20 kV, 100 mA, full vacuum conditions and 7.5–10.5 mm working distance. Then, for EDS the intensity was increased to 500 mA to improve the signal. The elemental composition of the ceramics was determined by an energy dispersive spectrometry (EDS) analysis; the EDS spectra were acquired and treated using the INCA software (Oxford Instruments, Abingdon, UK).
Concerning the molecular characterization of the compounds present in the surface of the samples, it was complemented with the use of a Renishaw inVia Raman spectrometer, joined to a Leica DMLM microscope. The spectra were acquired with the Leica 50× N Plan (0.75 aperture) objective. Besides, for the visualization and focusing, another Leica 5× N Plan (0.12 aperture) and a 20× N Plan EPI (0.40 aperture) objectives were used. The spatial resolution for the 50× objectives was 2 microns. For the focusing and searching of the points of interest, the microscope implemented a Prior Scientific motorized stage (XYZ) with a joystick. A 785 nm excitation laser was used (diode laser, Toptica). The power at the source of this laser was 300 mW, being the maximum power at the sample 150 mW. In all the measurements, the power of the laser was reduced in order to avoid the photo-decomposition of the samples (burning) using neutral density filters. For each spectrum, 20 s were employed and 5 scans were accumulated with 10% of the maximum power of the laser in the spectral window from 150 cm−1 to 1200 cm−1. The spectrometer was daily calibrated using the 520.5 cm−1 Raman band of a silicon chip. Data acquisition was carried out using the Wire 4.2 software package (Renishaw, Gavà, Barcelona, Spain). To interpret all the Raman results, the acquired Raman spectra were compared with Raman spectra of pure standard compounds collected in the e-VISNICH dispersive Raman database [36] and with free Raman databases (e.g., RRUFF [37]) for the assignation of Raman bands. For spectral treatment and analysis, Wire 2.0 (Renishaw, Gavà, Barcelona, Spain) and OMNIC® Version 7.2 software Thermo Nicolet (Madison, WI, USA) were used.
Finally, the color of the test-pieces was measured with a tristimulus colorimeter PCE-CSM 5 (Metter Toledo, Greifensee, Switzerland), using CIELAB color space corresponding to an observer of 10°, illuminant D65 and an 8°/d geometry. In this way, L, aand b parameters were measured. L is the lightness parameter, which registers the values from 0 (black) to 100 (white), and a and b are Cartesian chromatic parameters. The former is from green to red, while the latter is from blue to yellow. The measurement was carried out on the surface that had been in contact with the environment.

3. Results and Discussion

Table 2 summarizes the average values of the measured parameters for each period in the two environments of water. The pH was quite stable in the two environments, with values ranging from a minimum of 8.02 to a maximum of 9.07 (in seawater) and from a minimum of 10.26 to a maximum of 10.71 (in tap water). Although the rest of the parameters were quite stable too, a decrease was observed for the period of 18 months. However, there was no identified relation between these parameters and the chemical composition.
Moreover, the results of the elemental analysis are shown in the Supplementary Materials (Table S1) and the repeatability (RSD%) for each type of paste (PT, PF, AP) is shown in Table 3. The repeatability was calculated using the equation
RSD   % = 100 s x ¯
s is the standard deviation of the results of the three test-pieces (850 °C, seawater, 18 months) for each type of paste (PF, PT, AP) while x ¯ is their mean. In most of the cases, the repeatability was good (with values below 20%). However, in some cases, the repeatability of a component was good for one type of paste but worse for another paste, e.g., CaO, Cu and Pb. The components with a repeatability better than 20% were CaO (AP), Co (PF), Cu (PF, AP), Ni (PT, PF, AP), P2O5 (PT), Pb (PF) and Zn (PT, PF, AP). These facts could suggest that the post-depositional alterations that occurred in each ceramic depended on several factors, such as the position of the ceramic in the environment and the conditions of the environment. It also may suggest that the components with worse repeatability were more prone to varying in a deposition environment.

3.1. ICP-MS Results

The interpretation of the chemical results obtained by ICP-MS followed a statistical procedure following observations on compositional data by Aitchison (1982), Aitchison (2008), Buxeda i Garrigós (1999), and Buxeda i Garrigós and Kilikoglou (2003) [19,38,39,40]. R (Core Team 2019) [41] was the software employed for all the transformations, statistical analyses and data visualization and the routines used are published in a reproducible manner elsewhere. The statistical procedure in this case consisted of using ratios of logarithms obtained by dividing all the components of the dataset by the component that introduced the lowest chemical variability to the entire set of ceramics (see Martín-Fernández et al., (2015) [42] for a thorough discussion on the use of log-ratio principles). In the present study, chemical changes, enrichment and leaching were tested using principal component analysis. Moreover, the compositional heterogeneity was evaluated calculating the compositional variation matrix (MCV), which provides information about the variability introduced by each component into the dataset. It is noted that the analytical variance should originate from natural sources and not from experimental or analytical errors. Since the tungsten carbide cell used to mill the ceramics was a potential contaminator, Co and Ta were removed from the statistical procedure. The reason is that Co is a known binder of tungsten alloys and usually occurs along with Ta traces [43]. Furthermore, Sn, Ni, Cu and Zn were also removed, the first because it showed values under the quantification limit and the rest because they showed low repeatability, which could not have been related to any specific alteration, suggesting that an analytical error could have occurred.
In Figure 2 the compositional variation matrix of the 69 ceramics is shown. The y-axis (τ.i) represents the calculated value for the log-ratio variation for each element in the dataset. Therefore, it provides an estimation of each element contribution to the total variation [40]. Figure 2a shows that CaO was the component that introduced the highest variability to the 69 ceramics dataset, something that was expected because the clays were selected in the function of their CaO amount. Moreover, Figure 2b,c present the MCV of 23 PT and PF samples (twenty test-pieces and three control-pieces), showing that the components that introduced the highest variability were Pb and Na2O. Additionally, Figure 2d presents the MCV of 23 AP samples, and in this case, Na2O was the component that introduced the highest variability in addition to CaO.
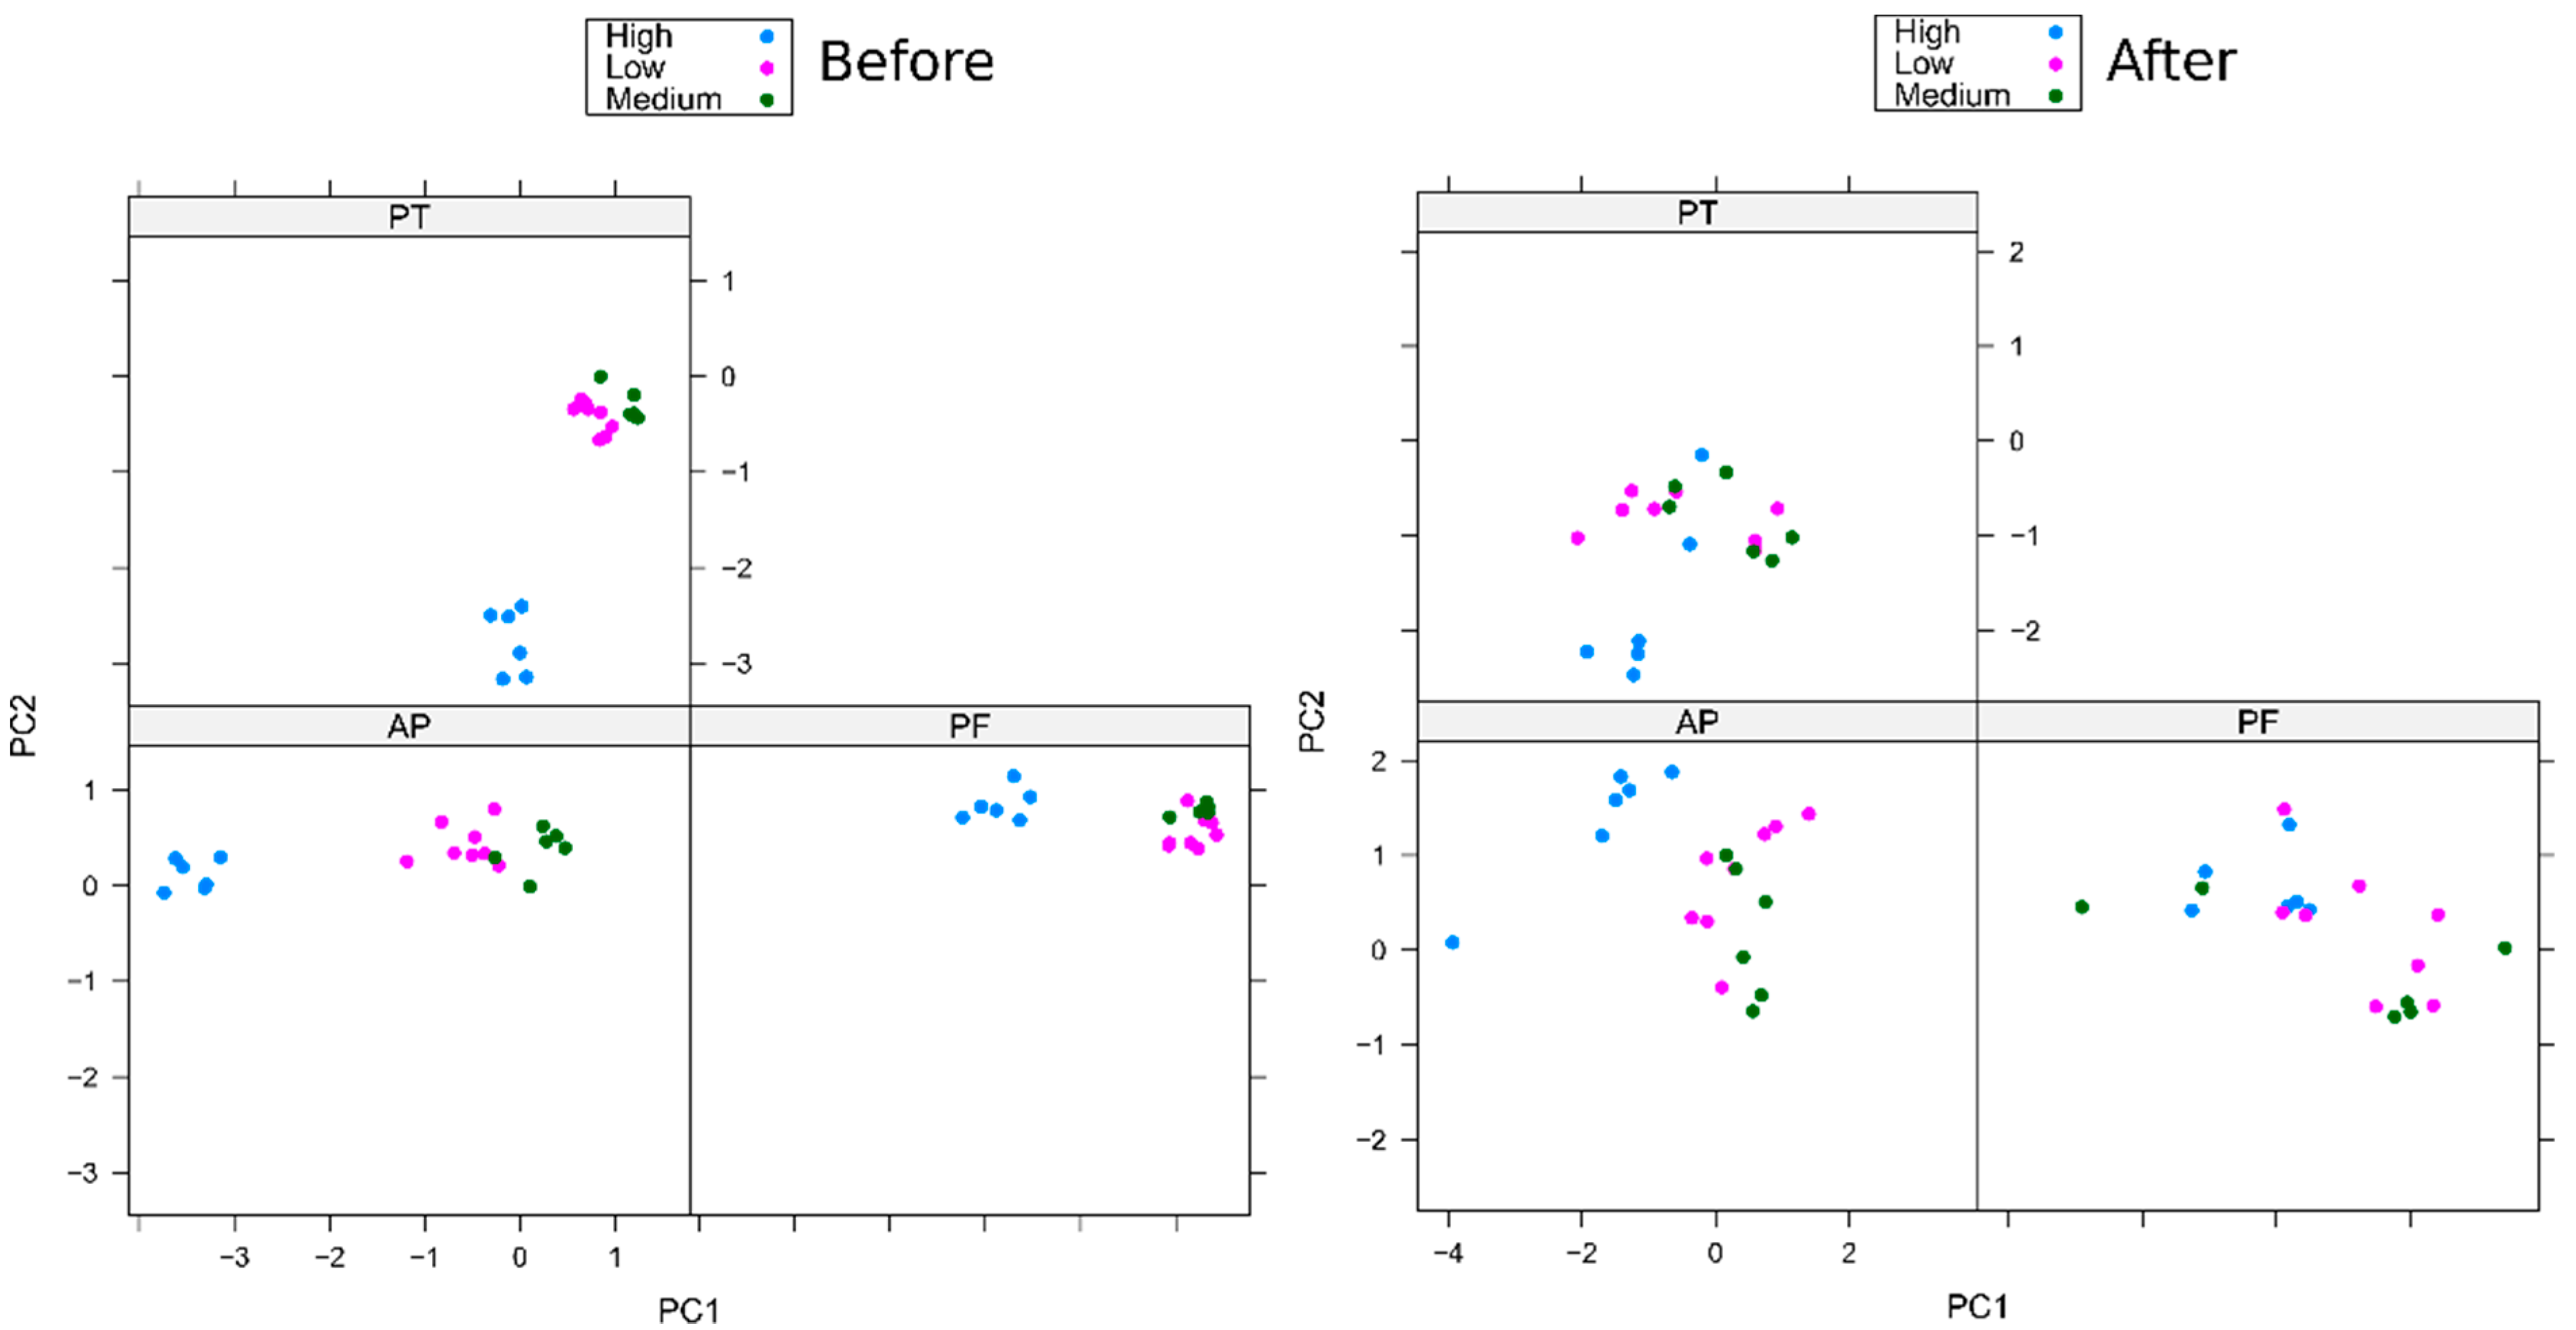
In addition, in Figure 3, four PCAs (Principal Component Analysis) are shown, with samples labelled as L, M and H; L means that those samples were fired at low temperatures (850 °C), M at medium firing temperatures (950 °C) and H at high firing temperatures (1100 °C). Figure 3a presents the PCA of 69 samples, in which a clear differentiation of the three type of pastes can be seen. On the one hand, the raw material of PT samples contained more CaO than the other samples (around 14%, as is presented in Supplementary Materials (Table S1), so it was expected that PT samples would orient themselves that way. In addition, PT samples seemed to contain more Sr, Ba and Na2O too. As can be seen in Figure 2, Na2O was the component adding more variation in the three pastes, but Figure 3a shows that PT pastes were those that contained more Na2O. Ceramics can be enriched in sodium because this element is present in both terrestrial and marine environments [6], or due to the formation of analcime or precipitation of halite in the paste [4,10]. Barium and strontium can also be absorbed in the surfaces or barium can be precipitated as barite (BaSO4) and strontium as carbonate, sulphate, borate, phosphate or halide [6]. Moreover, PF samples contained more MgO, MnO and P2O5 than the other samples, while AP samples contained more Cs, Rb, Fe2O3 and trace elements, related to their micaceous paste. It is common to detect an enrichment of magnesium in ceramics buried in marine environments [3,6]. Manganese also may accumulate on ceramics during burial, and they have the tendency to precipitate as oxides [6]. In addition, phosphorous is commonly identified, adsorbed in ceramics buried in both terrestrial and marine environments [11,12,13,35]. Figure 3b shows the PCA of PT samples, for which Pb has been omitted because there was no specific reason for its high variability. In this PCA, the three marine samples and one tap sample fired at high temperatures (1100 °C) were the samples that contained the most Na2O. Additionally, samples fired at the lowest temperature were those that contained more Nb, suggesting that this type of less vitrified samples absorb more Nb. Moreover, control-pieces are nearer to tap water samples than to marine samples, suggesting that more changes occurred in the marine samples. Regarding the Figure 3c,d, they show the PCA of PF and AP samples (Pb has been omitted in PF PCA). In both PCAs, the remarkable fact was that tap samples seemed to contain more CaO, and, in the case of PF, the samples were those fired at the highest temperature. A deeper discussion will be given when the XRD analyses and SEM–EDS analyses are explained.

3.2. Results of the Colorimeter

The results of the colorimeter before and after the immersion are shown in Figure 4. They indicate that the color of the samples fired at the maximum temperature (1100 °C) differed from the color of the rest of the samples, before being immersed. The colors of the samples fired at the low (850 °C) and medium (950 °C) temperatures were more similar to each other before the immersion than after immersion. However, after the deposition in a water environment, it seems that the salt precipitated in the surface of the samples minimized the differences mentioned, making the color more homogeneous. This fact reflects the importance of cleaning the samples before their analyses.
After the chemical analyses and color measurements, 69 pieces were analyzed by XRD and SEM–EDS technique. For SEM–EDS, 69 freshly fractured surface ceramics were prepared. The results were interpreted through the comparison between the test- and control-pieces for each paste type. On the one hand, the XRD results show the mineralogical composition of the ceramics, which have been studied in relation with the SEM–EDS results. On the other hand, the SEM examination provides information about the internal morphology developed during the original firing, the extent of vitrification and pore structure [44]. This also enables the study of the appearance of any concretion or alteration due to the post-depositional period. Besides, through the EDS analyses, the elemental microanalysis can be carried out.

3.3. XRD Results

First, raw clays were analyzed by XRD for comparison purposes (Table 4).
Regarding PT samples, there were some mineralogical differences between the PT control-pieces, which were due to the firing alteration processes, as they were fired at different temperatures (Table 5).
The first clear difference was the disappearance of illite (clay mineral) with the increase in firing temperature. This phenomenon occurs because the clay minerals lose the water they contain, so their lattice structure collapses and the clay minerals start to break down, forming new silicates [9]. Although kaolins were not present in the ceramic, they probably were present in the raw material. The dihydroxylation of kaolinite occurs at 400–500 °C and metakaolinite is formed. Then, at around 900 °C, alumina-rich spinel (MgAl2O4) starts to form from this metakaolinite and at 1000–1100 °C it crystallizes into mullite (3Al2O3·2SiO2). Mullite exists in needles or rod-like crystals, reinforcing and strengthening the fired piece [9,46,47]. The presence of mullite is interesting in this context because, in general, when small amounts of carbonates are present (<10%) in high-calcareous clays, the mullite formation is inhibited and Ca-silicates are formed. However, depending on the concentration of Al2O3 in the samples, and if the amount of carbonates is higher than 10%, mullite can be formed. El Ouahabi and collaborators (2015) [48] identified mullite in a high-calcareous ceramic, whose Al2O3 concentration was 14.6%. The PT ceramics had 14.2–15.8% Al2O3 content, which justifies the presence of mullite in these ceramics. The diffractogram of PT-09 control-piece, in which mullite was present, is shown in Supplementary Materials (Figure S1).
Additionally, calcite was present in the sample fired at lower temperature, and it disappeared in the other samples, while gehlenite (Ca2Al2SiO7) and diopside (Ca(Mg,Fe)Si2O6) appeared. The decrease in calcite is due to its decomposition at approximately 600–900 °C, forming lime (CaO) and carbon dioxide gas (CO2), according to the following reaction [9,20,23,49].
CaCO 3 650 900   ° C CaO + CO 2
Then, the CaO reacts, depending on the firing temperature, the duration of the firing, the granulometry of the carbonate fragments or their crystalline structure, with the clay minerals present in the body to form Ca-silicates and aluminosilicates such as gehlenite, anorthite (CaAl2Si2O8) (which increased with the firing temperature in the control-pieces) and diopside [23]. This is why diopside, plagioclase (e.g., anorthite, albite) and gehlenite appeared in the control-pieces fired at higher temperatures.
In addition, Heimann and Maggetti (1981) [2] described the reactions for the alterations of gehlenite to form anorthite at temperatures close to and above 1000 °C.
Al 2 SiO 7 + 2   SiO 2 CaAl 2 Si 2 O 8 +   CaSiO 3
  Ca 2 Al 2 SiO 7 + 3   SiO 2 + Al 2 O 3 2   CaAl 2 Si 2 O 8
These reaction paths can explain the increment of anorthite and the decrease in the amount of gehlenite in PT-09 (fired at 1100 °C). Additionally, the amount of hematite also increased with temperature. The reason for this could be that hematite may crystallize due to the decomposition of calcite in the presence of quartz and Fe-bearing clay minerals [50]. The carbonates decompose to produce calcium silicates reacting with the amorphous phase. Thus, hematite can nucleate and grow.
When it comes to the XRD results of marine PT test-pieces (Table 5), samples fired at 850 °C (PT001, PT002, PT003), had a greater amount of calcite and gehlenite in PT001 (3 months of burial). The decomposition reaction paths of calcite and gehlenite due to the post-depositional period could support the findings of their lower amounts in the pieces with longer deposition periods [2,20,49]. The amounts of Qz, Pl, Kfs and Ilt were similar in all the samples, but the presence of gypsum (CaSO4·2H2O) in PT002 and PT003 marked the most important difference between these samples. The presence of gypsum is associated with the pyrite formation in reductive marine environments or to the dissolution of calcite and reaction with sulphate, in an acid environment [4]; however, these were not the case because the marine environment of the experiment was oxidizing and both environments were basic. Therefore, the presence of gypsum might be associated with the raw material, although in very small amounts, given the lack of the successful identification of such a compound in their diffractograms, thus, the most probable source was the precipitation of sulfate from the seawater. Additionally, for samples fired at 950 °C (PT009, PT010, PT011), calcite appeared in PT009, and the amount of Qz, Pl, Gh, Hem, Kfs and Ilt were similar in all the samples. Calcite should not appear in PT009 because it was not present in the control-piece PT-05. However, the CaO that did not react could have recarbonated to CaCO3 [8,20,49,51] and at a basic pH (higher than 7–8) it precipitated [6]. First, it reacts with the water to give calcium hydroxide (Ca(OH)2, portlandite) and, then, portlandite reacts with CO2 leading to the formation of calcite, according to the next reaction path [49].
CaO + H 2 O Ca OH 2
Ca OH 2 + CO 2 CaCO 3 + H 2 O
Gehlenite appeared in a smaller amount than in the corresponding control-piece (PT-09), probably due to the alteration of gehlenite to form anorthite. In addition, mullite was not present in PT017, possibly making visible the fact that factors such as the firing of ceramics in the kiln were subjected to variations. It could be that the amount of carbonates in this particular sample was lower than in the rest of the samples due to the mentioned variations, so mullite was not formed [48].
Finally, in samples fired at 1100 °C (PT015–017), analcime (NaAlSi2O6·H2O) appeared in all of them. Buxeda and collaborators (2002b) recorded in calcareous ceramics fired at temperatures above 1000 °C, an increase in the concentration of Na and sometimes of Mg and Sr, and a decrease in the concentration of K and Rb, under certain burial conditions [10,16]. Several studies [10,19,21] have documented the formation of analcime mineral, also known as analcite, as the reason for these facts. Buxeda and colleagues (2002b) explain from the observations of Picon (1976) that, depending on the firing temperature, a glassy phase is formed in the ceramics [10,24]. This glassy phase contains a large part of the overall K of the shard, which is leached with Rb from the ware during the burial because of the instability of the glassy phase under certain weathering conditions. Then, analcime crystallizes from the remaining silicate material by the fixation of Na from the burial environment [2,10,15,19,22]. This fact can be seen in the ceramics immersed in marine water, with high concentration of Na, which explains why analcime is found in those ceramics but not in the similar ceramics immersed in tap water. Moreover, this fact is in accordance with the PCA shown in Figure 3b, in which those marine samples fired at 1100 °C were the samples that contained the most Na2O.
Regarding the XRD results of tap water PT test-pieces (Table 5), no change was identified in the phases of the samples of different burial periods, probably because tap water is not as aggressive as marine water. Wollastonite was the new phase that appeared in PT pieces, specifically in PT019. This mineral is a high-temperature secondary phase, which crystallizes from Ca-rich clays [52].
Regarding the PF test- and control-pieces, Table 6 shows the mineralogical differences that occurred in the control-pieces due to the firing alteration processes.
These mineralogical changes were very similar to the changes that occurred in PT control-pieces. The differences were the appearance of mullite in PT samples but not in PF samples as well as the presence of cristobalite, spinel and larnite in PF samples (unlike in PT samples). The alteration paths for the calcite, gehlenite, hematite, plagioclase and diopside mineral phases are the same as those explained in the PT control-pieces section. Moreover, cristobalite, a polymorph of quartz, appears in PF-09 (1100 °C), due to the inversions that occur in quartz at high temperatures and, in addition, larnite, a calcium silicate (Ca2SiO4), and alumina-rich spinel (MgAl2O4), appeared due to high-temperature alterations of clay minerals [9]. The diffractogram of PF-09 control-piece, in which larnite was present, is published in Supplementary Materials (Figure S1).
When it comes to the XRD results of the marine PF test-pieces (Table 6) fired at 850 °C (PF001–003), the amount of calcite and gehlenite was greater in PF001 (3 months of immersion) than it occurred in PT samples fired at 850 °C for the reasons explained above. Additionally, for samples fired at 950 °C (PF009–011), calcite appeared in PF009 due to the recarbonation of CaO, as in the PT009 sample, and the amounts of Qz, Pl, Gh, Hem, Di, Kfs and Ilt were similar in all the samples. Finally, for samples fired at 1100 °C, plagioclase and hematite were higher in PF017 (18 months of burial). The reason for the greater amount of plagioclase could be, as has been aforementioned, the alteration of gehlenite to form anorthite. Qz, Spl and Di were in similar amount to the rest of the samples and Ilt disappeared. Crs was not detected in these samples as it may have not developed during firing, and larnite appeared in PF015 and PF017 but not in PF016.
Results of the PF test-pieces immersed in tap water were almost the same as those of the PT test-pieces, thus, very few changes were identified in the phases of the samples of different burial periods (Table 6).
Regarding the micaceous (AP) test- and control-pieces, Table 7 shows that there were some mineralogical differences between the AP control-pieces due to the firing alteration processes. The first clear difference was the presence of mullite in high-fired ceramics, as in the PT pieces. In addition, the amount of hematite increased with temperature. This phenomenon also occurred with PT and PF samples. Similarly, corundum (Al2O3) appeared in AP-09, due to high firing temperatures.
When it comes to the XRD results of marine and tap water AP test-pieces, it is noted that there were no significant differences either in the phases (that is, all the samples had the same phases as their corresponding control-pieces) or between samples with different immersion periods. The existing differences between the samples were those that corresponded to the firing temperatures, shown in Table 7.

3.4. SEM–EDS Results

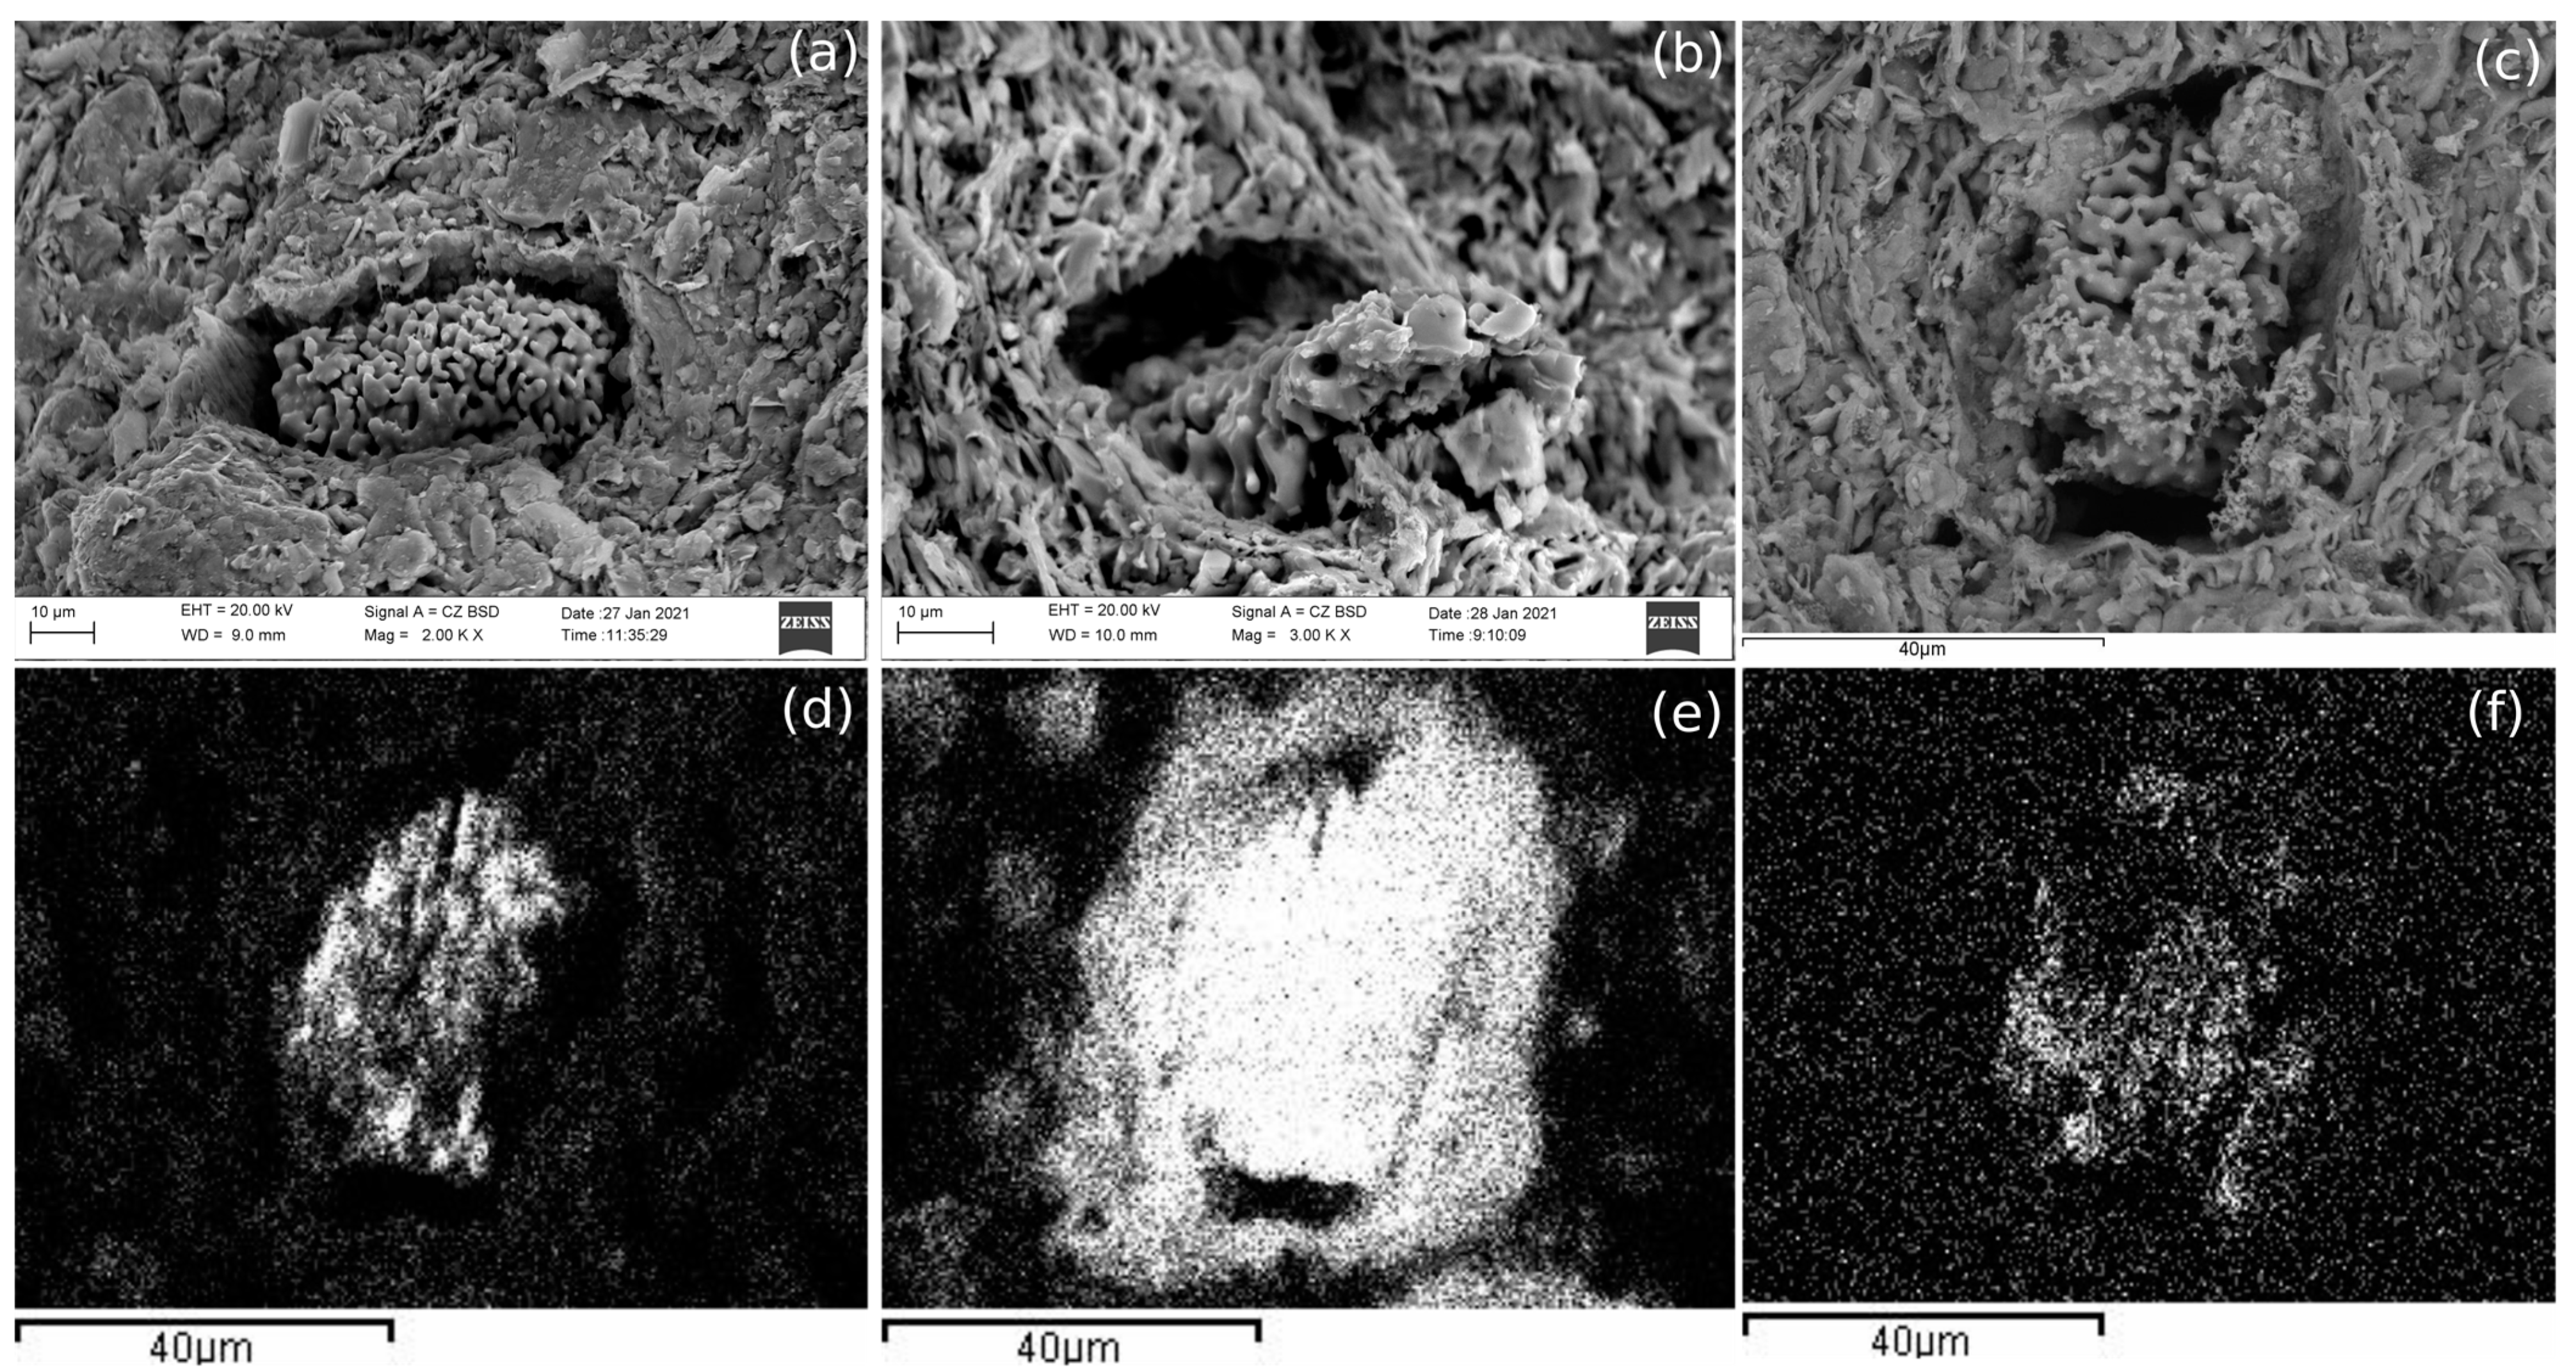
Regarding the SEM–EDS analyses for the control-pieces of the three type of samples, first, the control-pieces fired at 850 °C (PT-01, PF-01 and AP-01) showed an early initial vitrification in accordance with their firing temperature, due to the appearance of isolated smooth-surfaced areas (Figure 5a–c). Additionally, PT-05, PF-05 and AP-05 (fired at 950 °C) showed a medium vitrification (Figure 5d–f) and those fired at 1100 °C (PT-09, PF-09 and AP-09) showed a continuous vitrification (Figure 5g–i) due to the formation of a continuous smooth vitrified layer over the whole fractured surface [44]. In PF, mineral phases of different sizes were identified. By EDS analyses it is known that these mineral phases were mainly composed of Si, O, Ca, Fe, Mg, Al, K and, sometimes, Ti, suggesting, according to XRD results, the presence of quartz, potassium feldspar, illite, calcite, hematite, gehlenite, plagioclase, cristobalite and diopside, among others. Furthermore, the EDS analyses of the PT control-pieces revealed the high presence of calcium and magnesium in the three control samples. These elements can appear in the form of carbonates, oxides and silicates, among others. Additionally, S and Cl were present in PT-05, demonstrating that those elements had their origin in the raw material. In this case, S may be associated with gypsum, supporting the presence of gypsum in the XRD analyses of PT002 and PT003 test-pieces. Finally, it was observed that AP pieces contained long and plane mineral phases, which formed a laminar structure within the ceramic paste, likely from the mica group. The pieces fired at 850 °C kept this laminar structure, while the samples fired at 1100 °C did not so much because they showed a continuous, smooth vitrified layer. EDS analyses showed that these mineral phases were mainly composed of Si, O, Fe, K, Al, Mg, Ca, and, sometimes, Ti, suggesting, in agreement with XRD results, the presence of quartz, potassium feldspar, illite-muscovite, and hematite, among others. It was also noted that Ca and Mg seemed to be related. Additionally, the EDS analyses of AP-05 showed, as in AP-01, mineral phases composed of Fe, Ca, K, Mg, C, Al, Ca, O, Si, Ti and, in some cases, S and Mn, in agreement with the presence of quartz, potassium feldspar, illite and mullite, according to XRD analyses. Although calcium carbonates and silicates were not identified by XRD, probably due to their lower amount, some aggregates were recognized by SEM–EDS, but in lower amounts than in PT and PF samples.
Additionally, the SEM and EDS analyses of test-pieces were very diverse and mineral forms such as needles, flakes, sponges and long and short prisms, were found, mostly in PT and PF samples. Regarding the SEM–EDS analyses of AP marine and tap water test-pieces, it was noted that, in comparison to PT and PF pieces, AP pieces showed much fewer aggregates inside their pastes. Contrary to what would be expected, in AP, more secondary phases were identified in samples fired at high temperatures than in those at low temperatures, even though the pastes fired at low temperatures were less porous. Perhaps the reason for this is that the laminar structure that the pastes contain makes it difficult for solutions from the environment to access, and therefore, may block the formation of the secondary phases. On the contrary, it is likely that the vitrification of AP samples helps to form canals through which solutions from the environment can access.
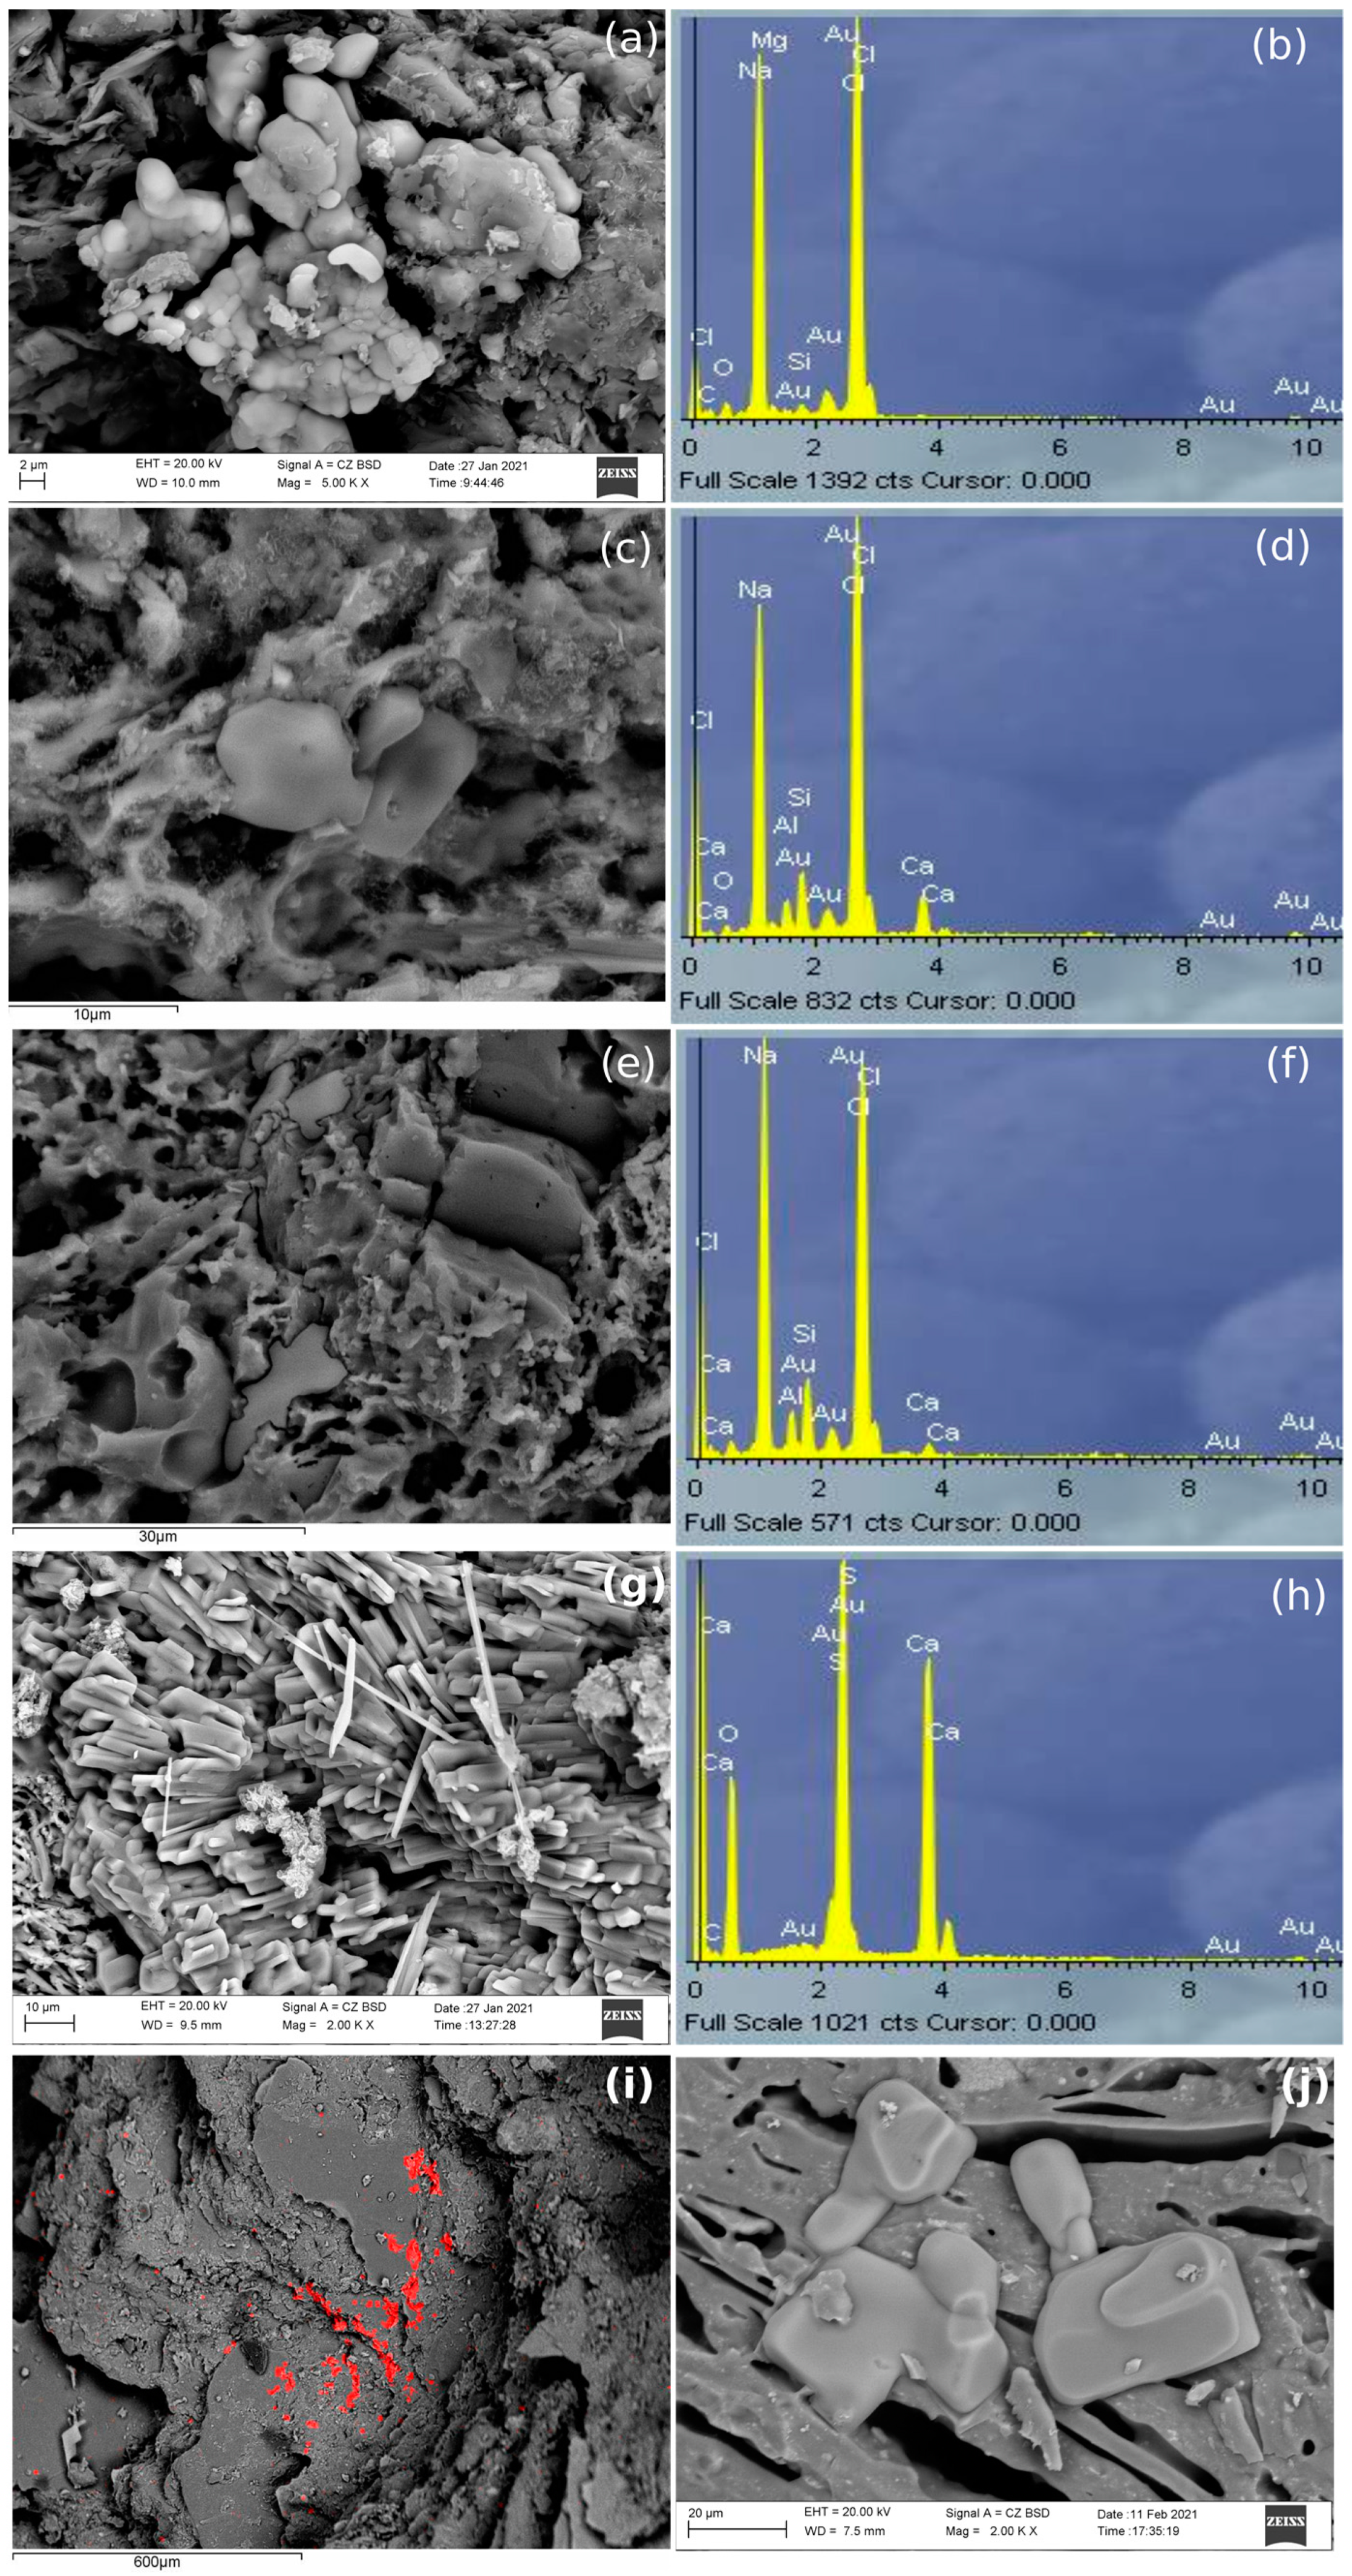
Marine samples of the three pastes showed some crystallizations containing Na, Cl and S (Figure 6). These crystallizations could correspond to NaCl (halite) and calcium sulphate, both in most of the cases precipitated from seawater. However, there is a possibility that gypsum in some PT and AP samples was coming from the raw material because S was identified by EDS analyses in control-pieces. While in PT and PF samples, it seems that these aggregates were formed in cavities, in AP they seemed to rest on top of large mineral phases, suggesting that the movement of the water could have been of laminar flux instead of percolation. However, as an exception, marine AP samples fired at 1100 °C showed NaCl aggregates in the cavities formed in the vitrified pastes. However, AP samples submerged in tap water and fired at 850 °C and 950 °C did not show any newly formed aggregate, being similar to the AP control-pieces, since tap water does not contain enough salts to penetrate in the pastes.
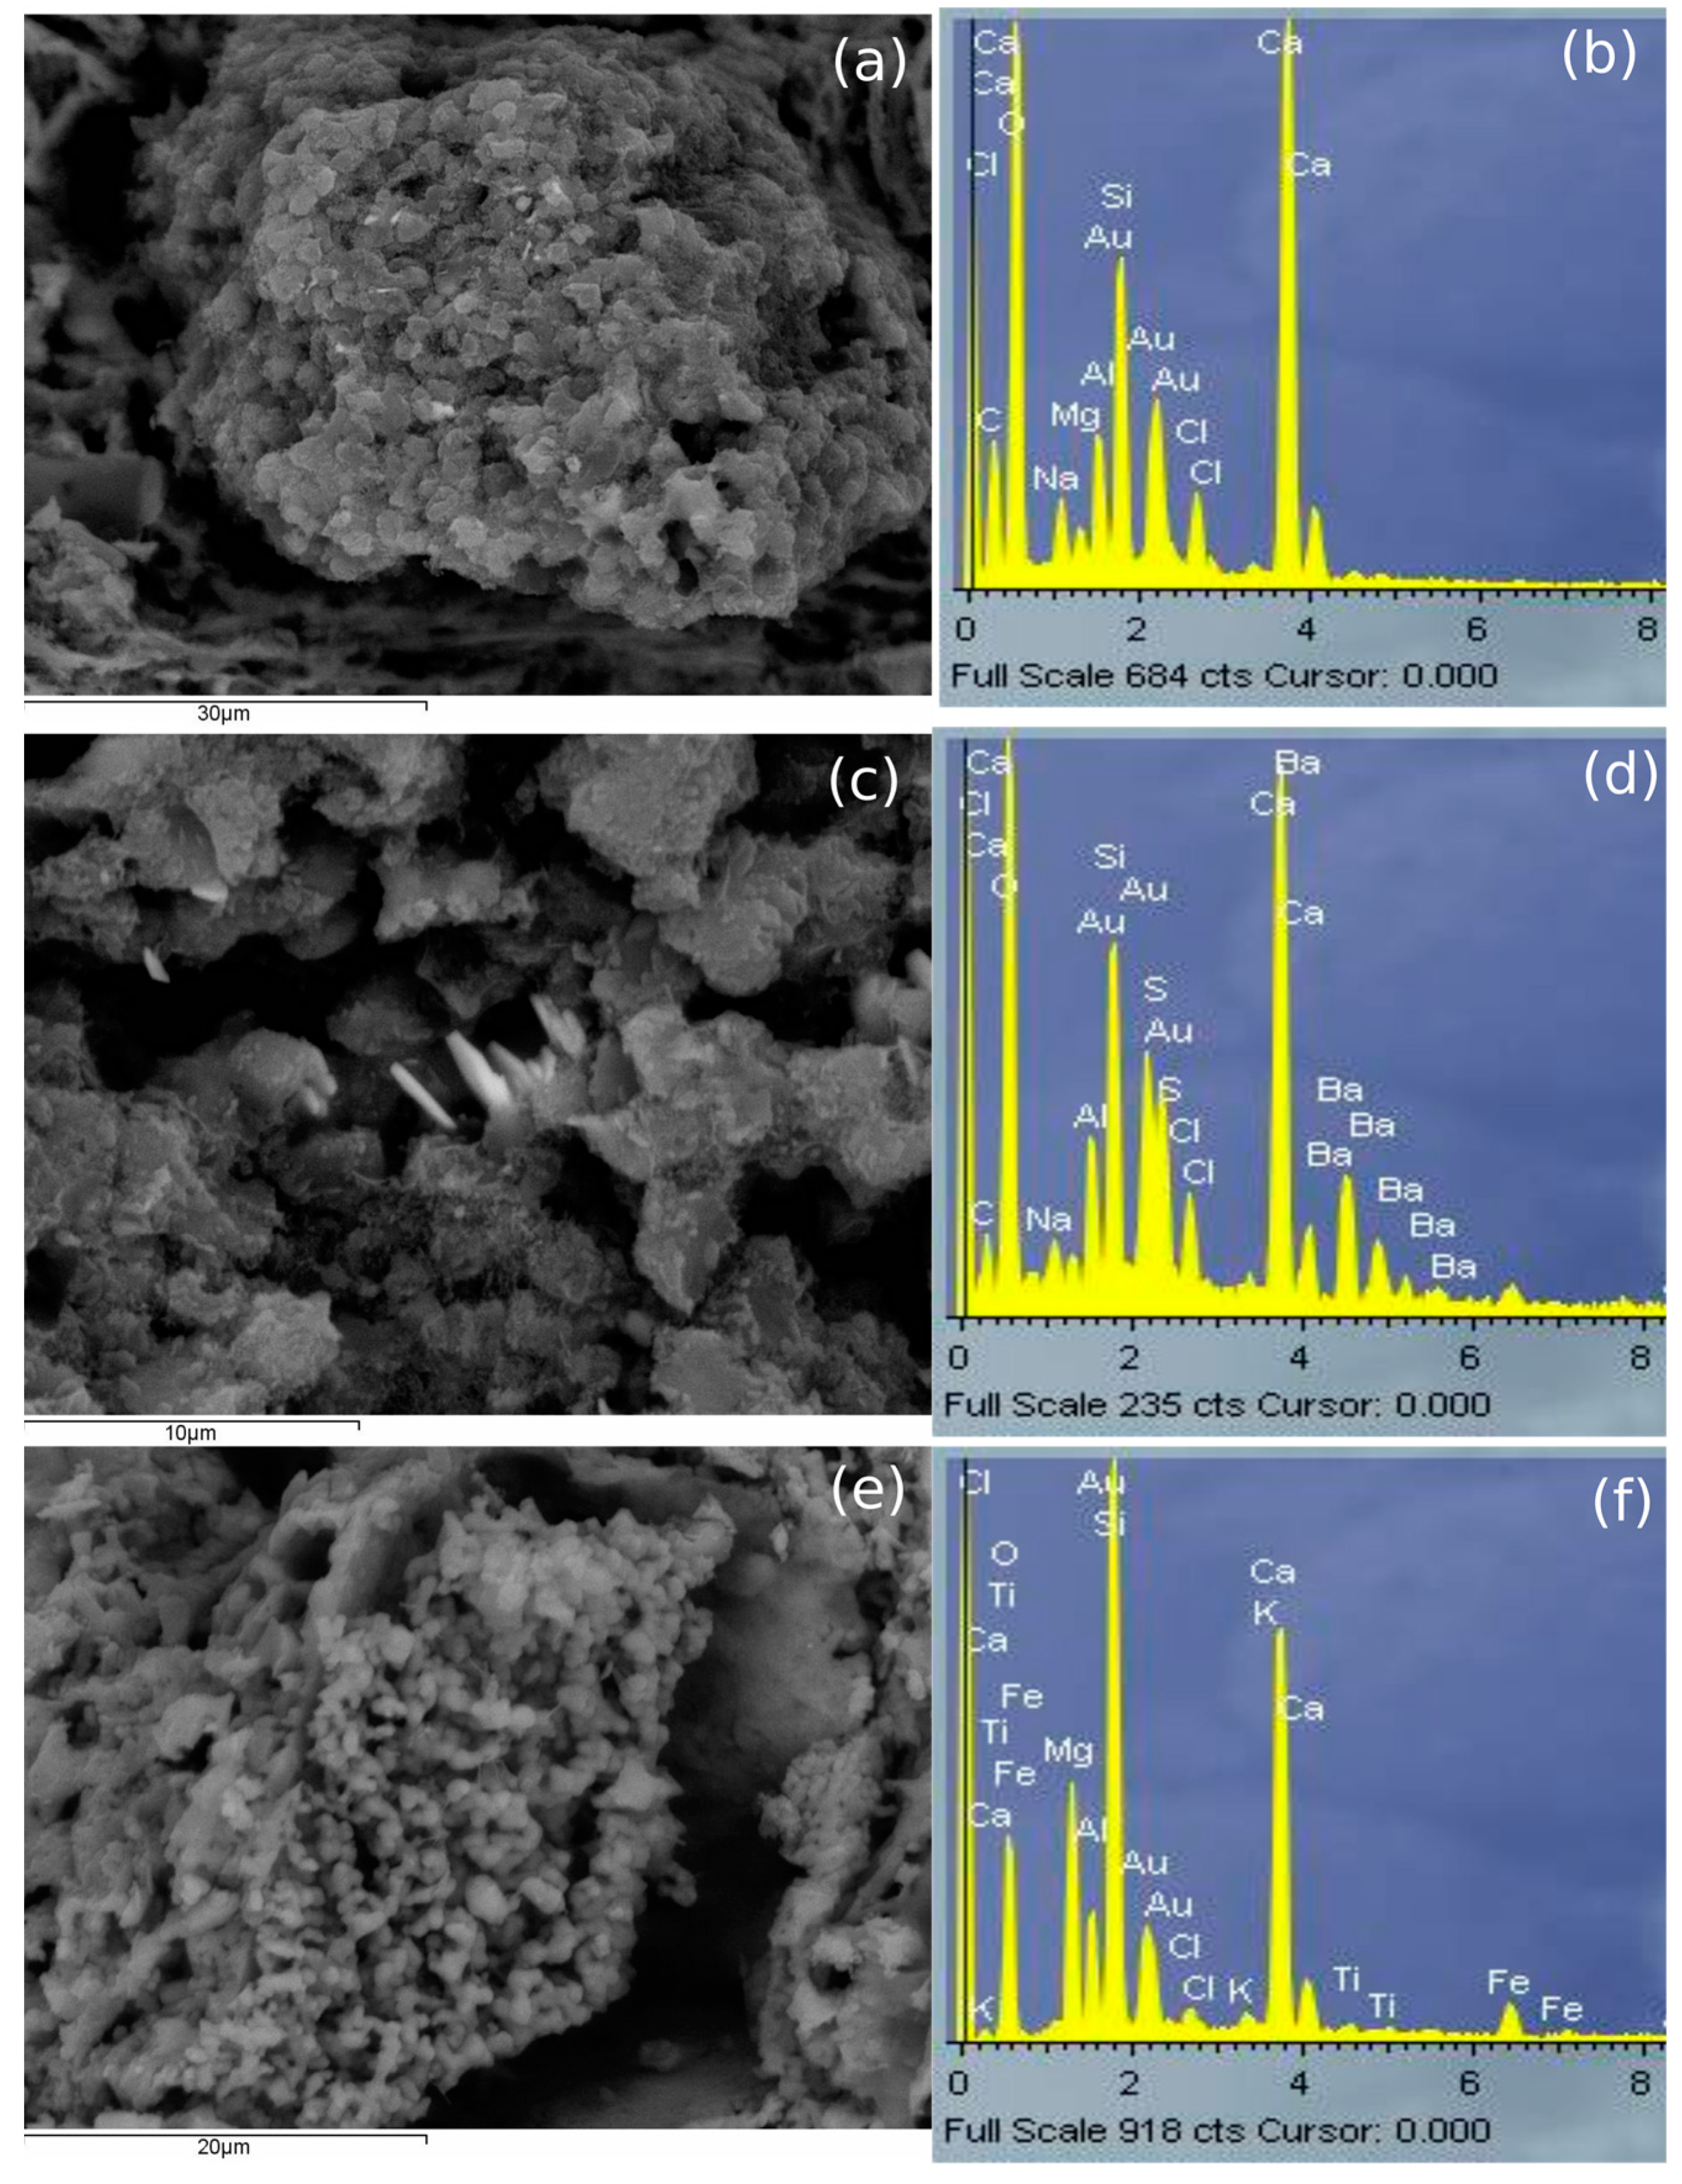
Additionally, Figure 7 shows one of the crystallizations identified in both PF and PT samples submerged in marine and tap water environments. These crystallizations mostly appeared in PF tap water samples, but were also present in marine and tap PT samples. They were similar to sponges and were composed mainly of Ca and F, appearing principally in cavities. In addition, Mn was identified in the extremities of this aggregate, as well as elements such as Ca, O, C, Al and Si (probably related to calcium silicates) around these cavities.
According to Thomas and collaborators (1977) [53], fluorine is an element that can be present in raw clays. García-Ten and collaborators (2006) [54] explain that, during the ceramics firing, the fluorine ion replaces OH groups present in the crystalline structure of mica and other clay minerals (such as illite or montmorillonite). This reaction leads to the formation of hydrofluoric acid (HF) and silicon tetrafluoride (SiF4), among others. These compounds are released during firing between 500–700 °C. However, in high-calcareous ceramics, HF can react with calcite to form fluorite (CaF2). Additionally, De Bonis and collaborators (2014) [55] reported newly formed cuspidine [Ca4Si2O7(F,OH)2] at the edges of silicates (such as feldspars and quartz) in contact with fluorite-based carbonates, in ceramics fired from 850 °C to 1100 °C. The authors proposed the next reaction path for cuspidine formation.
3 CaO + 2 SiO 2 + CaF 2 Ca 4 Si 2 O 7 F 2
Therefore, the sponge-like structures of these samples may be cuspidine. The presence of Mn in the extremities of the Ca-F aggregate could suggest that, in these cases, the newly formed mineral might be a mineral from the cuspidine group containing Mn, such as normandite [NaCa(Mn,Fe)(Ti,Nb,Zr)(Si2O7)OF]. These newly formed structures may have their origin in calcite. Calcite decomposed to CaO leaving cavities, so cuspidine or normandite may have formed in these cavities. Moreover, it has been noted that it seems that there were more cavities in the tap water samples than in seawater samples. The reason could be that there is more fluorine in tap water environment, so more calcite reacted with fluorine to form CaF2. Additionally, in some cases, these aggregates did not show the same structure; the reason could be their different grade of crystallization. Finally, although AP test-pieces contained F in their EDS analyses, the sponge-like structures were not present. In comparison with what we saw using qualitative SEM–EDS analyses for AP, PT and PF samples, PF and PT samples had much more calcium-containing minerals, so the changes in the pastes were notable. In the case of AP pieces, as they did not contain much calcium, most probably the fluorine of the raw material or of the water solution was unable to react with the calcite.
Moreover, aggregates of calcium carbonate with salts such as NaCl and MgCl2 (present in the environment) and barium sulphate (probably barite, as commented in Figure 3a), were also identified in PT010 sample (Figure 8) as well as a structure that seemed to be formed by Mg and calcium hydroxide or carbonate, in PT016. In addition, calcium containing phases may have existed in AP samples but in such little amounts that was difficult to see them. The exceptions appeared in AP011 and AP014, in which calcium silicate and calcium related to Mg were identified, probably with their origin in calcite and phyllosilicates. Finally, AP samples submerged in the marine environment and fired at 1100 °C showed calcium carbonate or silicate aggregates. 
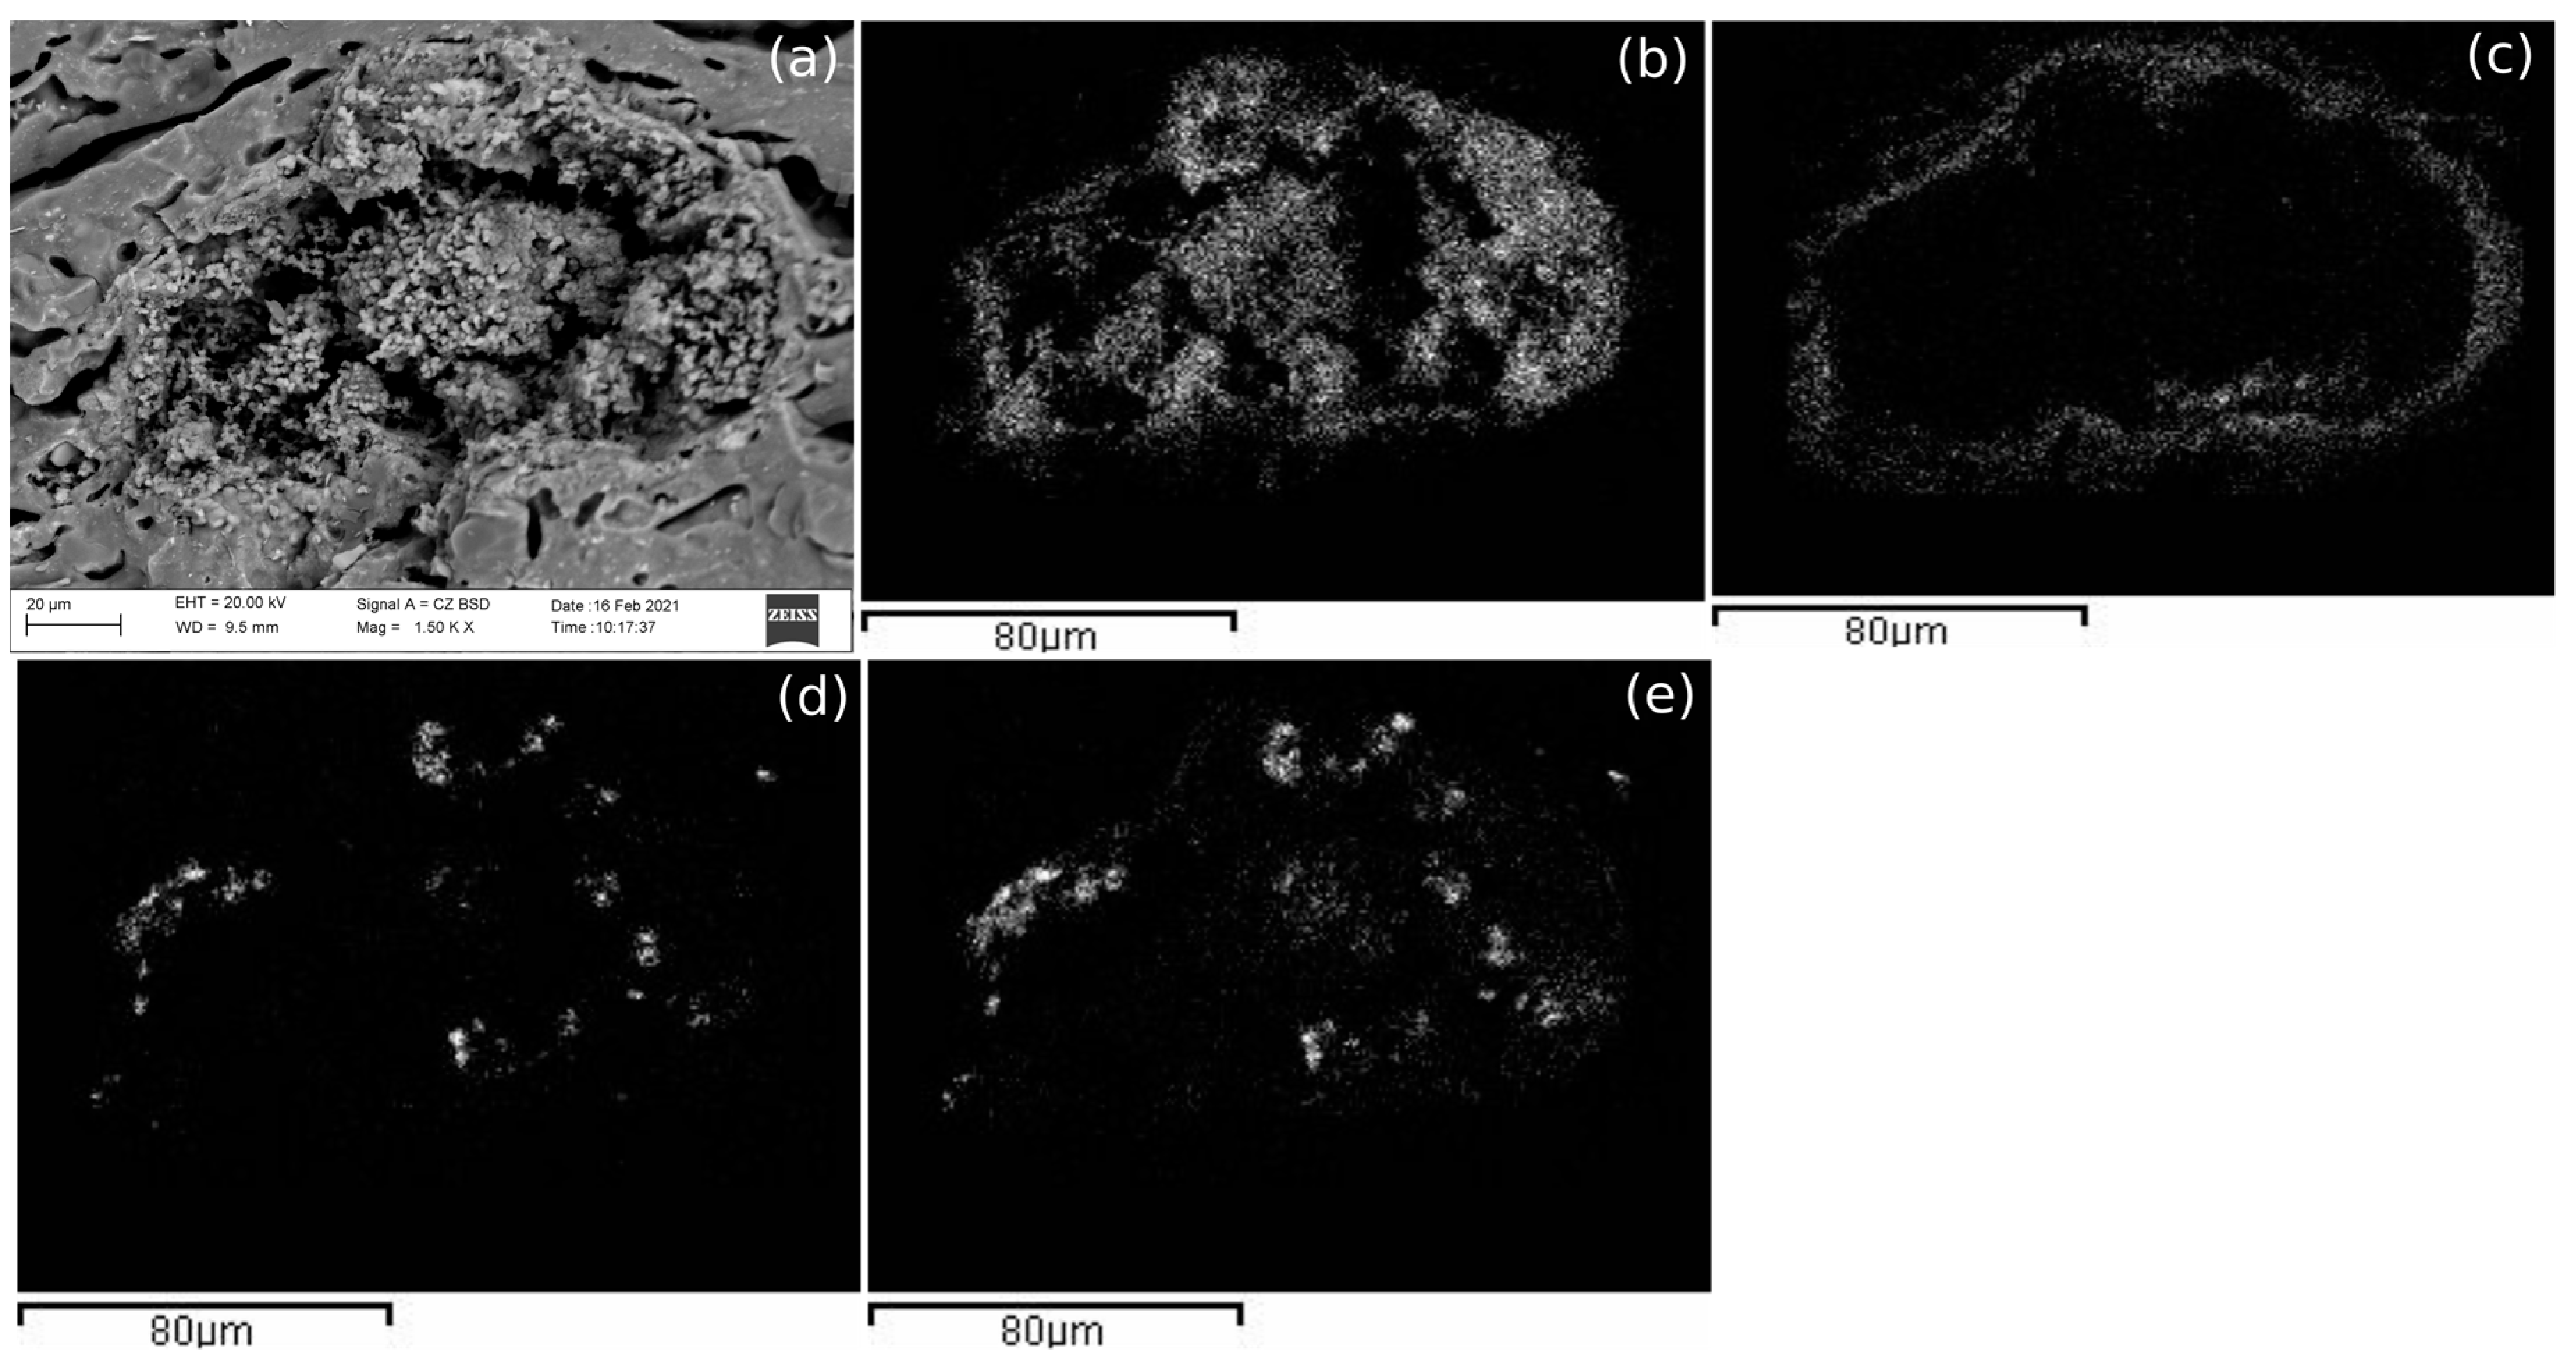
Figure 9 shows an alteration in the paste of one of the AP samples fired at 1100 °C; Mg and O were homogeneously distributed and in the same place there were also some parts composed of NaCl (coming from seawater). This aggregate was surrounded by Ca (which suggests it had its origin in dolomite or in calcite). AP samples submerged in tap water and fired at 1100 °C also showed the same type of aggregates of calcium carbonate or silicates.
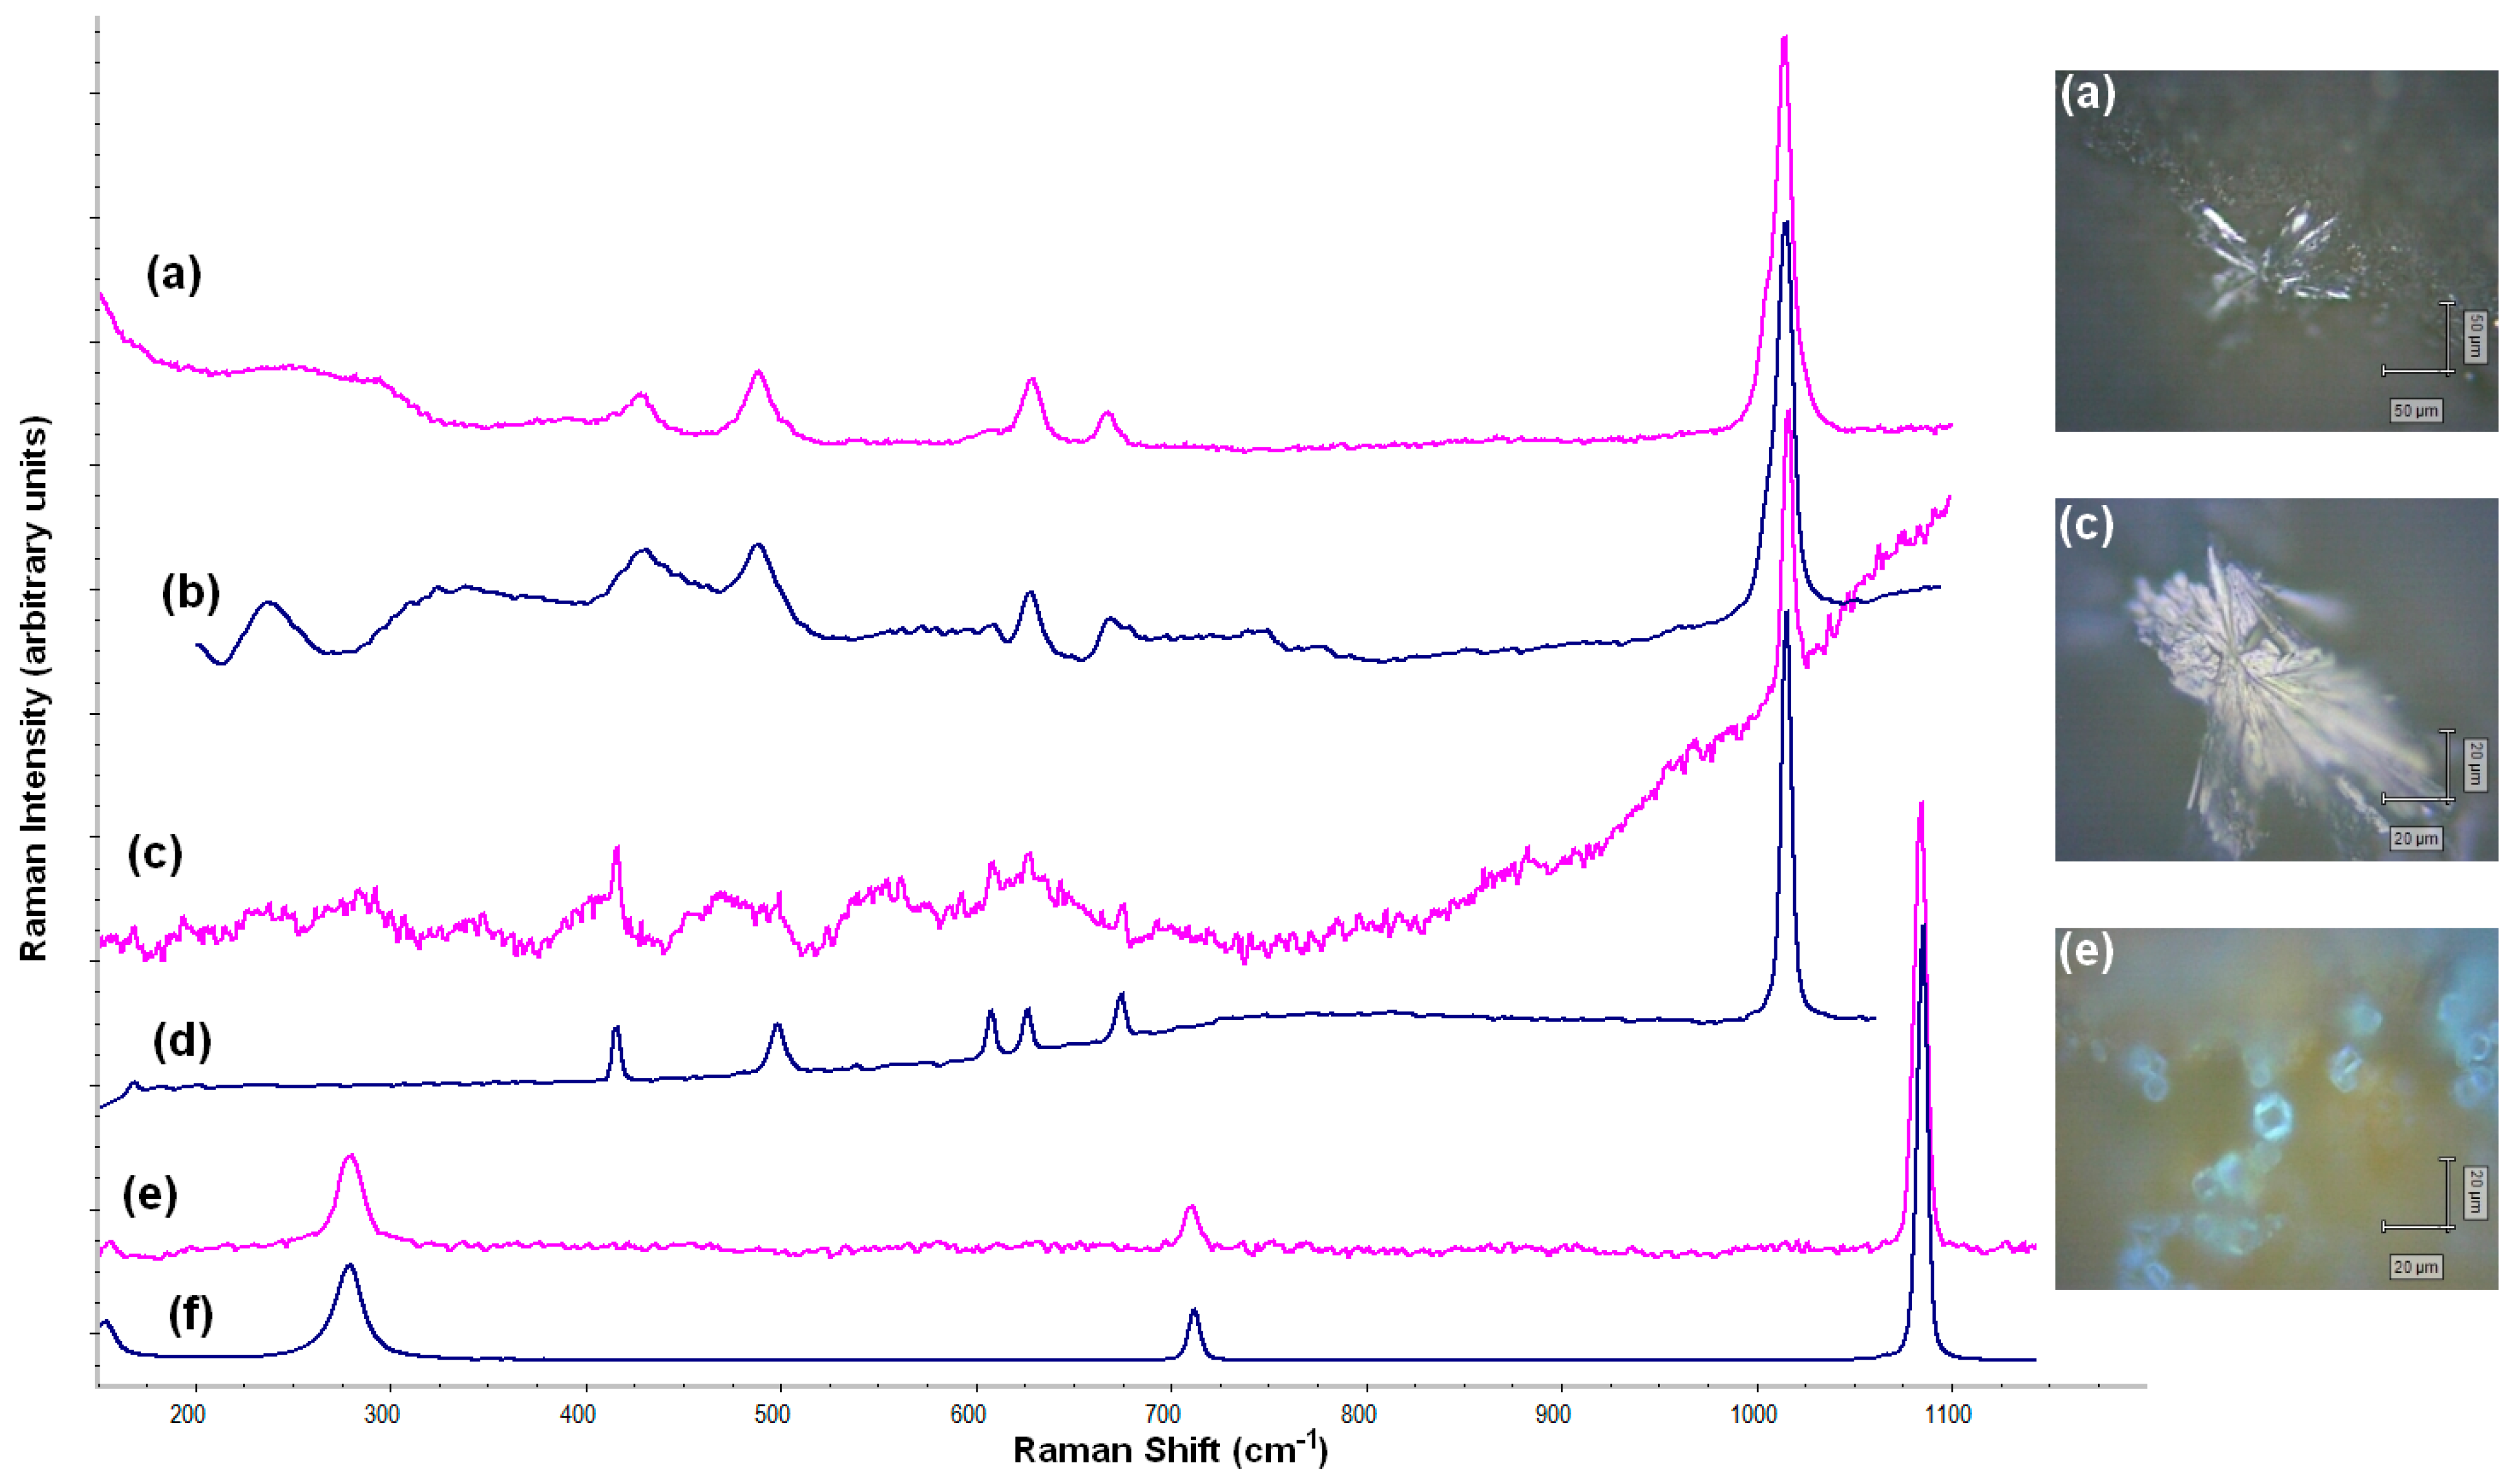
Apart from the paste analyses, the surfaces of PF010 and PF014 samples were analyzed by Raman spectroscopy (Figure 10). The results demonstrated that NaCl and different forms of calcium sulphate were salts that precipitated from the seawater and they rested on the surface of the ceramic. It has been concluded that the aciculate crystals of different forms were calcium sulphate; the former (a) corresponded to anhydrite (CaSO4), while (c) corresponded to calcium sulphate hemihydrate (bassanite) [CaSO4· 1 2 (H2O)]. Probably, there was a mixture of different phases of CaSO4-H2O system, as Prieto-Taboada and collaborators (2014) explained [56]. Additionally, calcite was identified in the paste of PF014 by Raman (e), supporting the hypothesis of the recarbonation of calcite samples fired at 950 °C and 1100 °C.

4. Conclusions

The present work has demonstrated that the modelling of experimental approaches for the research of post-depositional alterations in ceramics could be very useful. Therefore, there are previous experiences on this topic. Along these lines, Bearat and collaborators (1992) [27] studied the physico-chemical alterations of ceramics after their deposition in seawater, Heimann and Maggetti (1981) [2] accelerated the reactions to simulate a real burial period in seawater, Montana and collaborators (2014) [28] and Belfiore and collaborators (2014) [29] carried out an experimental approach to study the alterations and contaminations of ceramics buried in renewed seawater and, finally, Franklin and Vitali (1985) [30] studied the environmental stability of ceramics during burial at ambient temperatures. However, the present experiment studied, simultaneously, alterations and contaminations of manufactured ceramics in both seawater and tap water, accelerating the reactions, for 3, 10 and 18 months. Therefore, this is the first experiment carried out in tap water and simulated seawater to model, simultaneously, alterations in archaeological calcareous and low-calcareous and micaceous ceramics. This work shows the mineral phases that we can expect to find in ceramics that have been buried in similar conditions to the experiment. It also shows that some alterations are common in some of the experiments and in lots of real cases (e.g., recarbonation of calcite). Additionally, even though experimental approaches were similar, new phases were identified in the present study (e.g., CaF2 phase).
Regarding the crystallization of the phases, with this approach it was concluded that, in several samples, the same type of aggregate was identified with different crystallization grades. This fact demonstrates that the crystallization grade, in many cases, is not related to the immersion time. In some cases, samples immersed for less time showed more aggregates, or better crystalized aggregates, than samples immersed for a longer time. Moreover, in PT samples fired at 1100 °C and submerged in the marine environment, a great amount of NaCl aggregates were identified in comparison with ceramics fired at lower temperatures. This is something that was expected to happen the other way round (that is, in samples fired at lower temperatures), as they are more porous. On the other hand, it was demonstrated that the same type of aggregates can occur in very different pastes.
The presence of more NaCl cubes in the samples immersed in the marine environment was also expected; however, although they were identified, other aggregates, such as CaF2, were found in higher amounts. Interestingly, it seems that NaCl did not penetrate as much as expected, precipitating mainly on the surface. This fact is in accordance with Maritan (2020) [6], who documented that the presence of halite has rarely been reported in similar works. In addition, the occurrence of CaF2 is something that should be taken into account in the desalination protocols of the ceramics. According to the literature, desalinization protocols for ceramics routinely include the immersion of these artifacts in big pools with tap water for certain periods of time and/or after checking that the salinity of the water decays to tap water values. However, the tap water available in the majority of countries contains fluorine for public health reasons [57]. Along these lines, fluorine can penetrate into the ceramic clayous structure and can react with calcium, affecting the original elemental composition of the ceramics. This effect might be traceable with the presence of sponge-like structures formed by Ca and F, suggested to be cuspidine or normandite.
Finally, it should be emphasized that the identification of aggregates by SEM–EDS in ceramics depended on several factors, such as which part of the artifact we were analyzing (e.g., handle, rim, bottom); how it had been cut (e.g., parallel or transversal to the wheel-thrown marks of the ceramic pot); in which direction or plane it was observed by the microscope; or, even, if we looked at the inner or outer side of the artifact, because secondary aggregates would not be evenly and homogeneously distributed. Furthermore, it was shown that the repeatability was low for some elements of this experiment. This suggests that, although there is a certain degree of probability of identifying the same type of alterations in real cases of study with very similar conditions to the experiment, these reaction paths are difficult to reproduce, even in controlled conditions. Therefore, it is important to highlight that many other factors may play a role when affecting real archaeological ceramics given their post-depositional context (e.g., water temperature, salinity, open sea or closed harbor with high organic matter amounts), ceramic nature (e.g., calcareous or low-calcareous) and time of deposition. Hence, this work serves as a valuable contribution towards the identification of post-depositional alterations in archaeological ceramics that have undergone a considerable amount of time in a seawater environment, piling up data on the extant literature. In addition, it provides curatorial and conservation stakeholders and researchers with an interesting piece of information regarding the effects on archaeological ceramics after using tap water with a certain amount of fluorine for desalinization purposes.

Supplementary Materials

The following are available online at https://www.mdpi.com/article/10.3390/min11070766/s1, Figure S1: The diffractograms of PF-09 and PT-09 control-pieces; Table S1: Elemental composition of 69 samples.

Author Contributions

Conceptualization, U.S.-G.; methodology, U.S.-G., J.G.I. and G.A.; software, U.S.-G. and J.G.I.; validation, U.S.-G. and G.A.; formal analysis, U.S.-G. and J.G.I.; investigation, U.S.-G., J.G.I. and G.A.; resources, J.G.I. and G.A.; data curation, U.S.-G. and J.G.I.; writing—original draft preparation, U.S.-G.; writing—review and editing, U.S.-G., J.G.I. and G.A.; visualization, U.S.-G. and J.G.I.; supervision, J.G.I. and G.A.; project administration, U.S.-G., J.G.I. and G.A.; funding acquisition, J.G.I. All authors have read and agreed to the published version of the manuscript.

Funding

This research was funded by the Spanish Ministry of Economy, Industry and Competitiveness, the State Bureau of Investigation, and the European Regional Development Fund (MINECO/AEI/ERDF, UE), grant number CERANOR-2 (HAR2017-84219-P).

Data Availability Statement

Data is contained within the article or Supplementary Materials.

Acknowledgments

U.S.-G. thanks the University of the Basque Country (UPV/EHU) for doctoral grant Hiring for Research Training (PIF2017/153). J.G.I. thanks the Spanish Ministry of Economy, Industry and Competitiveness for a Ramon y Cajal contract (RYC-2014-16835). The authors would like to thank Alfredo Sarmiento from Coupled Multispectroscopy Singular Laboratory (LASPEA) from the Advanced Research Facilities (SGIker) of the University of the Basque Country UPV/EHU) for SEM–EDS analysis. The authors also acknowledge Francisco Javier Sangüesa from the General X-ray Service from SGIker of the University of the Basque Country UPV/EHU as well as to Saioa Suarez for technical and human support provided in the SGIker-Geochronology and Isotope Geochemistry Facility (UPV/EHU, MICINN, GV/EJ, ERDF and ESF).

Conflicts of Interest

The authors declare no conflict of interest.

References

  1. Calparsoro, E. Transdisciplinar Methodologies on Medieval and Post-Medieval Pottery Analysis: An Archaeometric Approach to Basque and Riojan Productions. Ph.D. Thesis, University of the Basque Country (UPV/EHU), Vitoria-Gasteiz, Spain, 2019. [Google Scholar]
  2. Heimann, R.B.; Maggetti, M. Experiments on simulated burial of calcareous terra sigillata (mineralogical change). Preliminary results. Br. Mus. Occas. Paper 1981, 19, 163–177. [Google Scholar]
  3. Lemoine, C.; Poupet, P.; Barrandon, J.; Borderie, B.; Meille, E. Étude de quelques altérations de composition chimique des céramiques en milieu marin et terrestre. Rev. Archéom. 1981, 1, 349–360. [Google Scholar] [CrossRef]
  4. Secco, M.; Maritan, L.; Mazzoli, C.; Lampronti, I.G.; Zorzi, F.; Nodari, L.; Russo, U.; Mattioli, S.P. Alteration Processes of Pottery In Lagoon-Like Environments. Archaeomrtry 2011, 53, 809–829. [Google Scholar] [CrossRef]
  5. Fantuzzi, L. La alteración posdeposicional del material cerámico. Agentes, procesos y consecuencias para su preser-vación e interpretación arqueológica. Comechingonia Virtual. 2010, 4, 27–59. [Google Scholar]
  6. Maritan, L. Ceramic abandonment. How to recognise post-depositional transformations. Archaeol. Anthr. Sci. 2020, 12, 1–20. [Google Scholar] [CrossRef]
  7. Buxeda i Garrigós, J.; Madrid i Fernández, M. Designing Rigorous Research: Integrating Science and Archaeology. In The Oxford Handbook of Archaeological Ceramics, Chapter Part II; Oxford University Press: Oxford, UK, 2017; pp. 19–47. [Google Scholar]
  8. Freestone, I.C. Post-depositional changes in archaeological ceramics and glasses. In Handbook of Archaeological Sciences; Brothwell, D.R., Pollard, A.M., Eds.; Wiley & Sons, Ltd.: New York, NY, USA, 2001. [Google Scholar]
  9. Rice, P. Pottery Analysis: A Sourcebook; University of Chicago Press: Chicago, IL, USA, 1987. [Google Scholar]
  10. Garrigós, I.J.B.; Mommsen, H.; Tsolakidou, A. Alterations of Na, K and Rb concentrations in Mycenaean pottery and a proposed explanation using X-ray diffraction. Archaeomrtry 2002, 44, 187–198. [Google Scholar] [CrossRef] [Green Version]
  11. Freestone, I.C.; Meeks, N.D.; Middleton, A.P. Retention of Phosphate In Buried Ceramics: An Electron Microbeam Approach. Archaeomrtry 1985, 27, 161–177. [Google Scholar] [CrossRef]
  12. Lemoine, C.; Picon, M. La fixation du phosphore par les céramiques lors de leur enfouissement et ses incidences analytiques. Rev. Archéom. 1982, 6, 101–112. [Google Scholar] [CrossRef]
  13. Maritan, L.; Mazzoli, C. Phosphates in Archaeological Finds: Implications for Environmental Conditions of Burial. Archaeomrtry 2004, 46, 673–683. [Google Scholar] [CrossRef]
  14. Schwedt, A.; Mommsen, H.; Zacharias, N. Post-Depositional Elemental Alterations in Pottery: Neutron Activation Analyses of Surface and Core Samples. Archaeomrtry 2004, 46, 85–101. [Google Scholar] [CrossRef]
  15. Schwedt, A.; Mommsen, H.; Zacharias, N.; Garrigós, I.J.B. Analcime Crystallization and Compositional Profiles-Comparing Approaches to Detect Post-Depositional Alterations in Archaeological Pottery. Archaeomrtry 2006, 48, 237–251. [Google Scholar] [CrossRef] [Green Version]
  16. Blanco-Zubiaguirre, L.; Ribechini, E.; Degano, I.; La Nasa, J.; Carrero, J.A.; Iñañez, J.; Olivares, M.; Castro, K. GC–MS and HPLC-ESI-QToF characterization of organic lipid residues from ceramic vessels used by Basque whalers from 16th to 17th centuries. Microchem. J. 2018, 137, 190–203. [Google Scholar] [CrossRef]
  17. Blanco-Zubiaguirre, L.; Olivares, M.; Castro, K.; Carrero, J.A.; García-Benito, C.; García-Serrano, J. Ángel; Pérez-Pérez, J.; Perez-Arantegui, J. Wine markers in archeological potteries: Detection by GC-MS at ultratrace levels. Anal. Bioanal. Chem. 2019, 411, 6711–6722. [Google Scholar] [CrossRef]
  18. Amadori, M.L.; Fabbri, B.; Gualtieri, S. Alteration forms in majolica tiles from the church of PIattelletti in Fano (Central Italy). In Proceedings of the Metodi Chimici, Fisici e Biologici per la Salvaguardia dei Beni Culturali: 20° Congresso Nazionale, Rome, Italy, 18 December 1998; pp. 75–81. [Google Scholar]
  19. Garrigós, J.B. Alteration and Contamination of Archaeological Ceramics: The Perturbation Problem. J. Archaeol. Sci. 1999, 26, 295–313. [Google Scholar] [CrossRef] [Green Version]
  20. Buxeda i Garrigós, J.; Cau Ontiveros, M.A. Identificación y significado de la calcita secundaria en cerámicas arqueo-lógicas. Complutum 1994, 5, 293. [Google Scholar]
  21. Garrigós, I.J.B.; Kilikoglou, V.; Day, P.M. Chemical and Mineralogical Alteration of Ceramics from A Late Bronze Age Kiln at Kommos, Crete: The Effect on the Formation of a Reference Group. Archaeomrtry 2001, 43, 349–371. [Google Scholar] [CrossRef] [Green Version]
  22. Buxeda i Garrigós, J.; Cau Ontiveros, M.A.; Madrid i Fernández, M.; Toniolo, A. Roman Amphorae from the Iulia Felix Shipwreck. In Alteration and Provenance, Proceedings of the 33rd International Symposium on Archaeometry, Amsterdam, The Netherlands, 22–26 April 2002; Hars, H., Burke, E., Eds.; Institute for Geo- and Bioarchaeology of the Vrije Universiteit in Amsterdam: Amsterdam, The Netherlands, 2005. [Google Scholar]
  23. Cau Ontiveros, M.A.; Day, P.M.; Montana, G. Secondary calcite in archaeological ceramics: Evaluation of alteration and contamination processes by thin section study. In Modern Trends in Scientifis Studies on Ancient Ceramics; Kilikoglou, V., Hein, A., Maniatis, Y., Eds.; Archaeopress: Oxford, UK, 2002. [Google Scholar]
  24. Picon, M. Remarques préliminaires sur deux types d’altération de la composition chimique des céramiques au cours du temps. Figlina. Doc. Lab. Céramologie Lyon Lyon 1976, 1, 159–166. [Google Scholar]
  25. Pradell, T.; Vendrell-Saz, M.; Krumbein, W.E.; Picon, M. Altérations de céramiques en milieu marin: Les amphores de l’épave romaine de la Madrague de Giens (Var). Rev. Archéom. 1996, 20, 47–56. [Google Scholar] [CrossRef]
  26. Tschegg, C. Post-depositional surface whitening of ceramic artifacts: Alteration mechanisms and consequences. J. Archaeol. Sci. 2009, 36, 2155–2161. [Google Scholar] [CrossRef]
  27. Bearat, H.; Dufournier, D.; Nouet, Y. Alterations of ceramics due to contact with seawater. Archaeol. Polona 1992, 30, 151–162. [Google Scholar]
  28. Montana, G.; Randazzo, L.; Belfiore, C.M.; La Russa, M.F.; Ruffolo, S.A.; De Francesco, A.M.; Pezzino, A.; Punturo, R.; Di Stefano, V. An original experimental approach to study the alteration and/or contamination of archaeological ceramics originated by seawater burial. Period. Mineral. 2014, 83, 89–120. [Google Scholar]
  29. Belfiore, C.M.; La Russa, M.F.; Randazzo, L.; Montana, G.; Pezzino, A.; Ruffolo, S.A.; Aloise, P. Laboratory tests addressed to realize customized restoration procedures of underwater archaeological ceramic finds. Appl. Phys. A 2014, 114, 741–752. [Google Scholar] [CrossRef]
  30. Franklin, U.M.; Vitali, V. The Environmental Stability of Ancient Ceramics. Archaeomrtry 1985, 27, 3–15. [Google Scholar] [CrossRef]
  31. De Stefano, C.; Foti, C.; Sammartano, S.; Gianguzza, A.; Rigano, C. Equilibrium Studies in Natural Fluids. Use of Synthetic Seawaters and Other Media as Background Salts. Ann. Chim. 1994, 84, 159–175. [Google Scholar]
  32. García-Castrillo, G.; Lanuza, P.; López, G. El Entorno Marino de los Restos Arqueológicos, In Monte Buciero 9, La Conservación del Material Subacuático; Excmo. Ayuntamiento de Santoña: Santoña, Spain, 2003; pp. 95–109. [Google Scholar]
  33. Sanchez-Garmendia, U.; Carvalho, P.; Bettencourt, J.; Silva, R.C.; Arana, G.; Iñañez, J.G. Submerged and reused: An archaeometric approach to the early Modern ceramics from Aveiro (Portugal). J. Archaeol. Sci. Rep. 2020, 34, 102648. [Google Scholar] [CrossRef]
  34. De Madinabeitia, S.G.; Lorda, M.S.; Gil Ibarguchi, J. Simultaneous determination of major to ultratrace elements in geological samples by fusion-dissolution and inductively coupled plasma mass spectrometry techniques. Anal. Chim. Acta 2008, 625, 117–130. [Google Scholar] [CrossRef]
  35. Sanchez-Garmendia, U.; Calparsoro, E.; Morillas, H.; Arana, G.; Iñañez, J.G. Modern Era pottery from the archaeological site at the Ethnographic Museum of Zamora (north-western Spain): An archaeometric analysis. J. Archaeol. Sci. Rep. 2020, 33, 102514. [Google Scholar] [CrossRef]
  36. Castro, K.; Alonso, M.P.; Rodríguez-Laso, M.D.; Fernández, L.A.; Madariaga, J.M. On-line FT-Raman and dispersive Raman spectra database of artists’ materials (e-VISART database). Anal. Bioanal. Chem. 2005, 382, 248–258. [Google Scholar] [CrossRef]
  37. Downs, R.T.; Hall-Wallace, M. Mineralogy for the New Millenium: Programme with Abstracts. In Proceedings of the 18th General Meeting of the International Mineralogical Association, Edinburgh, Scotland, 1–6 September 2002; p. 128. [Google Scholar]
  38. Aitchison, J. The statistical Analysis of Compositional Data: Monographs on Statistics and Applied Probability; Chapman and Hall: London, UK, 1982. [Google Scholar]
  39. Aitchison, J. The Single Principle of Compositional Data Analysis, Continuing Fallacies, Confusions and Misunder-Standings and Some Suggested Remedies; CoDaWork: Girona, Spain, 2008; pp. 1–28. [Google Scholar]
  40. Buxeda i Garrigós, J.; Kilikoglou, V. Total variation as a measure of variability in chemical data sets. In Patterns and Process. A Festchrift in Honor to Dr. Edward Sayre; van Zelst, L., Ed.; Smithsonian Center for Materials Research and Education: Suitland, MD, USA, 2003; pp. 185–198. [Google Scholar]
  41. Calparsoro, E. R Scripts for Reproducible Research on Archaeological Ceramics Compositional Data. 2018. Available online: https://doi.org/10.5281/zenodo.1411466 (accessed on 14 July 2021).
  42. Martín-Fernández, J.; Garrigós, B.I.J.; Pawlowsky-Glahn, V. Logratio analysis in archeometry: Principles and methods. In Mathematics and Archaeology; Barceló, J.A., Bogdanovic, I., Eds.; CRC Press: Boca Raton, FL, USA, 2015; pp. 178–189. [Google Scholar]
  43. Boulanger, M.; Fehrenbach, S.S.; Glascock, M.D. Experimental Evaluation of Sample-Extraction Methods and The Potential For Contamination in Ceramic Specimens. Archaeomrtry 2013, 55, 880–892. [Google Scholar] [CrossRef]
  44. Maniatis, Y.; Tite, M.S. Ceramic technology in the Aegean world during the Bronze Age. Thera Aegean World 1978, 1, 483–492. [Google Scholar]
  45. Whitney, L.D.; Evans, W.B. Abbreviations for names of rock-forming minerals. Am. Miner. 2010, 95, 185–187. [Google Scholar] [CrossRef]
  46. Abubakar, M.; Muthuraja, A.; Rajak, D.K.; Ahmad, N.; Pruncu, C.I.; Lamberti, L.; Kumar, A. Influence of Firing Temperature on the Physical, Thermal and Microstructural Properties of Kankara Kaolin Clay: A Preliminary Investigation. Materials 2020, 13, 1872. [Google Scholar] [CrossRef]
  47. Aras, A. The change of phase composition in kaolinite- and illite-rich clay-based ceramic bodies. Appl. Clay Sci. 2004, 24, 257–269. [Google Scholar] [CrossRef]
  48. El Ouahabi, M.; Daoudi, L.; Hatert, F.; Fagel, N. Modified Mineral Phases During Clay Ceramic Firing. Clays Clay Miner. 2015, 63, 404–413. [Google Scholar] [CrossRef]
  49. Fabbri, B.; Gualtieri, S.; Shoval, S. The presence of calcite in archeological ceramics. J. Eur. Ceram. Soc. 2014, 34, 1899–1911. [Google Scholar] [CrossRef]
  50. Nodari, L.; Marcuz, E.; Maritan, L.; Mazzoli, C.; Russo, U. Hematite nucleation and growth in the firing of carbonate-rich clay for pottery production. J. Eur. Ceram. Soc. 2007, 27, 4665–4673. [Google Scholar] [CrossRef]
  51. Freeth, S.J. A Chemical Study of Some Bronze Age Pottery Sherds. Archaeomrtry 1967, 10, 104–119. [Google Scholar] [CrossRef]
  52. Gliozzo, E. Ceramic technology. How to reconstruct the firing process. Archaeol. Anthropol. Sci. 2020, 12, 1–35. [Google Scholar] [CrossRef]
  53. Thomas, J.; Glass, D.H.; White, A.W.; Trandel, M.R. Fluoride content of clay minerals and argillaceous earth materials. Clays Clay Miner. 1977, 25, 278–284. [Google Scholar] [CrossRef]
  54. García-Ten, J.; Monfort, E.; Gomez, P.; Gomar, S. Influence of calcite content on fluorine compound emissions during ceramic tile firing. J. Ceram. Process. Res. 2006, 7, 75–82. [Google Scholar]
  55. De Bonis, A.; Cultrone, G.; Grifa, C.; Langella, A.; Morra, V. Clays from the Bay of Naples (Italy): New insight on ancient and traditional ceramics. J. Eur. Ceram. Soc. 2014, 34, 3229–3244. [Google Scholar] [CrossRef]
  56. Prieto-Taboada, N.; Gómez-Laserna, O.; Martínez-Arkarazo, I.; Olazabal, M.Á.; Madariaga, J.M. Raman Spectra of the Different Phases in the CaSO4–H2O System. Anal. Chem. 2014, 86, 10131–10137. [Google Scholar] [CrossRef] [PubMed]
  57. Zornoza-Indart, A. Técnicas de Desalación, in: La Conservación de los Geomateriales Utilizados en el Patrimonio; Programa Geomateriales: Madrid, Spain, 2012; pp. 143–154. [Google Scholar]
Figure 1. The manufacturing process of the test- and control-pieces before being fired. (a) the clay; (b) pieces before being fired; (c) test-pieces inside a seawater environment container; (d) the electric water bath containing the two environment containers.
Minerals 11 00766 g001
Figure 2. (a) Graphical representation of the evenness of the compositional variability of 69 analyzed samples by ICP-MS; (b) Graphical representation of the evenness of the compositional variability of 23 analyzed PT samples by ICP-MS; (c) Graphical representation of the evenness of the compositional variability of 23 analyzed PF samples by ICP-MS; (d) Graphical representation of the evenness of the compositional variability of 23 analyzed AP samples by ICP-MS. Co, Ta, Sn, Cu, Zn and Ni were omitted in all the graphs. (y-axis (τ.i) = the calculated value for the log-ratio variation for each element in the dataset; vt = Total variability; H2 = information entropy; H2% = percentage of information entropy over the maximum possible; n = number of specimens).
Minerals 11 00766 g002
Figure 3. (a) Principal component analysis of 69 samples; (b) Principal component analysis of 23 PT samples; (c) Principal component analysis of 23 PF samples; (d) Principal component analysis of 23 AP samples. The four PCAs were calculated on the sub-composition of Al2O3, Ba, CaO, Ce, Cr, Cs, Dy, Er, Eu, Fe2O3, Gd, Hf, Ho, K2O, La, Lu, MgO, MnO, Na2O, Nb, Nd, P2O5, Pb, Pr, Rb, SiO2, Sm, Sn, Sr, Tb, Th, TiO2, Tm, U, V, Yb and Zr, but not for B and C, Pb was omitted also.
Minerals 11 00766 g003
Figure 4. Colorimetric results of the three type of samples, before and after their immersion in the corresponding water environment.
Minerals 11 00766 g004
Figure 5. SEM-BSD image of the fractured surfaces of PT, PF and AP control-pieces. (ac) PT-01, PT-05, PT-09; (df) PF-01, PF-05, PF-09; (gi) AP-01, AP-05, AP-09.
Minerals 11 00766 g005
Figure 6. SEM-BSD image of the fractured surfaces of PT and PF marine samples and their elemental analyses by EDS. (af) aggregates composed of Na and Cl, suggested to be NaCl. They appear in different forms; (g,h) aciculate crystals composed of Ca, S, O, suggested to be a calcium sulphate; (i) NaCl (marked in red) in top of big mineral phases of AP002: (j) NaCl in the cavities of AP015.
Minerals 11 00766 g006
Figure 7. SEM-BSD image of the common crystallization identified in PT and PF samples; (a) Ca-F aggregate in a cavity of PF008, a sample immersed in tap water; (b) Ca-F aggregate in a cavity of PF012, a sample immersed in tap water; (c) Ca-F aggregate in a cavity of PF013, a sample immersed in tap water; (d) elemental mapping: the distribution of F in the Ca-F aggregate of (c); (e) elemental mapping: the distribution of Ca in in the Ca-F aggregate of (c); (f) elemental mapping: the distribution of Mn in in the Ca-F aggregate of (c).
Minerals 11 00766 g007
Figure 8. (a,b) SEM-BSD image and EDS analysis of an aggregate of PT010 composed mainly of Ca, Mg, O, C, Na and Cl, probably a calcium carbonate and salts; (c,d) SEM-BSD image and EDS analysis of an aggregate of PT010, probably barite; (e,f) SEM-BSD image and EDS analysis of an aggregate of PT016, probably magnesium and calcium hydroxide or carbonate.
Minerals 11 00766 g008
Figure 9. (a) SEM-BSD image of an aggregate present in AP016; (b) elemental mapping: the distribution of Mg in the aggregate of (a); (c) elemental mapping: the distribution of Ca in the aggregate of (a); (d) elemental mapping: the distribution of Na in the aggregate of (a); (e) elemental mapping: the distribution of Cl in the aggregate of (a).
Minerals 11 00766 g009
Figure 10. Raman analyses in the PF010 surface and PF014 paste; (a) spectrum of anhydrite (CaSO4) in PF010 surface; (b) spectrum of anhydrite in the database; (c) spectrum of bassanite [CaSO4· 1 2 (H2O)] in PF010 surface; (d) spectrum of bassanite in the database; (e) spectrum of calcite (CaCO3) in PF014 paste; (f) spectrum of calcite (CaCO3) in the database.
Minerals 11 00766 g010
Table 1. List of 9 manufactured fabrics, combining different clays and firing temperatures, the number of test-pieces and control-pieces. PF, PT and AP are the abbreviations used for each kind of clay.
FabricsClayFiring Temperature (°C)Test-PiecesControl-Pieces
1Low-calcareous (≈5% CaO) (PF)85081
2Low-calcareous (≈5% CaO) (PF)95061
3Low-calcareous (≈5% CaO) (PF)110061
4High-calcareous (≈14% CaO) (PT)85081
5High-calcareous (≈14% CaO) (PT)95061
6High-calcareous (≈14% CaO) (PT)110061
7Micaceous (≈1% CaO) (AP)85081
8Micaceous (≈1% CaO) (AP)95061
9Micaceous (≈1% CaO) (AP)110061
Table 2. Average values of the measured parameters (pH, conductivity, TDS, salinity and temperature) of the experiment.
pHConductivity (ms/cm)TDS (g/L)SalinityT (°C)
PERIOD (months)SEAWATERTAP WATERSEAWATERTAP WATERSEAWATERTAP WATER SEAWATERTAP WATERSEAWATERTAP WATER
38.0210.2643.601.4925.240.6628.150.6149.9749.39
108.6810.7143.861.0625.160.5627.940.549.749.55
189.0710.7140.870.9723.490.5125.830.4843.4843.54
Table 3. The repeatability (RSD%) of the components for each type of paste (PT, PF, AP).
CompoundsRSD (%)
PTPFAP
Al2O31.514
Ba313
CaO5923
Ce214
Co152210
Cr637
Cs7124
Cu514747
Dy324
Er024
Eu334
Fe2O3222
Gd314
Hf880
Ho314
K2O441
La214
Lu406
MgO944
MnO1023
Na2O458
Nb944
Nd103
Ni7725133
P2O526710
Pb19417
Pr124
Rb360
SiO2364
Sm322
Sr115
Ta265
Tb104
Th425
TiO2124
Tm114
U224
V135
Yb413
Zn2310562
Zr664
Table 4. Summary of the mineralogical phases of the clays used for manufacturing the ceramic pastes. Qz = quartz; Cal = calcite; Dol = dolomite; Hem = hematite; Kfs = potassium feldspar; X = the presence of each mineral in the raw material, abbreviations according to Whitney and Evans (2010) [45].
Raw MaterialMineralogy
QzCalDolHemKfsPhyllosilicates
High-calcareous clay (≈14% CaO) (PT)XX XX
Low-calcareous clay (≈5% CaO) (PF)XXXXXX
Micaceous clay (≈1% CaO) (AP)X X X
Table 5. Summary of the mineralogical phases of the control, marine and tap PT pieces. Qz = quartz; Cal = calcite; Gh = gehlenite; Hem = hematite; Kfs = potassium feldspar; Pl = plagioclase; Di = diopside; Ilt = illite; Gp = gypsum; Anl = analcime; Mul = mullite; Wo = wollastonite, abbreviations according to Whitney and Evans (2010) [45].
Control-PiecesMineralogy
QzCalGhHemKfsPlDiIltMulGpAnlWo
PT-01 (850 °C)XXXXX X
PT-05 (950 °C)X XXXXXX
PT-09 (1100 °C)X XX XX X
Test-pieces
MarinePT001 (850 °C, 3 months)XXXXX X
PT002 (850 °C, 10 months)XXXXX X X
PT003 (850 °C, 18 months)XXXXX X X
PT009 (950 °C, 3 months)XXXXXXXX
PT010 (950 °C, 10 months)X XXXXXX
PT011 (950 °C, 18 months)X XXXXXX
PT015 (1100 °C, 3 months)X XXXXX X X
PT016 (1100 °C, 10 months)X XXXXX X X
PT017 (1100 °C, 18 months)X XXXXX X
TapPT006 (850 °C, 3 months)XXXXX X
PT007 (850 °C, 10 months)XXXXX X
PT008 (850 °C, 18 months)XXXXX X
PT012 (950 °C, 3 months)X XXXXXX
PT013 (950 °C, 10 months)X XXXXXX
PT014 (950 °C, 18 months)X XXXXXX
PT018 (1100 °C, 3 months)X XXXXX X
PT019 (1100 °C, 10 months)X XXXXX X X
PT020 (1100 °C, 18 months)X XXXXX X
Table 6. Summary of the mineralogical phases of the marine and tap PF test-pieces. Qz = quartz; Cal = calcite; Gh = gehlenite; Hem = hematite; Kfs = potassium feldspar; Pl = plagioclase; Di = diopside; Ilt = illite; Cristobalite = Crs; Spl = spinel; Lrn = larnite, abbreviations according to Whitney and Evans (2010) [45].
Control-PiecesMineralogy
QzCalGhHemKfsPlDiIltCrsSplLrn
PF-01 (850 °C)XXXXXX X
PF-05 (950 °C)X XXXX X
PF-09 (1100 °C)X X XX XXX
Test-pieces
MarinePF001 (850 °C, 3 months)XXXXXX X
PF002 (850 °C, 10 months)XXXXXX X
PF003 (850 °C, 18 months)XXXXX X X
PF009 (950 °C, 3 months)XXXXXX X
PF010 (950 °C, 10 months)XXXXXX X
PF011 (950 °C, 18 months)X XXXX X
PF015 (1100 °C, 3 months)X X XX XX
PF016 (1100 °C, 10 months)X X XX X
PF017 (1100 °C, 18 months)X X XX XX
TapPF006 (850 °C, 3 months)XXXXXX X
PF007 (850 °C, 10 months)XXXXXX X
PF008 (850 °C, 18 months)XXXXXX X
PF012 (950 °C, 3 months)XXXXXX X
PF013 (950 °C, 10 months)XXXXXX X
PF014 (950 °C, 18 months)XXXXXX X
PF018 (1100 °C, 3 months)X X XX X
PF019 (1100 °C, 10 months)X X XX XX
PF020 (1100 °C, 18 months)X X XX X
Table 7. Summary of the mineralogical phases of the AP control-pieces. Qz = quartz; Ilt = illite; Mul = mullite; Hem = hematite; Kfs = potassium feldspar; Crn = corundum; Pl = plagioclase, abbreviations according to Whitney and Evans (2010) [45].
Control-PiecesMineralogy
QzIlltMulHemKfsCrnPl
AP-01 (850 °C)XX XX
AP-05 (950 °C)XXXXX
AP-09 (1100 °C)X XXXXX
Publisher’s Note: MDPI stays neutral with regard to jurisdictional claims in published maps and institutional affiliations.

