Abstract
The increasing industrial demand for rare earths requires new or alternative sources to be found. Within this context, there have been studies validating the technical feasibility of coal and coal byproducts as alternative sources for rare earth elements. Nonetheless, radioactive materials, such as thorium and uranium, are frequently seen in the rare earths’ mineralization, and causes environmental and health concerns. Consequently, there exists an urgent need to remove these radionuclides in order to produce high purity rare earths to diversify the supply chain, as well as maintain an environmentally-favorable extraction process for the surroundings. In this study, an experimental design was generated to examine the effect of zeolite particle size, feed solution pH, zeolite amount, and contact time of solid and aqueous phases on the removal of thorium and uranium from the solution. The best separation performance was achieved using 2.50 g of 12-µm zeolite sample at a pH value of 3 with a contact time of 2 h. Under these conditions, the adsorption recovery of rare earths, thorium, and uranium into the solid phase was found to be 20.43 wt%, 99.20 wt%, and 89.60 wt%, respectively. The Freundlich adsorption isotherm was determined to be the best-fit model, and the adsorption mechanism of rare earths and thorium was identified as multilayer physisorption. Further, the separation efficiency was assessed using the response surface methodology based on the development of a statistically significant model.
Keywords:
separation; adsorption; zeolite; rare earth elements; thorium; uranium; coal; kinetics; adsorption isotherm 1. Introduction
The demand for rare earth elements (REEs) has increased rapidly due to their diverse applications in many industries [1,2,3,4,5]. Although the global reserves for rare earths were estimated as 130 million metric tons [6], finding highly concentrated rare earth deposits for economically viable extraction processes remain a challenge [7,8]. Hence, to meet the demand, extracting rare earths from alternative sources has gained significance. Within this context, there have been studies validating the technical feasibility of coal and coal byproducts as alternative sources for REEs [9,10,11,12,13,14,15,16,17,18,19]. The average rare earth concentration in coal and coal-based materials varies between 270 and 1480 mg/kg [13,20], while the concentration in the U.S. coals was indicated as 62.1 mg/kg [21]. However, regardless of their primary or newly-identified sources, the extraction of rare earth elements has always created environmental concerns. Radioactive elements are frequently seen in the same mineralization as rare earths due to the deformations occurring in soil matrix during geological formations [22,23,24,25,26]. The concentration of thorium dioxide and uranium dioxide in the conventional sources of rare earths can be as high as 20% and 16%, respectively [27]. On the other hand, coal may contain approximately 3.2 mg/kg of thorium and 2.1 mg/kg of uranium, which can be substantially enriched along with rare earths during beneficiation stages and create radioactive waste streams [28]. Therefore, the treatment of the aforementioned hazardous elements and solution purification is of great importance, not only for environmental and safety reasons but also for the production of high purity rare earths. Besides, depending on the composition, separated thorium and uranium have potential to be used in fuel cycle or electricity production by nuclear energy.
Adsorption is frequently used in metal separations, hydrometallurgy, water and wastewater treatment, and removal and recovery of metal ions due to its high efficiency and the nature of easy handling [29,30]. The process depends on the chemical nature of both fluid and solid, and it is highly affected by the available surface area and pore volume of the adsorbent [31]. Adsorbents are available in various material forms, such as natural and synthetic organic, inorganic, or composite materials. Materials such as zeolite, apatite, activated carbon, calcined phosphate, oxides, and hydroxides are examples of some highly abundant sorbents [32]. There are plenty of studies performed for the removal of thorium and uranium by adsorption on different materials [33,34,35,36,37,38,39,40,41,42]. Doi et al. conducted a comprehensive study about uranium adsorption on a wide variety of sorbents, such as peat, ferric oxide, clay minerals, zeolite, calcite, and apatite [43]. Similarly, Sikalidis et al. studied thorium and uranium adsorption by clay minerals, montmorillonite, and vermiculite [44]. On the other hand, Kutahyali and Eral investigated the adsorption of thorium and uranium on activated carbon [45]. Fasfous and Dawoud performed a thorough study on the adsorption of uranium by multiwalled carbon nanotubes, and they also examined the kinetics and thermodynamic aspects of the adsorption process [46]. Khalili and Al-Banna investigated thorium and uranium adsorption by humic acid [47]. Further, Monji et al. studied the adsorption of uranium ions in the presence of lanthanides using a byproduct of the agricultural industry [48]. Zou et al. examined uranium removal by manganese oxide-coated zeolite samples [49].
The sorption selectivity depends on many factors, such as the particle size of the adsorbent, pH of the solution, contact time, nature of the solution, etc. The pH plays an important role in sorption processes since it can influence the aqueous chemistry and the properties of the sorbent’s active sites [50]. In Cheira and his coworkers’ study, the capacity of uranium adsorption increases with increasing pH and reaches a maximum value at a pH range of 2.0 to 3.5 [50]. Likewise, Erden and Donat stated that the sorption of thorium generally occurs at pH < 4 [51]. Particle size distribution is another critical factor due to its influence on the pressure loss upon passing the ion through the sorbent. It also affects mass transfer rates. Mass exchange rates increase with decreasing particle size because of shorter diffusion paths [48,52]. An increase in adsorption capacity is expected when the particles are finer in size since the effective surface area increases as the size decreases [49]. The pore size distribution is also vital in governing the diffusion of the solutes into the sorbents.
Even though there are several studies performed to examine the possible application of various sorbents to remove naturally-occurring heavy metals and radioactive materials, mostly, these studies were performed for decontamination of polluted waters rather than rare earth production [53,54]. Also, the studies pertaining to rare earth extraction from coal-based feedstock material while proposing an environmentally benign process are considerably limited. In this study, adsorption of thorium and uranium from rare earth-containing aqueous solution was studied while coarse coal refuse was used as the feedstock. In this presented study, zeolites, a group of crystalline aluminosilicates, were chosen for the adsorption studies due to their unique physicochemical characteristics, such as high porosity and high sorption capacity [37,54]. The effects of various operational parameters, such as initial feed solution pH, adsorbent particle size, adsorbent amount, and contact time of solid and liquid phases on the removal of thorium and uranium were investigated during adsorption. Upon obtaining the experimental results, statistical analyses were carried out to develop a statistically significant model that can be applied to identify the impact of operating parameters on the adsorption recovery of different elements. Additionally, the characterization of initial and loaded zeolite samples after adsorption was performed using various techniques. Moreover, the adsorption behavior of the elements was assessed with respect to adsorption kinetics and adsorption isotherms. Considering the lack of studies pertaining to the separation of radionuclides from rare earths while coal and coal byproducts are used as the feedstock, it is believed that this study is of significance.
2. Materials and Methods
2.1. Samples and Materials
The adsorption tests were conducted with a synthetic solution prepared in accordance with the elemental composition of a strip solution. The strip solution was generated from a coarse coal refuse sample provided by a coal preparation plant operating in Southern West Virginia. The sample was first subjected to hydrochloric acid leaching at 75 °C followed by extraction and stripping using di-(2-ethylhexyl) phosphoric acid (DEHPA) and 6 M hydrochloric acid, respectively. The synthetic solution with the same elemental composition as the strip solution was prepared and used in this study. To prepare the synthetic solution, standard inductively coupled plasma (ICP) solutions of rare earths, thorium, and uranium with a concentration of 1000 mg/L were purchased from Ricca Chemical. For major metals, analar-grade chloride salts were purchased from Alfa Aesar. A 6 M hydrochloric acid solution was used to maintain the same solution medium as the original strip solution. The detailed elemental composition of the synthetic solution is given in Table 1. The initial pH of the solution was less than zero, due to high acidity, and the necessary pH adjustment during the tests was achieved using sodium hydroxide (NaOH) purchased from Merck. pH measurements were conducted using the Oaktan pH 450 portable pH meter, which was frequently calibrated with Ricca Chemical pH 4, 7, and 10 buffer solutions. Zeolite samples with different particle sizes were purchased from KMI Zeolite Inc. and Heiltropfen Lab LLP. The zeolite samples were used as received, without any pretreatment. Deionized (DI) water was used throughout the study.

Table 1.
Elemental composition of the synthetic solution.
2.2. Characterization Studies of Zeolite Samples
A detailed characterization study was performed for the zeolite samples both before and after adsorption. First, the particle size analysis of each zeolite sample was performed using a CILAS 1190 particle size analyzer (Version 9.51, CILAS, Orleans, France). The samples’ mineralogical compositions were determined using the PanAnalytical X’Pert Pro X-ray diffractometer (XRD) (Malvern, UK) equipped with copper radiation and an X’Celerator parallel plate detector. Samples were scanned at 45 kV and 40 mA over a 10–90° two-theta angle range in a continuous mode. The evaluation and refinement of diffraction patterns were carried out using the HighScore software (Version 4.9, Malvern Panalytical, Malvern, UK). The chemical composition of the samples was identified using the Vanta handheld X-ray fluorescence (XRF) analyzer (Olympus, Waltham, MA, USA). Hitachi S-4700 scanning electron microscopy–energy dispersive X-ray (SEM–EDX) was utilized to analyze the samples’ morphology. The accelerating voltage was varied between 5 and 15 kV, and the working distance was maintained at 12 mm during the SEM–EDX analysis. Prior to SEM–EDX analysis, samples were subjected to sputtering for 140 s using the Denton Desk V Sputter and Carbon Coater to prevent charging and improve the quality of the images. SEM images taken under the lowest magnification were also analyzed with the ImageJ image processor for additional particle size measurement. Lastly, the three zeolite feed samples were subjected to the Brunauer–Emmett–Teller (BET) nitrogen adsorption tests using the Micromeritics BET instrument equipped with the ASAP 2020 Version 4.02 (Micromeritics, Norcross, GA, USA) to identify the pore volume, pore size, and specific surface area.
2.3. Adsorption Tests
The adsorption tests were carried out in a batch system by mixing the known volume of synthetic solution with a determined amount of sorbent for a certain period of time to achieve equilibrium. During the experimental testing, the effect of four operating parameters, namely, the solution pH, the particle size of the zeolite, adsorbent amount, and retention time, was examined. The solution pH was decided to be varying between 2–4, according to earlier studies [46,53,55,56,57]. Typically, a further increase in pH leads to the precipitation of thorium, uranium, and rare earths, which is why the experiments are not usually performed at pH values higher than 4 [45,50]. Additionally, when pH is less than 2, the decomposition of zeolite is noticed, which results in ineffective adsorption and lower adsorption capacity [56]. A 2 M sodium hydroxide (NaOH) solution was used to adjust the solution chemistry and achieve different pH values. As for the zeolite particle size, three sizes, with respective P80 values of 1490 µm, 200 µm, and 12 µm, were used. On the other hand, the zeolite adsorbent amount varied between 2.5 g, 3.75 g, and 5 g. Following previously conducted studies, 1 h, 2 h, and 3 h contact periods were determined for the tests [30,45]. When the tests were completed, the sorbent was separated by filtration using filter papers with a pore size of 0.45 µm. Representative supernatant was then subjected to thorium, uranium, rare earths, and major metal analyses using both inductively coupled plasma mass spectrometry (ICP-MS) (Nexion 2000, Perkin Elmer, Waltham, MA, USA) and inductively coupled plasma optical emission spectrometry (ICP-OES) (Arcos 2). Detailed operating conditions developed using an experimental design tool, Box Behnken, are given in Table 2.
Table 2.
Detailed operating conditions of the adsorption tests.
Following the test results, the amount of adsorbed thorium, uranium, and rare earths were calculated using the equation below:
where Ci and Cf are the concentration (mg/L) of the ions of interest in the aqueous solution before and after adsorption, separately. The results were also examined in terms of adsorption capacity and distribution coefficient according to the following equations:
where V is the volume of the solution (L), m the weight of zeolite (g) used, and Ce is the ion concentration (mg/L) when absorption equilibrium is reached.
2.4. Adsorption Kinetics
To evaluate the interaction between the ions and zeolite in the aqueous environment, kinetic adsorption studies as a function of time were performed. Tests were conducted using 2.5 g of the finest zeolite, 12 µm, at a solution pH of 3. The solution and the adsorbent were mixed for a total of 3 h. Representative samples were taken at the 5th, 10th, 15th, 30th, 45th, 60th, 120th, and 180th min to determine the adsorption recoveries of various elements at a given time. Afterward, Langmuir, Freundlich, and Dubinin–Radushkevich (D–R) adsorption isotherm models, representing different equilibrium systems at specified conditions, were plotted to investigate the adsorption behaviors of the elements. The Langmuir adsorption model assumes that the adsorption occurs at specific homogeneous sites within the adsorbents, and the adsorption’s energy is constant [58]. It presumes, when an active site is occupied by an ion, that no further sorption takes place at this site [41,59]. The Langmuir isotherm equation is expressed as:
where Q0 is the maximum monolayer adsorption capacity (mg/g), b is the constant related to adsorption energy, and qe, and Ce are the adsorption capacity (mg/g) and the equilibrium concentration (mg/L), separately. The Freundlich adsorption model, on the other hand, assumes multilayer adsorption for heterogeneous systems [60]. The equation representing the Freundlich adsorption model is:
where Kf is the multilayer adsorption capacity (mg/g), and 1/n is the sorption intensity. Similarly, The Dubinin–Radushkevich (D–R) isotherm model does not assume that the materials have homogeneous surfaces [59]. Instead, it considers that the interaction between adsorbate and adsorbent can be independent of temperature by using the adsorption potential, ε. The linearized form of the D–R isotherm equation is:
where Cads is the amount of ion adsorbed per unit of the adsorbent (mg/g), Xm is the maximum sorption capacity (mg/g), and β is the activity coefficient related to the mean adsorption energy and adsorption potential. The adsorption potential, ε, and the mean adsorption energy, E, can be calculated based on the following equations:
where R is the gas constant (kJ/mol.K) and T is the temperature (K).
3. Results and Discussion
3.1. Characterization of Zeolite Samples Before Adsorption
Mineralogical compositions of the samples were identified using XRD. As seen in Figure 1, the XRD patterns of the samples were all identified as the single phase of clinoptilolite-type zeolite. It is the most commonly-found zeolite type in the heulandite group that has the aluminum silicate tetrahedral arrangement and the complex chemical formula of Na6(Al6Si30O72)24H2O.
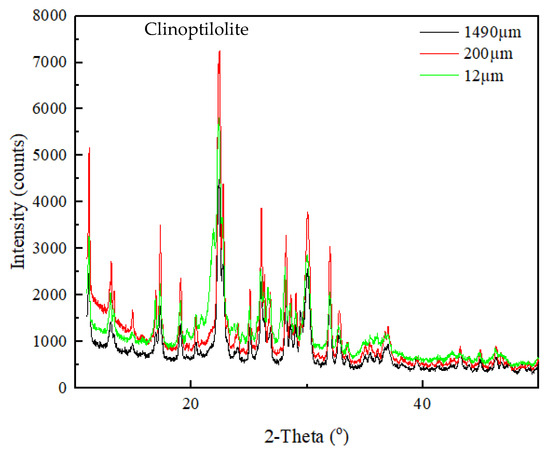
Figure 1.
XRD pattern of the zeolite samples.
Chemical compositions of the samples were identified using XRF. Test results indicate that the samples contain a high concentration of silicon and aluminum, which is typical for zeolites. The distinctive properties of zeolites result from their honeycomb structures with water molecules and exchange cations located in the cavities. Mostly, Ca2+, Na+, or K+ located in the cavities are exchangeable with other ions depending on the Si/Al ratio and the position of the ion exchange sites [61]. An increase in aluminum concentration will also provide higher adsorption capacity. The SiO2/Al2O3 ratio of the three zeolite samples was around 5.74%. In addition to these major components, 1.43 wt% Ca, 0.99 wt% Fe, 0.28 wt% Mg, and 2.10 wt% K were also detected in the samples as minor components.
Characterization studies further continued with the SEM–EDX analysis. The images obtained by SEM under various magnifications are shown in Figure 2. As seen, regardless of the sample size, the surface is heterogeneous and rough. Additionally, in Figure 2C, noticeable porous structures are seen. Besides, particles all have flaky and irregular shapes, which is consistent with the observations provided in Zendelska and his co-workers’ study [62]. The finest zeolite sample also tends to agglomerate, due to an increased surface area, as seen in Figure 2. EDX spectrums of three zeolite samples are presented in Figure 3. All three samples possess a similar EDX pattern, which indicates the presence of Si, O, and Al, as suggested by the main peaks. Compared to the coarse and middle-sized zeolite samples, the EDX pattern of the finest zeolite sample (12 µm) displays considerably high intensities for all element peaks. In addition to Si, Al, and O, a portion of Na was also detected. The findings obtained from the EDX, XRF, and XRD analyses complete and support each other. The carbon peak seen in the EDX spectrum is due to the carbon tape substrate used during sample preparation.
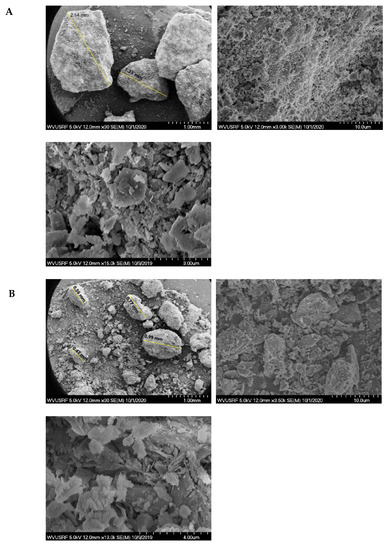
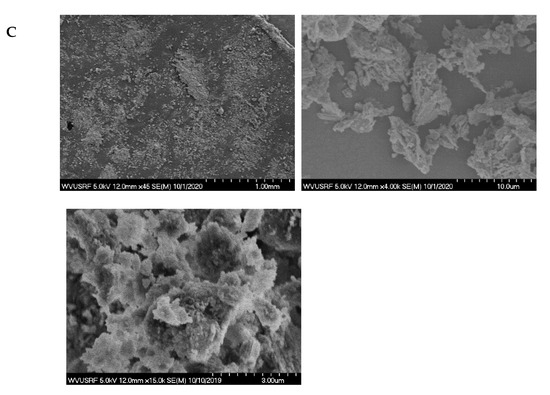
Figure 2.
SEM images of the zeolite samples under various magnifications: (A) the coarsest sample, (B) middle-sized sample, (C) the finest sample.
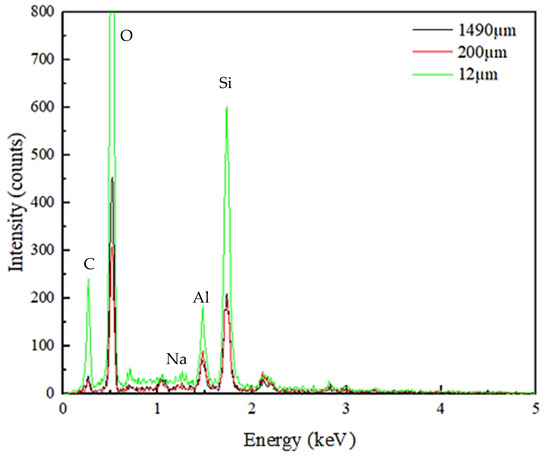
Figure 3.
Elemental identification of the zeolite samples obtained from the EDX spectrums.
Lastly, the three zeolite feed samples, with a P80 value of 1490 µm, 200 µm, and 12 µm, separately, were subjected to the BET nitrogen adsorption tests to identify the pore size and specific surface area. While the coarsest zeolite had a pore diameter of 12.6 nm, the middle-sized and the finest zeolites had a pore diameter of 9.9 and 8.7 nm, respectively. According to the classification of pores established by the International Union of Pure and Applied Chemistry (IUPAC) in 1985 [63], all zeolite samples have mesoporous structures due to pore widths less than 50 nm. The specific surface area of the coarsest sample was determined as 16.1 m2/g. The middle-sized and the finest samples had a specific surface area of 15.7 and 20.2 m2/g, respectively. As seen, with a decrease in the particle size, the corresponding specific surface area generally increased. Moreover, the pore volume distribution as a function of the pore size indicated a linear distribution for all three zeolite samples.
3.2. Adsorption Tests
The recovery of total rare earths, thorium, and uranium into the solid phase was given in Figure 4. As seen in Figure 4A, the recovery of rare earths fluctuated between 0.03 wt% and 96.90 wt%. On the contrary, nearly 100 wt% thorium removal was achieved in every test condition, except for Test 23, which yielded a 36.67 wt% of thorium adsorption (Figure 4B). Similar to rare earths, a significant variation was observed for uranium adsorption, as shown in Figure 4C. The adsorption recovery of uranium changed between 0.00 and 98.70 wt%.
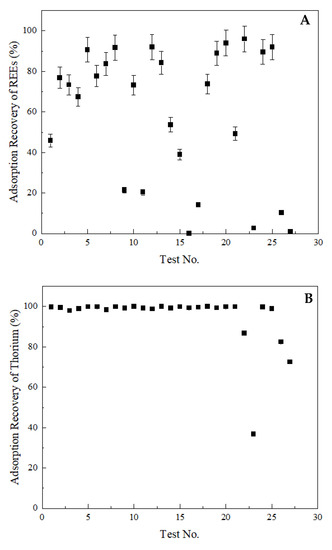
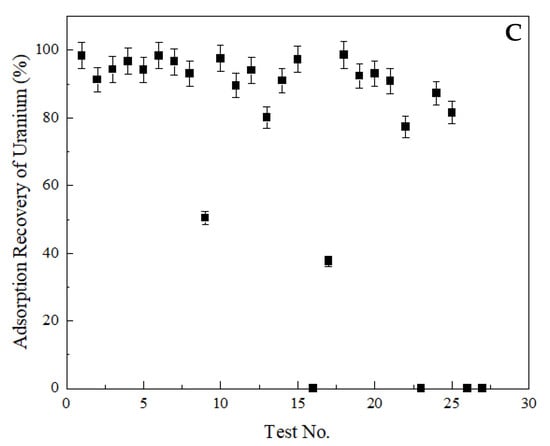
Figure 4.
Adsorption recoveries into the solid phase. (A) total rare earths, (B) thorium, (C) uranium. Error bars represent one standard deviation of multiple replicate tests.
The three lowest rare earth adsorption recoveries, namely 0.03 wt%, 1.01 wt%, and 2.67 wt%, were achieved with Test 16, 27, and 23, respectively, at the same pH value of 2. Additionally, Test 16 and Test 27 were conducted with zeolite samples of the same size (i.e., 200 µm). However, Test 23 was performed using the zeolite sample with a P80 value of 12 µm, which may indicate the impact of particle size on the adsorption mechanism. The retention time of Test 16, 27, and 23 was 3, 1, and 2 h, respectively. As seen, Test 16 produced the lowest rare earth adsorption into the solid phase (0.03 wt%), which corresponded to 3-h contact time. However, when the zeolite’s size was reduced to 12 µm (Test 23), a retention time of 2 h was sufficient to achieve a nearly equal low rare earth adsorption (2.67 wt%). Although these three tests generated the lowest rare earth adsorption recoveries into the solid phase, no separation was observed between uranium and rare earths under the same conditions. This may be due to the saturation of adsorption sites with other ions prior to uranium. Under all three test conditions, 0 wt% uranium was adsorbed by the zeolites. On the other hand, thorium adsorption recovery varied among these three test conditions. The thorium adsorption recovery at Test 16, 27, and 23 was 99.33 wt%, 72.52 wt%, and 36.67 wt%, respectively. It is known that thorium shows very little tendency to hydrolyze at low pH values, and the dominant ion at pH < 3 is Th4+, which is the exchangeable ion between solution and the zeolite [64].
The effect of particle size was expected, since adsorption capacity is dependent on the effective surface area, which generally increases with decreasing particle size [49]. However, an increase in the adsorption recovery of rare earths was observed while a coarser zeolite sample was used. For example, Test 5 and Test 11 were conducted under the same operating conditions (i.e., pH 3, zeolite amount 2.50 g, contact time 2 h), except for the zeolite particle size. While Test 5 was performed with the coarsest zeolite, 1490 µm, Test 11 was carried out with the finest size zeolite, 12 µm. The respective rare earth adsorption recoveries were found as 90.67% and 20.43%. The reason for this substantial increase in the adsorption recovery of rare earths may lie under the particle size reduction occurring during the mixing of solid and liquid phases throughout the adsorption process. The post-adsorption SEM image provided in Figure 5 shows fractures and cracked surfaces, which may result from a reduction in the zeolite particle size. Later, the particle size analysis performed with post-adsorption solid samples confirmed the size reduction. The particle size of the coarsest zeolite sample with an initial P80 value of 1490 µm was reduced to 45 µm after adsorption. Likewise, a reduction in the particle size of the middle-sized zeolite sample was also observed. After adsorption, the new P80 value of the middle-sized zeolite sample was found to be 60.5 µm, as opposed to the initial value of 200 µm. However, no change in the particle size of the fine sample (i.e., 12 µm) was detected. The particle size reduction occurred for coarse and middle-sized zeolite samples during adsorption. It created fresh surfaces and new active sites ready for ion adsorption that may explain the elevated adsorption recovery with the increase in the nominal adsorbent particle size.
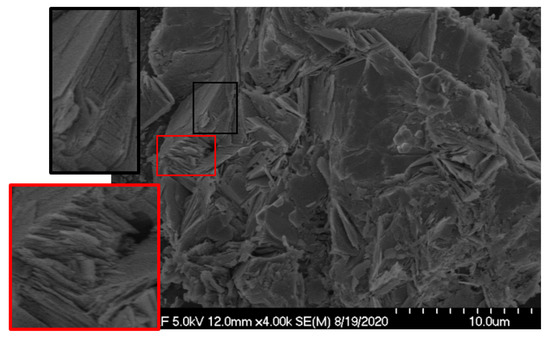
Figure 5.
SEM image showing the fractures and cracks formed after adsorption, which are highlighted in the red boxes.
Overall, the best separation performance was achieved with Test 11 while using 2.50 g of 12-µm zeolite sample at a pH value of 3 with a contact period of 2 h. Under these conditions, the adsorption recovery of rare earths, thorium, and uranium into the solid phase was found to be 20.43 wt%, 99.20 wt%, and 89.60 wt%, respectively.
In terms of major metal adsorption, steady recovery results were observed for iron, in comparison to aluminum and magnesium. Almost 100 wt% iron adsorption onto zeolite was seen under every test condition. Selective iron adsorption over other metals was also seen in Motsi and his coworkers’ study on heavy metal adsorption from acid mine drainage by natural zeolite [65]. Contrarily, the adsorption recovery of aluminum changed between 12.49 wt% to 99.65 wt%, where the lowest adsorption recovery achieved with the test resulted in the best separation performance (Test 11). The adsorption recovery of magnesium also varied. The lowest magnesium adsorption, 69.60 wt% was also observed with Test 11, and the highest magnesium adsorption recovery seen was 99.87 wt%.
3.3. Characterization of Zeolite Samples Post Adsorption
The solid sample used during Test 11 (12-µm zeolite), was subjected to XRD and SEM–EDX analyses to detect whether there was any change in the elemental and mineralogical compositions after adsorption. Results obtained from XRD revealed the formation of halite and perrierite-(Ce) in addition to clinoptilolite. Halite formation is probably due to the reaction between feedstock’s medium, HCl, and the addition of pH regulator, NaOH. Also, the zeolite samples initially contained a small amount of sodium prior to the adsorption tests. Perrierite-(Ce) is a compound consisting of many elements and having a general formula of A4BC2D2Si4O22, where A represents rare earths and thorium, B represents Fe, Mn, and Mg, C refers to Fe, Mn, Mg, Al, Ti, and Cr, and D corresponds to Ti [66]. Cerium and lanthanum are the most dominant rare earth elements. Perrierite-(Ce) is defined as radioactive, according to the Code of Federal Regulations Title 49, which supports the high concentration of thorium in the zeolite post adsorption. The XRD pattern of the sample is given in Figure 6.
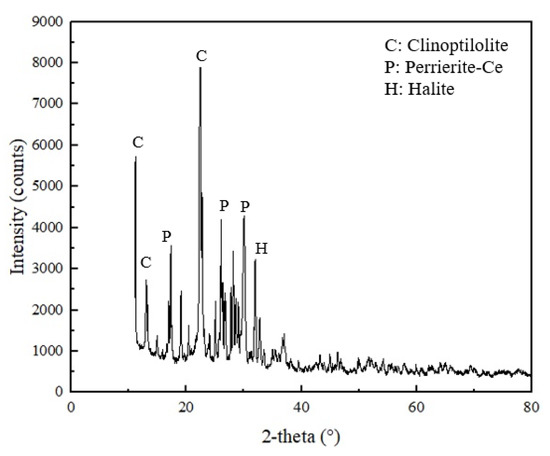
Figure 6.
XRD pattern of the solid sample generated with Test 11.
Image analysis was performed using SEM to provide further information. As seen in Figure 7, the morphology remains rough, and the particles maintain irregular shapes. However, the formation of small prismatic crystal particles is seen. This finding is well-correlated with the crystal structure of perrierite-(Ce) [67]. The bright areas highlighted in the image may refer to the accumulation of heavy elements such as the rare earths and thorium.
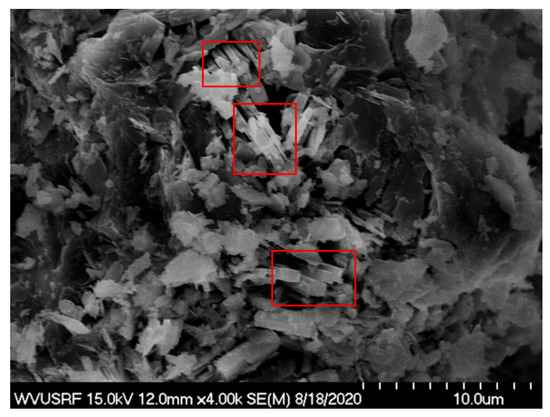
Figure 7.
SEM image analysis of the solid sample after adsorption. Bright areas highlighted in the red boxes indicating the deposition of heavy elements.
The EDX pattern of the solid sample generated from Test 11 is shown in Figure 8A. In comparison to the elemental concentration of the raw zeolite samples, after adsorption, a substantial decrease in the intensities of aluminum and silicon was observed. This finding suggests a reduction in both the aluminum and silicon concentration, attributed to the adsorption of external elements onto the zeolite structure. Similar to XRD, EDX was also able to detect thorium and most of the rare earth elements; however, their concentrations are considerably low compared to Al, Si, and O. Due to this fact, they are not clearly seen in the full pattern. However, as shown in the close-up view (Figure 8B), most of the rare earths were observed in the energy level between 0.5 and 1.3 keV, and thorium was detected around 3 keV.
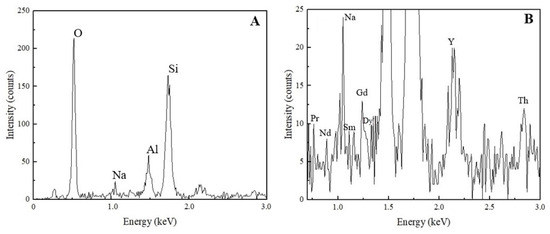
Figure 8.
EDX pattern of the solid sample generated after Test 11. (A) Full EDX pattern indicating high-intensity elements. (B) Close-up view showing the detection of rare earths and thorium.
3.4. Statistical Analyses and Modeling
Following the data analysis of the test results, the impact of four operating variables (i.e., zeolite particle size, feed solution pH, adsorbent amount, and contact time) on the recovery of total rare earths, thorium, and uranium was analyzed using the response surface methodology. The adsorption recovery values of rare earths, thorium, and uranium obtained from the full dataset were uploaded to the Design Expert Software following the Box Behnken experimental design. Statistical models were developed separately to determine the operational sensitivity with respect to the input parameters.
A statistical model was first developed as a tool to predict the recovery of rare earth elements by incorporating all the influential operating parameters, as shown in Equation (9). It can be seen from the quadratic model that the variables, including the zeolite particle size, feed solution pH, and adsorbent amount, except the contact time, all had a significant impact on the recovery of rare earths.
where the uncoded model terms A, B, C, and D correspond to zeolite particle size, feed solution pH, adsorbent amount, and contact time, respectively. While a statistical model was generated for rare earths, a significant model was generated for neither thorium nor uranium.
The analysis of variance (ANOVA) table used to determine the significance of the developed statistical model is shown in Table 3. As seen from the table, the model F-value of 6.90 implies the model is significant. The probability of an F-value to become this large is 0.09% (<5%, which is the critical P-value used to determine the significance). Model terms are considered significant within a 95% confidence level, or in other words, values of “prob > F” less than 0.05 indicate that terms are significant. In this case, terms A, B, and C are significant model terms, whereas D is an insignificant model term. The lack-of-fit value of 1.21 implies a 53.50% chance that a lack-of-fit F-value can be this high. The lack-of-fit must be insignificant for a model to be fit. In the same table, R-squared values were also given, to further evaluate the robustness of the developed model. As seen, the R-squared value of 0.8895 and an adjusted R-squared value of 0.7606 further confirm the model’s significance.
Table 3.
ANOVA analysis of the quadratic model for predicting rare earth recovery.
Three diagnostic plots developed based on the statistical model are given in Figure 9. In these plots, the relationship between two parameters was described while keeping the other two parameters constant at their middle values. In Figure 9A, the effect of particle size and pH is presented while keeping the adsorbent amount and contact time constant at 3.75 g and 2 h, respectively. It is well-known that pH is an important parameter in adsorption processes. As seen, rare earth recovery increases with an increase in the pH value. this could be attributed to the competition between hydrogen ions and rare earth ionic species present in the solution at a given pH value [64]. Typically, zeolite has a tendency to adsorb H+ ions from the solution, which creates a positive charge on the zeolite structure, and other positively charged ions are repulsed due to the electrostatic interaction. When the solution pH increases, the amount of H+ ions decreases, which results in the adsorption of other ions present in the solution [65]. However, freed negatively charged ions (i.e., Cl−) may reverse the electrostatic repulsion and enhance adsorption. At the same time, depending on the concentration and conditions, it may have an opposite effect, and further reduce the adsorption by binding with metals and forming complexes that cannot be adsorbed. This could be the reason for the wide variation observed in the adsorption recovery of rare earths. Also, rare earth adsorption recovery rises with an increase in the particle size, which statistically supports the findings stated earlier that unexpected particle size reduction induced during mixing leads to enhanced adsorption due to freshly created surfaces for ion adsorption. The same trend is seen in Figure 9B, where the relationship between particle size and the adsorbent amount is given, while maintaining the pH and contact time constant at 2 and 2 h, respectively. In comparison to Figure 9A,C, Figure 9B displays a relatively flat surface. A higher amount of adsorbent results in more significant adsorption, since active adsorption sites increase concurrently at a given volume. Figure 9C further shows that rare earth recovery decreases at a lower pH value and a smaller adsorbent amount.
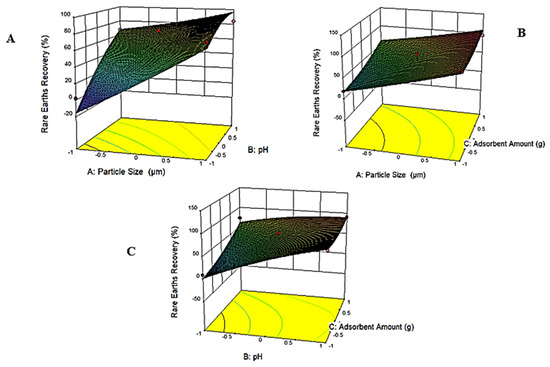
Figure 9.
Diagnostic plots obtained based on the statistical model developed for the adsorption recovery of rare earths. (A) the effect of particle size and pH on the adsorption recovery of rare earths (B) the effect of particle size and adsorbent amount on the adsorption recovery of rare earths (C) the effect of pH and adsorbent amount on the adsorption recovery of rare earths.
3.5. Adsorption Kinetics and Isotherms
Kinetic adsorption test results shown in Figure 10 indicate fast adsorption for thorium, as opposed to rare earths and uranium. Within the first 5 min, the adsorption recovery of thorium reached 86.5 wt%, which later continued to rise, but with a small incremental increase. At the end of the 3-h contact, the maximum thorium adsorption onto the zeolite was 93.4 wt%. On the other hand, rare earths and uranium followed a similar pattern jointly. A significant increase in the adsorption recovery of rare earths was first seen during the 10–15 min time interval. At the end of 10 min, the adsorption recovery of rare earths was 3.0 wt%, and at 15 min, it increased by 8.2 wt% and reached a new value of 11.3 wt%. Later, another 8.2 wt% increase was further observed during the 30–45 min time interval. Adsorption recovery of total rare earths reached 21.5 wt% at the end of the kinetic test. Data shown in Figure 11 further support the findings mentioned above. It can be seen from Figure 11A that the distribution of rare earths in the solid phase increased significantly at both the 10–15 and 30–45 min time intervals. The distribution of thorium as a function of adsorption time is presented in Figure 11B, which again suggests that the most significant adsorption occurred during the first 5 min. Uranium exhibited a similar adsorption behavior to rare earths. Low uranium adsorption was also observed in Godelitsas and Armbsruster’s study due to the complicated aqueous chemistry of uranium, as well as the constant structural changes occurring in the mesoporous zeolite sample [68]. In the same study, high thorium adsorption, along with hydrogen ion adsorption at pH < 3, was also observed, which shares similarity to findings presented here. The adsorption mechanism starts with the formation of complexes at the external surface. Later, the ions transport into the pores to form inner complexes via covalent or ionic bonding and become more stable. Rapid thorium complexes formed on the external surface of the zeolite may block the formation of complexes with other ions. Afterward, the thorium molecules diffusing into the inner pores can hinder the adsorption of other ions. This may also be explained via the molecule sizes of rare earths, thorium, and uranium. While thorium has a molecule size of 0.24 nm, uranium has a molecule size of 0.23 nm. Although the molecule size of rare earths changes, it varies between 0.228 and 0.25 nm. If thorium is adsorbed first due to its easy nature, it may slow down the transport of other ions when the adsorbent has a narrow pore diameter [69]. This also supports the identification of thorium containing mineral phases in the XRD analysis conducted after adsorption (Figure 8).
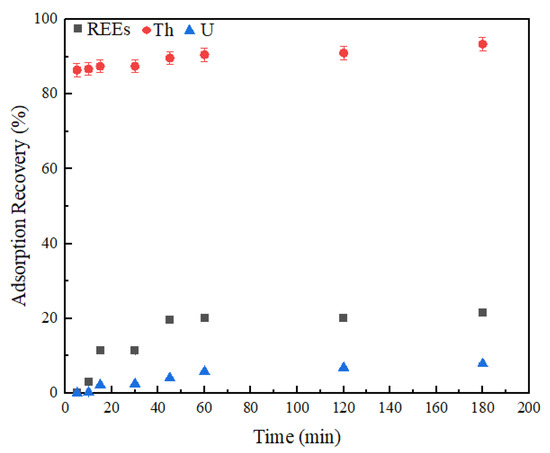
Figure 10.
Adsorption recoveries of total rare earths, thorium, and uranium as a function of contact time. Error bars represent one standard deviation of multiple replicate tests.
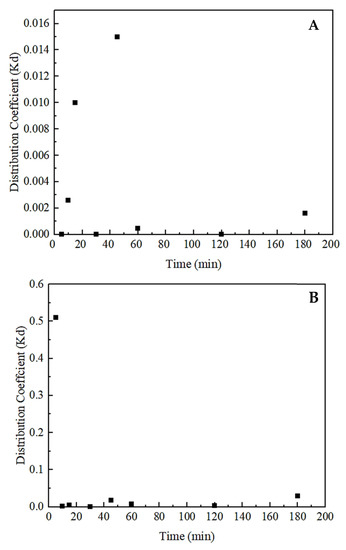
Figure 11.
Distribution coefficient values of (A) total rare earths and (B) thorium as a function of contact time. Error bars represent one standard deviation of multiple replicate tests.
Adsorption isotherms were subsequently developed based on the kinetic adsorption data. The Freundlich adsorption isotherm was found to be the best fit for both rare earths and thorium (Figure 12). The plots were generated following Equation (5). Afterward, the slope and the intercept of the plots were used to calculate 1/n and Kf values, separately. The high correlation coefficient (R2) observed in both isotherms suggests a good model fit. The maximum adsorption capacity for rare earths and thorium was 2.05 and 0.24 mg/g, respectively. A negative slope observed for rare earths and thorium indicates a reverse correlation between the amount adsorbed (Cads) and the equilibrium concentration (Ce), which corresponds well with the experimental findings that the amount adsorbed decreased as time increased. Moreover, the Freundlich isotherm indicates multilayer adsorption, rather than monolayer, and considers a heterogeneous surface.
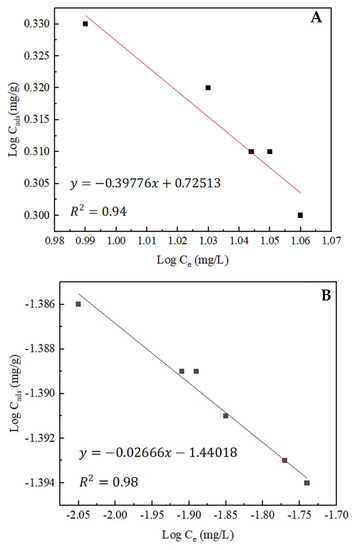
Figure 12.
Freundlich adsorption isotherms of (A) total rare earths and (B) thorium onto zeolite.
Dubinin–Radushkevich (D–R) adsorption isotherms of total rare earths and thorium are shown in Figure 13. The mean adsorption energy calculated from the isotherms reveals supplemental information on adsorption behavior. If the mean adsorption energy value falls between 1 and 8 kJ/mol, it is considered physical adsorption. On the other hand, if the value varies between 9 and 16 kJ/mol, it represents chemical adsorption [51]. The mean adsorption energy (E) values of rare earths and thorium were calculated as 5.8 kJ/mol and 1.80 × 10⁻³ kJ/mol, respectively. E < 8 kJ/mol indicates that both rare earth and thorium adsorption is governed by reversible physisorption and requires less energy. Intermolecular forces are involved in accomplishing the adsorption. Moreover, the activity coefficient values were found to be −1.48 × 10⁶ mol2/kJ2 and −1.54 × 10⁻⁵ mol2/kJ2 for total rare earths and thorium, separately.
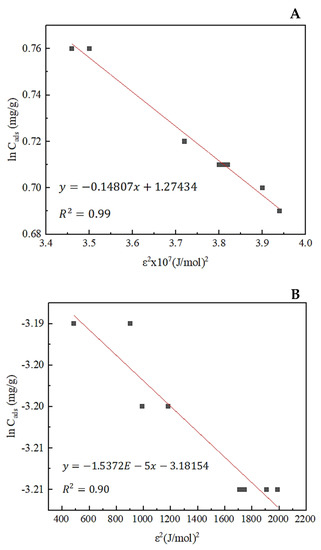
Figure 13.
Dubinin–Radushkevich adsorption isotherm of (A) total rare earth elements and (B) thorium onto zeolite.
4. Conclusions
Zeolite adsorption was studied to remove thorium and uranium from a rare earth-containing solution generated from coarse coal refuse. Experimental testing was carried out to evaluate the impact of four operational parameters, including solution pH, zeolite particle size, zeolite amount, and contact time, on the adsorption recoveries. The following conclusions were reached at the end of the study:
- It was observed that rare earths and uranium adsorption follow a similar pattern, which creates the separation challenge. On the other hand, test results indicate that zeolite adsorption is an effective technique for thorium removal.
- Iron adsorption was in agreement with thorium adsorption, and exhibited a steady state under all operating conditions. Differently, a variation was observed for aluminum and magnesium depending on the test conditions.
- The statistical model developed to predict the adsorption recovery of rare earths indicates that the initial solution pH, zeolite particle size, and amount are the key operating parameters, which all impacted the adsorption recovery of rare earths. However, the contact time was identified as an insignificant parameter.
- Overall, an increase in the adsorption recovery of total rare earths was observed with the increase in the three influential operational parameters (i.e., solution pH, zeolite particle size, and amount).
- Kinetic studies suggest a fast adsorption rate for thorium, in contrast to total rare earths and uranium. Multilayer physisorption was determined for total rare earths and thorium when zeolite was selected as the adsorbent.
- In conclusion, the best separation was achieved using 2.5 g of 12-µm zeolite at a solution pH of 3 for a contact period of 2 h. Under these conditions, almost 100 wt% thorium removal was achieved, with approximately 20 wt% total rare earth loss.
Author Contributions
Conceptualization: D.T. and Q.H.; methodology: D.T. and Q.H.; software: D.T. and Q.H.; validation: D.T. and Q.H.; formal analysis: D.T. and Q.H.; investigation: D.T. and Q.H.; resources: Q.H.; data curation: D.T. and Q.H.; writing—original draft preparation: D.T.; writing—review and editing: Q.H.; visualization: D.T. and Q.H.; supervision: Q.H.; project administration: Q.H.; funding acquisition: Q.H. All authors have read and agreed to the published version of the manuscript.
Funding
The findings presented in this manuscript were based on a study that was supported by the Department of Energy under Award Number DE-FE0027035. Disclaimer: This report was prepared as an account of work sponsored by an agency of the United States Government. Neither the United States Government nor any agency thereof, nor any of their employees, makes any warranty, express or implied, or assumes any legal liability or responsibility for the accuracy, completeness, or usefulness of any information, apparatus, product, or process disclosed, or represents that its use would not infringe privately owned rights. Reference herein to any specific commercial product, process, or service by trade name, trademark, manufacturer, or otherwise does not necessarily constitute or imply its endorsement, recommendation, or favoring by the United States Government or any agency thereof. The view and opinions of authors expressed herein do not necessarily state or reflect those of the United States Government or any agency thereof.
Institutional Review Board Statement
Not applicable.
Informed Consent Statement
Not applicable.
Acknowledgments
The authors would like to express their gratitude towards the Department of Mining Engineering at the University of Kentucky and the National Research Center for Coal and Energy (NRCCE) at West Virginia University for the elemental analysis reported in this study.
Conflicts of Interest
The authors declare no conflict of interest.
References
- Banda, R.; Jeon, H.; Lee, M. Solvent Extraction Separation of La from Chloride Solution Containing Pr and Nd with Cyanex 272. Hydrometallurgy 2012, 121, 74–80. [Google Scholar] [CrossRef]
- Binnemans, K.; Jones, P.; Blanpain, B.; Gerven, T.; Yang, Y.; Walton, A.; Buchert, M. Recycling of Rare Earths: A Critical Review. J. Clean. Prod. 2013, 51, 1–22. [Google Scholar] [CrossRef]
- Navarro, J.; Zhao, F. Life-Cycle Assessment of the Production of Rare Earth Elements for Energy Applications: A Review. Retrieved from Frontiers in Energy Research. 2014. Available online: https://www.frontiersin.org/articles/10.3389/fenrg.2014.00045/full (accessed on 8 August 2020).
- Yoon, H.; Kim, C.; Chung, K.; Kim, S.; Lee, J.; Kumar, J. Solvent Extraction, Separation and Recovery of Dysprosium (Dy) and Neodymium (Nd) from Aqueous Solutions: Waste Recycling Strategies for Permanent Magnet Processing. Hydrometallurgy 2016, 165, 27–43. [Google Scholar] [CrossRef]
- Wang, L.; Huang, X.; Yu, Y.; Zhao, L.; Wang, C.; Feng, Z.; Long, Z. Towards Cleaner Production of Rare Earth Elements from Bastnaesite in China. J. Clean. Prod. 2017, 165, 231–242. [Google Scholar] [CrossRef]
- Gamboghi, J. Rare Earths: U.S. Geological Survey Mineral Commodity Summaries; USGS: Reston, VA, USA, 2015; pp. 128–129.
- Fouquet, Y.; Martel-Jantin, B. Rare and Strategic Metals. In Deep Marine Mineral Resources; Fouquet, Y., Lacroix, D., Eds.; Springer: Berlin/Heidelberg, Germany, 2014; pp. 55–64. [Google Scholar]
- McLellan, B.; Corder, G.; Golev, A.; Ali, S. Sustainability of the Rare Earths Industry. Procedia Environ. Sci. 2014, 20, 280–287. [Google Scholar] [CrossRef]
- Seredin, V. Rare Earth Element-Bearing Coals from the Russian Far East Deposit. Int. J. Coal Geol. 1996, 30, 101–129. [Google Scholar] [CrossRef]
- Akdogan, G.; Ghosh, T. Identification of REE in Some Alaskan Coal and Ash Samples; Mineral Industry Research Laboratory (MIRL) Institute of Northern Engineering, University of Alaska Fairbanks: Fairbanks, AK, USA, 2014. [Google Scholar]
- Hower, J.; Granite, E.; Mayfield, D.; Lewis, A.; Finkelman, R. Notes on Contributions to the Science of Rare Earth Element Enrichment in Coal and Coal Combustion Byproducts. Minerals 2016, 6, 32. [Google Scholar] [CrossRef]
- Kolker, A.; Scott, C.; Hower, J.; Vazquez, J.; Lopano, C.; Dai, S. Distribution of Rare Earth Elements in Coal Combustion Fly Ash, Determined by SHRIMP-RG Ion Microprobe. Int. J. Coal Geol. 2017, 184, 1–10. [Google Scholar] [CrossRef]
- Das, S.; Gaustad, G.; Sekar, A.; Williams, E. Techno-Economic Analysis of Supercritical Extraction of Rare Earth Elements from Coal Ash. J. Clean. Prod. 2018, 189, 539–551. [Google Scholar] [CrossRef]
- Huang, Q.; Noble, A.; Herbst, J.; Honaker, R. Liberation and Release of Rare Earth Minerals from Middle Kitanning, Fire Clay, and West Kentucky No. 13 Coal Sources. Powder Technol. 2018, 332, 242–252. [Google Scholar] [CrossRef]
- Lanzerstorfer, C. Pre-processing of Coal Combustion Fly Ash by Classification for Enrichment of Rare Earth Elements. Energy Rep. 2018, 4, 660–663. [Google Scholar] [CrossRef]
- Lin, R.; Soong, Y.; Granite, E. Evaluation of Trace Elements in U.S. Coals Using the USGS COALQUAL Database Version 3.0. Part I: Rare Earth Elements and Yttrium (REY). Int. J. Coal Geol. 2018, 192, 1–13. [Google Scholar] [CrossRef]
- Zhang, W.; Honaker, R. Rare Earth Elements Recovery Using Stages Precipitation from A Leachate Generated from Coarse Coa Refuse. Int. J. Coal Geol. 2018, 195, 189–199. [Google Scholar] [CrossRef]
- Valentim, B.; Abagiu, A.; Anghelescu, L.; Flores, D.; French, D.; Goncalves, P.; Ward, C. Assessment of Bottom Ash Landfilled at Ceplea Valley (Romania) As A Source of Rare Earth Elements. Int. J. Coal Geol. 2019, 201, 109–126. [Google Scholar] [CrossRef]
- Huang, Q.; Talan, D.; Restrepo, J.H.; Baena, O.J.R.; Kecojevic, V.; Noble, A. Characterization study of rare earths, yttrium, and scandium from various Colombian coal samples and non-coal lithologies. Int. J. Coal Geol. 2019, 209, 14–26. [Google Scholar] [CrossRef]
- Blissett, R.; Smalley, N.; Rowson, N. An Investigation into Six Coal Fly Ashes from the United Kingdom and Poland to Evaluate Rare Earth Element Content. Fuel 2014, 119, 236–239. [Google Scholar] [CrossRef]
- Seredin, V.; Dai, S. Coal Deposits as Potential Alternative Sources for Lanthanides and Yttrium. Int. J. Coal Geol. 2012, 94, 67–93. [Google Scholar] [CrossRef]
- He, Y. Regulations of China’s Rare Earth Production and Export. Int. J. Emerg. Mark. 2014, 9, 236–256. [Google Scholar] [CrossRef]
- Ault, T.; Krahn, S.; Croff, A. Radiological Impacts and Regulations of Rare Earth Elements in Non-Nuclear Energy Production. Energies 2015, 8, 2066–2081. [Google Scholar] [CrossRef]
- Qin, S.; Lu, Q.; Li, Y.; Wang, J.; Zhao, Q.; Gao, K. Relationships Between Trace Elements and Organic Matter in Coal. J. Geochem. Explor. 2018, 188, 101–110. [Google Scholar] [CrossRef]
- Kursun, I.; Tombal, T.; Terzi, M. Solubility of Eskisehir Thorium/Rare Earth Ores in Sulphuric and Nitric Acids. Physicochem. Probl. Miner. Process. 2018, 54, 476–483. [Google Scholar]
- Talan, D.; Huang, Q. Separation of Thorium, Uranium, and Rare Earths from a Strip Solution Generated from Coarse Coal Refuse. Hydrometallurgy 2020, 197, 105446. [Google Scholar] [CrossRef]
- Van Gosen, B.; Verplanck, P.; Seal, R.; Long, K.; Gambogi, J. Rare-Earth Elements, Chapter O. In Critical Mineral Resources of the United States-Economic and Environmental Geology and Prospects for Future Supply; Schulz, K.J., DeYoung, J.H., Seal, R.R., Bradley, D.C., Eds.; U.S. Geological Survey Professional Paper; USGS: Reston, VA, USA, 2017. [Google Scholar]
- Finkelman, R. Trace Elements in Coal Environmental and Health Significance. Biol. Trace Elem. Res. 1999, 67, 197–204. [Google Scholar] [CrossRef] [PubMed]
- Liu, Y.; Wang, Y.; Zhang, Z.; Cao, X.; Nie, W.; Li, Q.; Hua, R. Removal of Uranium from Aqueous Solution by A Low Cost and High-Efficient Adsorbent. Appl. Surf. Sci. 2013, 273, 68–74. [Google Scholar] [CrossRef]
- Sani, A.; Bandegharaei, A.; Hosseini, S.; Kharghani, K.; Zarei, H.; Rastegar, A. Kinetic, Equilibrium and Thermodynamic Studies on Sorption of Uranium and Thorium from Aqueous Solutions by A Selective Impregnated Resin Containing Carminic Acid. J. Hazard. Mater. 2015, 286, 152–163. [Google Scholar] [CrossRef]
- Couper, J.; Fair, J.; Penney, W.; Walas, S. Chemical Process Equipment: Selection and Design; Elsevier Science and Technology: Amsterdam, The Netherlands, 2009. [Google Scholar]
- Ladeira, A.; Goncalves, C. Influence of Anion Species on Uranium Separation from Acid Mine Water Using Strong Base Resins. J. Hazard. Mater. 2007, 148, 499–504. [Google Scholar] [CrossRef]
- Aksoyoglu, S. Sorption of U(VI) on Granite. J. Radioanal. Nucl. Chem. 1989, 134, 393–403. [Google Scholar] [CrossRef]
- Badei, M.; El-Naggar, I.; El-Belihi, A.; Aly, H.; Aly, H. Sorption Behaviour of Uranium on Tin(IV) Antimonate from Aqueous Solutions. Radiochim. Acta 1992, 56, 89–92. [Google Scholar]
- Milonjic, S.; Cokesa, D.; Stevanovic, R. Dynamic Adsorption of Uranium(VI) and Zirconium(IV) on Silica Gel. J. Radioanal. Nucl. Chem. 1992, 158, 79–90. [Google Scholar] [CrossRef]
- Qadeer, R.; Hanif, J.; Saleem, M.; Afzal, M. Effect of Alkali Metals, Alkaline Earth Metals and Lanthanides on the Adsorption of Uranium on Activated Charcoal from Aqueous Solutions. J. Radioanal. Nucl. Chem. 1992, 165, 243–253. [Google Scholar] [CrossRef]
- Misaelides, P.; Godelitsas, A.; Filippidis, A.; Charistos, D.; Anousis, I. Thorium and Uranium Uptake by Natural Zeolitic Materials. Sci. Total Environ. 1995, 173–174, 237–246. [Google Scholar] [CrossRef]
- Jain, V.; Handa, A.; Sait, S.; Shrivastav, P.; Agrawal, Y. Pre-concentration, Separation and Trace Determination of Lanthanum(III), Cerium(III), Thorium(IV) and Uranium(VI) on Polymer Supported o-Vanillinsemicarbazone. Anal. Chim. Acta 2001, 429, 237–246. [Google Scholar] [CrossRef]
- Kilislioglu, A.; Bilgin, B. Thermodynamic and Kinetic Investigations of Uranium Adsorption on Amberlite IR-118H Resin. Appl. Radiat. Isot. 2003, 58, 155–160. [Google Scholar] [CrossRef]
- Camacho, L.; Deng, S.; Parra, R. Uranium Removal from Groundwater by Natural Clinoptilolite Zeolite: Effects of pH and Initial Feed Concentration. J. Hazard. Mater. 2010, 175, 393–398. [Google Scholar] [CrossRef]
- Wang, Y.; Zhang, Z.; Liu, Y.; Cao, Z.; Liu, Y.; Li, Q. Adsorption of U(VI) from Aqueous Solution by the Carboxyl-Mesoporous Carbon. Chem. Eng. J. 2012, 198–199, 246–253. [Google Scholar] [CrossRef]
- Kaynar, U.; Ayvacikli, M.; Hicsonmez, U.; Kaynar, S. Removal of Thorium(IV) Ions from Aqueous Solutions by A Novel Nanoporous ZnO: Isotherms, Kinetic and Thermodynamic Studies. J. Environ. Radioact. 2015, 150, 145–151. [Google Scholar] [CrossRef]
- Doi, K.; Hirono, S.; Sakamaki, Y. Uranium Mineralization by Ground Water in Sedimentary Rocks, Japan. Econ. Geol. 1975, 70, 628–646. [Google Scholar] [CrossRef]
- Sikalidis, C.; Alexiades, C.; Misaelides, P. Adsorption of Uranium and Thorium from Aqueous Solutions by the Clay Minerals Montmorillonite and Vermiculite. Toxicol. Environ. Chem. 2008, 20–21, 175–180. [Google Scholar] [CrossRef]
- Kutahyali, C.; Eral, M. Sorption Studies of Uranium and Thorium on Activated Carbon Prepared from Olive Stones: Kinetic and Thermodynamic Aspects. J. Nucl. Mater. 2010, 396, 251–256. [Google Scholar] [CrossRef]
- Fasfous, I.; Dawoud, J. Uranium(VI) Sorption by Multiwalled Carbon Nanotubes from Aqueous Solution. Appl. Surf. Sci. 2012, 259, 433–440. [Google Scholar] [CrossRef]
- Khalili, F.; Al-Banna, G. Adsorption of Uranium(VI) and Thorium(IV) by insolubilized Humic Acid from Ajloun Soil—Jordan. J. Environ. Radioact. 2015, 146, 16–26. [Google Scholar] [CrossRef] [PubMed]
- Monji, A.; Ghoulipour, V.; Mallah, M. Selective Sorption of Uranium (IV) from Hydrochloric Acid Media by Agro-Industrial Byproducts. Ann. Nucl. Energy 2016, 97, 115–121. [Google Scholar] [CrossRef]
- Zou, W.; Zhao, L.; Han, R. Removal of Uranium (VI) by Fixed Bed Ion-Exchange Column Using Natural Zeolite Coated with Manganese Oxide. Chin. J. Chem. Eng. 2009, 17, 585–593. [Google Scholar] [CrossRef]
- Cheira, M.; Atia, B.; Kouraim, M. Uranium (VI) Recovery from Acidic Leach Liquor by Ambersep 920U SO4 Resin: Kinetic, Equilibrium and Thermodynamic Studies. J. Radiat. Res. Appl. Sci. 2017, 10, 307–319. [Google Scholar] [CrossRef]
- Erden, K.; Donat, R. Removal of Thorium(IV) from Aqueous Solutions by Natural Sepiolite. Radioachimica Acta 2016, 105, 187–196. [Google Scholar] [CrossRef]
- Kammerer, J.; Carle, R.; Kammerer, D. Adsorption and Ion Exchange: Basic Principles and Their Application in Food Processing. J. Agric. Food Chem. Rev. 2011, 59, 22–42. [Google Scholar] [CrossRef] [PubMed]
- Bertetti, P.; Pabalan, R.; Pickett, D.; Turner, D. Radionuclide Sorption Technical Assistance Activities at the Center for Nuclear Waste Regulatory Analyses; U.S Nuclear Regulatory Comission: San Antonio, TX, USA, 2011.
- Obaid, S.; Gaikwad, D.; Sayyed, M.; Al-Rashdi, K.; Pawar, P. Heavy Metal Ions Removal from Waste Water by the Natural Zeolites. Materials Today: Proceedings; Elsevier: Amsterdam, The Netherlands, 2018; pp. 17930–17934. [Google Scholar]
- Kaygun, A.; Akyil, S. Study of the Behavior of Thorium Adsorption on PAN/Zeolite Composite Adsorbent. J. Hazard. Mater. 2007, 147, 357–362. [Google Scholar] [CrossRef]
- Baybas, D.; Ulusoy, U. The Use of Polyacrylamide-Aluminosilicate Composites for Thorium Adsorption. Appl. Clay Sci. 2011, 51, 138–146. [Google Scholar] [CrossRef]
- Li, F.; Yang, Z.; Weng, H.; Chen, G.; Lin, M.; Zhao, C. High Efficient Separation of U(VI) and Th(IV) from Rare Earth Elements in Strong Acidic Solution by Selective Sorption on Phenanthroline Diamide Functionalized Graphene Oxide. Chem. Eng. J. 2018, 332, 340–350. [Google Scholar] [CrossRef]
- Langmuir, I. The Adsorption of Gases on Plane Surfaces of Glass, Mica and Platinum. Am. Chem. Soc. 1918, 40, 1361–1368. [Google Scholar] [CrossRef]
- Barkat, M.; Nibou, D.; Amokrane, S.; Chegrouche, S.; Mellah, A. Uranium (VI) Adsorption on Synthesized 4A and P1 Zeolites: Equilibrium, Kinetic, and Thermodynamic Studies. Comptes Rendus Chim. 2015, 18, 261–269. [Google Scholar] [CrossRef]
- Piccin, J.; Dotto, G.; Pinto, L. Adsorption Isotherms and Thermochemical Data of FD&C Red N 40 Binding by Chitosan. Braz. J. Chem. Eng. 2011, 28, 295–304. [Google Scholar]
- Aytas, S.; Akyil, S.; Eral, M. Adsorption and Thermodynamic Behavior of Uranium on Natural Zeolite. J. Radioanal. Nucl. Chem. 2004, 260, 119–125. [Google Scholar] [CrossRef]
- Zendelska, A.; Golomeova, M.; Blazev, K.; Krstev, B.; Golomeov, B.; Krstev, A. Adsorption of Copper Ions from Aqueous Solutions on Natural Zeolite. Environ. Prot. Eng. 2015, 260, 17–36. [Google Scholar]
- Thommes, M.; Kaneko, K.; Niemark, A.; Olivier, J.; Rodriguez-Reinoso, F.; Rouquerol, J.; Sing, K. Physisoprtion of Gases, With Special Reference to the Evaluation of Surface Area and Pore Size Distribution. Pure Appl. Chem. 2015, 87, 1051–1064. [Google Scholar] [CrossRef]
- Faghihian, H.; Maragheh, M.; Amini, M.; Nezamzadeh, A. Thorium Ion Uptake by Zeolite a Synthesized from Natural Clinoptilolite Tuffs. Adsorpt. Sci. Technol. 2004, 22, 707–717. [Google Scholar] [CrossRef]
- Motsi, T.; Rowson, N.; Simmons, M. Adsorption of Heavy Metals from Acid Mine Drainage by Natural Zeolite. Int. J. Miner. Process. 2009, 92, 42–48. [Google Scholar] [CrossRef]
- Muhling, J.; Suvorova, A.; Rasmussen, B. The Occurrence and Composition of Chevkinite-(Ce) and Perrierite-(Ce) in Theoleitic Intrusive Rocks and Lunar Mare Basalt. Am. Mineral. 2014, 99, 1911–1921. [Google Scholar] [CrossRef]
- Chukanov, N.; Blass, G.; Pekov, I.; Belakovskiy, D.; Van, K.; Rastsvetaeva, R.; Aksenov, S. Perrierite-(La), (La,Ce,Ca)4(Fe2+,Mn)(Ti,Fe3+,Al)4(Si2O7)2O8, A New Species from the Eifel Volcanic District, Germany. Geol. Ore Depos. 2012, 54, 647–655. [Google Scholar] [CrossRef]
- Godelitsas, A.; Armbruster, T. HEU-type Zeolites Modified by Transition Elements and Lead. Microporous Mesoporous Mater. 2003, 61, 3–24. [Google Scholar] [CrossRef]
- Malamis, S.; Katsou, E. A Review on Zinc and Nickel Adsorption on Natural and Modified Zeolite, Bentonite and Vermiculite: Examination of Process Parameters, Kinetics and Isotherms. J. Hazard. Mater. 2013, 252–253, 428–461. [Google Scholar] [CrossRef] [PubMed]
Publisher’s Note: MDPI stays neutral with regard to jurisdictional claims in published maps and institutional affiliations. |
© 2020 by the authors. Licensee MDPI, Basel, Switzerland. This article is an open access article distributed under the terms and conditions of the Creative Commons Attribution (CC BY) license (http://creativecommons.org/licenses/by/4.0/).