Article

The Effects of NaOH Concentration on the Hydrothermal Synthesis of a Hydroxyapatite–Zeolite Composite Using Blast Furnace Slag

1
Department of Civil and Environmental Engineering, Korea Advanced Institute of Science and Technology, Guseong-dong, Yuseong-gu, Daejeon 34141, Korea
2
Civil and Environmental Engineering Department, King Fahd University of Petroleum & Minerals, Dhahran 31261, Saudi Arabia
3
Department of Infrastructure Safety Research, Korea Institute of Civil Engineering and Building Technology, Ilsan 10223, Korea
*
Author to whom correspondence should be addressed.
Minerals 2021, 11(1), 21; https://doi.org/10.3390/min11010021
Submission received: 10 December 2020 / Revised: 22 December 2020 / Accepted: 24 December 2020 / Published: 27 December 2020

Abstract

:
This study investigated the effect of NaOH concentration on the assemblage, crystallinity, and dimension of crystalline phases in hydroxyapatite–zeolite composites made with blast furnace slag. X-ray diffraction (XRD), Fourier transform infrared (FT-IR) spectroscopy measurement, scanning electron microscopy (SEM), and nitrogen adsorption–desorption tests were conducted to characterize the synthesized composites. In addition, the cesium adsorption potential of the synthesized composites was evaluated to assess the feasibility of using hydroxyapatite–zeolite composites synthesized from blast furnace slag. The composite samples using a 3 M NaOH solution showed the formations of Na-P1 and Faujasite (FAU) zeolites along with hydroxyapatite, which led to the highest adsorption capacity for cesium (44.90 mg/g).

1. Introduction

Zeolites, which have a chemical formula of Am[AlmSinO2(m+n)]·xH2O (where A represents alkali metals), and hydroxyapatite (Ca10(PO4)6(OH)2) are widely used materials in various fields, especially in the field of environmental engineering and for medical applications [1,2,3,4]. In particular, zeolites and hydroxyapatite have been used as adsorbents for water purification because of their high ion exchangeabilities with a high specific surface area [5,6,7,8,9]. It is well known that zeolites have a particular affinity towards cation adsorption, because of their cation exchangeability [10,11]. On the other hand, the Ca2+ and OH ions of hydroxyapatite can be replaced by the other cations and anions, respectively [6,12,13,14,15,16]. Many studies have removed Cl, F, NO3, and AsO43− using this phenomenon [6,12,13,14,15,16]. Moreover, Ozeki and Aoki [17] reported that hydroxyapatite has a better adsorption capacity for strontium than zeolite, while zeolite has a better adsorption capacity for cesium than hydroxyapatite, meaning that zeolites and hydroxyapatite have different adsorption capacities for certain cation ions. Therefore, zeolites and hydroxyapatite can compensate for each other’s drawbacks when used simultaneously.
Blast furnace slag is an industrial byproduct, rich in calcium, silicon, and aluminum components. About 400 million tons of slag are produced annually worldwide as a byproduct of the steelmaking process [18,19]. A major portion of the generated blast furnace slag is used as a supplementary cementitious material in the concrete industry in an effort to reduce environmental impacts that occur from the use of Portland cement [20,21,22,23,24]. Several studies have utilized blast furnace slag for the synthesis of adsorbents, yet these studies were not able to fully utilize calcium content in the blast furnace slag for increasing the adsorption performance, considering the high calcium availability in blast furnace slag [25,26,27]. It has been reported recently that zeolites and hydroxyapatites can be simultaneously synthesized from blast furnace slag under hydrothermal conditions [8,13]. Kuwahara et al. [1,13] synthesized zeolites and hydroxyapatite using blast furnace slag, observing the formation of these phases over time. Ryu et al. [8] investigated the effects of the reaction temperature on the hydrothermal synthesis of zeolites and hydroxyapatite using blast furnace slag. It was found that hydroxyapatite was solely synthesized under 90 °C, while both zeolites and hydroxyapatite were synthesized above 90 °C [8]. Moreover, hydroxysodalite was formed above 120 °C at the expense of zeolites [8].
It has also been reported in literature that the initial alkalinity of the mixture also played important roles in the hydrothermal synthesis of zeolites and hydroxyapatite using fly ash and deoxycytidine diphosphate (C9H15N3O10P2), respectively [28,29]. Earlier works on the hydrothermal synthesis of hydroxyapatite reported that the high initial pH of the mixtures led to the formation of high crystalline hydroxyapatite with large particles of more than 20 μm [28,30,31]. However, previous studies revealed that the crystallinity and particle size of hydroxyapatite synthesized by the hydrothermal treatment reduced as the initial pH of the mixture increased beyond the proper level [32,33]. This indicates that a certain pH range should be used to obtain the appropriate crystallinity and particle size of hydroxyapatite [34]. The structure, morphology, and particle size distribution of the synthesized zeolites are also deeply affected by the NaOH concentration of the initial mixture [29].
The effects of the initial NaOH concentration on the synthesis of hydroxyapatite using blast furnace slag have not, to the best of our knowledge, been reported in the literature. In this study, thus, the effect of NaOH concentration on the assemblage, crystallinity, and dimension of crystalline phases in hydroxyapatite–zeolite composites synthesized from blast furnace slag was investigated. To characterize the synthesized composites, X-ray diffraction (XRD), Fourier transform infrared (FT-IR) spectroscopy measurement, scanning electron microscopy (SEM), and nitrogen adsorption–desorption tests for Brunauer-Emmett-Teller (BET) and Barrett-Joyner-Halenda (BJH) analyses were conducted. The cesium adsorption potential of the composite was also evaluated so as to assess the feasibility of using hydroxyapatite–zeolite composites synthesized from blast furnace slag.

2. Experimental Program

2.1. Sample Perparation

The chemical compositions of blast furnace slag (produced from Hyundai Jecheol, Dangjin, Korea) measured using the X-ray fluorescence test are listed in Table 1. The composite samples were synthesized as follows: a suspension composed of 30 g of blast furnace slag and 200 mL of phosphoric acid (H3PO4, 85%, Samchun Pure Chemical Co., Ltd., Pyeongtaek, Korea) solution was stirred at 350 rpm for 2 h. It should be noted that the Ca/P molar ratio of the suspension was fixed at 1.7, as recommended in previous works [1,8,13,31]. In this step, dicalcium phosphate dihydrate (CaHPO4·2H2O) is synthesized [13].
Ca2+ + H+ + PO4 + 2H2O = CaHPO4·2H2O
Subsequently, 350 mL of NaOH (97%, Daejung Chemicals and Metals Co., Ltd., Siheung, Korea) solution with specific concentrations of 0.5, 1, 2, 3, 4, or 5 M were added to the suspension for the alkaline activation; thereafter, the samples were stirred at 450 rpm for 2 h. From this step, dicalcium phosphate dihydrate is slowly changed into hydroxyapatite [13]. The mechanism details of the formation of hydroxyapatite and zeolite from blast furnace slag can be found in Kuwahara et al. [1,13]. The samples activated with 0.5, 1, 2, 3, 4, or 5 M were denoted as HZ-0.5, HZ-1, HZ-2, HZ-3, HZ-4, and HZ-5, respectively. Thus, the liquid to solid phase ratio was 550 mL/30 g in this study. In this step, the pH of mixtures was measured to be 12.3, 12.8, and 13.1 for HZ-0.5, HZ-1, and HZ-2, respectively, while it was more than 14 for the remaining samples. The samples were poured into fully sealed Teflon bottles and then heated at 90 °C in an oven for 48 h. After heating, the samples were washed and filtered, followed by drying at 90 °C overnight to obtain white powders.

2.2. Characterization

The crystalline phases of the synthesized composite samples were characterized by XRD using a PANalytical X’Pert PRO-MPD at the Korea Basic Science Institute (Daegu, DA107). The composite samples were scanned at a 2θ 5–50° scan range with a 0.2°/min scanning rate. The reference intensity ratio (RIR) method was used to estimate the possible quantities of the crystalline phases estimated by XRD patterns of the synthesized composite samples [35]. The FT-IR measurements using 6300FV and IRT5000 devices (JASCO, Tokyo, Japan) were taken in a range of 1900–450 cm−1 under a vacuum state. SEM tests using HITACHI SU5000 (Hitachi, Ltd., Tokyo, Japan) were conducted to explore the crystal morphology and the size of the synthesized composite samples. Before the SEM tests, the surfaces of the synthesized samples were coated with Pt to increase the visibility of the morphologies. Nitrogen adsorption–desorption tests were conducted using Tristar II 3020 (Micromeritics, Atlanta, GA, USA) to measure the specific surface area and the pore size distributions of the composite samples using the BET/BJH methods.

2.3. Batch Test

To investigate the cesium adsorption capacities of the synthesized composite samples, 200 mL of 0.01 M CsCl solution, approximately equal to 1329 ppm for Cs+, was prepared for each synthesized composite sample. It should be noted that the concentration of Cs+ for the batch test was referenced from Ozeki and Aoki [17], in which the Cs+ adsorption experiments were conducted using zeolite and hydroxyapatite. Before the batch test, the synthesized samples were powdered to pass through a 64 μm sieve. Next, 2 g of the sieved composite samples were added into the CsCl solution and were shaken at 120 rpm until the extraction of the solutions. The batch composite samples were taken at 1, 3, 10, 30, and 60 min, and were immediately filtered using a 2 μm syringe filter. The residual Cs+ concentration taken from the batch composite sample was measured using an inductively coupled plasma mass spectrometer (ICP-MS, Agilent ICP-MS 7700S, Agilent, Santa Clara, CA, USA).

3. Crystallin Characteristics and Microstructures of the Composites

3.1. Crystalline Characteristics

The XRD patterns of the raw slag and the synthesized composite samples are shown in Figure 1. The presence of calcite (CaCO3; PDF# 00-005-0586), portlandite (Ca(OH)2; PDF# 00-037-1496), and anhydrite (CaCO4; PDF# 01-072-0916) were detected in the XRD pattern of the raw slag, along with an amorphous feature. The HZ-0.5, HZ-1, and HZ-2 samples solely showed peaks corresponding to the hydroxyapatite (Ca10(PO4)6(OH)2, PDF# 01-074-0565) phase. On the other hand, the HZ-3 sample contained hydroxyapatite, Na-P1 zeolite (typically referred to as Na6Al6Si10O32·12H2O PDF# 01-071-0962), and faujasite (FAU) zeolite (typically referred to as Na56Al56Si136O384 PDF# 00-012-0246) phases. The XRD pattern of the HZ-4 and HZ-5 samples showed hydroxyapatite, Na-P1 zeolite, and hydroxysodalite (generally denoted in Na8Al6Si6O24 PDF# 00-042-0216) phases. This indicates that zeolite phases cannot be produced when the concentration of the NaOH solution is lower than 3 M. The initial pH of the HZ-0.5, HZ-1, and HZ-2 samples were 12.3, 12.8, and 13.1, respectively, whereas the initial pH of the HZ-3 sample was beyond 14. It should be noted that the possible measurement range of the pH level was limited to 14 in this experiment. On the other hand, hydroxysodalite, which is a zeolite-like material but has a lower specific surface area than that of zeolites, was formed in the HZ-4 and HZ-5 samples [8,25].
The crystallinities and quantitative contents of the phases of the synthesized composite samples as measured from the XRD patterns in the RIR method are listed in Table 2. It is clear that the crystallinity of the synthesized composite samples was influenced by the NaOH concentration of the initial mixture. The crystallinity increased significantly as the molarity of NaOH increased from 0.5 to 3 M. However, a further increase in the NaOH molarity did not have a significant effect on the crystallinity. The measured hydroxyapatite contents of the HZ-0.5, HZ-1, HZ-2, HZ-3, HZ-4, and HZ-5 samples were 25, 40, 55, 54, 48, and 52 wt.%, respectively. The hydroxyapatite content tended to be increased significantly as the concentration of the NaOH solution increased from 0.5 to 2 M. However, a further increase in the NaOH molarity did not promote the formation of hydroxyapatite. Zeolite phases were produced in the composite samples made with a NaOH solution possessing a concentration higher than 2 M. The 1 wt.% of FAU zeolite was produced only in the HZ-3 sample. The amount of Na-P1 zeolite, which has a higher adsorption capacity than FAU zeolite and hydroxysodalite, was approximately 9 wt.% in the HZ-3 sample. On the other hand, the HZ-4 and HZ-5 samples contained 13 wt.% and 10 wt.% of hydroxysodalite, respectively, whereas the hydroxyapatite and Na-P1 zeolite contents in these samples decreased compared with those of the HZ-3 sample. It is surmised that a further increase in the NaOH solution concentration decreases the crystallization of the Na-P1 zeolite. This result is similar to previous studies [36,37,38]. The difference in the formed crystalline phases for each composite sample is possibly associated with the Na+ and OH concentration in the initial sample mixture and the solubility of Si and Al in different alkaline conditions. Si and Al are known to be soluble in alkali conditions [6,17,28,30,33]. According to Wang et al. [29], the change in the amount of dissolved Al with an increasing NaOH concentration was negligibly small compared with the changes in the amount of dissolved Si. The amount of dissolved Si increased considerably with increasing the NaOH concentration [29]. Zeolite formation usually needs a high Si content than Al [29,39]. This phenomenon led to satisfying the SiO2/Al2O3 molar ratio required for zeolite formation, by increasing the NaOH concentration. Moreover, The formation of hydroxysodalite requires a higher SiO2/Al2O3 molar ratio (2-∞) than that of the FAU (2-3) and Na-P1 zeolites (2-9) [40], hence it was formed only in samples HZ-4 and HZ-5.
The FT-IR spectra of the composite samples are shown in Figure 2. Most of the adsorption peaks of the PO43− groups are overlapped with those of the silica groups (466, 963, 1037, and 1093 cm−1) [1], whereas the peaks at 566 and 603 cm−1 solely denote PO43− groups in hydroxyapatite [1]. The 747–732 cm−1 peak reveals the formation of zeolite phases [1]. The peaks at 1417 and 1467 cm−1 represent CO32− groups, which are usually detected from hydroxyapatite synthesized in the air, because CO32− can partially replace PO43− for the synthesis of hydroxyapatite [1,41,42]. Although the HZ-2, HZ-3, HZ-4, and HZ-5 samples had these peaks, the HZ-0.5 and HZ-1 samples did not have them. This might be because the amount of the synthesized hydroxyapatite in these samples was low. In samples HZ-2, HZ-3, HZ-4, and HZ-5, CO32− was used to synthesize hydroxyapatite. Alternatively, PO43− would be sufficient to synthesize the hydroxyapatite in the HZ-0.5 and HZ-1 samples because of the lower amounts of synthesized hydroxyapatite (≤40%).

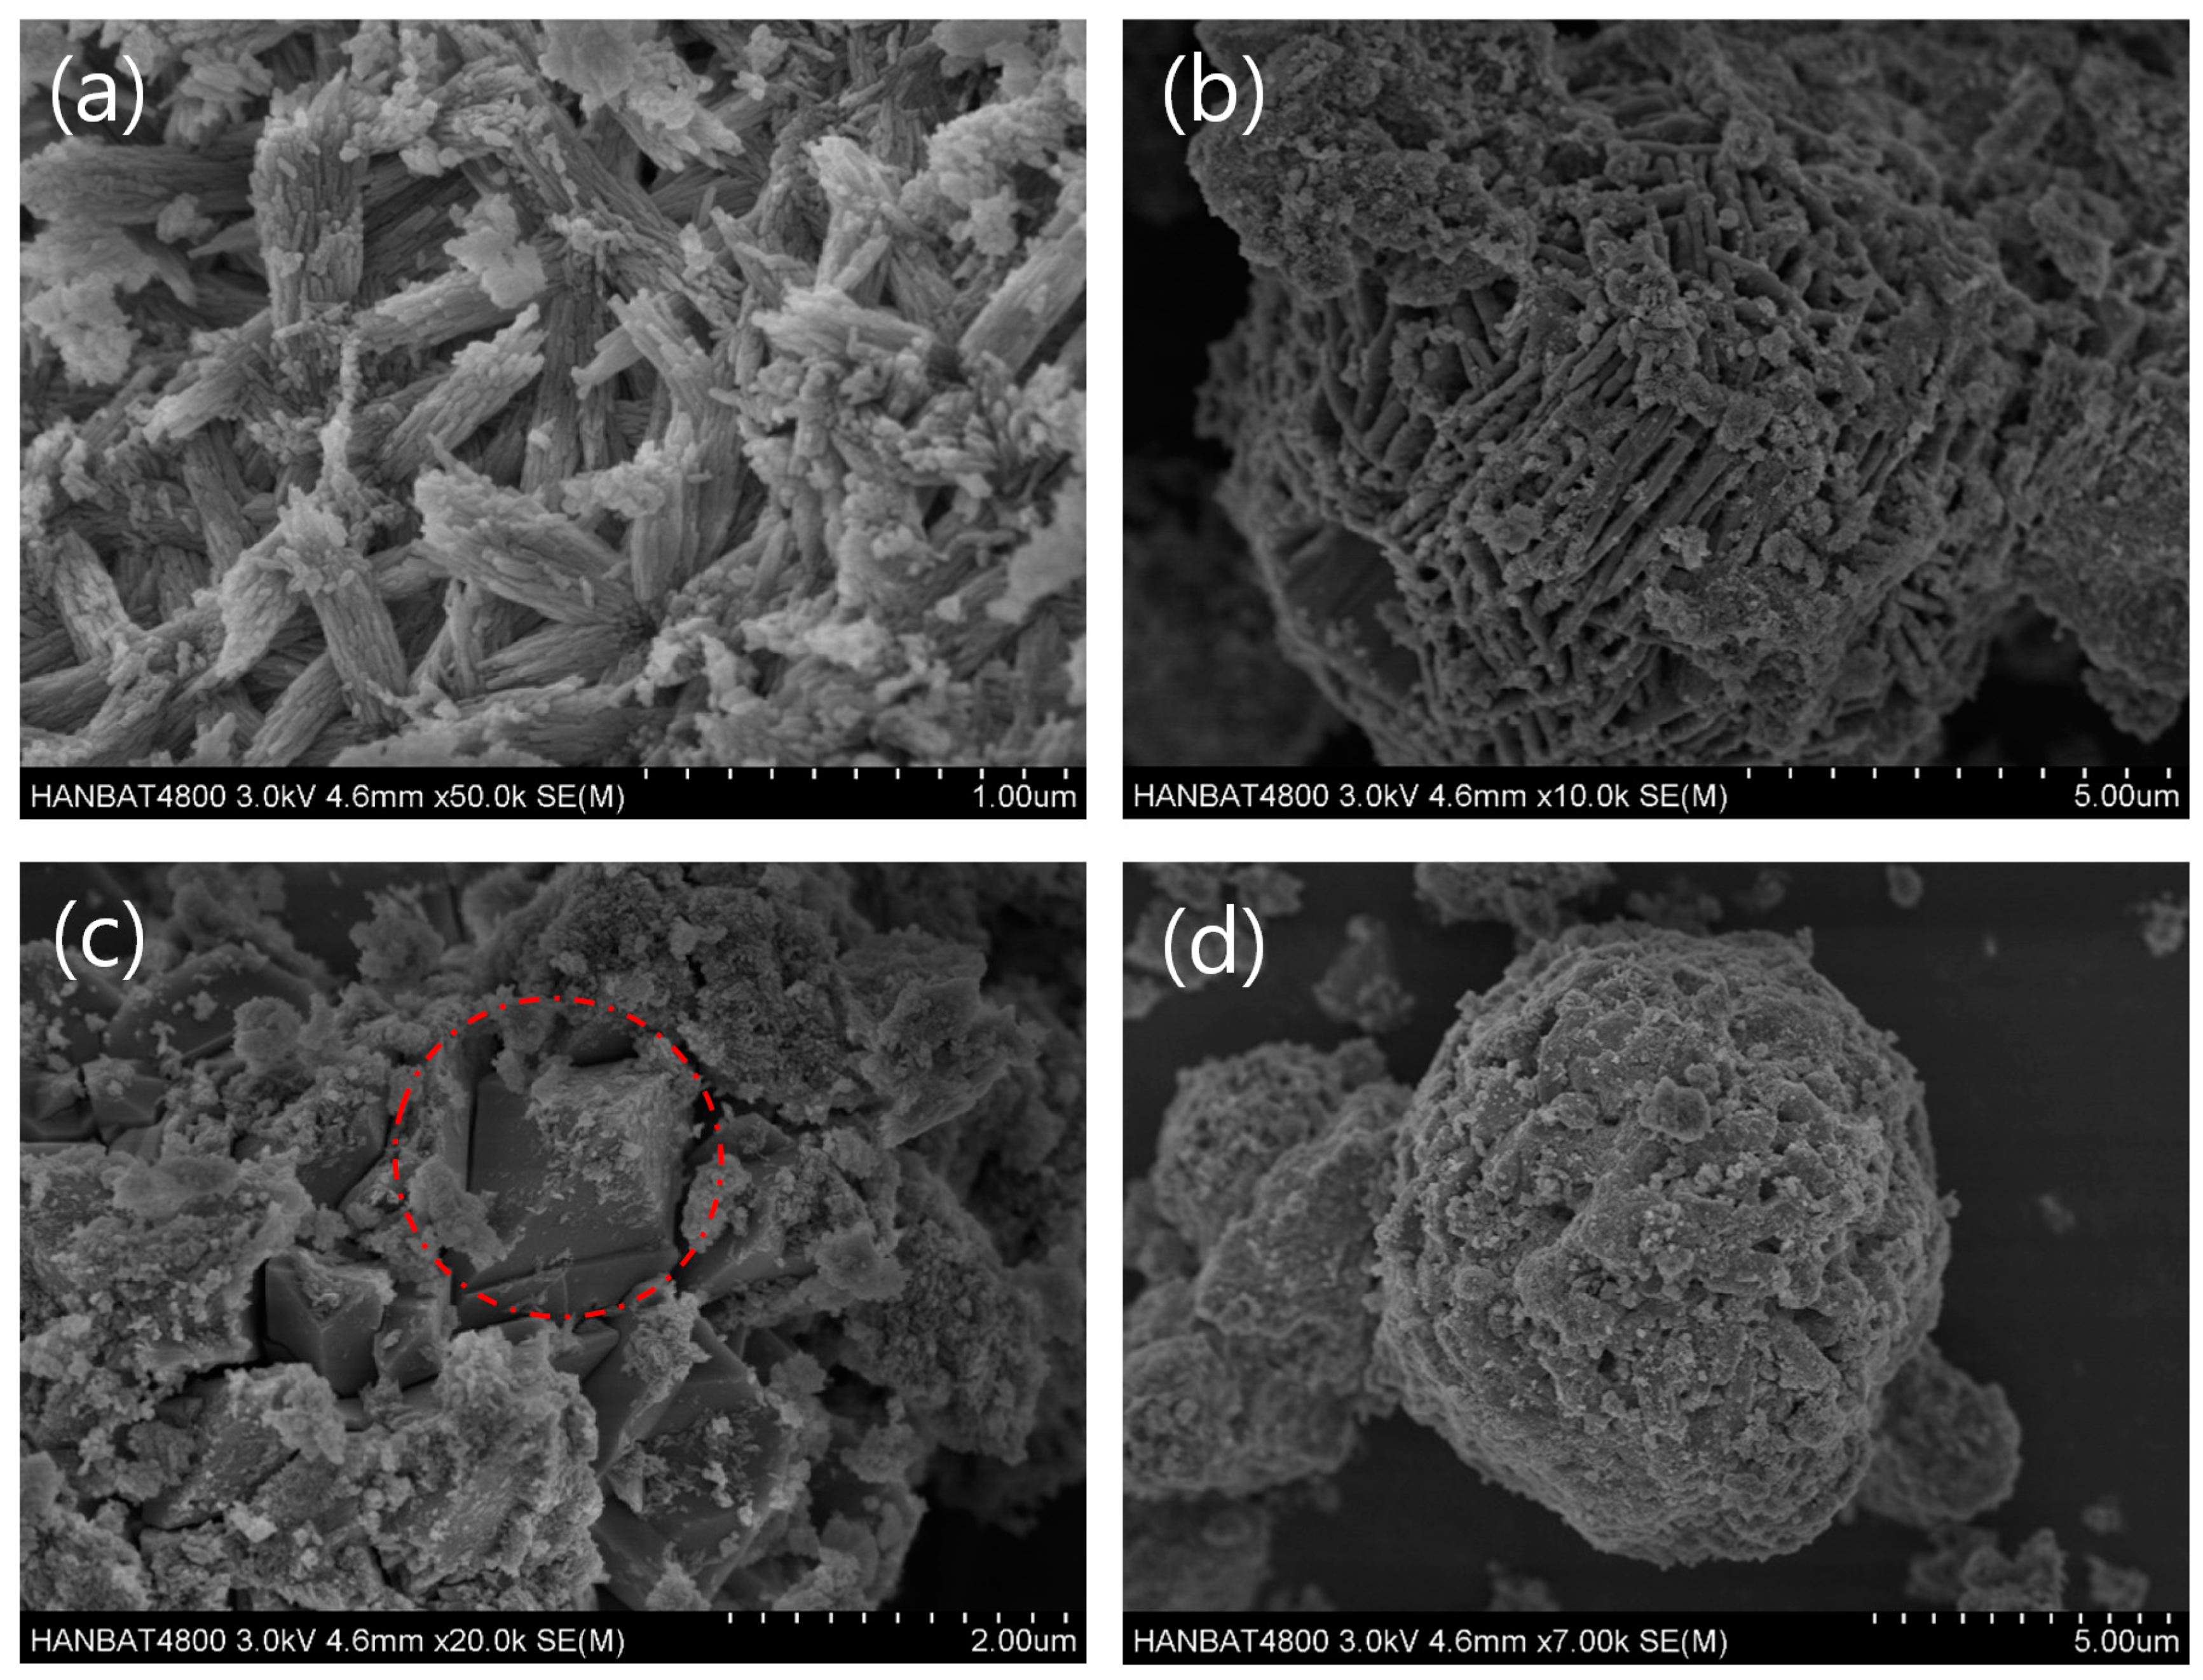
3.2. Morphology and Particle Size

The SEM images of hydroxyapatite (captured from the HZ-5 sample), FAU zeolite (captured from the HZ-3 sample), Na-P1 zeolite (captured from the HZ-5 sample), and hydroxysodalite (captured from the HZ-5 sample) are shown in Figure 3. The SEM images of hydroxyapatite, Na-P1 zeolite, and hydroxysodalite were captured from the HZ-5 sample, as the HZ-5 sample had the highest crystallinity among the samples. On the other hand, the SEM image of the FAU zeolite was captured from the HZ-3 sample, as only the HZ-3 sample had it. The hydroxyapatite crystals in the HZ-5 sample (Figure 3a) resemble bundles of needles [43]. The spherical-shaped FAU zeolite crystals in the HZ-3 sample (Figure 3b) had a diameter of approximately 90 μm, with a hierarchical pore system and rectangle shape [44]. The diamond-like Na-P1 crystals with a red circle in Figure 3, approximately 18 μm in size, were also detected in the HZ-5 sample (Figure 3c) [27]. In Figure 3d, hydroxysodalite crystals with an approximately 90 μm diameter and rectangle shape are shown [45].
The SEM images of the hydroxyapatite crystalline with needle-like shapes captured from the HZ-0.5, HZ-2, HZ-3, and HZ-5 samples are shown in Figure 4. The hydroxyapatite crystals in the composite samples were denoted by red circles in Figure 4. Figure 4 indicates the effect of NaOH concentration on the synthesized hydroxyapatite crystals. As the initial concentration of NaOH increased, it was found that the size and crystallinity of the hydroxyapatite crystals increased. The hydroxyapatite crystals with a needle-like shape in the HZ-0.5 sample were not clear enough to measure the crystal sizes, as the crystals were too small and could not easily be identified. In addition, the sizes of hydroxyapatite crystals in the HZ-2 sample were longer and thicker than that of the HZ-0.5 sample, but the size was confirmed to be up to a length of approximately 1 μm. On the other hand, the crystals of the HZ-3 sample were identified as needle-like shaped hydroxyapatite, and the length ranged from 1 to 3 μm. It was confirmed that the HZ-5 sample had well-developed hydroxyapatite, which could be easily identified from the other crystals, because of their length of 2–7 μm and the bundle of needle shapes.
Nevertheless, as the concentration of the alkali activator increased, and the aggregations of the hydroxyapatite crystals intensified. As reported by Hansen et al. [46], it was found that as the pH of the initial mixture increased, the aggregation of the synthesized hydroxyapatite crystals increased, which resulted in a decrease in both the specific surface area and adsorption capacity [47]. This phenomenon could be as a result of the surface energy of hydroxyapatite crystals [46,48]. The higher alkaline condition led to a higher surface energy of hydroxyapatite crystals, and it led to the aggregation of hydroxyapatite crystals [46,49].

3.3. Pore Structures

To investigate the specific surface area and pore structures of the synthesized composite samples, a BET/BJH test from the nitrogen adsorption–desorption test result was conducted. The BET/BJH test results and the pore size distributions of the synthesized composite samples measured from BJH tests are shown in Table 3 and Figure 5, respectively. Among the synthesized composite samples, the HZ-3 sample had the highest BET specific surface area (143.32 m2/g), followed by the HZ-0.5 sample (102.81 m2/g), while the HZ-2 sample had the lowest BET specific surface area (32.12 m2/g). An increase in NaOH concentration led to a decrease in the specific surface area of the synthesized composite sample for the HZ-0.5, HZ-1, and HZ-2 samples, which solely had a hydroxyapatite phase. The changes in the specific surface area of the samples were not linear, because the crystal phases were changed for each alkali condition. This is attributed to the increased aggregation of the hydroxyapatite crystals, as also indicated in the SEM images [47]. The aggregation of the hydroxyapatite crystals could result in a disconnection of the pore connection system in hydroxyapatite crystals, and this phenomenon could lead to a reduction in the specific surface area of the hydroxyapatite crystals. Because of the formation of zeolite phases (FAU and Na-P1 zeolite) with a high specific surface area [8], the HZ-3 sample had the highest specific surface area. The specific surface area of the HZ-4 sample was much lower than that of the HZ-3 sample because of the formation of hydroxysodalite, which has a lower specific surface area than that of the Na-P1 zeolite and FAU zeolite [27].
Khalid et al. [27] reported that the relatively small pores make the hierarchical connection system of pores in crystals, and the more relatively small pores lead to a high specific surface area in the synthesized samples. In this study, the BJH adsorption average pore diameter of the samples generally tended to be inversely proportional to the specific surface area of the samples. This means that the specific surface area of the sample increases, as the relatively small pores contain more than the large pores, because the relatively small pores establish a hierarchical connection system of pores. Although the distribution of large pores in the sample is small, in Figure 5, it can be seen that the specific surface area of the sample with many small pores is in Figure 5. Similarly, Liu et al. [47] reported that a smaller ratio of microporous area/specific surface area led to an increase in the specific area.

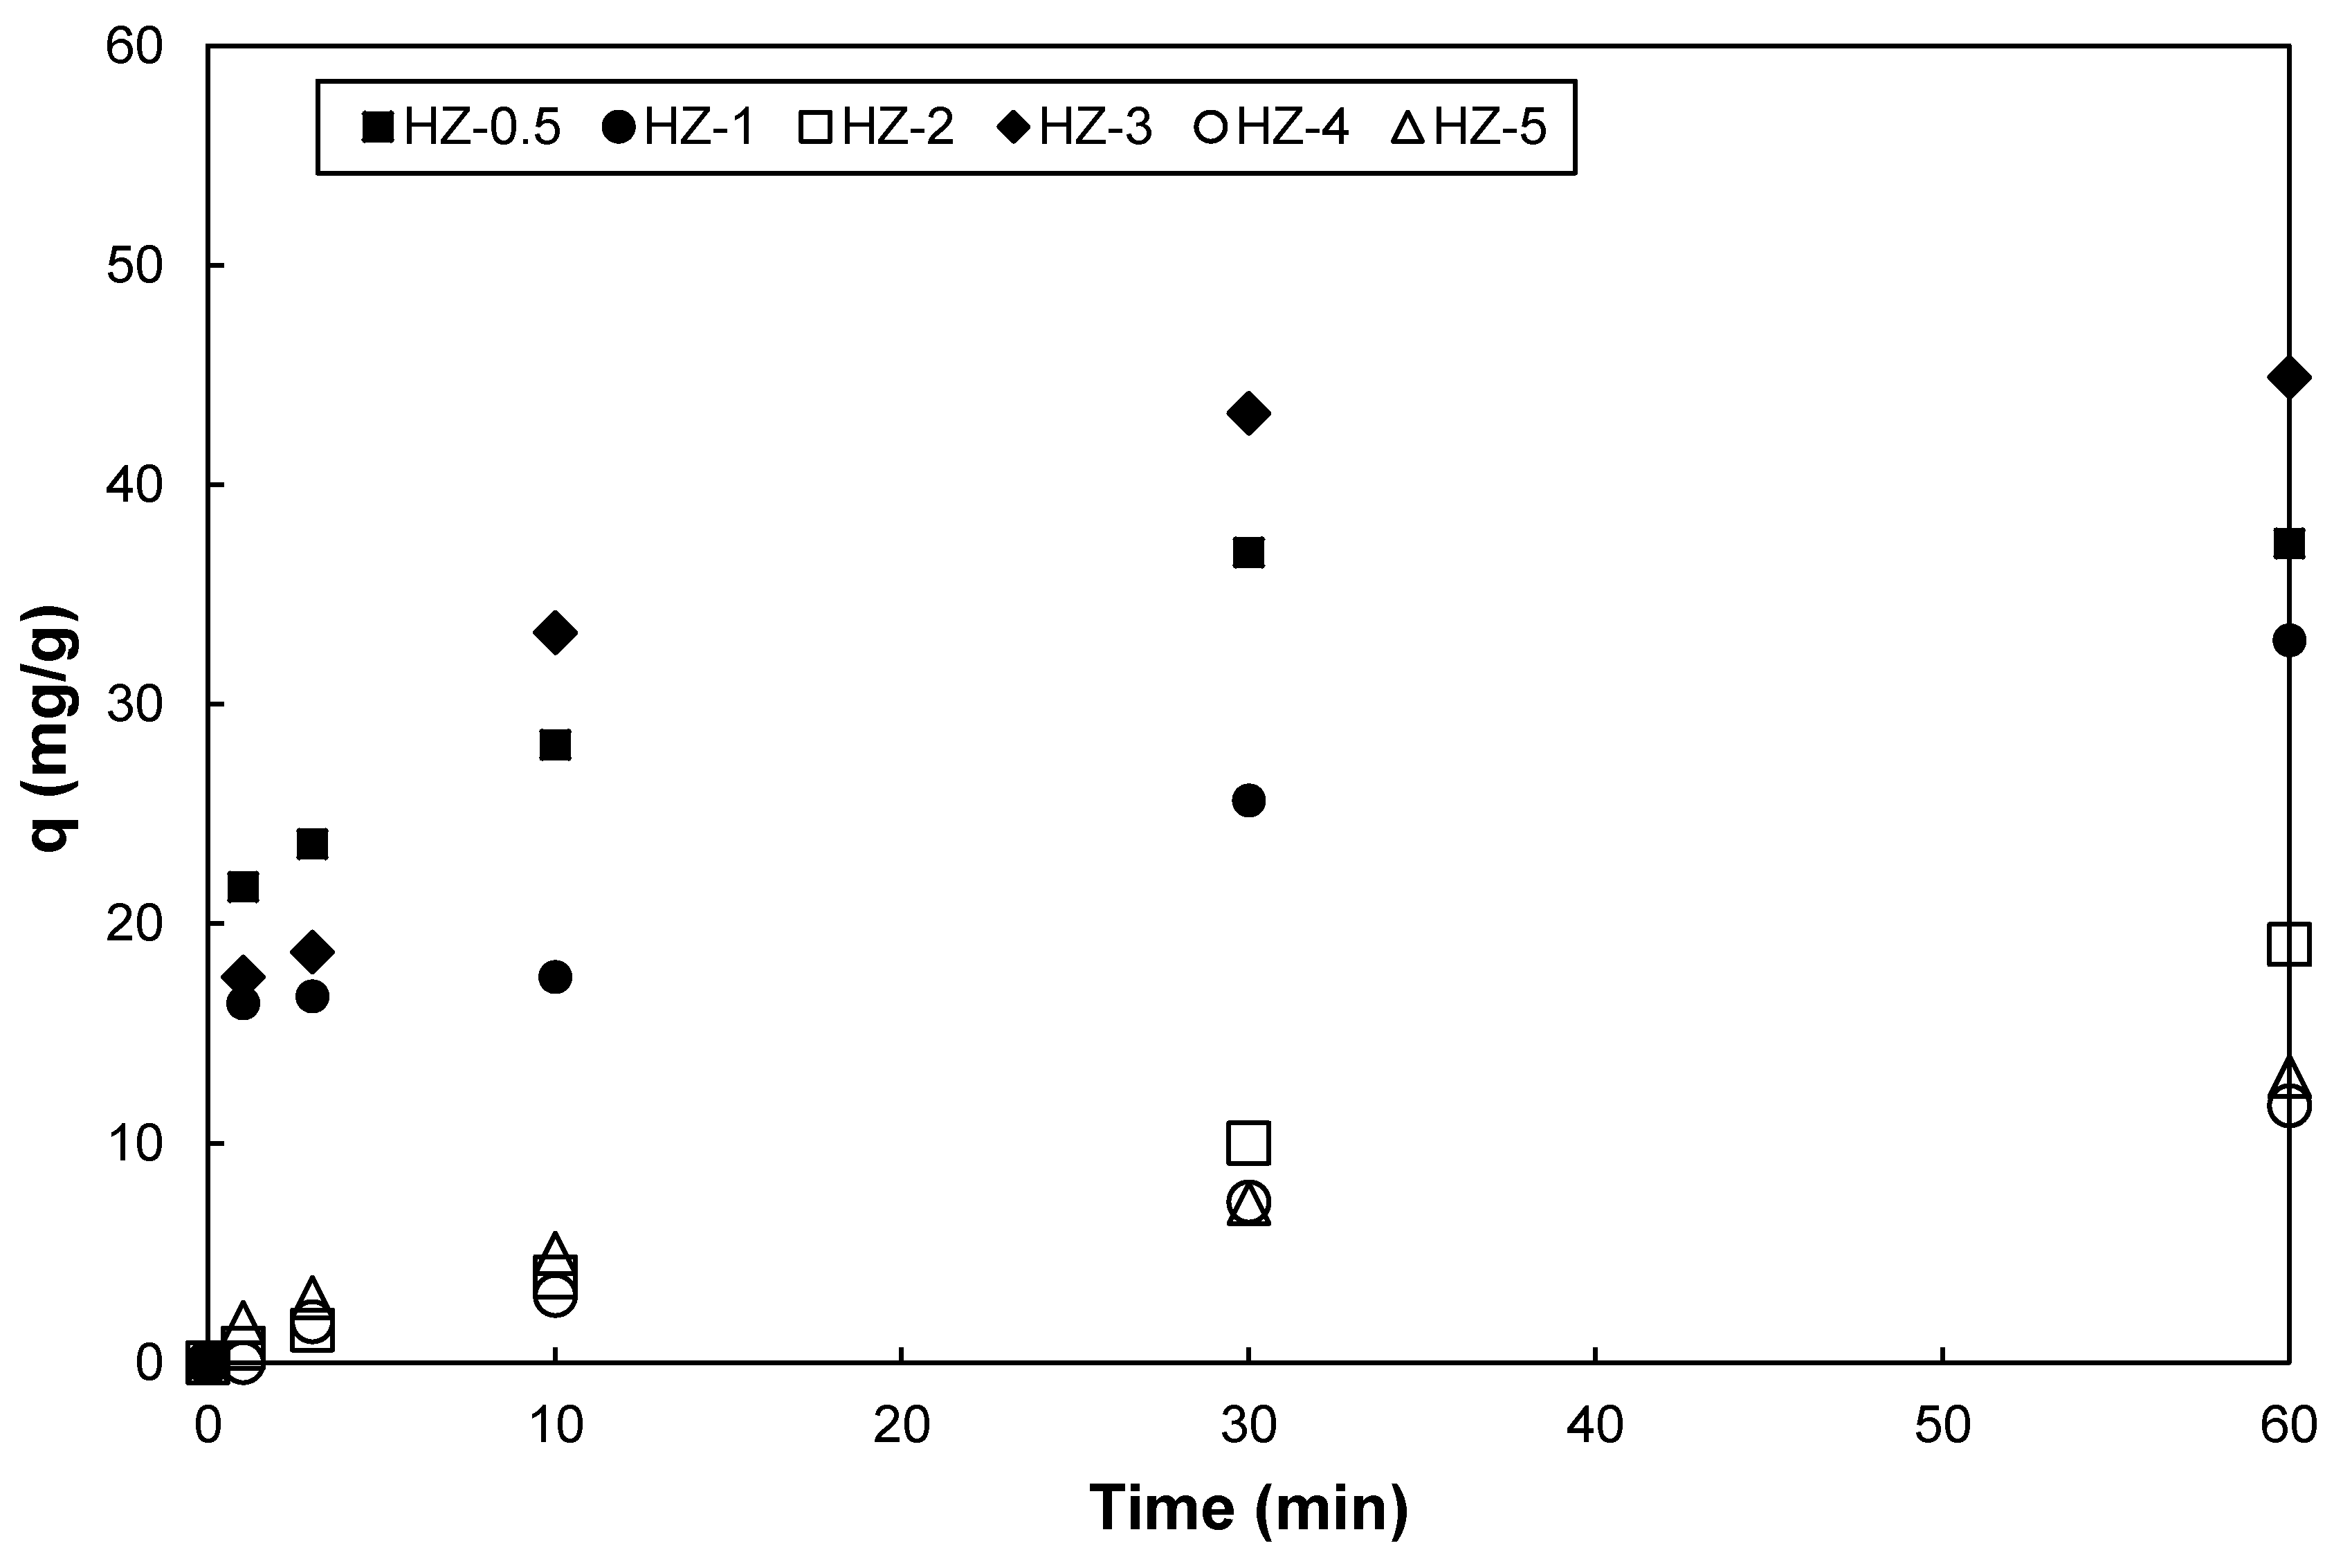
4. Cesium Adsorption Capacities of the Composites

The cesium adsorption capacities of the synthesized composite samples measured from the ICP-MS tests are shown in Figure 6. The HZ-3 sample showed the highest adsorption capacity (44.90 mg/g) because of the formation of FAU and Na-P1 zeolites, followed by the HZ-0.5 sample (37.31 mg/g). The formation of zeolites led to a higher specific surface area and ionic forces. The adsorption test results revealed that both zeolite and hydroxyapatite have a high potential for Cs+ adsorption; however, it is better to use hydroxyapatite–zeolite composites compared with pure hydroxyapatite for adsorbents. Thus, it is recommended to synthesize both hydroxyapatite and zeolite from blast furnace slag to remove Cs+. However, HZ-4 and HZ-5 had lower adsorption capacities than that of HZ-0.5, HZ-1, and HZ-2, although they had the Na-P1 zeolite. This could be due to the intensified aggregation of hydroxyapatite crystals and the formation of hydroxysodalite.
For the samples containing hydroxyapatite solely (the HZ-0.5, -1, and -2 samples), the adsorption capacities tended to decrease as the NaOH concentration of the initial sample mixture increased. This is a result of the high concentration of NaOH, leading to the aggregation of hydroxyapatite crystals. The aggregation resulted in a decrease in the specific surface area, which could prevent the diffusion of Cs+ ions into the crystal (see Table 3). Thus, Ca2+ ions located deep inside the hydroxyapatite crystals might not undergo ion exchange with Cs+ ions. This phenomenon ultimately led to a reduction in the adsorption capacity of the synthesized composite sample. For further insight, the adsorption capacities of the synthesized composite samples against the BET surface area are shown in Figure 7. Regarding the HZ-0.5, HZ-1, HZ-2, and HZ-3 samples, the adsorption capacity increased with the specific surface area. On the other hand, hydroxyapatite–hydroxysodalite (the HZ-4 and HZ-5 samples), which was synthesized with a high concentration of alkali activator, had a relatively low adsorption capacity (11.72 and 13.03 mg/g) against the specific surface area compared with the other composite samples. This is ascribed to hydroxysodalite having a lower adsorption capacity than FAU zeolite and Na-P1 zeolite. Moreover, the intensified aggregation of hydroxyapatite crystals possibly led to the decreased adsorption capacity of the hydroxyapatite, as mentioned above [47,50].
Overall, increasing the alkali activator concentration augmented the aggregation of hydroxyapatite crystals, thereby reducing their specific surface area [46,47]. On the other hand, the HZ-3 sample showed the highest adsorption capacity because of the high specific surface area resulting from the formation of Na-P1 and FAU zeolite [1]. The specific surface area and adsorption capacity of the HZ-4 and HZ-5 samples were greatly decreased because of the formation of hydroxysodalite and the intensified aggregation of hydroxyapatite crystals [47,50].

5. Concluding Remarks

In this study, the effect of the NaOH concentration on the hydrothermal synthesis of hydroxyapatite–zeolite made with blast furnace slag was investigated. The composite samples synthesized with different concentrations of NaOH solutions were characterized by XRD, FT-IR, SEM, and BET/BJH analyses. The adsorption capacities of the synthesized composite samples for Cs+ were investigated. The results of this study can be summarized as follows:
(1)
As the NaOH concentration increased from 0.5 to 3 M, the overall crystallinity increased from about 25% to about 66%. However, a further increase in the NaOH concentration did not affect the overall crystallinity. Instead, the crystalline phases and their content varied.
(2)
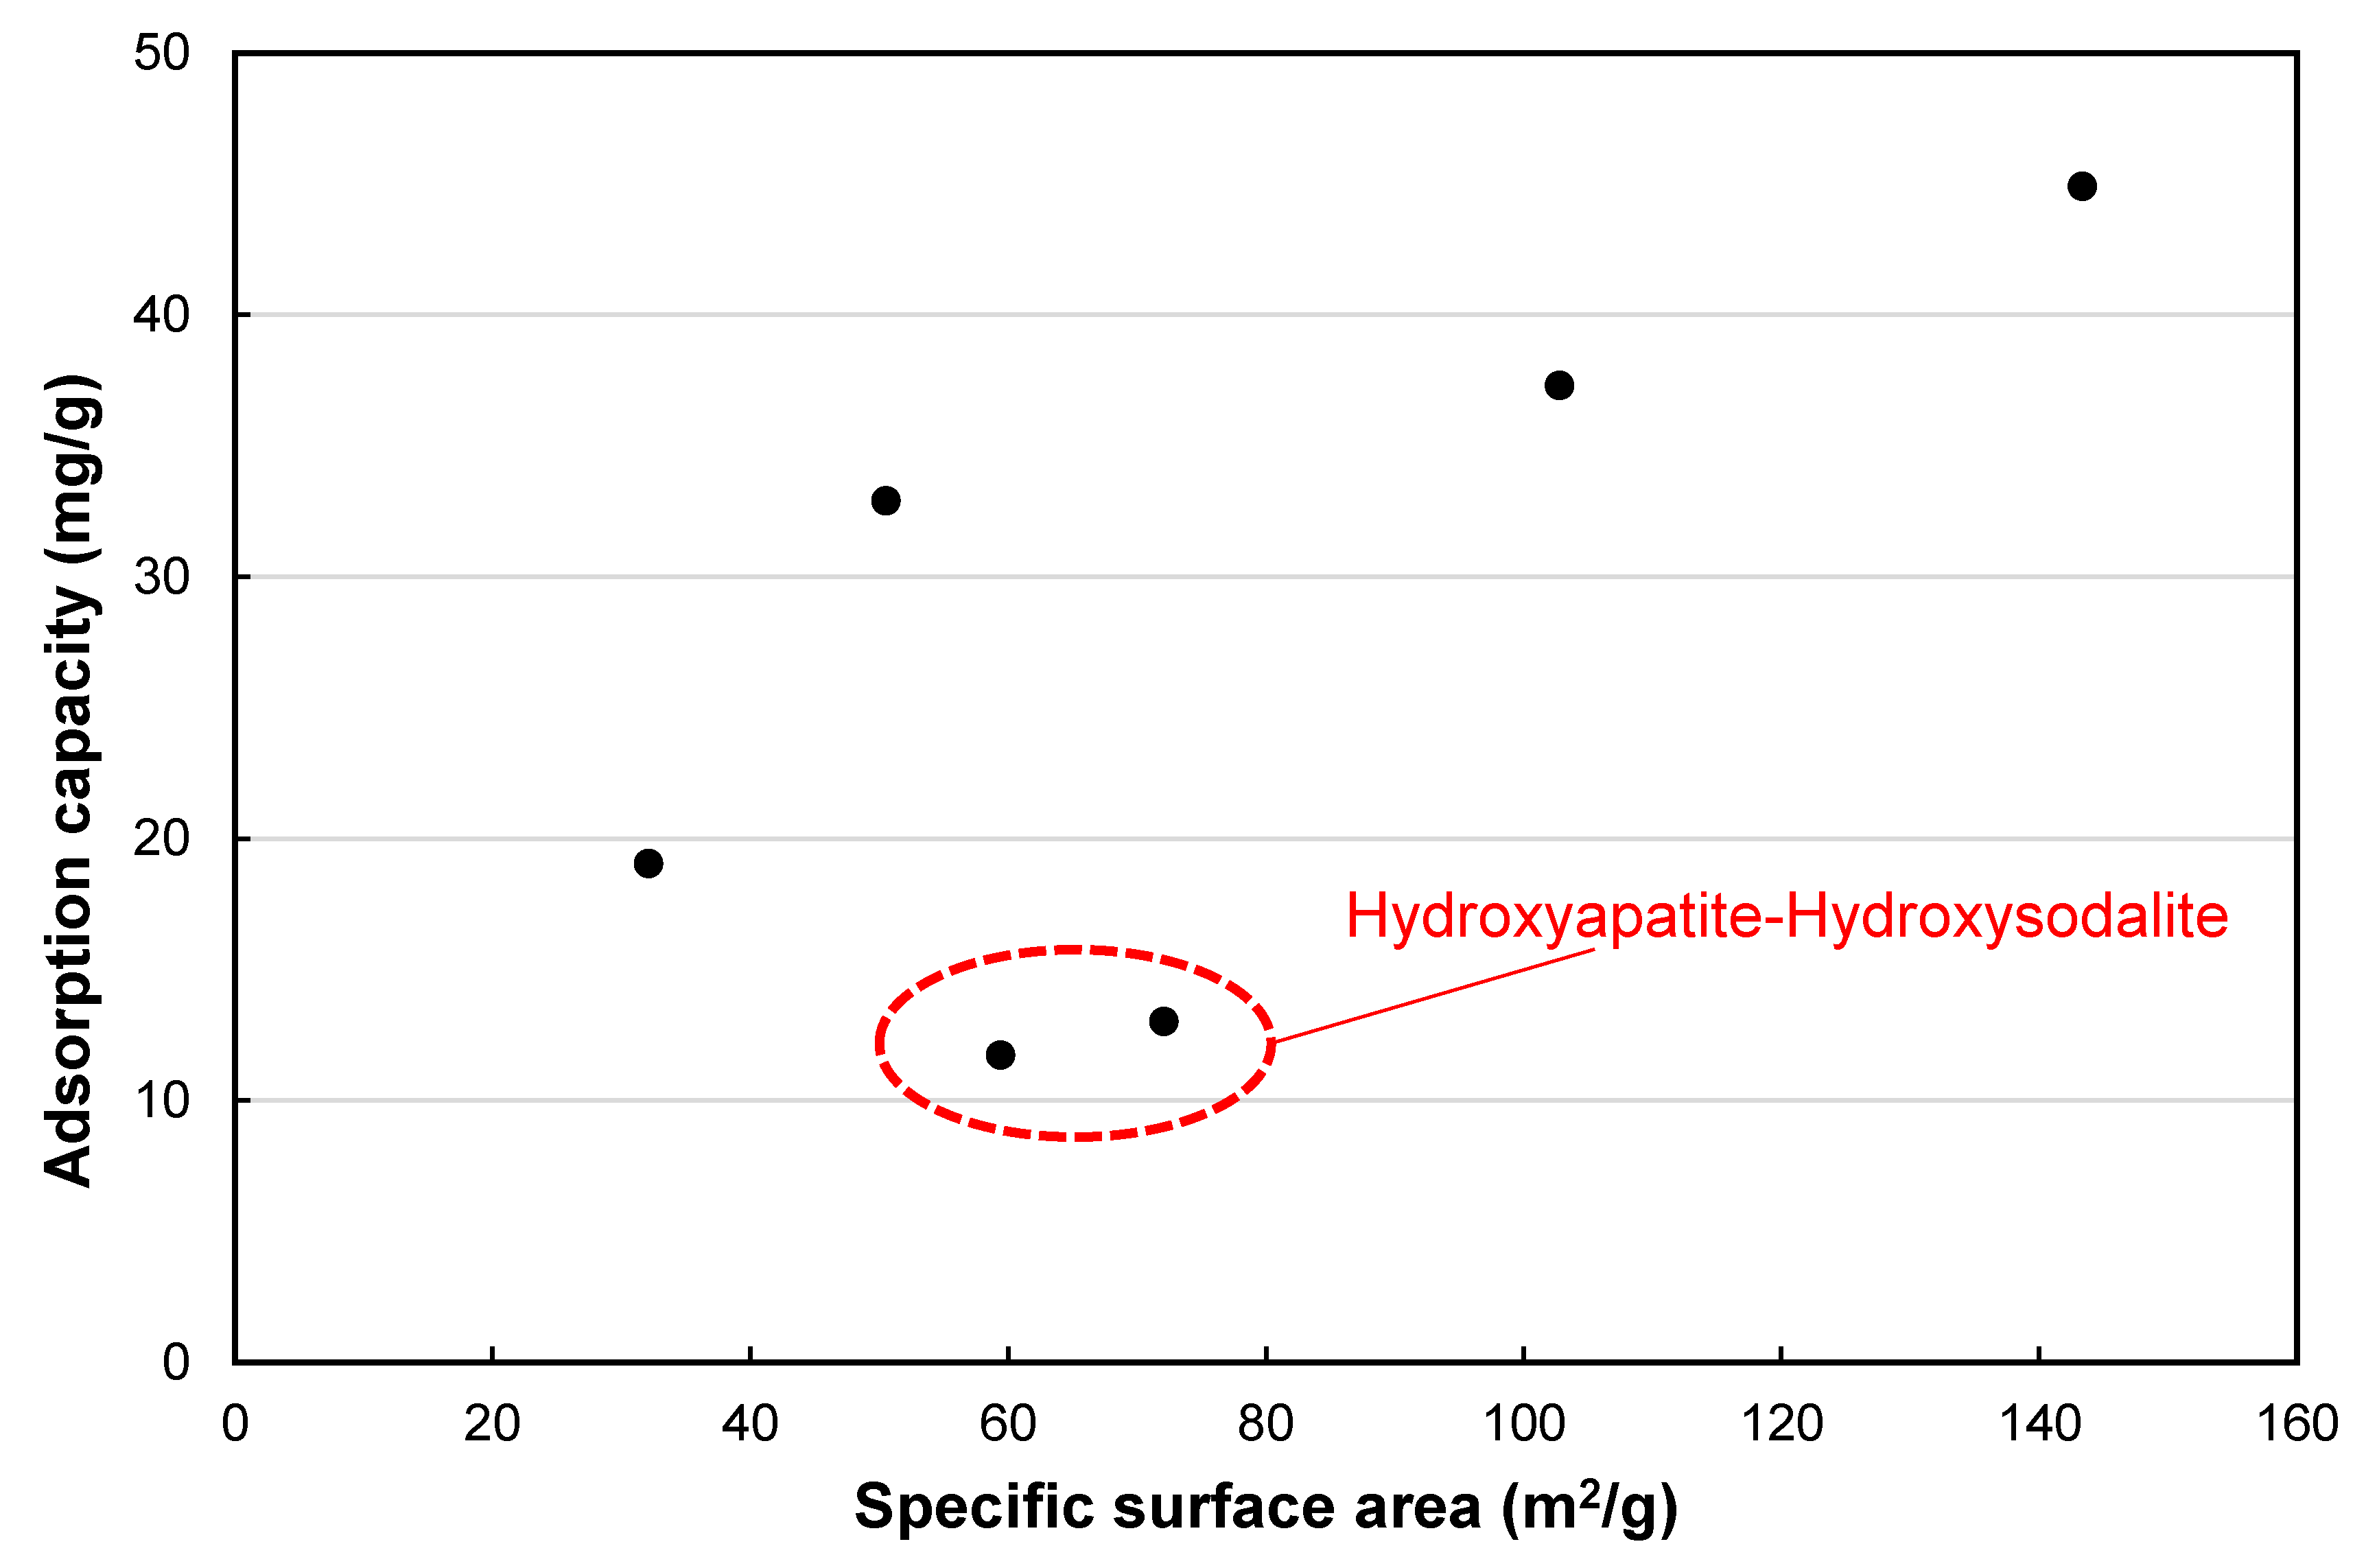
The composite samples synthesized with a 0.5, 1, or 2 M NaOH solution contained an increasing content of the sole crystalline phase, i.e., hydroxyapatite. Nevertheless, the specific surface area and adsorption capacity of the composite samples for Cs+ decreased in these composite samples because of the aggregation of hydroxyapatite crystals as the concentration of the NaOH solution increased from 0.5 to 2 M.
(3)
The composite sample synthesized with 3 M of the NaOH solution had the highest specific area and adsorption capacity for Cs+ among all of the composite samples in this study, because of the formation of Na-P1 and FAU zeolites along with hydroxyapatite.
(4)
A further increase in the NaOH molarity (more than 4 M) resulted in a reduced specific surface area and adsorption capacity for Cs+ because of the formation of hydroxysodalite and the intensified aggregation of hydroxyapatite.
In conclusion, the optimal concentration for the NaOH solution is around 3 M, at which zeolite phases can be formed, resulting in an improved adsorption capacity for the slag-based adsorbents. Research on the particle size before and after synthesis needs to be conducted in the future.

Author Contributions

Conceptualization, H.R.K. and G.U.R.; methodology, H.R.K. and G.U.R.; validation, G.U.R.; formal analysis G.U.R. and Z.W.; investigation, G.U.R.; writing—original draft preparation, G.U.R.; writing—review and editing, G.U.R., N.L., H.R.K., Z.W. and H.K.L.; supervision, H.K.L.; project administration, H.K.L.; funding acquisition, H.K.L. All authors have read and agreed to the published version of the manuscript.

Funding

This research was supported by a grant from the National Research Foundation of Korea (NRF; 2018R1A2A1A05076894), funded by the Korean government.

Data Availability Statement

The data presented in this study are available on request from the corresponding author.

Acknowledgments

The authors acknowledge H. J. No at KBSI (Daegu) for their useful discussion and for collecting the XRD data.

Conflicts of Interest

The authors declare no conflict of interest.

References

  1. Kuwahara, Y.; Ohmichi, T.; Kamegawa, T.; Mori, K.; Yamashita, H. A novel synthetic route to hydroxyapatite-zeolite composite material from steel slag: Investigation of synthesis mechanism and evaluation of physicochemical properties. J. Mater. Chem. 2009, 19, 7263–7272. [Google Scholar] [CrossRef]
  2. Saito, M.; Maruoka, A.; Mori, T.; Sugano, N.; Hino, K. Experimental studies on a new bioactive bone cement: Hydroxyapatite composite resin. Biomaterials 1994, 15, 156–160. [Google Scholar] [CrossRef]
  3. He, P.; Ding, J.; Qin, Z.; Tang, L.; Haw, K.G.; Zhang, Y.; Fang, Q.; Qiu, S.; Valtchev, V. Binder-free preparation of ZSM-5@silica beads and their use for organic pollutant removal. Inorg. Chem. Front. 2020, 7, 2080–2088. [Google Scholar] [CrossRef]
  4. Wang, Y.; Jia, H.; Chen, P.; Fang, X.; Du, T. Synthesis of La and Ce modified X zeolite from rice husk ash for carbon dioxide capture. J. Mater. Res. Technol. 2020, 9, 4368–4378. [Google Scholar] [CrossRef]
  5. Roy, D.M.; Linnehan, S.K. Hydroxyapatite formed from coral skeletal carbonate by hydrothermal exchange. Nature 1974, 247, 220. [Google Scholar] [CrossRef] [PubMed]
  6. He, J.; Zhang, K.; Wu, S.; Cai, X.; Chen, K.; Li, Y.; Sun, B.; Jia, Y.; Meng, F.; Jin, Z.; et al. Performance of novel hydroxyapatite nanowires in treatment of fluoride contaminated water. J. Hazard. Mater. 2016, 303, 119–130. [Google Scholar] [CrossRef] [PubMed]
  7. Kendrick, E.; Dann, S. Synthesis, properties and structure of ion exchanged hydrosodalite. J. Solid State Chem. 2004, 177, 1513–1519. [Google Scholar] [CrossRef]
  8. Ryu, G.U.; Kim, G.M.; Khalid, H.R.; Lee, H.K. The effects of temperature on the hydrothermal synthesis of hydroxyapatite-zeolite using blast furnace slag. Materials 2019, 12, 2131. [Google Scholar] [CrossRef] [Green Version]
  9. Yang, C.; Zhang, W.; Wang, J.; Li, S.; Liu, X.; Dou, L.; Yue, T.; Sun, J.; Wang, J. Nanostructured morphology control and phase transition of zeolitic imidazolate frameworks as an ultra-high performance adsorbent for water purification. Inorg. Chem. Front. 2019, 6, 2667–2674. [Google Scholar] [CrossRef]
  10. Gómez del Río, J.A.; Morando, P.J.; Cicerone, D.S. Natural materials for treatment of industrial effluents: Comparative study of the retention of Cd, Zn and Co by calcite and hydroxyapatite. Part I: Batch experiments. J. Environ. Manag. 2004, 71, 169–177. [Google Scholar] [CrossRef]
  11. Lee, N.K.; Khalid, H.R.; Lee, H.K. Adsorption characteristics of cesium onto mesoporous geopolymers containing nano-crystalline zeolites. Microporous Mesoporous Mater. 2017, 242, 238–244. [Google Scholar] [CrossRef]
  12. Yanagisawa, K.; Rendon-Angeles, J.C.; Ishizawa, N.; Oishi, S. Topotaxial replacement of chlorapatite by hydroxyapatite during hydrothermal ion exchange. Am. Mineral. 1999, 84, 1861–1869. [Google Scholar] [CrossRef]
  13. Kuwahara, Y.; Ohmichi, T.; Kamegawa, T.; Mori, K.; Yamashita, H. Synthesis of Hydroxyapatite–Zeolite Composite Material from Disposed Steel Slag and Investigation of Its Structural and Physicochemical Characteristics. Chem. Lett. 2009, 38, 626–627. [Google Scholar] [CrossRef]
  14. Islam, M.; Chandra Mishra, P.; Patel, R. Physicochemical characterization of hydroxyapatite and its application towards removal of nitrate from water. J. Environ. Manag. 2010, 91, 1883–1891. [Google Scholar] [CrossRef] [PubMed]
  15. Islam, M.; Mishra, P.C.; Patel, R. Arsenate removal from aqueous solution by cellulose-carbonated hydroxyapatite nanocomposites. J. Hazard. Mater. 2011, 189, 755–763. [Google Scholar] [CrossRef]
  16. Chen, L.; Zhang, K.S.; He, J.Y.; Xu, W.H.; Huang, X.J.; Liu, J.H. Enhanced fluoride removal from water by sulfate-doped hydroxyapatite hierarchical hollow microspheres. Chem. Eng. J. 2016, 285, 616–624. [Google Scholar] [CrossRef]
  17. Ozeki, K.; Aoki, H. Evaluation of the adsorptive behavior of cesium and strontium on hydroxyapatite and zeolite for decontamination of radioactive substances. Bio-Med Mater. Eng. 2016, 27, 227–236. [Google Scholar] [CrossRef]
  18. Pan, S.Y.; Chung, T.C.; Ho, C.C.; Hou, C.J.; Chen, Y.H.; Chiang, P.C. CO2 Mineralization and Utilization using Steel Slag for Establishing a Waste-to-Resource Supply Chain. Sci. Rep. 2017, 7, 17227. [Google Scholar] [CrossRef]
  19. Motz, H.; Geiseler, J. Products of steel slags an opportunity to save natural resources. Waste Manag. 2001, 21, 285–293. [Google Scholar] [CrossRef]
  20. Kim, G.M.; Khalid, H.R.; Park, S.M.; Lee, H.K. Flow Property of Alkali-Activated Slag with Modified Precursor. ACI Mater. J. 2017, 114, 867–876. [Google Scholar] [CrossRef]
  21. Kim, G.M.; Khalid, H.R.; Kim, H.J.; Lee, H.K. Alkali activated slag pastes with surface-modified blast furnace slag. Cem. Concr. Compos. 2017, 76, 39–47. [Google Scholar] [CrossRef]
  22. Lee, N.K.; Kim, E.M.; Lee, H.K. Mechanical properties and setting characteristics of geopolymer mortar using styrene-butadiene (SB) latex. Constr. Build. Mater. 2016, 113, 264–272. [Google Scholar] [CrossRef]
  23. Jang, J.G.; Park, S.M.; Lee, H.K. Physical barrier effect of geopolymeric waste form on diffusivity of cesium and strontium. J. Hazard. Mater. 2016, 318, 339–346. [Google Scholar] [CrossRef] [PubMed]
  24. Jiang, L.; Li, C.; Wang, C.; Xu, N.; Chu, H. Utilization of flue gas desulfurization gypsum as an activation agent for high-volume slag concrete. J. Clean. Prod. 2018, 205, 589–598. [Google Scholar] [CrossRef]
  25. Khalid, H.R.; Lee, N.K.; Choudhry, I.; Wang, Z.; Lee, H.K. Evolution of zeolite crystals in geopolymer-supported zeolites: Effects of composition of starting materials. Mater. Lett. 2019, 239, 33–36. [Google Scholar] [CrossRef]
  26. Lee, N.K.; Khalid, H.R.; Lee, H.K. Synthesis of mesoporous geopolymers containing zeolite phases by a hydrothermal treatment. Microporous Mesoporous Mater. 2016, 229, 22–30. [Google Scholar] [CrossRef]
  27. Khalid, H.R.; Lee, N.K.; Park, S.M.; Abbas, N.; Lee, H.K. Synthesis of geopolymer-supported zeolites via robust one-step method and their adsorption potential. J. Hazard. Mater. 2018, 353, 522–533. [Google Scholar] [CrossRef]
  28. Liu, J.; Ye, X.; Wang, H.; Zhu, M.; Wang, B.; Yan, H. The influence of pH and temperature on the morphology of hydroxyapatite synthesized by hydrothermal method. Ceram. Int. 2003, 29, 629–633. [Google Scholar] [CrossRef]
  29. Wang, C.F.; Li, J.S.; Wang, L.J.; Sun, X.Y. Influence of NaOH concentrations on synthesis of pure-form zeolite A from fly ash using two-stage method. J. Hazard. Mater. 2008, 155, 58–64. [Google Scholar] [CrossRef]
  30. Zhu, R.; Yu, R.; Yao, J.; Wang, D.; Ke, J. Morphology control of hydroxyapatite through hydrothermal process. J. Alloy. Compd. 2008, 457, 555–559. [Google Scholar] [CrossRef]
  31. Sun, Y.; Guo, G.; Tao, D.; Wang, Z. Reverse microemulsion-directed synthesis of hydroxyapatite nanoparticles under hydrothermal conditions. J. Phys. Chem. Solids 2007, 68, 373–377. [Google Scholar] [CrossRef]
  32. Zhang, H.; Darvell, B.W. Morphology and structural characteristics of hydroxyapatite whiskers: Effect of the initial Ca concentration, Ca/P ratio and pH. Acta Biomater. 2011, 7, 2960–2968. [Google Scholar] [CrossRef] [PubMed]
  33. Zhang, C.; Yang, J.; Quan, Z.; Yang, P.; Li, C.; Hou, Z.; Lin, J. Hydroxyapatite nano- and microcrystals with multiform morphologies: Controllable synthesis and luminescence properties. Cryst. Growth Des. 2009, 9, 2725–2733. [Google Scholar] [CrossRef]
  34. Al-Qasas, N.S.; Rohani, S. Synthesis of pure hydroxyapatite and the effect of synthesis conditions on its yield, crystallinity, morphology and mean particle size. Sep. Sci. Technol. 2005, 40. [Google Scholar] [CrossRef]
  35. Jenkins, R.; Snynder, R.L. Introduction to X-ray Powder Diffractometry; Wiley: New York, NY, USA, 1996. [Google Scholar]
  36. Reyes, C.A.R.; Williams, C.D.; Alarcón, O.M.C. Síntesis of zeolita LTA Frim thermally treated kaolinite. Rev. Fac. De Ing. 2010, 53, 30–41. [Google Scholar]
  37. Li, Y.; Peng, T.; Man, W.; Ju, L.; Zheng, F.; Zhang, M.; Guo, M. Hydrothermal synthesis of mixtures of NaA zeolite and sodalite from Ti-bearing electric arc furnace slag. Rsc Adv. 2016, 6, 8358–8366. [Google Scholar] [CrossRef]
  38. Król, M.; Mozgawa, W.; Morawska, J.; Pichór, W. Spectroscopic investigation of hydrothermally synthesized zeolites from expanded perlite. Microporous Mesoporous Mater. 2014, 196, 216–222. [Google Scholar] [CrossRef]
  39. Li, J.; Li, Y.; Zhang, L.; Zuo, Y. Composition of calcium deficient Na-containing carbonate hydroxyapatite modified with Cu(II) and Zn(II) ions. Appl. Surf. Sci. 2008, 254, 2844–2850. [Google Scholar] [CrossRef]
  40. Garcia, G.; Cabrera, S.; Hedlund, J.; Mouzon, J. Selective synthesis of FAU-type zeolites. J. Cryst. Growth 2018, 489, 36–41. [Google Scholar] [CrossRef]
  41. Suchanek, W.L.; Byrappa, K.; Shuk, P.; Riman, R.E.; Janas, V.F.; Tenhuisen, K.S. Mechanochemical-hydrothermal synthesis of calcium phosphate powders with coupled magnesium and carbonate substitution. J. Solid State Chem. 2004, 177, 793–799. [Google Scholar] [CrossRef]
  42. Ezekiel, I.; Kasim, S.R.; Ismail, Y.M.B.; Noor, A.F.M. Nanoemulsion synthesis of carbonated hydroxyapatite nanopowders: Effect of variant CO32−/PO43− molar ratios on phase, morphology, and bioactivity. Ceram. Int. 2018, 44, 13082–13089. [Google Scholar] [CrossRef]
  43. Zou, Z.; Liu, X.; Chen, L.; Lin, K.; Chang, J. Dental enamel-like hydroxyapatite transformed directly from monetite. J. Mater. Chem. 2012, 22, 22637–22641. [Google Scholar] [CrossRef]
  44. Rioland, G.; Albrecht, S.; Josien, L.; Vidal, L.; Daou, T.J. The influence of the nature of organosilane surfactants and their concentration on the formation of hierarchical FAU-type zeolite nanosheets. New J. Chem. 2015, 39, 2675–2681. [Google Scholar] [CrossRef]
  45. Golbad, S.; Khoshnoud, P.; Abu-Zahra, N. Hydrothermal synthesis of hydroxy sodalite from fly ash for the removal of lead ions from water. Int. J. Environ. Sci. Technol. 2017, 14, 135–142. [Google Scholar] [CrossRef]
  46. Hansen, N.M.; Felix, R.; Bisaz, S.; Fleisch, H. Aggregation of hydroxyapatite crystals. Biochim. Biophys. Acta 1976, 451, 549–559. [Google Scholar] [CrossRef]
  47. Liu, Y.; Wang, W.; Wang, A. Effect of dry grinding on the microstructure of palygorskite and adsorption efficiency for methylene blue. Powder Technol. 2012, 225, 124–129. [Google Scholar] [CrossRef]
  48. Wu, M.; Bi, E. Stability of Artificial Nano-Hydroxyapatite in the Presence of Natural Colloids: Influence of Steric Forces and Chargeability. J. Environ. Qual. 2019, 48, 1100–1108. [Google Scholar] [CrossRef]
  49. Lin, T.J.; Heinz, H. Accurate Force Field Parameters and pH Resolved Surface Models for Hydroxyapatite to Understand Structure, Mechanics, Hydration, and Biological Interfaces. J. Phys. Chem. C 2016, 120, 4975–4992. [Google Scholar] [CrossRef] [Green Version]
  50. Lee, M.G.; Yi, G.; Ahn, B.J.; Roddick, F. Conversion of Coal Fly Ash into Zeolite and Heavy Metal Removal Characteristics of the Products. Korean J. Chem. Eng. 2000, 17, 325–331. [Google Scholar] [CrossRef]
Figure 1. The XRD patterns of the (a) raw slag and (b) synthesized composite samples (C—calcite; P—portlandite; A—anhydrite; H—hydroxyapatite; F—faujasite (FAU) zeolite; P—Na-P1 zeolite; S—hydroxysodalite).
Minerals 11 00021 g001aMinerals 11 00021 g001b
Figure 2. The FT-IR spectra of the synthesized composite samples.
Minerals 11 00021 g002
Figure 3. SEM images of (a) hydroxyapatite (obtained from HZ-5), (b) FAU zeolite (obtained from HZ-3), (c) Na-P1 zeolite (obtained from HZ-5), and (d) hydroxysodalite (obtained from HZ-5).
Minerals 11 00021 g003
Figure 4. SEM images of hydroxyapatite crystalline obtained from (a) HZ-0.5, (b) HZ-2, (c) HZ-3, and (d) HZ-5 (red circles indicate a hydroxyapatite crystal).
Minerals 11 00021 g004
Figure 5. The pore size distributions of the synthesized composite samples measured from the BJH tests.
Minerals 11 00021 g005
Figure 6. Cesium adsorption capacities of the synthesized composite samples measured from the ICP-MS tests.
Minerals 11 00021 g006
Figure 7. The adsorption capacities of the synthesized composite samples against the BET surface area.
Minerals 11 00021 g007
Table 1. Chemical compositions of blast furnace slag measured from X-ray fluorescence test.
CompositionProportion (wt.%)
CaO67.60
SiO218.20
Al2O37.50
SO33.10
Fe2O31.00
TiO20.95
K2O0.76
MnO0.44
ZrO20.08
CuO0.05
NiO0.04
SrO0.02
Table 2. Crystallinities and quantitative contents of the phases of the synthesized composite samples measured from XRD patterns using the reference intensity ratio (RIR) method.
Sample IDCrystallinity (%)PhaseQuantitative
Content (wt.%)
HZ-0.525Hydroxyapatite25
HZ-140Hydroxyapatite40
HZ-255Hydroxyapatite55
HZ-366Hydroxyapatite54
Na-P1 zeolite9
FAU type zeolite1
HZ-467Hydroxyapatite48
Na-P1 zeolite7
Hydroxysodalite13
HZ-567Hydroxyapatite52
Na-P1 zeolite5
Hydroxysodalite10
Table 3. BET/BJH results of the synthesized composite samples.
Sample IDHZ-0.5HZ-1HZ-2HZ-3HZ-4HZ-5
Specific surface area (m2/g)102.8150.5132.12143.3259.3972.07
BJH cumulative pore volume (cm3/g)0.320.180.180.170.140.17
BJH adsorption average pore diameter (nm)12.7113.8710.217.378.688.80
BJH adsorption cumulative specific surface area of pores (m2/g)101.2751.3269.9490.1266.7279.30
Publisher’s Note: MDPI stays neutral with regard to jurisdictional claims in published maps and institutional affiliations.

