Abstract
This study aims to address the acoustic resonance control problem of a three-dimensional nose landing gear (NLG) cavity. We propose a refined numerical approach based on an eigenvalue solver for the Helmholtz equation. A high-order finite element method (FEM) combined with perfectly matched layer (PML) boundary conditions was employed to accurately capture complex eigenmodes. The radiation damping characteristics of the system were then quantitatively characterized using the quality factor (Q-factor) and resonance frequency. Results indicate that the Helmholtz-type (0,0,0) mode dominates the cavity’s resonance response, with its frequency coinciding with the shear layer-driven Rossiter mode. This study reveals a strong coupling mechanism with the shear-layer-driven Rossiter mode at Mach 0.57, confirming that this interaction is the primary driver of cavity aeroacoustic tonal noise. Taking radiation damping as the core design parameter, a systematic sensitivity analysis was conducted on geometric modifications: aft door length, front door angle, cavity volume, and the introduction of a longitudinal gap. Key findings: shortening the aft door reduces the resonance peak by 8.5 dB; introducing a longitudinal gap with a 10% width reduces the Q-factor by approximately 50%; a combined control strategy (2.5% gap width and 6% cavity volume reduction) achieves 4.9 dB of noise attenuation. Finally, this study establishes a validated acoustic-damping control framework, providing quantitative design criteria and technical guidance for aeroacoustic noise control of NLG cavities.
1. Introduction
The aero-vibro-acoustics challenges posed by cavity flows have attracted significant research interest [1,2], particularly in aircraft weapon bays [3,4,5], landing gear bays [6,7], train roof recesses [8], and automotive door cavities [9]. Cavity noise is generally classified into two categories based on its generation mechanism: self-sustained oscillation and acoustic resonance [10]. For self-sustained oscillation, when airflow passes over a cavity, the incoming flow boundary layer separates at the leading edge of the cavity orifice, forming a free shear layer due to the velocity gradient. As the vortex structures in the shear layer impinge on the cavity trailing edge, they generate acoustic pulses that propagate upstream. These pulses further excite the shear layer, inducing instabilities and creating the well-known feedback loops originally reported by Rossiter [11]. Driven by internal circulation, these pressure fluctuations serve as the dominant noise source [7]. Consequently, a portion of the kinetic energy from turbulent fluctuations is converted into acoustic energy, which radiates as far-field noise [12]. Acoustic resonance is triggered by standing waves within the cavity. While turbulent disturbances within the shear layer act as a broadband noise source, the semi-enclosed nature of the cavity selectively amplifies frequencies that align with its natural frequency. When acoustic resonance couples with self-sustained oscillations, the resulting noise can reach extremely high amplitudes. This phenomenon not only causes severe environmental noise pollution but also induces significant structural vibration and even catastrophic structural failure [13,14,15].
Aero-vibro-acoustic phenomena pose significant challenges during flight test campaigns, particularly during the deployment or retraction of the nose landing gear (NLG), when excessive noise and vibration can limit the operational envelope. Langtry [6] employed the Detached Eddy Simulation (DES) approach and validated it against wind-tunnel test data. This methodology was shown to be effective for predicting and mitigating tonal noise via baffle systems. Through both experimental and numerical approaches (the Wave Expansion Method), Neri et al. [16] investigated the acoustic radiation characteristics of the empty wheel bay of the nose landing gear for a regional aircraft; they identified that prominent high-amplitude tonal signals are excited at frequencies corresponding to the Helmholtz resonance mode. Schmid [17] compared the eigenvectors derived from acoustic computations via NGSolve with the pressure fluctuation distributions obtained from URANS simulations, and the comparative results exhibit consistent characteristic spatial distributions. Experimental investigations conducted by East [18] demonstrate that aerodynamic cavity resonance originates from the coupled amplification of shear layer disturbances induced by both the edge-tone feedback mechanism (Rossiter-type [11]) and the acoustic resonance characteristics of the cavity itself. Using global stability analysis, Yamouni [19] identified shear-layer modes associated with the initiation of branches driven by the feedback aeroacoustic mechanism and the acoustic resonance mechanism.
The configuration of the landing gear door during its closing process can be simplified as a partially enclosed Helmholtz resonator, where a finite-length overhanging lip creates a relatively large internal volume with a small opening exposed to the grazing flow. Numerous studies have focused on such resonant cavities [20,21,22], including automotive sunroof buffeting [23,24]. Elder [25] pointed out that in such cases, the mass difference between the inflowing and outflowing fluid is the fundamental characteristic that distinguishes hydrodynamic oscillations from fluid-resonant oscillations.
Specifically, if the upper half-space above the cavity is defined as the outer branch and the region below the opening as the inner branch, volume flow fluctuations exhibit symmetric characteristics under free jet-edge interaction. Consequently, these two types of sound sources produce no net radiated sound during conventional edge-tone or shear-tone oscillations. However, when the inner branch is replaced by a resonant air column, the impedance symmetry is broken [26]. At resonance, the two branches have equal but opposite impedances, inducing a phase inversion that causes the energy from the two flow sources to mutually reinforce and form an efficient monopole sound source.
Furthermore, Larchevêque et al. [27] employed the Large Eddy Simulation (LES) method and found that the bifurcation in the asymmetric distribution arises from the sidewall confinement. Meanwhile, the end-wall effect further amplifies the spanwise modulation effect of the flow. In addition, the transition of the flow pattern to the bifurcated state directly alters the characteristics of the Rossiter feedback loop, shifting the dominant Rossiter mode and triggering nonlinear energy transfer.
Based on the cavity’s self-sustaining oscillatory feedback mechanism, Rossiter derived a frequency prediction formula relating the vortex convection velocity κ to the phase delay term. Several studies have reported that the phase delay in the coupled state is altered, leading to shifts in resonance frequencies. [14,28,29]. Thangamani [29] demonstrated that acoustic resonance strongly influences self-sustained oscillations in high-speed cavities, leading to coherence and phase discrepancies between pressure signals acquired from the front and rear cavity walls. By employing flow and acoustic correlation measurements, Liu et al. [14] revised the phase-delay term and achieved accurate frequency predictions of the coupling between acoustic resonance and Rossiter modes.
Despite these advancements mentioned above, most existing research does not fully utilize system damping as a key design parameter. For instance, although Koch [30] reported the Q-factor of an open cavity, the practical implications for design optimization were not explored. This study builds upon an established methodology, adopting an eigenvalue solver for the Helmholtz equation under no-flow conditions similar to Koch’s work [30]. The present paper aims to bridge this gap by applying this approach to predict the resonance response of a full-scale nose landing gear cavity. Specifically, it systematically evaluates the sensitivity of this response to key design parameters, including aft door length, longitudinal door gap, and the internal geometry of the cavity. Furthermore, it investigates targeted control strategies to attenuate resonant peaks by actively regulating the system’s damping characteristics.
2. Solution Methodology
2.1. Geometry of the NLG Bay Cavity
The geometry of the NLG bay cavity across four distinct configurations is illustrated in Figure 1, representing the deployment sequence from fully retracted state (Figure 1a) to fully deployed state (Figure 1d).
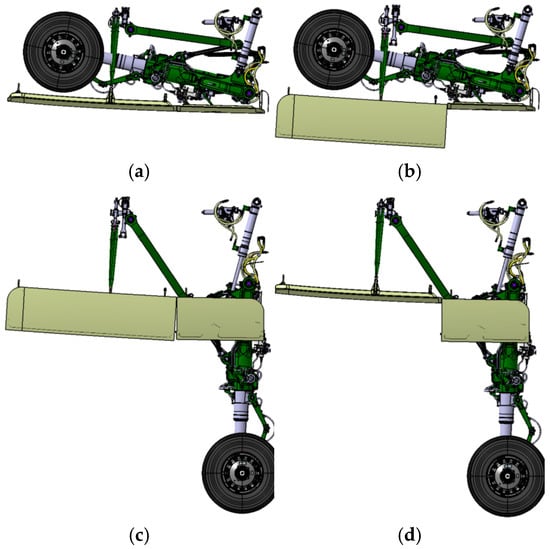
Figure 1.
Typical stages of NLG deployment: (a) door fully closed, NLG fully retracted; (b) front door opened, NLG locked up; (c) front and aft doors opened, and NLG locked down; (d) front door closed, and NLG locked down.
In Ref. [16], the community noise is evaluated using the configuration shown in Figure 1d. In this study, the geometry of the NLG system corresponds to configuration (b) in Figure 1, a partially opened cavity with the front doors open and the aft doors closed. Such a configuration is a transitional state that can last about 1 to 3 s [31]. For this study, the NLG geometry is simplified to investigate the acoustic resonance using a rudimentary NLG model with only the main structure and wheels. The dimension of the NLG bay cavity is La/Lf = 0.52, with La and Lf being the aft door and front door lengths, W/Lf = 0.6, W being the average width of the cavity bay, and D/Lf = 0.63, with D being the depth of the cavity.
2.2. Numerical Solution Procedure
Acoustic resonance noise is a purely acoustic phenomenon generated by flow excitation. Its frequency is independent of the freestream velocity and depends only on the cavity dimensions, making it the cavity’s natural frequency. Under the assumption of low-speed, inviscid flow, the acoustic resonance frequencies can be obtained by solving the eigenvalue problem of the wave equation for rigid walls in the absence of external flow. Assuming periodic time dependence exp(-iωt), where ω is the circular frequency, the wave equation is reduced to the Helmholtz equation without flow.
The acoustic eigenmodes and eigenvalues of partially open cavities in complex configurations, such as a nose landing gear bay, can be predicted using the high-order finite-element code NGSolve [32]. The solver allows the user to specify the polynomial order of the FEM discretization. To simulate an unbounded domain and prevent spurious reflections, PML boundary conditions are applied within a hemispherical region centered on the midpoint of the cavity opening. All surfaces are treated as hard walls. The FEM domain uses a symmetry plane at Y = 0, and acoustic radiation is ensured by the PML zone. Eigenvalue extraction is performed using an Arnoldi eigensolver with a shift-and-invert technique [33]. After the initial search with 100 modes, the wave number of the (0,0,0) mode is used as the shift value. The specified shift value enables a targeted search around a range of expected eigenvalues. More details on solver settings can be found in NGSolve tutorials on solving Helmholtz equations [32]. Arnoldi’s eigensolver uses a random initial vector and converges when the residual tolerance falls below 10−10 for the five requested eigenvalues, guaranteeing that the Helmholtz mode is found. The resulting complex eigenvalues yield a complex wave number, from which the resonant frequency and Q factor—analogous to a classical resonator—can be derived. As concluded by Tam [34], this damping mechanism corresponds to acoustic radiation losses from the cavity.
The excitation driving these resonances originates in instabilities in the shear layer, which manifest as Rossiter modes [11]. The frequency of the n-th Rossiter mode can be estimated from the flow conditions and the cavity geometry, specifically the cavity opening length Lf, consistent with the framework described by Koch [30]. The semi-empirical formula of Rossiter mode [11] is as follows:
M denotes the Mach number, U the freestream flow speed, M = U/C, with C being the speed of sound. The integer n indicates the Rossiter mode number, linked to the number of vortices along the length Lf. κ and α are the semi-empirical constants for the Rossiter mode; they are always set to 0.25 and 0.57, respectively. Alternatively, Wittich [35] proposed a long-path feedback equation for partially opened rectangular cavities, which can be used for “tuning” with experimental data.
The Q factor is normally estimated from the ratio of the resonant frequency to the bandwidth at a 3 dB decrease in the frequency response, as shown in Figure 2. The advantage of solving the eigenvalue problem is that the Q factor of the open cavity is calculated using the complex eigenvalue ko as follows:
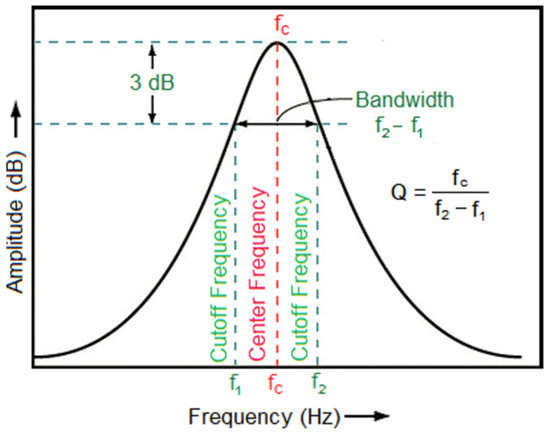
Figure 2.
Definition of Q factor.
The amplification factor of a mass-spring-damper with resonance frequency fo = ko/(2πC) is given as follows:
Using Equation (1) of the Rossiter mode, the Mach number can also be expressed as a function of frequency, for n = 1 and for a given geometry (length Lf and damping Q fixed).
Due to the symmetry of the geometry around the y-axis, half of the geometry is considered. Consequently, only the symmetric modes in the transverse direction can be found. The mesh is generated using the NetGen software (NGSolve-6.2.2601-18-g180a5ae39) with a uniform spacing (Δs). A mesh sensitivity (H-convergence) was performed, but it quickly led to a memory problem. H-refinement is more memory-intensive than p-refinement. Both H-refinement and p-refinement are introduced in Section 2.5. Here, the grid is defined as Δs/D = 0.3, corresponding to a Δs/L = 0.15 and Δs/W = 0.4. The mesh is shown in Figure 3 with local mesh refinement at curved edges around the strut and wheel. The total number of points and elements is 2068 and 7045, respectively. The PML zone is introduced between the external and the internal hemisphere with a value of (0 + 3j).
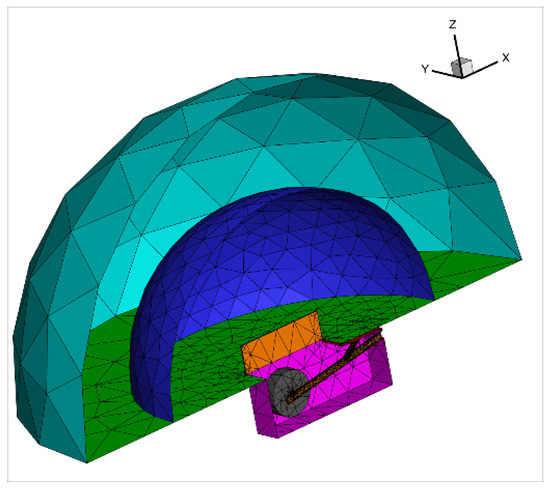
Figure 3.
Mesh of the 3D NLG with front doors opened (orange), wheels (grey), and struts (brown).
2.3. Eigenmode Search Technique
The first search of eigenmodes with FEM order of 6 includes 100 modes, which are depicted in Figure 4. Only six modes (marked in red) correspond to physical modes; the remaining are numerical modes arising from imperfections in the model and its boundary conditions. The six physical modes are identified by visual inspection of the eigenmodes depicted in Figure 5.
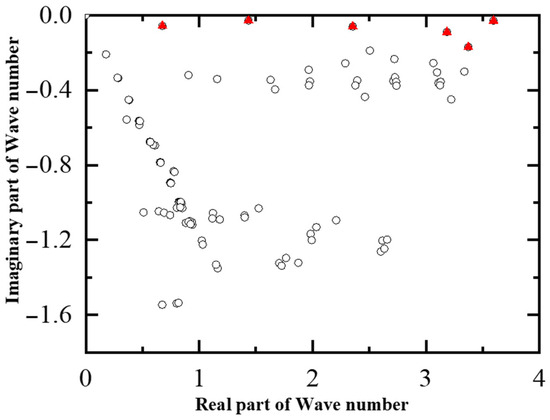
Figure 4.
Resonance modes of the NLG bay; red triangles indicate (0,0,0), (1,0,0), (2,0,0), (3,0,0), (1,0,1), and (2,0,1).
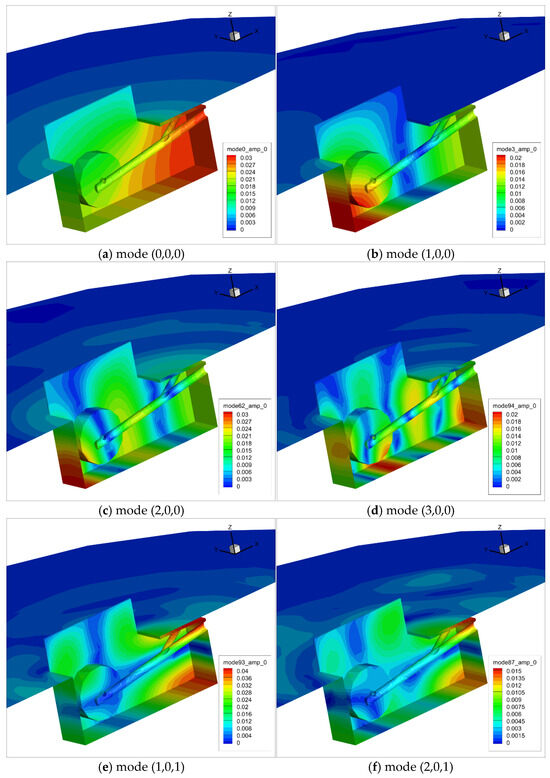
Figure 5.
Mode shapes of the first six modes from left to right and top to bottom: (0,0,0), (1,0,0), (2,0,0) and (3,0,0), (1,0,1), (2,0,1).
The primary goal of mode selection is to filter physically meaningful acoustic modes while excluding numerical spurious modes. To achieve this, mode shapes are visually inspected to confirm their alignment with the physical principles of acoustic resonance shown in Figure 5. Specifically, physical modes exhibit distinct energy radiation or confinement characteristics that match the geometric constraints of the system. In contrast, spurious modes—originating from discretization errors or boundary condition approximations—display chaotic pressure/velocity distributions and lack inherent physical resonance features.
From the definition of Q, it can be inferred that a smaller imaginary part of the eigenvalue corresponds to a larger Q value. A key characteristic of valid modal solutions is a local maximum in their frequency Q values, and these solutions must also comply with the physical laws of acoustic resonance to be classified as physical modes. Therefore, modal selection should integrate both Q-value characteristics and physical rationality, and potential modal solutions can be initially identified from those with small imaginary parts.
The wave number (real part of complex eigenvalue ko) for those first six modes and their corresponding Q factor are provided in Table 1. The (0,0,0) mode represents a Helmholtz-type resonance, characterized by the lowest Q factor among the cavity modes. This indicates high radiative damping, where acoustic energy is efficiently pumped out of the cavity into the surrounding field.

Table 1.
Wave number and Q factor for the first six modes.
The longitudinal (1,0,0), (2,0,0), and (3,0,0) modes represent axial standing waves within the deep cavity (D/L = 0.5). Their acoustic energy is strongly trapped due to the geometric configuration, particularly the trailing-edge overhang, which acts as a high-impedance boundary that severely restricts radiation to the external field. This energy confinement is quantitatively reflected in a high acoustic quality factor (Q-factor), indicating low damping and minimal radiation loss. In such configurations, the effective closure provided by the overhang ensures pressure antinodes at the walls, resulting in negligible energy leakage and allowing these longitudinal modes to store, but not efficiently radiate, energy. In contrast, the Helmholtz-type (0,0,0) mode operates as a lumped-element oscillator, where the fluid mass in the overhang region oscillates against the stiffness of the main cavity volume. As shown in Figure 5, this mode produces the largest vertical acoustic particle velocity at the aperture, creating a concentrated oscillatory “jet”.
In Figure 6, the vertical (z) component of the acoustic intensity distribution in the symmetry plane for the (0,0,0) mode clearly exhibits a high magnitude along the shear layer, with an extremely high magnitude at the overhang. In contrast, for the (1,0,0) mode, the acoustic intensity is nearly zero in the vicinity of the aft door—the region where the shear layer is anticipated to be highly unstable. Additionally, the high intensity in the free space above the cavity opening for the Helmholtz-type (0,0,0) mode indicates significant radiation loss to free space, which matches the low Q-factor value. This kinetic energy is precisely co-located with the unstable region of the shear layer, establishing a direct coupling mechanism [1]. Consequently, the Helmholtz mode is most susceptible to excitation by vortical disturbances from the shear layer (the Rossiter mechanism). In turn, its high-amplitude velocity fluctuations can phase-lock and amplify vortex shedding, thereby efficiently transferring energy from the mean flow. While the higher-order longitudinal modes are efficient at storing acoustic energy, they are poorly coupled to the external flow due to their velocity nodes at the aperture. The Helmholtz mode, however, exhibits optimal spatial matching; its region of maximum acoustic kinetic energy coincides with the shear layer’s most receptive point for feedback. This makes it the primary conduit for energy transfer, leading to the classic lock-in phenomenon where the first Rossiter mode and the Helmholtz resonance synchronize as described in the following section.
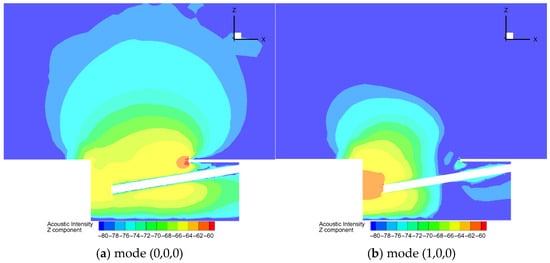
Figure 6.
Acoustic intensity Z-component at the symmetry plane for mode (0,0,0) and mode (1,0,0).
2.4. Acoustic Modes Interaction with Rossiter Modes
Having identified the system’s intrinsic acoustic modes, it is essential to determine which of these modes will be actively excited by the external flow. Resonance between acoustic and Rossiter modes occurs when their frequencies align. As shown in Figure 7, the first Rossiter mode resonates with the fundamental acoustic mode (0,0,0) at approximately Mach 0.57, whereas at Mach 0.2, it resonates with the second acoustic mode (1,0,0). This second mode also couples with the second Rossiter mode at Mach 0.52. The present study focuses on the mid-Mach number regime (0.3 < M < 0.5), where the (0,0,0) mode exhibits significantly higher damping than higher-order modes. This heightened damping denotes more efficient acoustic radiation from the cavity and, consequently, a stronger interaction with the shear layer. For these reasons, the subsequent analysis is confined to this Helmholtz-type mode. The primary objective is therefore to mitigate unsteady pressure buildup at the aft doors by increasing the mode’s damping and shifting its resonance to higher Mach numbers, a strategy aimed at controlling vibration and preventing potential structural failure.
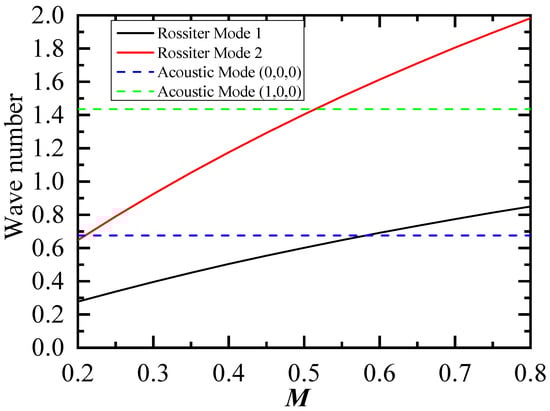
Figure 7.
Rossiter modes and acoustic modes versus Mach number.
2.5. FEM p and H Order Convergence
Firstly, the number of elements is kept the same as in the previous section. A parametric study of the p order for the FE polynomial is performed by increasing the order of the elements from 1st to 6th. Computational time and memory increase with increasing element order, as the number of degrees of freedom increases exponentially with the element order, reaching 8 GB for 6th order. The values of the wave number and Q factor shown in Figure 8 demonstrate that the solution quickly reaches its asymptotic values as the element order is changed. It is concluded that order 4 is sufficient for the remainder of the paper. The H-convergence is performed by doubling and halving the mesh size with p = 4. The results in Figure 9 for the mode (0,0,0) indicate that H-convergence has already been achieved. The errors are less than 0.2% and 0.5% for the wave number and Q.
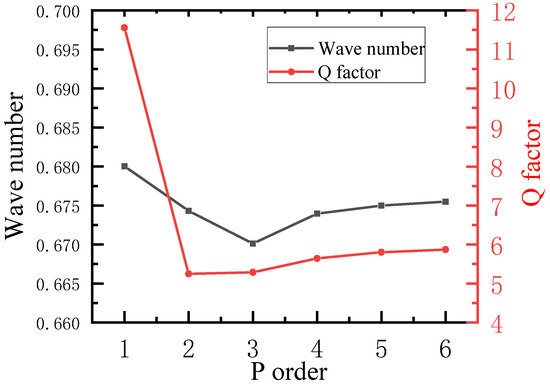
Figure 8.
Wave number and Q factor versus p order of the FEM.
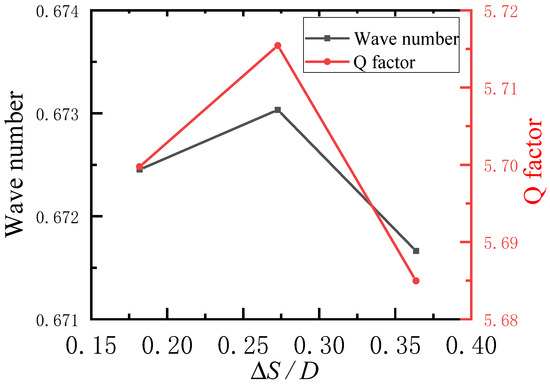
Figure 9.
Wave number and Q factor versus mesh size.
2.6. Verification of the Q Factor Using Frequency Response Calculation
As described in 2.2, the Q factor is calculated from the frequency response using a point source with a Gaussian spatial distribution, located close to the aft door, as shown in Figure 10 (right). The frequency response is estimated at a probe located at the top left of the cavity, which is the maximum pressure level in the cavity. By sweeping the frequency and recording the response at the probing point, the Q factor is estimated using the 3 dB decrease as shown in Figure 2. Figure 10 (left) shows the amplitude of the acoustic field for a wave number of 0.673, just at the resonance value of 0.675, as estimated using the eigenvalue solver and reported in Table 1. The 3 dB bandwidth from Figure 11 is approximately 0.12, yielding a Q-factor of 5.622—this value is in good agreement with the 5.864 reported in Table 1.
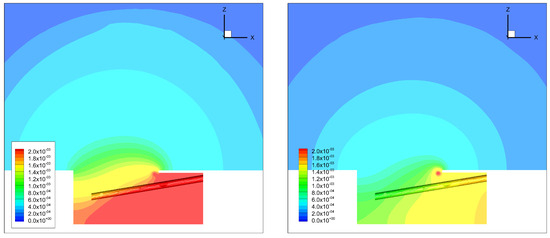
Figure 10.
Amplitude contours of response at the “symmetry” plane with a source point of wave number of 0.673 (left) and 0.585 (right).
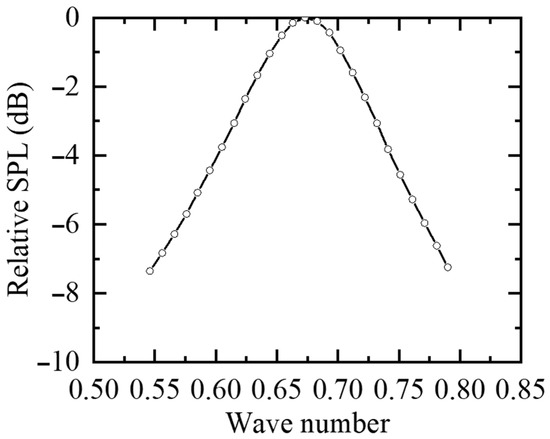
Figure 11.
Frequency Response of the NLG bay with the point source.
2.7. Validation with Experimental Data
Furthermore, the proposed methodology is validated against existing experimental data from Refs. [14,36]. The geometry includes several slanted wall configurations that affect the acoustic mode, and the speed of sound is assumed to be 343 m/s. The mesh density is set to be about the same values as for the NLG bay cavity with Δs/D = 0.2 (Δs/L = 0.3 and Δs/W = 0.4), and with FEM p-order of 4. The experimental Q-factor of the base configuration R00 can be obtained from Figure 22 of [14], which gives a value of 10.9. The calculated Q-factors for different configurations are presented in Table 2, which shows a slightly smaller value of 10.3 for the base configuration R00. The wave number of the first mode is compared in Table 3. It shows good agreement between the experimental and predicted values. A slight overprediction of the wave number is also observed for case R40 using analytical methods. The mesh refinement and p-order study shows that the current setup is optimal for both memory requirements and CPU time.
Table 2.
Q-factor for different configurations.
Table 3.
Wave number of the first mode for different configurations.
3. Results and Discussion
3.1. The Simplified Baseline NLG Model
The amplification factor (AF) for the baseline NLG design is computed using Equations (1) and (3). Figure 12 presents the resulting AF for various polynomial orders p of the FEM discretization. The solution with p = 4 converges, showing a difference of only 0.3 dB at the peak AF compared to p = 5 and p = 6. This minor discrepancy confirms the numerical convergence of the methodology, as previously indicated. For Mach numbers below 0.2, the amplification factor remains negligible (less than 1 dB), indicating no effective amplification. A pronounced peak emerges at Mach 0.57, where the AF reaches a maximum of approximately 16 dB. This peak corresponds to the resonance between the first Rossiter mode and the fundamental acoustic mode of the NLG bay, consistent with the relationship shown in Figure 7. Beyond this peak, the AF decays with increasing Mach number.
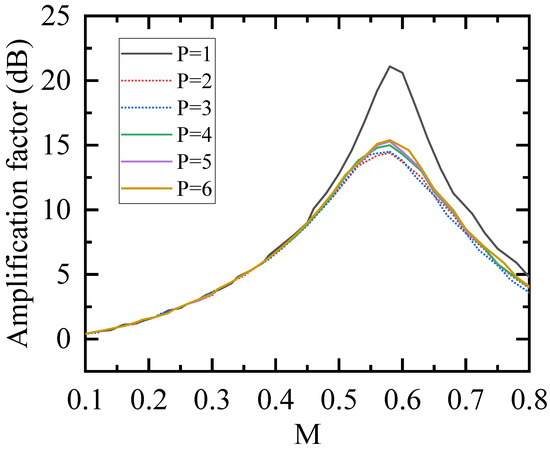
Figure 12.
Amplification factor versus Mach number for different p order.
3.2. Impact of Geometry Simplification
The closure process of the landing gear door involves multiple complex structural components, including the nose landing gear assembly (NLG, consisting of the wheel and strut), the front door (FD), and the aft door. Simulations with the NLG removed show minimal impact on the resonant frequency, identifying the front door as the primary configuration parameter for the system’s acoustic response. A quantitative comparison of the percentage changes in wave number and Q-factor for various component-removed configurations relative to the baseline configuration is presented in Table 4. Specifically, the absence of the FD results in a 6.4% increase in the wave number and a 26% decrease in the Q-factor. However, removing the LG results in a 1.3% decrease in wave number and a 6.1% decrease in Q-factor. For the LG sub-components, removing the strut reduces the wave number by 0.2% and the Q-factor by 1.6%, while removing the wheel reduces the wave number by 1% and the Q-factor by 5.3%. It is concluded that large-scale geometric components such as the FD and wheel exert a more pronounced influence on wave number and Q-factor, with the FD being the most influential. The FD acts as an extension of the cavity; its removal reduces the effective cavity volume, thereby increasing the wave number (frequency). In contrast, other components of the LG are small-scale relative to the mode wavelength and thus exert negligible effects on the outcomes.
Table 4.
The percentage change in wave number and Q-factor for different configurations.
3.3. Effect of Aft Doors Length on the Acoustic Resonance
Following the same methodology, the aft door length is adjusted to increase or decrease the total opening. Reducing the aft door length is expected to enhance system damping and lower the Rossiter mode frequency. The computed eigenmodes are shown in Figure 13a for the shorter and (Figure 13b) for the longer aft door. The amplitude is, as expected, lower for the shorter door compared to the longer door. The ratio of the aft door length to the opening length La/Lf varies from 0.043 to 1.823. It is mentioned that the total length of the cavity, La + Lf, is kept constant. The corresponding eigenvalues yield the wave numbers and Q factors, and are depicted in Figure 14.
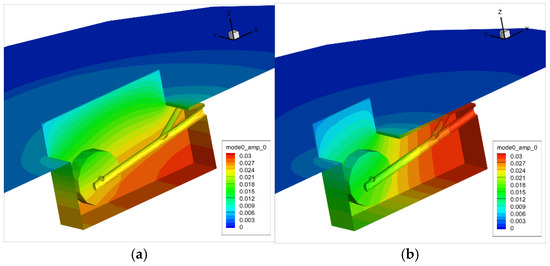
Figure 13.
Eigenvector (0,0,0) for shorter (a) and longer (b) aft doors.
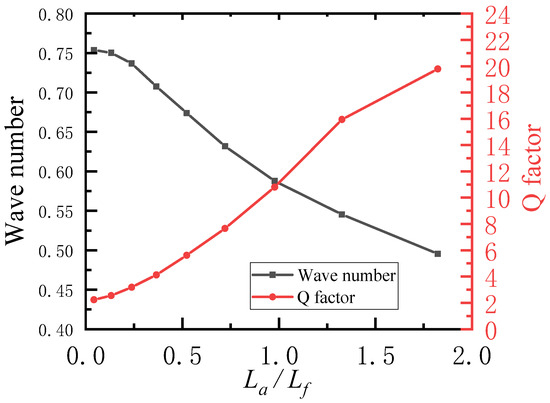
Figure 14.
Wave number and Q factor versus La/Lf.
Three configurations are analyzed, defined by the ratio of aft door length to front door length (La/Lf): 0.37, 0.24, and 0.13, the configuration with La/Lf = 0.52 being the baseline. The corresponding amplification factor (AF) for each configuration is plotted and compared against the baseline in Figure 15. Shortening the door successfully increases damping, providing a cumulative reduction of approximately 2 dB at the AF peak for each incremental decrease in La/Lf. More critically, the larger opening shifts the resonance peak to a higher Mach number. This shift occurs because the effective acoustic length of the cavity increases, shifting its (Rossiter) resonant frequency. Consequently, matching with the Rossiter mode now requires a higher flow speed. This modification achieves a significant reduction in unsteady pressure loading. For example, at Mach 0.5, the AF decreases by about 8.5 dB between the baseline (La/Lf = 0.52) and the shortest door (La/Lf = 0.13). This corresponds to a reduction factor of 2.7 in unsteady loading, a highly beneficial outcome for the structural integrity of the door.
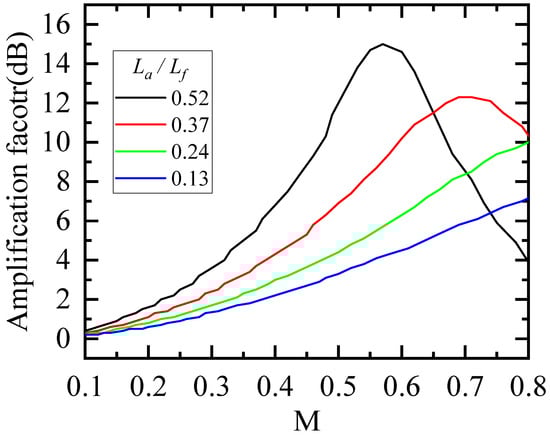
Figure 15.
Amplification factor versus Mach number for different La/Lf (shorter aft doors).
Conversely, this section investigates the effect of lengthening the aft door, which reduces the effective length of the cavity opening. Three configurations are examined, with the La/Lf ratio increasing from the baseline value of 0.52 to 0.72, 0.98, and 1.33. This modification is the inverse of the previous design change. In contrast to shortening the door, a longer aft door decreases the system’s damping and shifts the Rossiter mode to a higher frequency. The computed wave numbers and Q factors for these configurations are presented in Figure 14, while the corresponding amplification factors (AF) are compared against the baseline in Figure 16. The results confirm the expected detrimental trend. Each incremental increase in door length reduces damping, cumulatively raising the AF peak by approximately 3 dB. Furthermore, the reduced opening shortens the effective acoustic length of the cavity, shifting the resonance peak to a lower Mach number. This increase in unsteady pressure is significant. For example, at Mach 0.25, the AF increases by about 16.3 dB between the baseline (La/Lf = 0.52) and the longest aft door (La/Lf = 1.33). Such a substantial rise in dynamic loading poses a severe risk to the structural integrity of the aft door.

Figure 16.
Amplification factor versus Mach number for different La/Lf (longer aft doors).
3.4. Effect of Front Door Angle on the Acoustic Resonance
In this section, the influence of the front door angle is investigated across a range from −45° to +45°. While the physically achievable range for the door spans from 0° (fully closed) to approximately 90° (fully opened), the −45° position (further opening) represents an idealized state used primarily for sensitivity analysis. In contrast, the +45° position (more closing) corresponds to a realistic intermediate state encountered during the NLG deployment. Figure 17 displays the eigenvector amplitude for these two extreme angular positions. The amplitude for the +45° is 30% higher. The corresponding wave numbers and Q factors are presented in Figure 18. Opening the front door further to −45° enhances the system’s damping, reducing modal amplitudes and decreasing the Q factor from 5.62 to 4.64, approximately a 1.66 dB reduction. Conversely, closing the door to 45° reduces the damping, as anticipated, and increases the amplification factor by roughly 3 dB. Both the wave number and Q factor demonstrate a greater sensitivity to the closing angles (positive) than to the opening angles (negative). The observed decrease in wave number as the door is more closed indicates that resonance with the first Rossiter mode occurs at a lower Mach number. During the initial stage of NLG deployment (transitioning from state ‘a’ to ‘b’ as shown in Figure 1), the Q-factor is expected to drop sharply from its near-infinite value as the door begins to open, while the acoustic resonance frequency progressively increases.
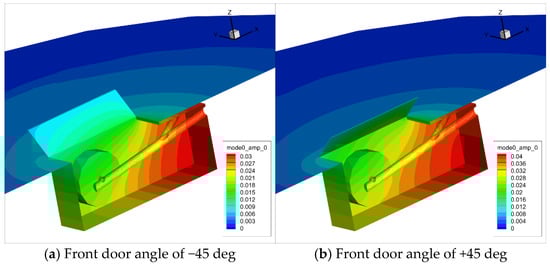
Figure 17.
Eigenvector (0,0,0) for front door angles.
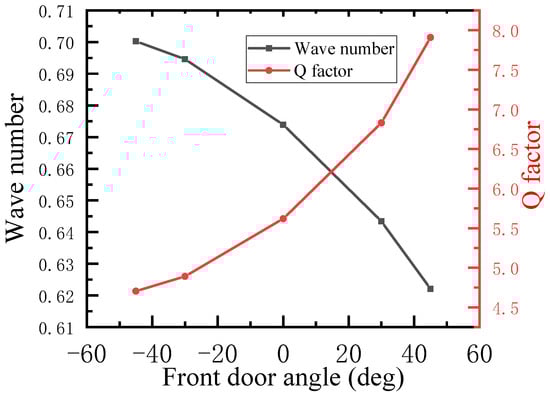
Figure 18.
Wave number and Q factor versus front door angle (negative: opening, positive: closing).
3.5. Effect of Volume Reduction on the Acoustic Resonance
An alternative technique for controlling the acoustic mode of a Helmholtz-type resonator involves modifying the cavity volume. This is achieved by progressively reducing the volume from the axial center at the cavity floor at a specified angle. Figure 19 illustrates an example of this geometry, showing a 20-degree volume reduction, or “cut,” at the bottom center of the bay, along with the corresponding eigenvector amplitude for the (0,0,0) mode. As the cut angle increases by increments of 10 deg up to 30 deg, the net cavity volume decreases by up to 20%. This reduction in volume increases the acoustic wave number, thereby shifting the Rossiter mode’s resonance condition to a higher Mach number. Furthermore, the system’s Q factor decreases, indicating higher damping and greater radiative loss, which is shown in Figure 20. Compared to the baseline configuration, the 30-degree case yields a reduction of approximately 5.4 dB at the original resonant peak. An additional attenuation benefit is realized because the frequency shift moves the resonance away from the baseline peak frequency.
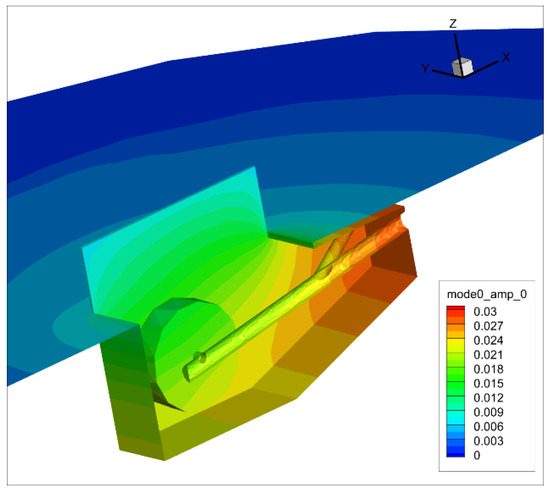
Figure 19.
Mode (0,0,0) for the reduced volume at 20 deg.
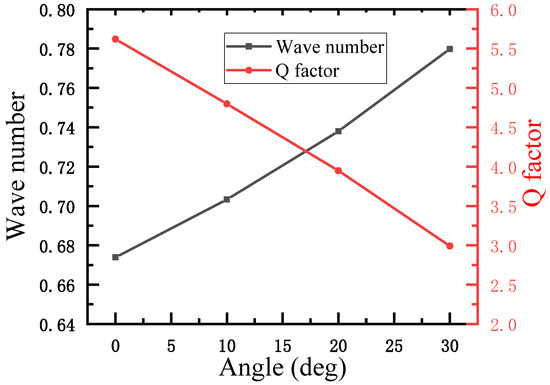
Figure 20.
Wave number and Q factor versus volume reduction (angle).
The design change offers potential weight advantages, but a comprehensive feasibility evaluation is required. Volume reduction (up to 20% via 30° geometric cuts) reduces cavity resonance while slightly decreasing structural mass, aligning with fuel efficiency goals. However, volume reduction (via cavity floor cuts) or door length adjustments mentioned above may alter stress distribution, potentially increasing fatigue risk at door hinges or cavity walls (especially under unsteady pressure loads).
3.6. Effect of a Longitudinal Gap Between the Two Aft Doors
The two aft doors are typically sealed with axial joints to maintain an aerodynamic profile. This section investigates the use of a longitudinal gap between these doors as a potential means to vent pressure buildup within the cavity. The results of the eigenvector analysis for an axial gap sized at 10% of the cavity width are presented in Figure 21. The contour shows clear acoustic radiation through the gap, accompanied by a 20% reduction in the maximum eigenvector amplitude. Notably, this amplitude is further reduced near the back door, a finding relevant for structural integrity at high Mach numbers. As the gap size increases up to 10%, the Q factor is nearly halved; however, as observed in Figure 22, this benefit follows a pattern of diminishing returns.
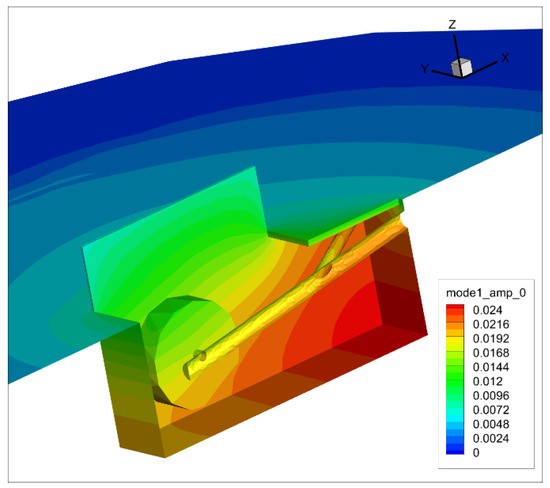
Figure 21.
Mode(0,0,0) for the 10% width gap.
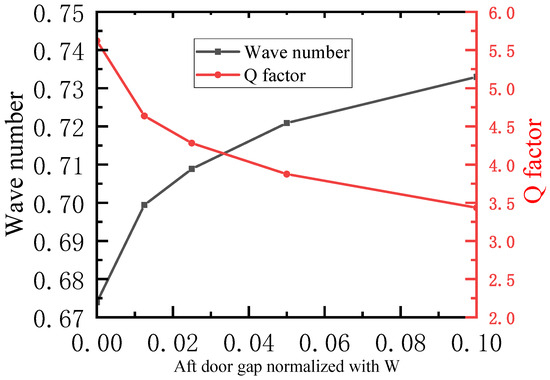
Figure 22.
Wave number and Q factor versus aft door gap.
3.7. Combined Effect of Longitudinal Gap Between the Two Aft Doors and Volume Reduction
While individual geometric modifications provide substantial damping enhancements, a singular drastic change might be constrained by engineering feasibility. Therefore, a synergistic approach combining modest adjustments is explored. Based on the research in the two preceding sections, two modest parameter values are selected, a gap of 2.5% of the width (W) and a 10-degree volume cut (corresponding to approximately 6% volume reduction), to demonstrate the benefit of this integrated approach. The results for the baseline, each modification, and the combined geometry are presented in Figure 23. Individually, the 2.5% gap and the 10-degree cut provide reductions of about 2.3 dB and 1.4 dB, respectively, and both induce a similar frequency shift, moving the resonance condition to Mach 0.60. The combined design increases the damping to achieve a 3.8 dB reduction (almost equal to the sum of 2.3 dB and 1.4 dB), while producing a further frequency shift and moving the acoustic resonance to Mach 0.64. At the baseline peak Mach number 0.57, the total attenuation is 4.9 dB, which is almost the sum of 1.9 dB from the volume cut and 2.9 dB from the gap.
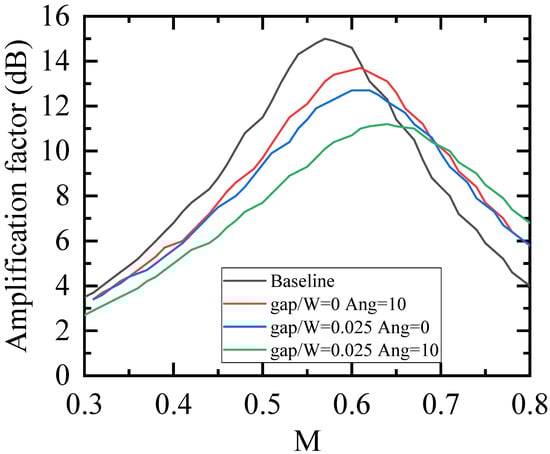
Figure 23.
Amplification factor versus Mach number for aft door gap, volume reduction, and their combination.
4. Conclusions
This study verifies the engineering applicability of an acoustic eigenvalue solver for predicting and controlling resonant tonal noise in a full-scale NLG bay. By adopting a high-order FEM solver to solve the Helmholtz equation coupled with PML boundary conditions, the proposed method accurately identifies the system eigenmodes of the NLG bay cavity and quantitatively characterizes the radiation damping via the Q-factor. This provides a robust numerical framework for both the resonance control research and industrial engineering practice.
A systematic evaluation of design parameters reveals that acoustic damping is a highly effective and quantifiable control lever. From a design perspective, shortening the aft door or introducing a longitudinal gap simultaneously enhances radiative damping and shifts the resonance to higher, less critical Mach numbers, thereby reducing unsteady pressure loading and enhancing structural integrity. Conversely, lengthening the door proves detrimental. Furthermore, volume reduction via a geometric “cut” and adjusting the front door angle provides additional, viable control mechanisms.
Most importantly, the study establishes that a combined strategy, integrating a modest longitudinal gap with a small volume reduction, produces a synergistic effect approximately equal to the superposition of both modifications. This integrated approach is highly practical from an engineering standpoint, as it achieves equivalent overall performance without requiring drastic adjustments to any single parameter.
In summary, this research establishes a validated numerical framework and clear design criteria for the use of cavity acoustic damping. It not only deepens the understanding of the coupling mechanism between the NLG bay cavity acoustic resonance and Rossiter modes, but also proposes engineering-feasible passive control strategies. The research findings provide vital technical guidance for reducing aero-vibro-acoustic levels, improving the structural durability of NLG systems, and meeting safety regulations during aircraft development.
While this study establishes a validated numerical framework, two primary avenues remain to be explored. First, future work will prioritize experimental validation through wind tunnel and flight testing to further verify the efficacy and engineering practicability under real-world conditions. Second, to extend from the current preliminary combined approach, the next phase of research will incorporate multi-objective optimization algorithms. This will enable the identification of global optima within a broader design space, especially refining the trade-off between enhanced acoustic damping and overall aerodynamic performance.
Author Contributions
Conceptualization, Y.S. and P.L.; methodology, B.C.; validation, H.G.; formal analysis, B.C.; investigation, Y.S. and P.L.; data curation, Y.S.; writing—original draft preparation, Y.S.; writing—review and editing, H.G.; supervision, P.L.; project administration, Y.S. All authors have read and agreed to the published version of the manuscript.
Funding
This research received no external funding.
Data Availability Statement
The raw data supporting the conclusions of this article will be made available by the authors on request.
Conflicts of Interest
Yifeng Sun and Bréard Cyrille were employed by the company COMAC. The remaining authors declare that the research was conducted in the absence of any commercial or financial relationships that could be construed as a potential conflict of interest.
References
- Rockwell, D.; Naudascher, E. Review-self-sustaining oscillations of flow past cavities. J. Fluids Eng. 1978, 100, 152–165. [Google Scholar] [CrossRef]
- Grace, S.M. An overview of computational aeroacoustic techniques applied to cavity noise prediction. In 39th Aerospace Sciences Meeting and Exhibit; American Institute of Aeronautics and Astronautics: Reno, NV, USA, 2001. [Google Scholar]
- Rizzetta, D.P.; Visbal, M.R. Large eddy simulation of supersonic cavity flow fields including flow control. AIAA J. 2003, 41, 1452–1462. [Google Scholar] [CrossRef]
- Ahuja, K.K.; Gaeta, R.J., Jr.; D’Agostino, M. High Amplitude Acoustic Behavior of a Slit-Orifice Backed by a Cavity; NASA CR-2000-210635; NASA: Washington, DC, USA, 2000.
- Allen, R.; Mendonca, F.; Kirkham, D. RANS and DES turbulence model predictions of noise on the M219 cavity at M = 0.85. Int. J. Aeroacoust. 2005, 4, 135–151. [Google Scholar] [CrossRef]
- Langtry, R.B.; Spalart, P.R. DES Investigation of a baffle device for reducing landing-gear cavity noise. In Proceedings of the 46th Aerospace Sciences Meeting & Exhibit, Reno, NV, USA, 7–10 January 2008. [Google Scholar]
- Massenzio, M.; Blaise, A.; Lesueur, C. Mechanisms of self-sustained oscillations induced by a flow over a cavity. J. Vib. Acoust. 2008, 130, 051001. [Google Scholar] [CrossRef]
- Kim, H.; Hu, Z.; Thompson, D. Effect of cavity flow control on high-speed train pantograph and roof aerodynamic noise. Railw. Eng. Sci. 2020, 28, 54–74. [Google Scholar] [CrossRef]
- Wang, Z.K.; Djambazov, G.; Lai, C.H.; Pericleous, K. Numerical simulation of flow-induced cavity noise in self-sustained oscillations. Comput. Vis. Sci. 2007, 10, 123–134. [Google Scholar] [CrossRef]
- Tinar, E.; Rockwell, D. Generation of locked-on flow tones: Effect of damping. J. Fluids Struct. 2014, 44, 129–144. [Google Scholar] [CrossRef]
- Rossiter, J.E. Wind-Tunnel Experiments on the Flow over Rectangular Cavities at Subsonic and Transonic Speeds; Aeronautical Research Council Reports and Memoranda, No. 3438; Her Majesty’s Stationery Office: London, UK, 1964. [Google Scholar]
- Holmes, P.J.; Lumley, J.L.; Berkooz, G. Turbulence, Coherent Structures, Symmetry and Dynamical Systems; Cambridge University Press: Cambridge, UK, 1996. [Google Scholar]
- Liu, Y.; Liu, P.Q.; Guo, H.; Hu, T.; Zhang, J. Acoustic experimental investigation of the acoustic resonant influence on Rossiter modal tones at the locked-on state. Appl. Acoust. 2025, 236, 110671. [Google Scholar] [CrossRef]
- Liu, Y.; Liu, P.Q.; Guo, H.; Hu, T.; Zhang, J. Investigation of the dominant Rossiter modal tones at the locked-on state. J. Sound Vib. 2023, 556, 117741. [Google Scholar] [CrossRef]
- Thangamani, V. Mode behavior in supersonic cavity flows. AIAA J. 2019, 57, 3410–3421. [Google Scholar] [CrossRef]
- Neri, E.; Kennedy, J.; Bennett, G.J. Bay cavity noise for full-scale nose landing gear: A comparison between experimental and numerical results. Aerosp. Sci. Technol. 2018, 72, 278–291. [Google Scholar] [CrossRef]
- Schmid, S.; Lutz, T.; Krämer, E. Simulation of the Unsteady Cavity Flow of the Stratospheric Observatory For Infrared Astronomy. In Proceedings of the IUTAM Symposium on Unsteady Separated Flows and Their Control, Corfu, Greece, 18–22 June 2007. [Google Scholar]
- East, L.F. Aerodynamically induced resonance in rectangular cavities. J. Sound Vib. 1996, 3, 277–287. [Google Scholar] [CrossRef]
- Yamouni, S.; Sipp, D.; Jacquin, L. Interaction between feedback aeroacoustic and acoustic resonance mechanisms in a cavity a global stability analysis. J. Fluid Mech. 2013, 717, 134–165. [Google Scholar] [CrossRef]
- Jing, X.; Sun, X.; Wu, J.; Meng, K. Effect of grazing flow on the acoustic impedance of an orifice. AIAA J. 2001, 39, 1478–1484. [Google Scholar] [CrossRef]
- Flynn, K.P.; Panton, R.L. Effect of Helmholtz resonators on boundary layer turbulence. AIAA J. 1990, 28, 1857–1858. [Google Scholar] [CrossRef]
- Khosropour, R.; Millet, P. Excitation of a Helmholtz resonator by an air jet. J. Acoust. Soc. Am. 1988, 88, 1211–1221. [Google Scholar] [CrossRef]
- Kook, H.; Mongeau, L. Analysis of the periodic pressure fluctuations induced by flow over a cavity. J. Sound Vib. 2002, 251, 823–846. [Google Scholar] [CrossRef]
- Kook, H.; Mongeau, L.; Franchek, M.A. Active control of pressure fluctuations due to flow over Helmholtz resonators. J. Sound Vib. 2002, 251, 61–76. [Google Scholar] [CrossRef]
- Elder, S.A. Edgetones versus pipetones. J. Acoust. Soc. Am. 1978, 64, 1721–1723. [Google Scholar] [CrossRef]
- Howe, M.S. The influence of mean shear on unsteady aperture flow, with application to acoustical diffraction and self-sustained cavity oscillations. J. Fluid Mech. 1981, 109, 125–146. [Google Scholar] [CrossRef]
- Larchevêque, L.; Sagaut, P.; Labbé, O. Large-eddy simulation of a subsonic cavity flow including asymmetric three-dimensional effects. J. Fluid Mech. 2007, 577, 105–126. [Google Scholar] [CrossRef]
- Wittich, D.J.; Cain, A.B.; Jumper, E.J. Strong flow-acoustic resonances of rectangular cavities. Int. J. Aeroacoustics 2011, 10, 277–294. [Google Scholar] [CrossRef]
- Thangamani, V.; Knowles, K.; Saddington, A.J. Effects of scaling on high subsonic cavity flow oscillations and control. J. Aircr. 2014, 51, 424–433. [Google Scholar] [CrossRef]
- Koch, W. Acoustic Resonances in rectangular open cavities. AIAA J. 2005, 43, 2342–2349. [Google Scholar] [CrossRef]
- Schwochow, J.; Sinske, J.; Buchbach, R. Inflight-Measurements of Aircraft Undercarriage Vibration during Deployment. In Proceedings of the European Test and Telemetry Conference 2018, Nürnberg, Germany, 26–28 June 2018. [Google Scholar]
- NGSolve Documentation. Perfectly Matched Layer (PML) for Helmholtz Equation. Available online: https://docu.ngsolve.org/latest/i-tutorials/unit-1.7-helmholtz/pml.html (accessed on 12 February 2026).
- Meerbergen, K.; Spence, A. Implicitly restarted Arnoldi with purification for the shift-invert transformation. Math. Comput. 1997, 66, 667–689. [Google Scholar] [CrossRef]
- Tam, C.K.W. The acoustic modes of a two-dimensional rectangular cavity. J. Sound Vib. 1976, 49, 353–364. [Google Scholar] [CrossRef]
- Wittich, D.J., III; Jumper, E. Pressure Oscillation Resulting from Subsonic Flow over a Partially Covered Cavity. In Proceedings of the 41st Plasmadynamics and Lasers Conference, Chicago, IL, USA, 28 June–1 July 2010; p. 4497. [Google Scholar]
- Liu, Y.; Liu, P.; Guo, H. Experimental Study on the Suppression of Cavity Noise in a Locking-On State by a Slanting Inner Wall. Aerospace 2024, 11, 1005. [Google Scholar] [CrossRef]


Disclaimer/Publisher’s Note: The statements, opinions and data contained in all publications are solely those of the individual author(s) and contributor(s) and not of MDPI and/or the editor(s). MDPI and/or the editor(s) disclaim responsibility for any injury to people or property resulting from any ideas, methods, instructions or products referred to in the content. |
© 2026 by the authors. Licensee MDPI, Basel, Switzerland. This article is an open access article distributed under the terms and conditions of the Creative Commons Attribution (CC BY) license.