Abstract
Fault detection and classification localization in photovoltaic power grids is a key challenge in photovoltaic power systems. Due to the greater fluctuation of power data in photovoltaic power grids, traditional grid fault detection methods suffer from inefficiency, low accuracy, and inaccurate fault localization in photovoltaic scenarios. In this paper, a fuzzy control technique combined with an improved GABP neural network is used to identify potential fault nodes in the photovoltaic distribution network. The symmetric crossover operator of the genetic algorithm and the symmetry constraints of the neural network weight matrix are used to improve the model’s ability to capture the symmetric fluctuation characteristics of photovoltaic data, while a classification module consisting of three fuzzy controllers is used for fault identification. The simulation results show that the recognition method proposed in this paper has good performance and the fault classification accuracy reaches 92.75%, which provides a practical reference value for the management of photovoltaic distribution network.
1. Introduction
In recent years, the global energy structure has been accelerating its transition toward clean and low-carbon sources, with renewable energy emerging as the core force in addressing climate change and ensuring energy security. According to the annual market report released by the International Energy Agency (IEA), global renewable energy installed capacity increased by 50% year-on-year in 2023, reaching a record high of 510 GW. Among this, new solar photovoltaic installed capacity reached 345.5 GW, accounting for 65% of the total new renewable energy installed capacity for the year. As shown in Figure 1, China contributed over half of the increase, with new installed capacity accounting for 60%, becoming the core driving force behind global photovoltaic development [1]. Meanwhile, the localization rate of domestically developed 200–300 kW wind turbines has exceeded 90%, and the national grid-connected installed capacity of biomass power generation has reached 44.14 million kW. The rapid breakthroughs in various renewable energy technologies are driving the global energy system toward a multi-energy complementary and highly electrified direction, but they also impose higher requirements on fault detection and maintenance technologies. In particular, the penetration rate of distributed photovoltaic power generation in power systems continues to rise, with its value in reducing transmission losses, alleviating distribution grid congestion, and promoting the achievement of carbon neutrality goals becoming increasingly evident. Additionally, it demonstrates unique advantages in independent power supply scenarios in remote areas and regions without traditional grid coverage, providing important support for improving regional power supply reliability and residents’ quality of life.
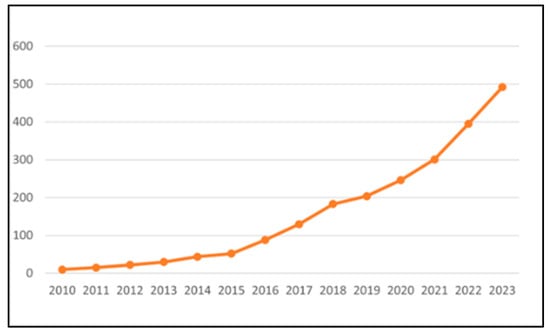
Figure 1.
Cumulative installed capacity of photovoltaic and solar power generation in China from 2010 to 2023 (unit: GW).
However, with the continuous expansion of the photovoltaic distribution network, the frequency of faults has significantly increased, and the fault characteristics have also shown complexity and diversity [2]. The photovoltaic distribution network presents characteristics such as complex topology, flexible operation mode, and unstable power output. Fault signals have both weak and high-frequency transient characteristics, which are significantly different from traditional distribution networks and greatly increase the difficulty of fault detection and type identification. This makes traditional fault localization methods based on Feed Terminal Units (FTU) [3], such as matrix algorithms, impedance methods, traveling wave methods, etc., difficult to adapt to weak fault characteristics and transient signal distortions in photovoltaic scenarios, often resulting in low detection efficiency and inaccurate fault location. With the rapid development of artificial intelligence technology [4], although intelligent algorithms such as neural networks and electromagnetic time reversal (EMTR) have gradually been applied in the field of fault detection due to their unique ability to capture spatiotemporal features and super-resolution characteristics, their detection efficiency and robustness still need to be improved due to factors such as large fluctuations in photovoltaic power grid data and complex harmonic interference [5].
To address the aforementioned issues, this paper proposes a fault detection method for photovoltaic power grids based on improved GABP neural network and fuzzy system. This method first utilizes an improved GABP neural network for preliminary diagnosis of photovoltaic data and introduces three fuzzy controllers to form a classification module, thereby accurately locating the fault localization, providing important technical support for the safe, stable, and efficient operation of photovoltaic distribution networks. The contribution of this paper is as follows: (1) Constructing a photovoltaic power grid fault recognition architecture based on improved GABP neural network and fuzzy system, achieving accurate detection and positioning of photovoltaic panel, generator, and line faults, providing technical support for the safe operation and maintenance of photovoltaic distribution networks; (2) Optimize the GABP network structure, combined with L2 regularization, adaptive learning rate and other strategies, to enhance the feature capture and processing capabilities of photovoltaic fluctuation data; (3) Based on the validation of the California photovoltaic dataset, the improved GABP neural network outperforms the ordinary BP and GABP models in error convergence and fitting accuracy. The proposed fault recognition method has an accuracy rate of 92.75%, confirming its efficiency and practicality in fault recognition of photovoltaic power grids.
The subsequent chapters of this paper are arranged as follows: Section 2 summarizes the relevant technologies and development status, Section 3 elaborates on the overall design of the method, Section 4 explains the fault detection technology based on fuzzy control, Section 5 introduces the fault classification scheme based on fuzzy system, Section 6 verifies the effectiveness of the method through experiments, and Section 7 summarizes the results.
2. Related Technologies and Current Developments
Current research extensively focuses on applying neural network technologies to power grid fault detection. For islanding detection, researchers have employed various neural network models. Among these, Masoud Ahmadizour and Hashim Hizam et al. [6] pioneered the application of Ridgelet Probabilistic Neural Networks (RPNN) to islanding detection, proposing a novel training method based on a modified differential evolution algorithm. Arif Hussain et al. [7] conducted detection and classification of islanding and grid-connected mode events using Finite Element Time-Domain (FETD) analysis combined with Long Short-Term Memory (LSTM) networks. Antonio Cano et al. [8] introduced a methodology integrating Discrete Wavelet Transform (DWT) with Radial Basis Function Neural Networks (RBFNN), applied to fault detection in microgrids with multiple photovoltaic-based renewable energy generators. Rahmat Aazami et al. [9] utilized microgrid terminal parameters (e.g., sequence current components, voltage, and other relevant electrical quantities) to capture characteristic patterns of islanding events, ultimately employing neural networks for classification and identification.
In photovoltaic grid systems, fault diagnosis and localization methodologies are primarily categorized into data-driven approaches and mathematical model-based techniques. Compared to approaches relying on precise mathematical models—which often prove challenging to establish in practical implementations—mainstream fault diagnosis and localization predominantly depends on data-driven strategies. These strategies involve model training to ultimately achieve diagnostic objectives during testing phases. Such methodologies encompass machine learning techniques, neural network technologies, and multivariate statistical analysis. Mansour Hajji et al. [10] developed a Fault Detection and Diagnosis (FDD) framework that integrates Machine Learning (ML) and Deep Learning (DL) to effectively diagnose the common faults of line-line and line-ground in photovoltaic systems, and Adel Mellit et al. [11] investigated the ML and Ensemble Learning (EL) methods based on the I-V curves of photovoltaic arrays with the aim of solving the problem of detecting and classifying complex faults. Multilayer Perceptron (MLP) neural network optimization research provides a reference for model structure improvement, and a study comparing the MLP and logistic regression model in the context of steel structure design optimization confirms that the MLP is more accurate [12]. Kermani A et al. [13] proposed an energy management scheme based on iterative optimization and dynamic planning for microgrids containing photovoltaic and energy storage, where the controller can adapt to the fluctuation of photovoltaic output and restore the stability of the grid within 1–2 cycles.
The inherent high volatility and stochasticity of photovoltaic systems significantly increase the training complexity and generalization error of machine learning and neural network models. Furthermore, shading phenomena present a critical challenge in photovoltaic fault diagnosis, primarily due to the difficulty in accurately distinguishing transient characteristics induced by shading from features indicating permanent component damage—particularly under low-power operating conditions where both manifestations exhibit highly similar signatures, frequently leading to misclassification. To address these classification challenges arising from volatility, stochasticity, and feature ambiguity, fuzzy technologies (including fuzzy systems, fuzzy inference, and fuzzy control) demonstrate distinctive advantages. These techniques enhance classification robustness in complex operating scenarios by effectively incorporating expert knowledge and processing uncertain information. Bendary A.F. et al. [14] integrated neural networks with fuzzy systems through an Adaptive Neuro-Fuzzy Inference System (ANFIS)-based controller, achieving comprehensive fault detection, localization, clearance, and system reconfiguration in photovoltaic systems under low-power operating conditions. Muhammad Abbas et al. [15] trained an ANFIS model using grid partitioning (GP) and subtractive clustering (SC) strategies with existing research data, constructing an efficient photovoltaic fault detection and classification system. Salima Sarikh et al. [16] proposed an electrical parameter-based fuzzy diagnostic algorithm. This algorithm extracts feature values from measured I-V curves of crystalline silicon photovoltaic modules, specifically designed to identify typical power plant faults including uniform dust accumulation, partial shading, and potential induced degradation (PID). Furthermore, the authors innovatively developed a novel algorithm for detecting I-V curve characteristic shifts caused by non-ideal bypass diode behavior induced by partial shading. This detection algorithm employs quadratic and cubic polynomial regression models with residual analysis, whose key feature-curve concavity-exhibits high sensitivity to noisy data. Liu et al. [17] studied the security event triggering control under random communication protocols and FDI attacks for the IT-2 fuzzy network system. They proposed the DETSC protocol and constructed a fuzzy observer controller, whose fuzzy control robustness design provides a reference for security control in interference resistance for fault diagnosis in photovoltaic distribution networks.
Previous research demonstrates the extensive application of fuzzy theory in photovoltaic system fault detection and prediction. This study aims to innovatively integrate the advantages of neural networks in conventional grid fault detection with those of fuzzy methods in photovoltaic system diagnostics. Within this context, Mahmoud Dhimish et al. [18] proposed a photovoltaic fault detection algorithm based on an Artificial Neural Network (ANN) and Fuzzy Logic System (FLS) interface. Their research not only compared the detection performance of ANN and FLS but also conducted an in-depth investigation of two predominant fuzzy system implementation methodologies: Mamdani-type and Sugeno-type fuzzy logic interfaces. Experimental results revealed that both fuzzy systems demonstrated strong agreement in detection outputs [19]. Liu et al. [20] proposed a fuzzy-enhanced event-triggered control driven by PSO-RL for nonlinear network systems. They constructed a GFHM state identifier and DETM and used the HJI equation to achieve optimized control and ensure UUB stability. Their approach of combining fuzzy modeling and intelligent optimization provides an algorithmic reference for capturing photovoltaic grid fault characteristics.
Leveraging the complementary advantages of neural networks and fuzzy control, this paper proposes a fault identification method for photovoltaic power grids based on improved GABP neural network and fuzzy system. This method aims to significantly enhance the fault detection rate in photovoltaic systems while achieving precise and robust classification of fault types, thereby providing reliable foundations for subsequent efficient operation and maintenance decision-making. Through precise anomaly identification in the fault detection stage and localization functions in the fault classification stage, it will help improve the reliability and maintainability of photovoltaic systems, better serving energy demands while delivering sustainable photovoltaic power solutions for remote areas lacking conventional grid coverage.
3. Overall Design
The fault identification process in the photovoltaic power grid scenario mainly involves two important steps: (1) fault detection, and (2) fault classification. Fault detection of photovoltaic power grids is a key link to ensure the safe and efficient operation of photovoltaic power generation systems. In recent years, intelligent pattern recognition methods such as Machine Learning (ML), fuzzy logic, Decision Tree (DT), Support Vector Machine (SVM), and Artificial Neural Network (ANN) have been widely used in power grid fault detection. Some scholars have applied the BP neural network based on genetic algorithms to the fault diagnosis of traditional distribution networks and proved its effectiveness and accuracy. However, the traditional power grid mainly relies on a stable fuel supply, and the fluctuations in power data are relatively small. However, the power output of photovoltaic power generation systems is affected by weather conditions, resulting in unstable power generation and greater fluctuations in power data. Therefore, it is difficult to directly apply traditional power grid fault detection methods to photovoltaic power grids. This paper proposes a modified BP neural network based on an improved genetic algorithm for the preliminary detection of photovoltaic power data. Considering the randomness and volatility of photovoltaic output, this paper improves the number of hidden layers and the adaptive learning rate of the neural network for photovoltaic scenarios. However, due to the robustness of the BP neural network and the regularization method it adopts, it cannot detect all of faulty data. To reduce the misjudgment of normal power data, this paper adopts the concept of enclosure, amplifies the threshold detection range for identifying power data as abnormal, so that the detected data contains all abnormal data and a small part of normal data. The error range of the optimized neural network is smaller than that of the ordinary neural network. It has a better overall and zero-value fitting effect in fluctuating data, improving the accuracy of fault detection.
Photovoltaic fault classification is the basis for achieving fault identification and efficient maintenance of photovoltaic power grids. In view of the deficiency of existing fault diagnosis methods in the adaptability of complex photovoltaic power scenarios, this paper designs a classifier based on multiple sets of fuzzy controllers to classify the abnormal power data detected by neural networks for different fault types of photovoltaic panels, generators and lines. The precise determination of fault types and the rapid location of fault positions are achieved, providing an important basis for the later maintenance and repair of the distribution network. The final simulation results prove that the photovoltaic power grid fault identification method proposed in this paper improves the accuracy and efficiency of fault identification, classifying the fault identification results compared with the existing methods. It also significantly reduces the cost of fault investigation and repair and facilitates the later maintenance of the power grids. It has certain practical reference value.
The main framework of fault identification method for photovoltaic power grids based on improved GABP neural network and fuzzy system designed in this paper is divided into two functional modules: fault identification of photovoltaic power grids and fault classification of photovoltaic power grids. The specific framework diagram is as follows, as shown in Figure 2:
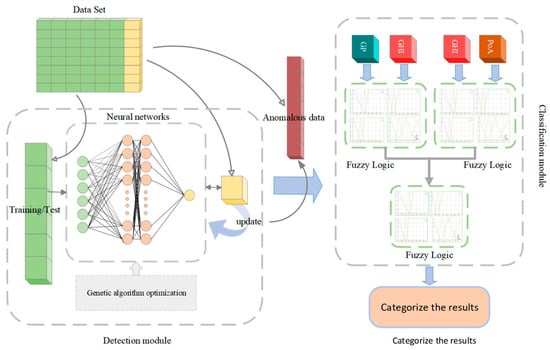
Figure 2.
Main Body Frame Diagram.
In the data processing of fault detection, the original photovoltaic power data is divided into the training set and the test set in a ratio of 7:3, and the last data item of each piece of data is extracted as the fitting target for the subsequent training and verification of the model.
In the fault detection stage, this paper employs three models—the traditional BP neural network, the GABP neural network, and the improved GABP neural network—for photovoltaic fault detection. The improved GABP neural network optimizes the network structure and training strategy based on the traditional GABP model. It uses genetic algorithms to optimize initial weights and thresholds to enhance convergence efficiency and introduces regularization and adaptive learning rate mechanisms to strengthen generalization capabilities. By comparing the training errors and convergence speeds of the three models, the improved GABP neural network demonstrated the best performance during training, and its specific advantages will be detailed in subsequent sections. The improved GABP neural network trained for fault detection was applied to test data, and potential fault anomalies were identified by comparing the predicted values output by the model with the actual data.
In the fault classification stage, this paper constructs a classifier composed of three fuzzy controllers. The three fuzzy controllers correspond to three different fault types: photovoltaic panel faults, generator faults, and line faults. Symmetry theory is introduced into the field of photovoltaic fault identification, and symmetric input design is used to form three groups of symmetric input pairs: GHI-POA, GHI-G (P), POA-G (P) three sets of symmetric input pairs. Through the synergistic relationship between input parameters, the symmetrical mapping of fault features is achieved. By performing membership degree calculations and fuzzy reasoning on the abnormal data detected by the GABP neural network, the abnormal data is further screened and classified, enabling precise fault classification and localization. The fault identification method for photovoltaic power grids based on improved GABP neural network and fuzzy system proposed in this paper improves the efficiency of photovoltaic fault identification through data processing, fault detection and fault classification, which is helpful for later maintenance and has certain practical value.
4. Fuzzy Control Based Fault Detection in Photovoltaic Distribution Network
As an established solution in power grid fault detection, neural networks leverage data-driven mechanisms to circumvent the need for complex mathematical modeling while delivering high-precision detection capabilities and demonstrating optimization potential.
4.1. Fault Contributing Factors Analysis
A distribution network fault is defined as an event involving power supply interruption or deterioration of power quality caused by the failure of electrical equipment during operation. The core influencing factors include:
Equipment Aging: Insulation degradation, mechanical wear, and material deterioration induced by long-term operation significantly increase the risk of failure.
Abnormal Loads: Overload and short-circuit conditions directly lead to the accumulation of thermal stress and insulation failure in equipment.
Environmental Stress: Extreme environments such as high temperature and high humidity accelerate equipment corrosion and performance degradation.
Human Operational Errors: Behavioral triggers such as incorrect switching actions and wiring mistakes.
In photovoltaic power generation system, in addition to the aforementioned fault factors, issues such as photovoltaic panel fault, inverter fault, and line fault, may also occur. As shown in Figure 3, the photovoltaic generation power exhibits a normal distribution variation pattern in current over a single day and regular fluctuations over a month. Weather variations introduce stochastic fluctuations in the current and voltage within the photovoltaic power grid.
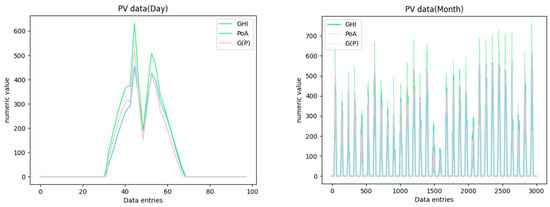
Figure 3.
Generator power diagram.
The current data of the photovoltaic power grid has significant non-stationary characteristics, which are characterized by random fluctuations and high-frequency noise, which substantially increases the fitting difficulty of the neural network. Addressing this specific characteristic, this paper proposes a neural network optimization framework oriented towards the features of current data. The framework focuses on resolving the issue of fitting difficulty, thereby providing a technical foundation for accurate fault diagnosis in photovoltaic power grids.
4.2. Photovoltaic Power Grid Fault Detection
In the field of power grid fault detection, neural networks are a widely adopted solution. Addressing the specific regression prediction challenge inherent to photovoltaic grid-connected systems, this paper employs a neural network-based regression model for fault detection. Model performance is enhanced through the integration of multiple optimization techniques, including: (1) BP Neural Network as the foundational architecture; (2) GABP Network to enhance parameter optimization capability; (3) AdaGrad adaptive learning rate algorithm to achieve dynamic gradient adjustment; (4) L2 Regularization to mitigate overfitting; (5) Dropout mechanism to improve generalization performance.
4.2.1. Enhanced Neural Network Solution
Adapting to the characteristics of power grid data, the GABP neural network employed in this paper adopts a three-layer architecture: an input layer, hidden layers, and an output layer. In response to the fluctuation characteristics of photovoltaic power grid data, the fitting accuracy of the network is enhanced by adopting a double-layer symmetric hidden layer structure, with 32 nodes in each layer. The symmetric neuron layout is used to enhance the symmetric mapping ability of the positive and negative fluctuation characteristics of photovoltaic data, avoiding zero value fitting deviation caused by asymmetric structure. In addition, L2 regularization and dropout processing are also carried out.
Full Loss Function with L2 Regularization are shown in Equations (1) and (2):
In the formula, is the regularization result; is the mean square error, is the regularization parameter; is the weight vector; is the square of the L2 norm of the weights; is the number of samples; is the true value of the model; is the predicted value of the model. L2 regularization constrains the symmetric norm of the weight matrix, forcing the network to learn symmetric feature representations and suppressing overfitting caused by asymmetric noise in photovoltaic data.
An adjusted Adam adaptive learning rate algorithm is employed to accelerate convergence speed. The learning rate adjustment mechanism of the Adam algorithm is formulated as follows, shown in Equations (3)~(7):
In the formula, and respectively represent the first-order and second-order moment estimates of the gradient; and represent the bias-corrected first-order and second-order moment estimates; and are the exponential decay rates used to control the first-order and second-order moment estimates; is the learning rate; is the parameter; is the gradient at iteration t; is a small constant added for numerical stability to prevent the denominator from being too small. The pseudocode for updating Adam algorithm parameters is shown in Algorithm 1.
| Algorithm 1: Improved Adam Optimizer | |
| Input: Initial parameters θ0, learning rate η = 0.001, decay step T = 1000, decay rate γ = 0.76 | |
| Output: Optimized parameters θ | |
| 1: | Initialize: m0 = 0, v0 = 0, β1 = 0.7, β2 = 0.999, ε = 1 × 10⁻⁸ |
| 2: | for t = 1 to max_iterations do |
| 3: | Compute current gradient gt = ∇θL(θt − 1) |
| 4: | Update first moment estimate: mt = β1·mt − 1 + (1 − β1)·gt |
| 5: | Update second moment estimate: vt = β2·vt − 1 + (1 − β2)·gt2 |
| 6: | Compute bias-corrected estimate: m^t = mt/(1 − β1^t) |
| 7: | Compute bias-corrected estimate: v^t = vt/(1 − β2^t) |
| 8: | Update parameters: θt = θt − 1 − η·m^t/(√v^t + ε) |
| 9: | if t%T = =0 then |
| 10: | η= η×γ # Learning rate decay |
| 11: | end if |
| 12: | end for |
This paper sets = 0.7 to smooth the first-order moment estimate of gradients, and = 0.999 to smooth the second-order moment estimate. The initial learning rate η = 0.001 follows an exponential decay schedule: decaying every 1000 training steps with a decay factor of 0.76 (empirically validated through multiple experimental trials). For regularization, lambda_l2 = 0.001. The neural network simultaneously incorporates dropout as an anti-overfitting mechanism. These techniques operate synergistically during network training, where the complementary mechanisms of regularization strength and stochastic sparsity effectively prevent over-constraint issues inherent to single regularization approaches.
4.2.2. Genetic Algorithm Optimization
The Genetic Algorithm (GA), initially proposed by Holland, simulates biological evolutionary mechanisms for search and optimization. Drawing from Darwinian principles of natural selection and genetic inheritance—where the fittest survive—it achieves problem-solving through global optimization. The operational flowchart is illustrated in Figure 4. An individual is defined as a binary code of length 8. The initial population size is 100, the maximum number of genetic generations is 80, the generation gap is 0.9, the crossover probability is 0.8, and the mutation probability is 0.01. This paper uses GA to optimize the initialization of thresholds and weights in the network. Through symmetric crossover operator and symmetric mutation operation, the symmetric distribution characteristics of weight parameters in the population are maintained, which improves the convergence efficiency of the network while ensuring the robustness of the neural network to the symmetric fluctuation pattern of the photovoltaic power curve.
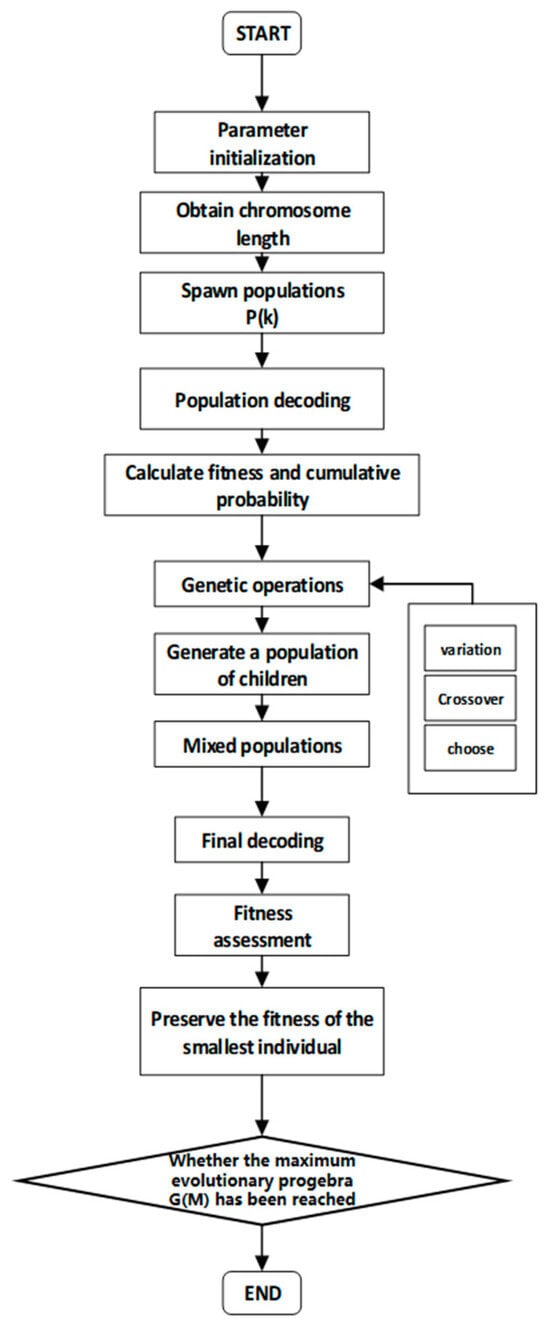
Figure 4.
Genetic algorithm flow char.
5. Fault Classification of Photovoltaic Power Grids Based on Fuzzy Systems
Fuzzy controllers, as a type of intelligent control system based on fuzzy logic theory, can effectively handle uncertainty and fuzziness problems in complex nonlinear systems by mapping fuzzy input variables to output space. Compared with traditional control methods that rely on precise mathematical models, fuzzy controllers demonstrate significant advantages in dealing with the dynamic characteristics and unstructured data of complex power systems due to their direct processing ability of fuzzy information. They are particularly suitable for handling fuzzy fault characteristics caused by environmental fluctuations and equipment operation in photovoltaic distribution networks.
This paper innovatively constructs an intelligent distribution network fault classification framework based on fuzzy systems for the problem of fault classification in photovoltaic distribution networks. On the one hand, photovoltaic data is affected by factors such as light intensity, temperature, and weather changes, presenting strong nonlinear and uncertain characteristics. Traditional classification methods are difficult to effectively characterize the complex mapping relationships between data. However, fuzzy controllers can transform the fuzziness of data into quantifiable control strategies through membership functions and fuzzy rule libraries, achieving robust processing of fluctuating data and noise interference. On the other hand, fuzzy controllers do not rely on precise system mathematical models and can construct control logic by integrating expert experience and operating rules. They have stronger flexibility and interpretability in photovoltaic distribution network scenarios, making it easier for operation and maintenance personnel to quickly locate the root cause of faults and make decisions based on classification results.
5.1. Fuzzy Classifier
The fault classification module constructed in this paper consists of three fuzzy controllers, as shown in Figure 5. Each controller achieves hierarchical diagnosis of fault types through differentiated input combinations: (1) Fuzzy Controller 1: Taking Global Horizontal Irradiance (GHI) and Plane of Array Irradiance (POA) as inputs, the outputs obtained are used to represent the degree of faults occurring in the photovoltaic panel fault by means of affiliation calculation; (2) Fuzzy Controller 2: Taking GHI and G(P) (generator power) as inputs, the outputs obtained are used to indicate the degree of generator fault by means of subordination calculation; (3) Fuzzy Controller 3: Taking POA and G(P) as inputs, the outputs obtained are used to indicate the degree of connecting line fault by means of subordination calculation.
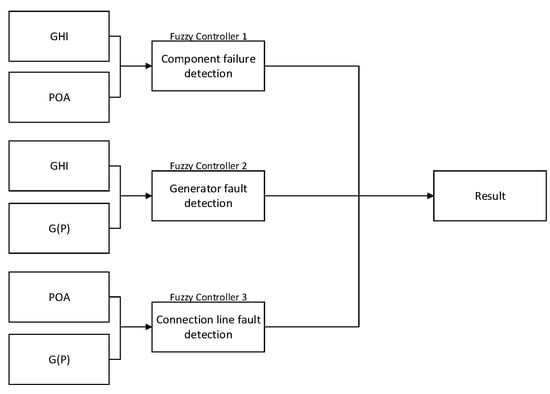
Figure 5.
Fuzzy Control Schematic.
The current classification framework focuses on three core hardware faults in photovoltaic distribution grids: photovoltaic panels, generators, and power lines. For critical practical issues such as MPPT errors, inverter failures, and misclassification due to shading, the existing framework can be extended to accommodate these issues. In response to the issue that some scholars have included the phenomenon of “shading” in the category of photovoltaic faults in existing research, this paper is based on actual operation and maintenance needs. Considering that natural occlusion phenomena such as cloud cover and leaf cover have short-term and periodic characteristics, the power fluctuations caused by them are fundamentally different from equipment failures. Therefore, in the design of fuzzy classifiers, the sensitivity of fuzzy classifiers is relaxed to weaken the interference of occlusion factors on classification results. This strategy significantly reduces the probability of misjudgment caused by environmental fluctuations while ensuring the classifier’s sensitivity to real faults.
5.2. Design of Membership Functions
5.2.1. Types and Mathematical Expressions of Membership Functions
The fuzzy classifier designed in this paper uses Gaussian and trapezoidal membership functions as the core mapping tool. The symmetric bell-shaped curve characteristic of Gaussian function can effectively characterize the symmetric fluctuation range of photovoltaic data. Their respective mathematical expressions are shown in Equations (8) and (9).
Gaussian membership function:
In the formula, represents the mean of the Gaussian function; represents the standard deviation, and e is the base of the natural logarithm.
Trapezoidal membership function is shown in Equation (9):
In the formula, a, b, and c represent the left endpoint, peak, and right endpoint of the function, respectively. indicates the membership degree of the input value x in set A.
5.2.2. Defuzzification Method
Use weighted average method for deblurring, as shown in Equations (10):
In the formula, n represents the number of fuzzy sets involved in deblurring calculations; Indicate the membership value of the -th fuzzy rule; Indicate the benchmark value of the output variable corresponding to the i-th fuzzy rule.
5.2.3. Physical Model of Irradiance
- Plane of Array Irradiance
The functional relationship between horizontal irradiance and plane of array irradiance is shown in Equation (11):
In the formula, represents the plane of array irradiance (W/m2) on the component surface; is the global horizontal irradiance (W/m2); denotes the angle of incidence between the sunlight and the normal to the component surface. When the sunlight shines vertically on the component plane (), the horizontal irradiance value is equal to the component plane irradiance value.
- 2.
- Horizontal Irradiance
The horizontal irradiance exhibits a sinusoidal periodic variation within a day, and its functional relationship with time is shown in Equation (12).
In the formula, represents the horizontal irradiance value (W/m2) at time t; A indicates the maximum value of horizontal irradiance (W/m2); is the angular frequency, represented as , where T is one day (h); is the phase shift, indicating the phase angle at t = 0. From the dataset, it is known that at noon, the values of GHI and POA are nearly equal, and the component’s placement is almost parallel to the ground.
5.2.4. Variable Domains and Fuzzy Sets Definition
The fuzzy controllers establish the input and output variable domains and fuzzy sets based on different quantifiers as follows:
- − GHI [0, 1100]{O (zero), S (small), M (medium), B (big), VB (very big)}.
- − POA [0, 1100]{O (zero), S (small), M (medium), B (big), VB (very big)}.
- − G(P) [0, 800]{O (zero), S (small), M (medium), B (large), VL (very large)}.
- − Photovoltaic Panel Fault [0, 100]{N (unlikely), P (possible), PP (very likely)}.
- − Generator Fault [0, 100]{N (unlikely), P (possible), PP (very likely)}.
- − Line Fault [0, 100]{N (unlikely), P (possible), PP (very likely)}.
Based on the understanding of fault characteristics in the field of photovoltaic operation and maintenance, when GHI and POA are in a coordinated stable state, the energy reception and conversion process of the photovoltaic panel is normal, and the probability of faults is low; When the synergy between the two is poor, there is a high probability of photovoltaic panel obstruction or component damage, resulting in a high probability of faults. This establishes the basic logic for designing fuzzy rules for component faults. Therefore, although the membership functions of GHI, POA, G(P), and the three types of fault results have different parameters due to their physical meanings, the fuzzy rules of the three fuzzy classifiers maintain consistency in logical architecture and language expression, making the three input pairs of the fuzzy classifier (GHI-POA, GHI-G(P), POA-G(P)) form a symmetric diagnostic network. To avoid redundant discourse, its rule system is uniformly summarized in Table 1.

Table 1.
Fuzzy planning of component faults.
6. Experiment and Analysis
Since the BP neural network we adopted cannot detect all fault data, this paper adopts the idea of enclosure to identify abnormal data and increase the detection rate of photovoltaic power faults. It takes the error between the predicted value and the true value as the core discrimination basis. To ensure the complete coverage of abnormal data, we have expanded the threshold detection range for identifying power data as abnormal. So that the detected data includes all abnormal data and a small portion of normal data. To further screen the abnormal data and eliminate normal data, this paper uses a series of binary classifiers to input the captured data into the classification module for reclassification, implementing a secondary discrimination on the initially captured data. Combining the fault indices of photovoltaic panels, generators, and power lines for secondary discrimination, and based on the set fault index grading standards, normal data is eliminated to ultimately achieve accurate classification and positioning of real fault data. The method proposed in this paper improves the efficiency of photovoltaic fault identification, reduces the false detection rate and missed detection rate. It is also helpful for later maintenance, providing key technical support for the reliable operation of photovoltaic power grids. The classification module consists of three fuzzy controllers. They classify the faults into four categories based on the input: photovoltaic panel faults, generator faults, line faults, and no faults. When a fault occurs, this classification result can provide a decision-making basis for quickly locating the fault point, significantly improving the response efficiency of fault handling.
6.1. Experimental Data
The experimental data in this paper are derived from the 2016 annual operational dataset of the entire California photovoltaic power grid in the United States, which is available on the international open-source grid data platform BetterGrids. In 2016, a large-scale deployment of photovoltaic power equipment was completed in California, USA. Its geographical coordinates are at 37.25° north latitude and 119.75° west longitude, and it has extremely abundant sunlight resources. Moreover, the latitude of California is similar to that of the Yangtze River Delta region in China, and it has a high degree of similarity in terms of solar radiation intensity and sunshine duration in terms of sunlight resource characteristics. Based on this, this dataset has good scene adaptability and data migration value for related research on photovoltaic distribution networks in China. It can also provide effective support for exploring photovoltaic power grid technology systems suitable for the geographical and climatic conditions of China, as shown in Table 2.

Table 2.
Dataset.
6.2. Experimental Analysis
To verify the effectiveness of the proposed improved GABP, this paper conducts a comparative evaluation of the model’s performance through network error, fitting curve, mean square error, and fault mapping experiments. Firstly, the simulation environment is constructed, and the improved GABP neural network is used for training. As shown in Table 3, The number of training epochs is set to 300, the adaptive learning rate mechanism is enabled, the initial learning rate is set to 0.01, and L2 regularization and random dropout strategies are combined to prevent overfitting and improve the model’s generalization ability. In the genetic algorithm configuration, individuals use a binary encoding of length 8, the initial population size is set to 100, the maximum genetic iteration generations are 80, the population update ratio is set to 0.9, the crossover probability and mutation probability are configured as 0.8 and 0.01, respectively, and the genetic algorithm’s global search characteristics are utilized to optimize the neural network parameters.

Table 3.
Simulation Environment Setup.
Additionally, the cascaded fuzzy controller structure is shown in Figure 6, and multiple modules are coordinated to achieve precise classification of complex fault modes.
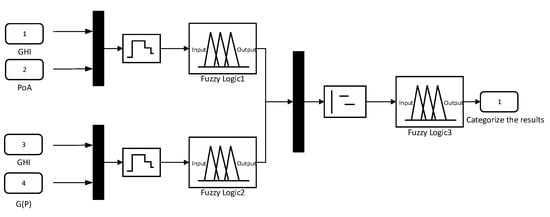
Figure 6.
Fuzzy classifier model for faults in a photovoltaic distribution network.
The comparison of errors in neural networks is a crucial basis for evaluating the performance of the model. To accurately evaluate the performance of the model, this paper conducts a comparative analysis of the errors of the ordinary BP neural network and the improved GABP neural network. Through experiments, the error line graphs of the ordinary BP neural network (left) and the improved GABP neural network (right) were obtained as shown in Figure 7.
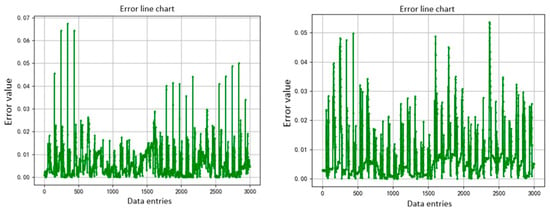
Figure 7.
Error discount comparison chart.
According to the experimental results, it can be seen that in the complex photovoltaic data scenario, random factors such as light and temperature are prone to amplify fluctuations, resulting in large prediction error fluctuations and more intense fluctuations in the error line graph. The error range fluctuates between 0 and 0.07, and most of the errors are concentrated in the range of 0 to 0.02. Compared with the error of the ordinary BP neural network, the error of the improved GABP neural network has a smaller convergence range, a smaller peak-valley difference. It has more gentle error line fluctuations and is less affected by data noise and sample distribution. The error of the improved GABP neural network fluctuates between 0 and 0.05, and most of the errors are concentrated in the range of 0 to 0.03. This indicates that the optimization of the initial network parameters through the genetic algorithm proposed in this paper is effective.
To evaluate the generalization ability of the model, this paper conducts a comparative analysis of the fitting effects of the ordinary BP neural network and the improved GABP neural network. The fitting line graph of the ordinary BP neural network (left) and the fitting line graph of the neural network in this paper (right) are shown in Figure 8.
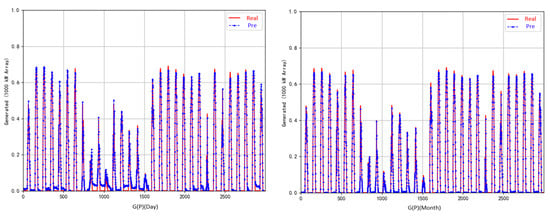
Figure 8.
Comparison of fitting results.
The experimental results show that in complex photovoltaic data scenarios, the improved GABP neural network performs significantly better than the ordinary BP neural network in overall fitting and zero-value fitting. The improved GABP neural network has a higher degree of curve coincidence, and the predicted curve is nearly overlapping with the real curve. Especially in the peak and valley areas, the deviation is extremely small, and there is no obvious lag or mismatch. When the data entries are around 800–1000, the zero-value fitting of the ordinary BP neural network begins to show large errors. When the data entries are around 1300–1500, the fitting becomes unstable and fluctuates. The improved GABP neural network has a significant advantage in zero-value fitting, and the fitting fluctuation is smaller at non-zero and non-peak points. The local error distribution is more uniform, and the fitting effect is better. The experimental results verify that the L2 regularization and random dropout strategy proposed in the improved GABP neural network have better generalization ability in practical applications. Meanwhile, by leveraging genetic algorithms, the GABP was improved to overcome the shortcomings of the ordinary BP neural network. In the scenario of strong nonlinearity and high dynamic characteristics of photovoltaics, it demonstrated superior fitting accuracy and trend capture capabilities, providing reliable technical support for the precise detection and analysis of photovoltaic faults.
The Mean Square Error (MSE) is calculated based on the average of the squared deviations between the predicted values and the true values. It can directly quantify and characterize the fitting degree of the model to the data. This paper conducts a comparative analysis of the MSE of the ordinary BP neural network, the ordinary GABP neural network, and the improved GABP neural network. The experimental results are shown in Figure 9.
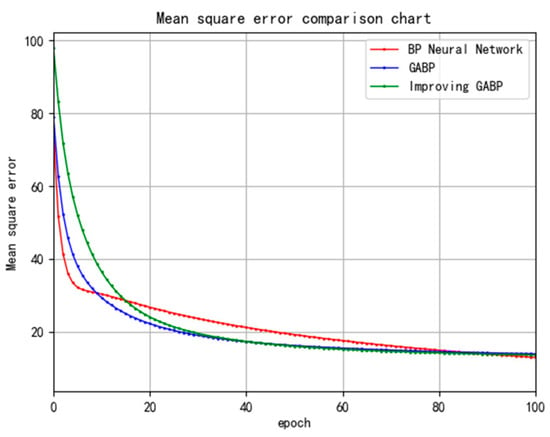
Figure 9.
Comparison of mean square errors.
Aiming at the scene characteristics of strong nonlinearity and high dynamics of photovoltaic distribution networks, this paper makes targeted adjustments and improvements to the GABP network. By increasing the number of hidden layers, the fitting complexity of the model to complex data patterns is improved. By fine tuning the regularization and Dropout parameters, the model fitting complexity rises, which leads to a higher mean square error of the improved GABP network than that of the ordinary BP neural network and the ordinary GABP neural network while bringing a better fitting effect and generalization effect. In order to accelerate the decline of MSE and optimize the model convergence performance, this paper introduces the Adamgrad learning rate decay strategy and adapts the genetic algorithm hyperparameters. The experimental results show that although the initial mean square error of the improved GABP neural network is higher than that of the comparison model, it has the fastest convergence rate and the lowest final mean square error. It shows that it is better than ordinary BP and ordinary GABP in terms of model accuracy and training efficiency, which verifies the effectiveness of the improved strategy to enhance the performance of neural networks and provides a more practical technical path for intelligent modeling in PV distribution network scenarios.
The abnormal data detected by the neural network is sent to the classification module for processing. The fuzzy classifier takes GHI, POA, and G(P) as inputs, and classifies the fault situations into three categories: photovoltaic panel faults, generator faults, and line faults. Based on the fault index returned from the experiments, the paper presents the distribution of fault indices corresponding to various types of samples. Statistical data shows that the fault indices of non-faulty samples are concentrated in the range of 0–20. Samples that may have faults have weaker fault characteristics and their indices are mostly distributed in the range of 20–50. Samples that may have faults have significant fault characteristics and their indices are all greater than 50. Therefore, this paper further classifies the fault severity. When the fault index is within the range of 0–20, it is determined as no abnormality. When the fault index is within the range of 20–50, it is determined as possibly having a fault. When the fault index is within the range of 50–100, it is determined as likely having a fault. It should be noted that a small amount of data, after calculation, has an abnormal index within the range of 15–20. This is an acceptable abnormal fluctuation caused by factors such as cloud cover and changes in the illumination angle. It is reasonable to set the range of no abnormality as 0–20 and can effectively distinguish between real faults and normal fluctuations caused by environmental interference.
To verify the effectiveness of the fuzzy classifier in fault classification, a visual analysis was conducted on photovoltaic panel faults, generator faults, and line faults. The mapping diagram for photovoltaic panel faults is shown in Figure 10. This diagram reflects the relationship between the fault characteristics of the photovoltaic panel and the horizontal total radiation, the component plane irradiance, and the failure index of the photovoltaic panel. In the figure, the coordinate axes represent GHI, POA, and Failure index (photovoltaic panel fault index).
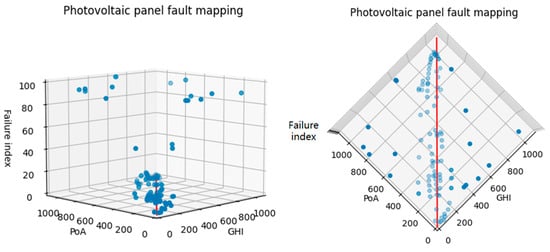
Figure 10.
Photovoltaic panel fault mapping.
This paper sets the straight line where GHI and POA satisfy GHI = POA as the reference benchmark. Within the plane where the line is located and in the surrounding certain space range, the fault index always remains at a relatively low level (usually less than 10). This indicates that when the difference between the GHI and POA corresponding to the data point falls within a specific range, it will be classified as non-abnormal data, which is consistent with the classification principle described earlier. For points far from the plane where the line is located, as the distance from this plane increases, the fault index shows a gradually increasing trend, which is also consistent with the above classification principle. Therefore, it can be determined that this classifier can achieve an ideal classification effect in the task of photovoltaic panel fault classification, effectively supporting the fault diagnosis requirements of the photovoltaic system.
The fault mapping diagram of the generator is shown in Figure 11. In the figure, the coordinate axes, respectively, represent GHI, G(P), and Failure index (generator fault index).
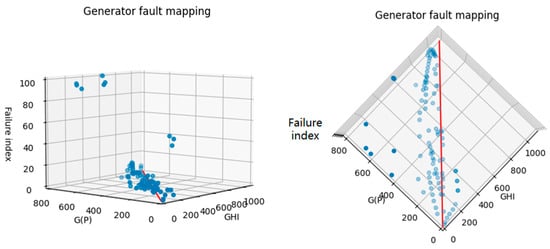
Figure 11.
Generator fault mapping.
Similarly, set the straight line GHI = G(P) as the evaluation benchmark. Within the plane where the line is located and in the surrounding certain space range, the fault index remains at a relatively low level. When the difference between the GHI corresponding to the data point and G(P) is small, the data point will be judged as non-abnormal data with a low fault index, which is consistent with the classification principle described earlier. For points far from the plane where the line is located, that is, when the synergy between GHI and G(P) is poor, as the distance between the data point and this plane increases, the fault index shows a gradually increasing trend. Consistent with the classification principle described earlier, this classifier has achieved an ideal effect in the classification of generator faults.
The fault mapping diagram of the line is shown in Figure 12. The coordinate axes represent POA, G(P), and Failure index (line fault index).
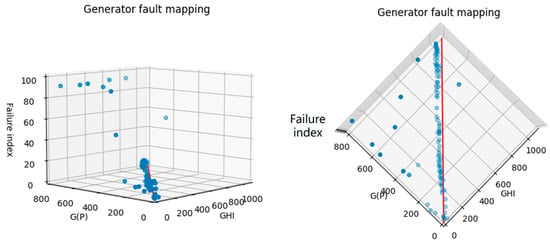
Figure 12.
Line fault mapping.
With G(P) = GHI setting this straight line as the evaluation benchmark, the failure index is always maintained at a low level in the plane where the straight line is located and a certain spatial range around it. When the difference between the POA corresponding to the data point and G(P) is small, the data point is determined to be non-abnormal, and the fault index is low, which is consistent with the classification principle described earlier. For points far from the plane where the line is located, that is, when the synergy between POA and G(P) is poor, the fault risk increases as the distance between the data point and this plane increases.
In order to make up for the lack of qualitative analysis only through the fault mapping diagram and realize the objective quantitative assessment of the performance of fuzzy classifiers, this paper introduces four types of core indexes, namely, Accuracy, Precision, Recall and F1-score, and constructs the confusion matrix, which is combined with the data of the test set to complete the quantitative computation of the performance, and at the same time, compares with the SVM-based fault identification method and the ordinary BP neural network-based fault identification method. The performance is quantitatively calculated by combining the test set data and compared with the fault recognition method based on SVM and the fault recognition method based on ordinary BP neural network.
Accuracy, which indicates the proportion of all correctly predicted samples to the total sample, is shown in Equation (13).
Precision, which indicates the proportion of samples predicted to be positive cases that are actually positive cases, is shown in Equation (14).
Recall, which indicates the proportion of samples that are actually positive cases that are successfully predicted to be positive cases, is shown in Equation (15).
The F1 score (F1-score), which is the reconciled average of precision and recall, combines the performance of both and takes a value in the range of [0, 1], the closer to 1 the better, as shown in Equation (16).
In the formula, True Positive (TP) represents the number of positive cases that were correctly categorized, while True Negative (TN) represents the number of negative cases that were correctly categorized, and False Positive (FP) and False Negative (FN) represent the number of positive and negative cases that were incorrectly categorized, respectively.
As shown in Figure 13, this paper’s method is very effective in recognizing three types of scenarios, namely, photovoltaic panel f, generator faults, and line faults, and the fault classification accuracy of the test set reaches 92.75%, which indicates that this paper’s method has a good fault classification capability. From Table 4, it can be seen that the photovoltaic grid fault recognition method based on improved GABP neural network and fuzzy system designed in this paper is significantly better than SVM, ordinary BP neural network model in all performance indicators, and can provide efficient and accurate fault detection and recognition support for photovoltaic grid.
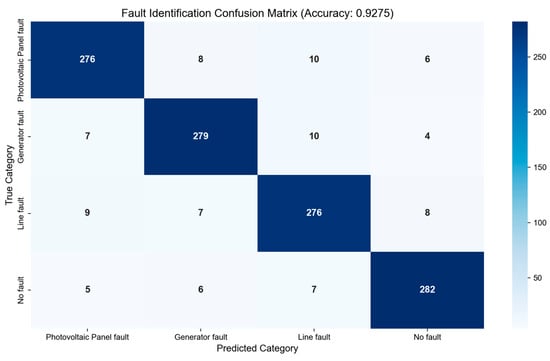
Figure 13.
Confusion matrix.

Table 4.
Comparison of performance indicators.
However, this study still has some limitations. First, the fuzzy classifier rule base is constructed based on existing datasets and expert experience, which does not cover photovoltaic failure scenarios under extreme weather such as strong sandstorms and snowstorms, and the classification accuracy may decrease under special working conditions; second, the model inputs only rely on irradiance and power data, and do not sufficiently integrate multidimensional environmental parameters such as humidity, atmospheric visibility, and the robustness to environmental disturbances needs to be improved; and third, the training tests are performed with the California Third, the training tests were conducted using the California photovoltaic dataset, which is similar to the light characteristics of the Yangtze River Delta in China, but the scenario mobility in high-latitude cold regions and large-scale photovoltaic installations needs to be further verified.
Based on the above limitations, future research can be carried out in the following aspects: (1) Expand the fuzzy rule base, optimize the rule table by combining extreme weather fault samples and historical data to improve the adaptability to special working conditions; (2) Introduce multi-dimensional environmental parameters, such as temperature, humidity, and other inputs, and construct a multivariate collaborative fault classification model to improve the accuracy of the control and the ability to resist interferences; (3) In conjunction with the Internet of Things (IoT) framework, the IoT terminal collects multiple types of dynamic data in real time, transmits them to the cloud, and uses the improved GABP neural network and fuzzy classifiers to realize anomaly detection, fault localization, and linkage to fault alarms and status monitoring; (4) Q-Learning and other reinforcement learning algorithms are used to automatically optimize the parameters and rules of the fuzzy controller, reduce artificial dependence, and verify the model migration in multiple scenarios; (5) For large-scale PV plant topology, the model parallel computing architecture is optimized to process data in different regions and deploy the model in a distributed manner to reduce latency, while expanding the dimension of fault coverage to guarantee its stable performance in PV scenarios of different scales.
7. Conclusions
In this paper, a fault identification method for photovoltaic power grids based on improved GABP neural network and fuzzy system is proposed for the problems of low efficiency of photovoltaic grid fault detection and inaccurate fault sites. Based on fuzzy control technology, potential fault nodes in the photovoltaic grid are identified using the improved GABP neural network. Meanwhile, the neural network weight matrix is optimized through the symmetric search mechanism of genetic algorithm, and a classification module consisting of three fuzzy controllers is used for photovoltaic fault identification. Simulation experimental results show that the evaluation method used in this paper improves the efficiency of photovoltaic grid fault detection and localizes and classifies the photovoltaic grid faults, which contributes to the later fixed-point maintenance of the grid, and has certain practical reference value.
Author Contributions
Conceptualization, H.S.; Methodology, X.D., H.S. and Z.H.; Validation, Z.H., Y.X. and H.W.; Writing—original draft, X.D., Y.X. and H.W.; Writing—review and editing, H.S. and Q.M.; Supervision, H.S. All authors have read and agreed to the published version of the manuscript.
Funding
This research received no external funding.
Data Availability Statement
The original contributions presented in the study are included in the article, further inquiries can be directed to the corresponding author.
Conflicts of Interest
Xiaofeng Dong was employed by State Grid Suzhou Power Supply Company. Houtao Sun was employed by State Grid Electric Power Research Institute. Zhongxiu Han, Yuanchen Xia, Hongjun Wang and Qingwen Mou were employed by NARI-TECH Nanjing Control Systems Ltd. All authors declare that the research was conducted in the absence of any commercial or financial relationships that could be construed as a potential conflict of interest.
References
- Liu, B.; Huo, X. Prediction of Photovoltaic power generation and analysis of carbon emission reduction capacity in China. Renew. Energy 2024, 222, 119967. [Google Scholar] [CrossRef]
- Cao, Y.-N.; Wang, Y.; Ding, Y.; Guo, Z.; Wu, Q.; Liang, H. Blockchain-empowered security and privacy protection technologies for smart grid. Comput. Stand. Interfaces 2023, 85, 103708. [Google Scholar] [CrossRef]
- Li, Y.; Wei, X.; Lin, J.; Niu, G. A robust fault location method for active distribution network based on self-adaptive switching function. Int. J. Electr. Power Energy Syst. 2023, 148, 109007. [Google Scholar] [CrossRef]
- Yuan, J.; Wu, T.; Hu, Y.; Jiao, Z. Faulty feeder detection based on image recognition of voltage-current waveforms in non-effectively grounded distribution networks. Int. J. Electr. Power Energy Syst. 2022, 143, 108434. [Google Scholar] [CrossRef]
- Wang, Z.; Razzaghi, R.; Paolone, M.; Rachidi, F. Time reversal applied to fault location in power networks: Pilot test results and analyses. Int. J. Electr. Power Energy Syst. 2020, 114, 105382. [Google Scholar] [CrossRef]
- Ahmadipour, M.; Hizam, H.; Othman, M.L.; Radzi, M.A.M.; Murthy, A.S. Islanding detection technique using Slantlet Transform and Ridgelet Probabilistic Neural Network in a grid-connected photovoltaic system. Appl. Energy 2018, 231, 645–659. [Google Scholar] [CrossRef]
- Hussain, A.; Mehdi, A.; Kim, C.-H. A communication-less islanding detection scheme for hybrid distributed generation systems using recurrent neural network. Int. J. Electr. Power Energy Syst. 2024, 155, 109659. [Google Scholar] [CrossRef]
- Cano, A.; Arévalo, P.; Benavides, D.; Jurado, F. Integrating discrete wavelet transform with neural networks and machine learning for fault detection in microgrids. Int. J. Electr. Power Energy Syst. 2024, 155, 109616. [Google Scholar] [CrossRef]
- Aazami, R.; Shoaei, M.; Moradkhani, A.; Shirkhani, M.; ELrashidi, A.; AboRas, K.M. Deep neural networks based method to islanding detection for multi-sources microgrid. Energy Rep. 2024, 11, 2971–2982. [Google Scholar] [CrossRef]
- Hajji, M.; Yahyaoui, Z.; Mansouri, M.; Nounou, H.; Nounou, M. Fault detection and diagnosis in grid-connected PV systems under irradiance variations. Energy Rep. 2023, 9, 4005–4017. [Google Scholar] [CrossRef]
- Mellit, A.; Kalogirou, S. Assessment of machine learning and ensemble methods for fault diagnosis of photovoltaic systems. Renew. Energy 2022, 184, 1074–1090. [Google Scholar] [CrossRef]
- Ostovar, A.; Davari, D.D.; Dziku, M. Determinants of Design with Multilayer Perceptron Neural Networks: A Comparison with Logistic Regression. Sustainability 2025, 17, 2611. [Google Scholar] [CrossRef]
- Kermani, A.; Jamshidi, A.M.; Mahdavi, Z.; Dashtaki, A.a.; Zand, M.; Nasab, M.A.; Samavat, T.; Sanjeevikumar, P.; Khan, B. Energy Management System for Smart Grid in the Presence of Energy Storage and Photovoltaic Systems. Int. J. Photoenergy 2023. [Google Scholar] [CrossRef]
- Bendary, A.F.; Abdelaziz, A.Y.; Ismail, M.M.; Mahmoud, K.; Lehtonen, M.; Darwish, M.M. Proposed and is based approach for fault tracking, detection, clearing and rearrangement for photovoltaic system. Sensors 2021, 21, 2269. [Google Scholar] [CrossRef] [PubMed]
- Abbas, M.; Zhang, D. A smart fault detection approach for PV modules using Adaptive Neuro-Fuzzy Inference framework. Energy Rep. 2021, 7, 2962–2975. [Google Scholar] [CrossRef]
- Sarikh, S.; Raoufi, M.; Bennouna, A.; Ikken, B. Characteristic curve diagnosis based on fuzzy classification for a reliable photovoltaic fault monitoring. Sustain. Energy Technol. Assess. 2021, 43, 100958. [Google Scholar]
- Liu, J.; Ke, J.; Liu, J.; Xie, X.; Tian, E. Secure event-triggered control for IT-2 fuzzy networked systems with stochastic communication protocol and FDI attacks. IEEE Trans. Fuzzy Syst. 2024, 32, 1167–1180. [Google Scholar] [CrossRef]
- Dhimish, M.; Holmes, V.; Mehrdadi, B.; Dales, M. Comparing Mamdani Sugeno fuzzy logic and RBF ANN network for PV fault detection. Renew. Energy 2018, 117, 257–274. [Google Scholar] [CrossRef]
- Chandel, S.S.; Gupta, A.; Chandel, R.; Tajjour, S. Review of deep learning techniques for power generation prediction of industrial solar photovoltaic plants. Sol. Compass 2023, 8, 100061. [Google Scholar] [CrossRef]
- Liu, J.; Wang, W.; Hu, B.; Liu, J.; Xie, X.; Tian, E. Fuzzy-boosted event-triggered tracking control of unknown nonlinear networked systems: A PSO-driven RL approach. IEEE Trans. Autom. Sci. Eng. 2025, 22, 7736–7747. [Google Scholar] [CrossRef]
Disclaimer/Publisher’s Note: The statements, opinions and data contained in all publications are solely those of the individual author(s) and contributor(s) and not of MDPI and/or the editor(s). MDPI and/or the editor(s) disclaim responsibility for any injury to people or property resulting from any ideas, methods, instructions or products referred to in the content. |
© 2025 by the authors. Licensee MDPI, Basel, Switzerland. This article is an open access article distributed under the terms and conditions of the Creative Commons Attribution (CC BY) license (https://creativecommons.org/licenses/by/4.0/).