Abstract
Subway train operators face the risk of cumulative cognitive stress due to factors such as visual fatigue from prolonged high-speed tunnel driving, irregular shift patterns, and the monotony of automated operations. This can lead to cognitive decline and human error accidents. Current monitoring of cognitive stress risk predominantly relies on single-modal methods, which are susceptible to environmental interference and offer limited accuracy. This study proposes an intelligent multimodal framework for cognitive stress monitoring by leveraging the symmetry principles in physiological and behavioral manifestations. The symmetry of photoplethysmography (PPG) waveforms and the bilateral symmetry of head movements serve as critical indicators reflecting autonomic nervous system homeostasis and cognitive load. By integrating these symmetry-based features, this study constructs a spatiotemporal dynamic feature set through fusing physiological signals such as PPG and galvanic skin response (GSR) with head and facial behavioral features. Furthermore, leveraging deep learning techniques, a hybrid PSO-CNN-GRU-Attention model is developed. Within this model, the Particle Swarm Optimization (PSO) algorithm dynamically adjusts hyperparameters, and an attention mechanism is introduced to weight multimodal features, enabling precise assessment of cognitive stress states. Experiments were conducted using a full-scale subway driving simulator, collecting data from 50 operators to validate the model’s feasibility. Results demonstrate that the complementary nature of multimodal physiological signals and behavioral features effectively overcomes the limitations of single-modal data, yielding significantly superior model performance. The PSO-CNN-GRU-Attention model achieved a predictive coefficient of determination (R2) of 0.89029 and a mean squared error (MSE) of 0.00461, outperforming the traditional BiLSTM model by approximately 22%. This research provides a high-accuracy, non-invasive solution for detecting cognitive stress in subway operators, offering a scientific basis for occupational health management and the formulation of safe driving intervention strategies.
1. Introduction
Cognitive stress refers to a psychological state of tension triggered by the brain’s information processing and evaluation in response to external stimuli. It significantly impacts emotion regulation, cognitive functions (including memory consolidation, attention allocation, and decision-making efficiency), and behavioral patterns [,,]. Moderate cognitive stress can enhance task performance through adaptive neurophysiological responses. However, prolonged exposure to excessive cognitive stress increases the risk of anxiety disorders [] and depressive symptoms [], and can lead to clinical issues such as occupational performance decline.
Symmetry plays a critical role in understanding cognitive stress manifestations. In physiological signals, the symmetry of PPG waveforms (e.g., the balance between systolic and diastolic phases) reflects autonomic nervous system homeostasis, which is disrupted under stress. Similarly, behavioral symmetry—such as bilateral symmetry in head movements and facial expressions—serves as an indicator of cognitive load. Asymmetric patterns in these features often signal stress-induced imbalances. This study leverages symmetry concepts to enhance multimodal feature fusion, aligning with the journal’s focus on symmetric principles in scientific applications.
Within the transportation sector, research on fatigue and cognitive stress detection among occupational groups has predominantly focused on automobile drivers. Significantly less attention has been paid to core personnel in rail transit, such as subway train operators []. Subway operators face unique challenges, including the visual load from high-speed tunnel environments, the monotony of automated operations, and irregular shift schedules, which collectively exacerbate mental fatigue and reduce vigilance []. The current monitoring methods for cognitive stress primarily rely on lane departure detection and image recognition techniques. Approaches indirectly predicting operator cognitive states based on vehicle operational parameters lack standardized diagnostic criteria []. Furthermore, computer-vision-based facial assessment of driver status is susceptible to interference from lighting variations and occlusion artifacts []. Traditional physiological monitoring techniques like electroencephalography (EEG) and electrocardiography (ECG) can directly quantify autonomic nervous system activity, but their invasiveness and operational complexity hinder practical application within the confined space of a subway operator’s cabin [] (Table 1).

Table 1.
Recent studies on cognitive stress detection in transportation.
Recent breakthroughs in wearable biosensing technology have opened new avenues for non-invasive cognitive stress assessment. Photoplethysmography (PPG), which can be assessed using wearable technology, demonstrates high concordance (r = 0.92–0.97) with ECG measurements for Heart Rate Variability (HRV), establishing it as a reliable proxy indicator for autonomic nervous system regulation [,,]. Additionally, Galvanic Skin Response (GSR) quantifies sympathetic activation via eccrine sweat gland activity. A significant decrease in Skin Conductance Level (SCL) is associated with fatigue-induced parasympathetic dominance (ΔSCL = 2.1 ± 0.6 μS, p < 0.01), justifying the inclusion of GSR monitoring [,]. Complementing these physiological measures, this study integrates computer-vision-based head and facial pose estimation [,,] to establish a multimodal sensing framework. This framework enables a comprehensive assessment of cognitive stress states through the synergistic complementarity of physiological and behavioral channels. To address the disparity in information dimensionality between physiological signals and facial visual features, neural networks are employed for feature-level information fusion. Figure 1 illustrates the proposed cognitive stress perception–analysis–prediction framework.
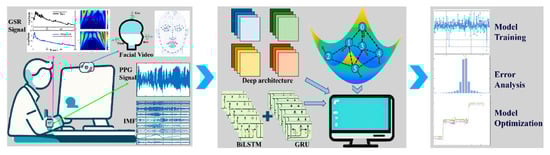
Figure 1.
Cognitive stress perception–analysis–prediction framework.
The key contributions of this work are
- (1)
- A novel multimodal framework integrating PPG, GSR, and head–facial behavioral features to overcome single-modality limitations;
- (2)
- The first application of symmetry principles (PPG waveform balance, bilateral head movement) to enhance stress-induced asymmetry detection;
- (3)
- Development of a hybrid PSO-CNN-GRU-Attention model with dynamic hyperparameter optimization and attention-based feature weighting, achieving a 22% higher R2 (0.890) than BiLSTM baselines;
- (4)
- Validation via a crossover experiment with 50 subway operators under simulated high/low-stress conditions;
- (5)
- Implementation of real-time safety interventions (e.g., PERCLOS-based auto-braking).
The remainder of this paper is organized as follows. Section 2 details the experimental design, data-acquisition platform, and preprocessing pipelines for physiological (PPG, GSR) and video-based behavioral signals. Section 3 presents the feature-level fusion strategy and the hybrid PSO-CNN-GRU-Attention architecture, including hyperparameter optimization and the attention mechanism. Section 4 reports the statistical evaluation, ablation studies, and comparative results against baseline models. Section 5 summarizes the principal findings, discusses limitations, and outlines future research directions.
2. Materials and Methods
2.1. Data Collection and Crossover Experiment
- (a)
- Data Collection
The cognitive stress monitoring experiment for subway train operators was conducted using a full-scale subway simulator established at the Caidaling Training Base of Dalian Traffic Group, which complies with the IEC 62278 standard []. The experimental setup is depicted in Figure 2. The brightness range (50–200 lux) and noise spectrum (white noise, 55 dB) of the simulator are simplified compared to a real tunnel (brightness peaks >400 lux when trains pass; low-frequency rumbling <40 Hz).
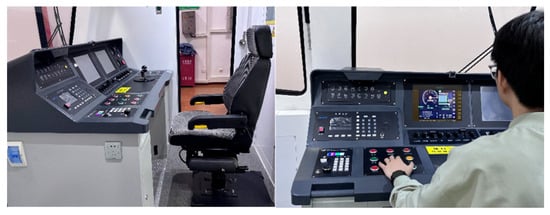
Figure 2.
Experimental setup.
The framework of the data monitoring system is illustrated in Figure 3. This framework integrates a modular multi-channel physiological signal acquisition array. This system enables synchronized acquisition of physiological parameters, including PPG signals (sampling rate: 1000 Hz, dual wavelengths: 515 nm/940 nm) and GSR signals (resolution: 0.01 μS), with the synchronization error controlled within ±0.5 ms. Additionally, a camera (resolution: 1920 × 1080, 30 fps, dynamic range: 60 dB) was mounted to track head and facial pose changes in real time.
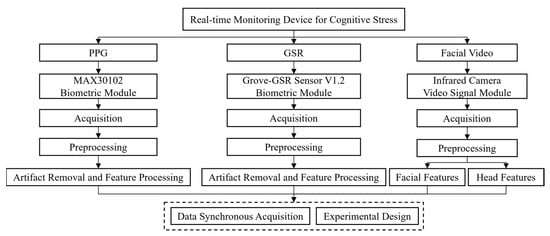
Figure 3.
Framework of the monitoring system.
The biosignal acquisition system utilized the Grove-GSR Sensor V1.2 (for skin conductance) and MAX30102 module (for PPG signals), positioned on the participants’ wrists. Raw signal preprocessing was performed using the MATLAB 2023b platform. For head and facial dynamic feature acquisition, an infrared camera recorded video streams. Facial feature parameters were extracted in real time using a 68-point facial landmark model, implemented within a Python 3.6 environment integrating the OpenCV and Dlib 19.7 libraries.
The minimum sample size was determined using G*Power software (version 3.1.9.7; α = 0.05, β = 0.2, effect size = 0.4), resulting in a requirement of 24 participants. Ultimately, 50 active male subway train operators were recruited. Seventy-five percent (75%) possessed over three years of driving experience, while twenty-five percent (25%) were newly qualified train operators with no prior driving experience. The mean participant age was 30.5 ± 1.16 years. Due to the current gender distribution within the local subway-operator workforce (male representation ≈ 95% [,]), only male participants were available during the study period; no eligible female drivers could be scheduled. Future work will actively recruit a gender-balanced cohort across multiple depots to enhance external validity.
- (b) Crossover Experiment
A crossover experimental design was employed, where each participant underwent two experimental sessions (low cognitive stress/high cognitive stress), separated by an interval of at least 48 h. Cognitive stress states were induced by contrasting physiological and behavioral responses under different task demands.
- Low Cognitive Load Condition: Participants were required to have sufficient sleep (≥8 h) prior to the experiment and abstain from caffeine/alcohol for 12 h. They performed a 30 min adaptive driving session to establish an operational baseline.
- High Cognitive Load Condition: Participants were subjected to a triple intervention protocol: (1) Sleep restriction: Only 4 h of sleep were permitted the night before the experiment. (2) Extended driving: A 4 h uninterrupted driving task incorporating features of real operational timetables (e.g., peak/off-peak period transitions). (3) Cognitive task load: The visual simulation system created a complex environment using dynamic brightness adjustments (50–200 lux), periodic tunnel light flickering (2–4 Hz), and randomly appearing virtual obstacles every 20 min. Furthermore, multi-tasking cognitive challenges were interspersed, such as requiring operators to perform simple arithmetic calculations or memory tasks concurrently during driving to increase cognitive load.
An interval of ≥48 h was maintained between the two experimental sessions for each participant to mitigate carryover effects. Cognitive load state was determined by integrating subjective reports, behavioral performance, and physiological indicators. All participants were healthy, with no history of cardiovascular or neurological disorders. The data collection workflow is detailed in Table 2.
Table 2.
Data collection workflow.
A real-time physiological monitoring system was deployed to alert for abnormal heart rates (>120 bpm or <50 bpm). Automatic emergency braking intervention was triggered if the driver’s eye closure ratio exceeded a 30% threshold continuously for 5 s. A dedicated clinical psychologist provided psychological monitoring throughout the experiments to ensure participant well-being.
Regarding ethical compliance, the study protocol was approved by the Ethics Committee of the School of Traffic and Transportation Engineering, Dalian Jiaotong University. All participants provided written informed consent, which included clauses for data anonymization. Multimodal data was encrypted and stored throughout the experiment, adhering strictly to the General Data Protection Regulation (GDPR). A pre-trial phase yielded a participant tolerance score of 8.4/10, validating the safety of the protocol from a human factors perspective.
2.2. Characteristics Based on Biological Signals
2.2.1. Feature Extraction of PPG Signals
The dynamical components of the experimentally obtained PPG signal are complex, and the waveform contains information related to blood pressure, heart rate, respiration, neuromodulation information, and noise [,,], while it is susceptible to signal distortion loss caused by optical, electrical, or motion artifacts, baseline drift, and other interferences [,,]. Therefore, in this paper, the experimentally acquired PPG signals were preprocessed: cubic spline interpolation was used to fill in the missing points; a fourth-order Butterworth bandpass filter (0.5–8 Hz) was applied to suppress the myoelectric disturbances and baseline drift; an adaptive noise cancellation algorithm (threshold 0.1 g) was applied to remove motion artifacts based on the synchronized accelerometer data (100 Hz); the first three orders of eigenstates were extracted using empirical modal decomposition modal function (IMF) reconstruction; and the baseline drift was subtracted. The processing flow and effect are shown in Figure 4, and the baseline drift correction is verified by IMF decomposition (Figure 5).
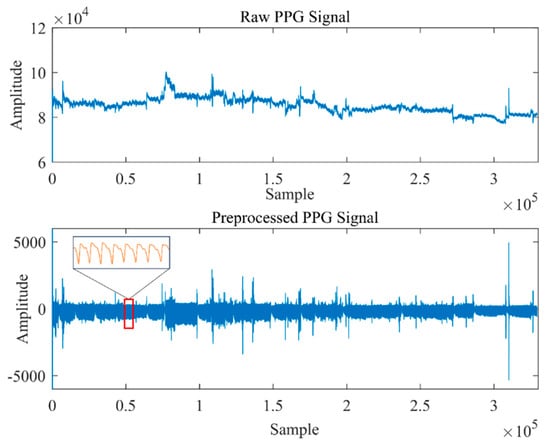
Figure 4.
PPG signal processing.
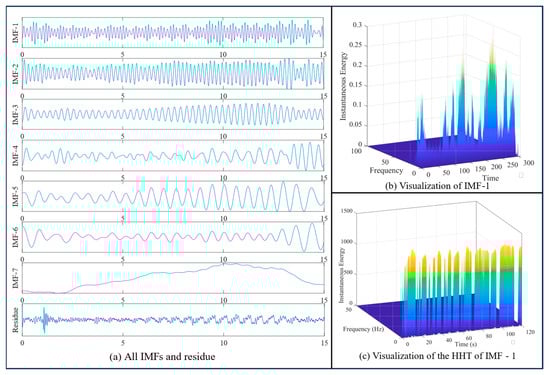
Figure 5.
IMF extraction.
Changes in cognitive stress disrupt autonomic nervous system (ANS) balance, leading to enhanced sympathetic activity and attenuated parasympathetic activity under increased stress. Heart Rate Variability (HRV), a crucial indicator of beat-to-beat variations (a time-series feature), precisely captures heartbeat changes by analyzing differences in successive R-R intervals [,]. HRV fluctuations contain cardiovascular regulatory information and serve as a key metric for assessing autonomic balance []. Analysis of the pulse wave within PPG signals allows for indirect blood pressure estimation []. The manifestation of an ANS imbalance induced by cognitive stress within HRV metrics provides the theoretical foundation for using HRV to monitor cognitive stress [,,,]. The HRV feature parameters extracted in this study are depicted in Figure 6. Pulse wave cycles were determined by detecting the systolic peaks (corresponding to the heart’s contraction phase) in the PPG waveform, enabling the calculation of HRV time-domain features.
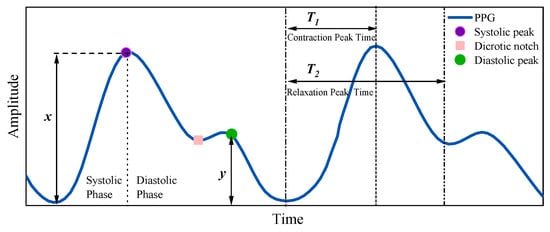
Figure 6.
PPG signal and HRV feature parameter extraction diagram.
2.2.2. Feature Extraction of GSR Signals
Feature extraction of the GSR signal employed a multi-stage fusion strategy. First, Z-score normalization was applied to standardize the raw signals during preprocessing, effectively eliminating inter-individual baseline differences. Subsequently, a sliding window mechanism (window length: 3 s, overlap rate: 50%) segmented the signals at a 256 Hz sampling rate into temporal segments of 768 samples per window. This preserved temporal continuity while enhancing local data characteristics. Morlet wavelets outperform the alternatives (e.g., Daubechies) in temporal resolution for transient GSR events [], which is critical for capturing the phasic stress response. The scale parameter for the complex Morlet wavelet was mapped to frequency via , where (center frequency) and . Scaling covered 0.5–30 Hz, encompassing sympathetic arousal bands (0.05–0.15 Hz) and electrodermal response frequencies (1–3 Hz). This generates a 270 × 768 time-frequency matrix. The matrix is quantized into an 8-bit grayscale image (value range: 0–255), forming a structured input dataset that integrates spatiotemporal features (the evolution of this time-frequency representation process is illustrated in Figure 7a,b).
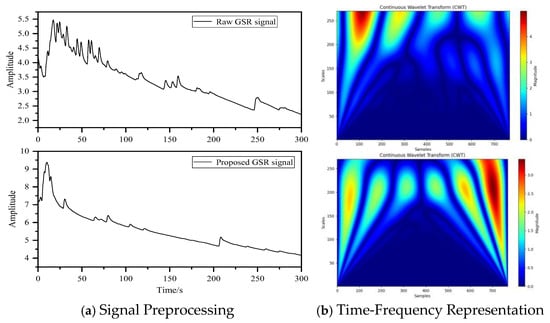
Figure 7.
GSR signal.
Through time-frequency-spatial-domain feature fusion, this study constructed a GSR time-frequency feature dataset comprising 3600 samples (balanced high/low-load samples) to provide input for subsequent convolutional neural network training.
2.3. Characteristics Based on Image Information
Excessive cognitive stress often manifests as psychological states like distractibility, worry, agitation, and anger [], which are reflected in facial expressions showing inner tension and anxiety []. This study employed the Ensemble of Regression Trees (ERT) algorithm from the Dlib library to preprocess video data captured by the infrared camera. The ERT algorithm possesses the capability to handle missing or uncertain labels in training data, maintains shape invariance during feature selection, and concurrently optimizes the loss function to achieve minimization objectives.
Facial pose estimation was performed by projecting 3D world coordinate points, constructing a 12-axis spatial cube, and indexing facial landmarks for the left and right eyes. This process yielded facial features, calculated the Euclidean distance for eye and mouth regions, and iteratively detected facial position information. Sixty-eight (68) key facial landmarks were plotted and ordered to obtain facial landmark coordinates, head angles (Euler angles), and facial activity states. Subsequently, Eye Aspect Ratio (EAR) and Mouth Aspect Ratio (MAR) data were derived (Figure 8).
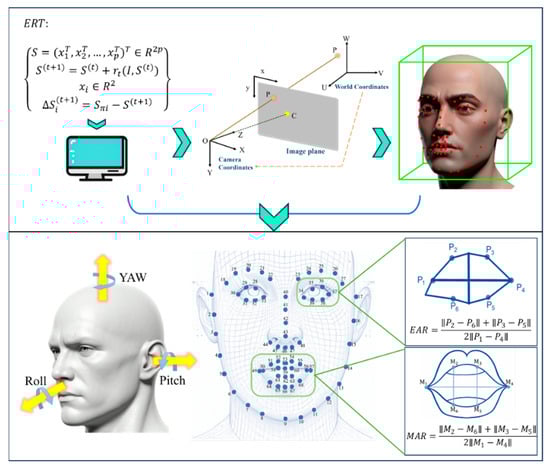
Figure 8.
Extraction effects of head pose and facial features.
The head posture estimation technique is used to quantify the behavioral responses of the head under different cognitive stress states, and head motion is accurately described by Euler angles in three-dimensional space, including pitch (rotation around the X-axis), yaw (rotation around the Y-axis), and roll (rotation around the Z-axis). By evaluating the symmetry of bilateral head movements (e.g., the balance of left–right yaw), asymmetries induced by cognitive stress can be detected.
Under cognitive stress, individuals often exhibit specific patterns of facial behavior (e.g., eye blinking/gazing, lips tightly closed, corners of the mouth pulled down). To quantify eye dynamics, the present study localized 6 key points for each of the left and right eyes and calculated EAR values (Figure 6). An effective blink was determined if the EAR value was below 0.25 for three consecutive frames []. To quantify the mouth dynamics, 20 mouth feature points were selected to calculate MAR values. Yawn detection was triggered when the MAR value exceeded 0.5 and lasted for 3 frames. EAR and MAR were determined by geometric features with temporal continuity, effectively overcoming transient interference, and together constitute the core visual features for cognitive stress determination.
The above methods constitute an objective basis and sensitive indicators for assessing changes in head and face posture and physiological indicators under individual stress states. The extracted PPG, GSR, and head and face behavioral features in this paper are summarized in Table 3.
Table 3.
Summary of extracted features.
3. Model Construction
The image information captured in the experiment is susceptible to the influence of objective factors such as light and protective equipment occlusion, which can reduce the accuracy of facial feature monitoring. Therefore, in order to improve the accuracy and reliability of monitoring, it is necessary to fuse multimodal biosignals and behavioral features, which show specific changes in the early stage of stress; the information fusion architecture can realize accurate tracking of cognitive status and warn when abnormal status occurs. Information fusion is a comprehensive process of preprocessing, data registration, prediction estimation, and arbitration decision making using information from similar or heterogeneous sources to obtain more accurate, stable, and reliable target information than from a single source. Information fusion takes place at three levels: data layer fusion, feature layer fusion, and decision layer fusion. In this paper, feature layer fusion is used.
3.1. Feature-Level Fusion
Feature-level fusion refers to the preprocessing and feature extraction of raw data from each information source and then fusing the features of each source to further obtain prediction and estimation of target information. Commonly used feature-level fusion algorithms include neural networks, multiple kernel learning (MKL), and typical correlation analysis (CA). Neural networks integrate multi-source features through nonlinear mapping. Typical methods include (1) multimodal networks: dual-stream architecture sharing fully connected layers to achieve cross-modal interactions; (2) DBN: multi-layer RBM with layer-by-layer abstraction and top-layer fusion of spatiotemporal features; (3) VAE: encoder–decoder architecture to learn the joint distributions; and (4) attention mechanism: self-attention dynamic weighting, back-propagation to optimize weights and improve feature recognition accuracy.
Studies have shown that multimodal data, such as facial features and physiological electrical signals, can be used to achieve hierarchical characterization of cognitive stress through differentiated perceptual dimensions and response thresholds. Among them, facial features and physiological signals are complementary heterogeneous data sources, with the former reflecting stressful behaviors and the latter revealing physiological mechanisms. Based on the information fusion theory, this paper realizes the effective fusion of the two types of features through the cross-modal feature cascade (concatenation), which provides support for the accurate recognition of cognitive stress state.
Driver head and facial information and physiological information are acquired using a camera and PPG and GSR signal sensors, respectively. Both facial and physiological information are available to quantitatively assess the cognitive stress state. However, they have different data lengths and structures. Therefore, in this paper, the PPG and GSR signal features are spliced and fused with the human head and face spatial information to form a comprehensive feature vector, which is input into the subsequent deep learning model. The fusion framework is shown in Figure 9.
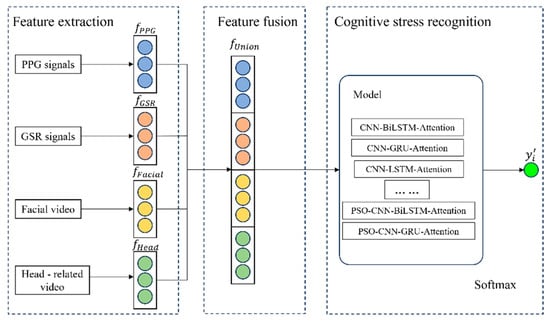
Figure 9.
Feature fusion.
3.2. Model Development Based on Neural Networks and Attention Mechanism
Considering the time-series nature of the dataset, this study leverages the advantages of the Gated Recurrent Unit (GRU) and Bidirectional Long Short-Term Memory (BiLSTM) models. Particle Swarm Optimization (PSO) is introduced to optimize training, while an attention mechanism dynamically adjusts focus on different input segments. Combined with Convolutional Neural Networks (CNNs), a hybrid model is constructed for data training.
3.2.1. PSO-CNN-BiLSTM-Attention
Hyperparameter optimization is critical for maximizing model performance but remains challenging due to high-dimensional, non-convex search spaces. Traditional grid/random search methods are computationally expensive and often suboptimal [,]. The PSO algorithm offers efficient global optimization by simulating social behavior, dynamically balancing exploration and exploitation through swarm intelligence. Its integration with deep learning architectures (e.g., CNN-GRU) mitigates local minima traps and adaptively refines model capacity to complex spatiotemporal patterns in multimodal stress data [,]. This approach is particularly advantageous for high-stakes applications like operator safety, where model robustness is paramount. Its core iterative equations are formulated as
where and represent velocity and position of the particle in the dimension; denotes individual historical optimal position; represents global optimal position; and denotes inertia weight following a linear decay strategy to balance exploration–exploitation trade-offs. PSO optimizes hyperparameters before model training (Figure 10).
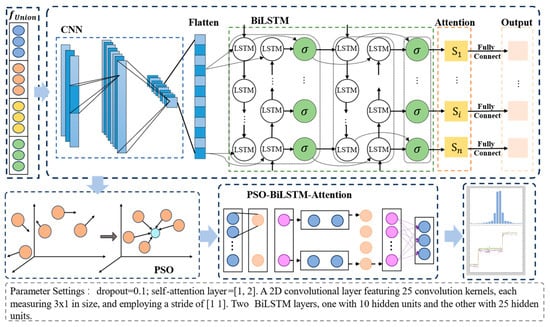
Figure 10.
PSO-CNN-BiLSTM-Attention workflow: PSO (outer loop) selects hyperparameters → CNN-BiLSTM-Attention (inner loop) trains with fixed architecture → Validation loss feeds back to PSO.
The proposed PSO-CNN-BiLSTM-Attention hybrid model integrates four hierarchical modules for synergistic feature extraction, temporal modeling, and hyperparameter optimization:
- (1)
- Spatial-Spectral Feature Extraction: CNN layers capture local spatial patterns in temporal sequences.
- (2)
- Bidirectional Temporal Modeling: BiLSTM networks encode forward/backward contextual dependencies.
- (3)
- Attentional Feature Recalibration: A single-head self-attention mechanism applies scaled dot-product attention:
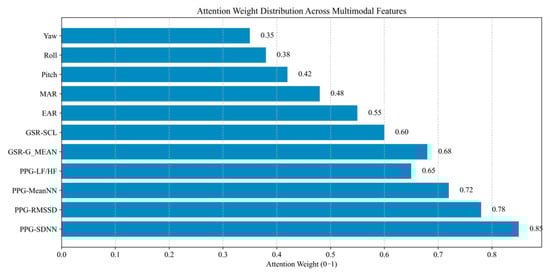
Figure 11.
Attention weight distribution. The PPG-SDNN feature receives the highest weight (0.85), indicating its importance in the model. This is followed by PPG-RMSSD (0.78) and PPG-MeanNN (0.72). Features with lower weights include yaw (0.35) and roll (0.38), suggesting less of a contribution to the model.
- (4)
- Hyperparameter Co-Optimization: A PSO optimizer dynamically tunes CNN filter counts, BiLSTM hidden units, and other critical parameters to enhance adaptive focus on salient temporal patterns.
3.2.2. PSO-CNN-GRU-Attention
In this paper, by building a CNN-GRU-Attention neural network based on the PSO algorithm to dynamically adjust the size of CNN convolutional kernel and the dimension of GRU hidden layer (see Figure 12 for the construction process), the local spatial feature extraction capability of the convolutional neural network and the global timing modeling capability of the gated recurrent unit are fused through the feature splicing layer, and the GRU unit achieves long-range timing dependency capture through the following mechanism to realize long-range timing dependency capture:
where is the update gate controlling the proportion of retained information and is the reset gate regulating the integration of historical states. The PSO algorithm dynamically searches for the optimal hidden layer dimension by minimizing the validation set loss function. Its fitness function is defined as
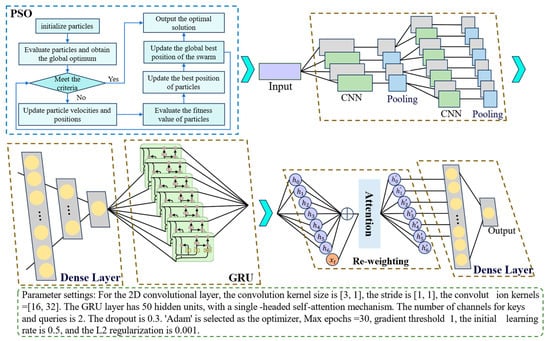
Figure 12.
PSO-CNN-GRU-Attention model.
Through the synergistic effect of CNN multi-scale convolutional kernels (1 × 4, 1 × 8) and GRU multi-level temporal memory, the CNN branch generates a feature map and the GRU branch outputs hidden states . The concatenated features thus enable multi-scale joint learning from local spatial patterns to global temporal dynamics [].
The self-attention mechanism performs feature extraction using a single-head structure. Given the hidden state sequence output from the GRU layer (where is the timestep length and = 50 is the hidden layer dimension), the query matrix , key matrix , and value matrix are first generated via linear transformations. Here, and are learnable parameter matrices. The scaled dot-product attention scores are subsequently computed as
where = 2 is the key vector dimension (specified by the parameters) and the scaling factor mitigates gradient vanishing issues. This mechanism dynamically assigns weights to capture features at critical timesteps, ultimately generating a weighted context vector as the global feature representation. In the experiments, a single-head attention structure (head_num = 1) was employed to reduce computational complexity while preserving the model’s capacity to capture long-distance dependencies within multivariate time series.
Table 4 summarizes the PSO-determined hyperparameters together with their initial search ranges and the corresponding validation loss at convergence. The optimal 1 × 4 and 1 × 8 convolution kernels (32 and 64 filters, respectively) were selected because they minimized spectral leakage in the 0.5–8 Hz PPG band while preserving high-frequency GSR transients. The GRU hidden dimension of 50 balanced model capacity against over-fitting (validation loss plateau at 0.00461) and satisfied the embedded-device memory limit (<2 MB). A post hoc sensitivity analysis (±10% perturbation of each parameter) confirmed that any deviation beyond these values increased MSE by >8%, corroborating the rationality of the PSO solution.
Table 4.
PSO-optimized hyperparameters and search bounds.
4. Discussion
4.1. Evaluation Criteria
The evaluation criteria for the models in this study include the Mean Absolute Error (MAE), Mean Squared Error (MSE), Root Mean Square Error (RMSE), Residual Prediction Deviation (RPD), Mean Absolute Percentage Error (MAPE), and the coefficient of determination (R2). The specific mathematical formulations are presented in Table 5, where represents the true value, denotes the model’s predicted value, is the mean of the actual observations, is the standard deviation of the predicted values, and is the standard deviation of the actual values.
Table 5.
Model evaluation criteria.
4.2. Robustness of the Model
This study employed deep learning models, including BiLSTM, GRU, and CNN-BiLSTM-Attention, alongside traditional models, such as MPA-SVM and WOA-RF, for regression prediction on the feature dataset. The dataset was randomly partitioned into training and test sets at a ratio of 7:3. Regression analysis was performed to investigate the relationship between features and the target variable. Based on the model regression distribution plots shown in Figure 13, all models exhibit closely clustered data distributions on both the training and test sets. The regression lines closely approximate the identity line (Y = T), indicating excellent model fit and an effective ability to capture the relationship between features and the target.
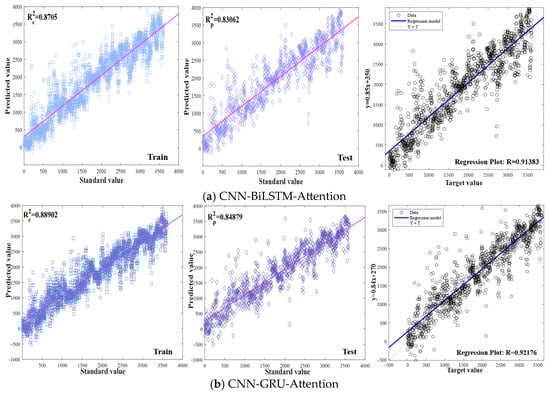
Figure 13.
Model regression distribution plots.
To identify key features and validate model robustness, a feature ablation study was designed, comparing model performance under three conditions: multimodal feature fusion, facial features only, and physiological signal features only.
The performance evaluation results under multimodal feature fusion (Table 6) demonstrate that the PSO-CNN-GRU-Attention model achieved the best performance (R2 = 0.89029, MSE = 0.00461), followed by PSO-CNN-BiLSTM-Attention (R2 = 0.88963). Models incorporating attention mechanisms (e.g., CNN-GRU-Attention, R2 = 0.83615) generally outperformed their base counterparts. The Bayes-CNN model (R2 = 0.87105) exhibited strong performance, surpassing most deep learning models. Among the base-gated recurrent models, BiLSTM (R2 = 0.72908) showed reasonable performance. These results indicate that the combination of PSO optimization and attention mechanisms significantly enhances the predictive capability of the model.
Table 6.
Model index evaluation table for fused features.
When utilizing facial features only (Table 7), the performance of most models significantly declined, except for the Bayes-CNN model (R2 = 0.92702). The superior performance of Bayes-CNN under this condition may reflect its ability to fit specific facial feature patterns, although its generalization capability requires further validation. Overall, the experimental results support the assertion that multimodal fusion captures cognitive stress information more comprehensively.
Table 7.
Model metric evaluation table with facial features only.
When utilizing physiological signal features only (Table 8), the predictive performance of all models substantially decreased (the highest R2 was only 0.66881, achieved by CNN-GRU-Attention). This further highlights the limitations of relying solely on physiological signal features and underscores the necessity of multimodal data fusion for accurately assessing cognitive stress.
Table 8.
Evaluation table of model metrics based on physiological signal characteristics.
To assess the independent and incremental predictive ability of each physiological signal, we performed intra-modal ablation analysis using the PSO-CNN-GRU-Attention model (Table 9). When using only PPG, R2 was 0.5388 (MSE = 0.0223), confirming its feasibility as an independent predictor of cognitive stress. When using only GSR, R2 was 0.5124 (MSE = 0.0279), indicating a slightly lower but still substantial predictive capability. When GSR and PPG are combined, predictive performance improves from R2 = 0.5388 to R2 = 0.6579 (ΔR2 = +0.0881, p < 0.01, paired t-test), indicating that GSR provides supplementary autonomic nervous system information that HRV metrics cannot fully capture. Finally, incorporating facial features further increased R2 to 0.8903, confirming the necessity of multimodal fusion.
Table 9.
Intra-modality ablation results.
As illustrated in Figure 14, at the physiological signal feature level, the density distributions of MeanNN and SDNN reveal significant variations in Heart Rate Variability (HRV) indicators across different cognitive stress states, effectively mapping autonomic nervous system regulation. The density distribution of RMSSD further confirms its ability to capture dynamic characteristics of cognitive stress over short time scales. The distribution of the LF/HF ratio clearly depicts the balance between sympathetic and parasympathetic nervous activity, providing crucial physiological information for cognitive stress assessment. At the behavioral feature level, the density distributions of Eye Aspect Ratio (EAR) and Mouth Aspect Ratio (MAR) reveal significant changes in the eye and mouth movements of subway drivers under cognitive stress, constituting key indicators for cognitive load assessment. The density distributions of head pose features (pitch, roll, and yaw) indicate discernible differences in head movement patterns across varying stress states, with symmetry loss under high cognitive load providing behavioral evidence for stress monitoring. In summary, the density distribution characteristics of the aforementioned physiological and behavioral features establish a multidimensional objective basis for the precise quantitative assessment of cognitive stress, simultaneously highlighting the necessity and advantage of multimodal feature fusion in cognitive stress monitoring.
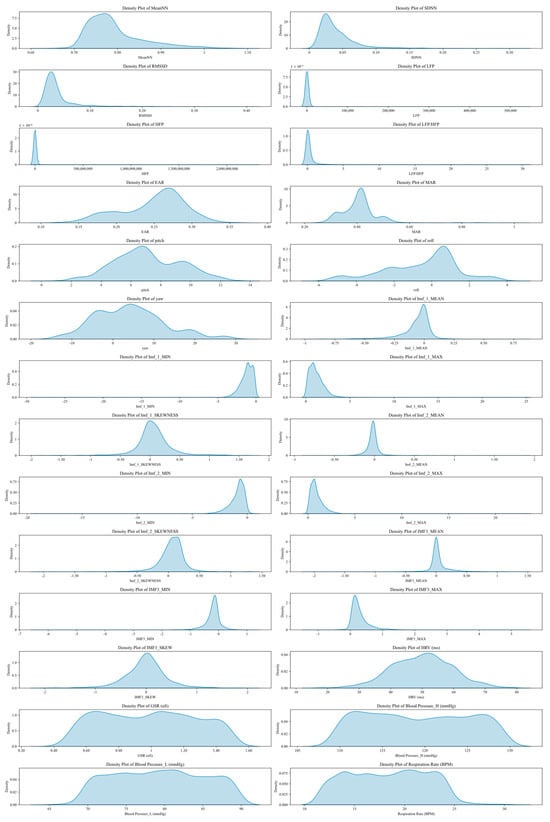
Figure 14.
Numerical distribution density plot.
Figure 15 demonstrates that distributional differences in head and facial features (EAR, MAR, pitch, roll, yaw) under varying cognitive stress states provide behavioral evidence for model robustness analysis. Under high stress, EAR values decreased significantly with a more concentrated distribution, indicating increased eyelid closure and reduced blink frequency, reflecting attentional distraction and fatigue. MAR concentration increased with a slight upward trend, suggesting greater lip aperture, potentially signifying accumulated tension. Pitch movement amplitude and frequency substantially increased, alongside an expanded distribution range and reduced concentration, indicating more frequent and vigorous head movements, likely stemming from attentional distraction and emotional fluctuations. Roll dispersion increased with an upward trend, denoting greater head tilt angles, indicative of fatigue and reduced attentional focus. The yaw distribution range broadened with heightened concentration, reflecting increased amplitude and frequency of lateral head rotation, possibly due to environmental hyper-reactivity or frequent attentional shifts.
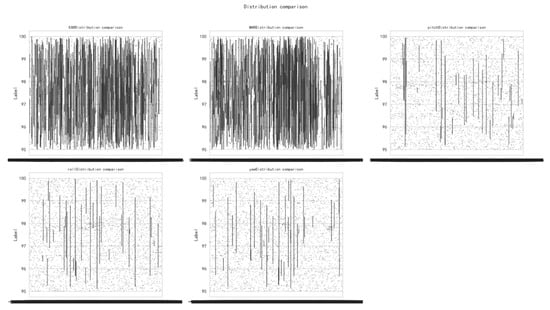
Figure 15.
Distribution of head and facial features.
Based on the feature distribution characteristics shown in Figure 14 and Figure 15, the multimodal feature fusion model effectively leverages the behavioral feature distributions, thereby enhancing the recognition and prediction capabilities for cognitive stress states. Combined with the analysis presented in Table 6, Table 7 and Table 8, this further validates the necessity and superiority of multimodal feature fusion in cognitive stress monitoring.
Figure 16 compares the prediction error distributions across different models via error histograms. The error distributions of the base models (BiLSTM, GRU, LSTM—Figure 16a–c) were relatively dispersed. Following the introduction of the attention mechanism (Figure 16d–f), the error distributions became notably more concentrated, with higher peaks near zero error. Models optimized with PSO (PSO-CNN-GRU-Attention and PSO-CNN-BiLSTM-Attention are not individually plotted in the histograms but Table 7 indicates their minimal errors) are expected to exhibit the most optimal error concentration. Combining with the superior performance of PSO-CNN-GRU-Attention (R2 = 0.89029, Table 7) and the robust performance of Bayes-CNN (Table 7, Table 8 and Table 9), Figure 15 visually validates the effectiveness of model optimization in enhancing prediction accuracy and stability.
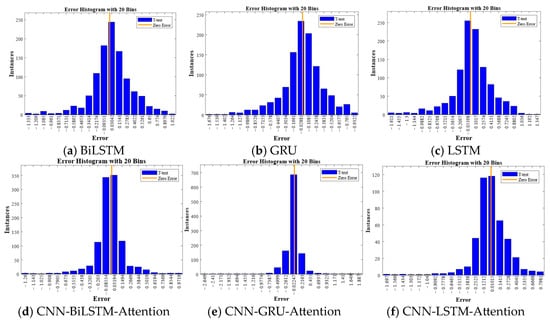
Figure 16.
Error histogram.
5. Conclusions
This study established an intelligent non-invasive monitoring framework for cognitive stress in subway train operators, integrating multimodal electrophysiological signals (PPG/GSR) and head–facial behavioral features. Leveraging a full-scale subway simulator (IEC 62278-compliant) and a crossover experiment design with 50 operators, we developed a hybrid PSO-CNN-GRU-Attention model.
The integration of multimodal electrophysiological signals (PPG-HRV, GSR-SCL) and behavioral features (3D head movement trajectory, EAR, MAR) effectively addressed the limitations of single-modality data through their complementary nature, resulting in a 22% improvement in model performance (coefficient of determination, R2 increase). Symmetry-based features, such as PPG waveform balance and bilateral head movement coordination, further enhanced the model’s sensitivity to stress-induced physiological and behavioral asymmetries. By employing PSO to adaptively adjust CNN kernel sizes and GRU hidden layer dimensions, combined with an attention mechanism for feature weighting, the proposed PSO-CNN-GRU-Attention model achieved state-of-the-art performance (R2 = 0.89029, MSE = 0.00461), demonstrating a 22% improvement over traditional BiLSTM models. Additionally, the framework incorporated warning capabilities (heart rate thresholds of >120 bpm or <50 bpm or PERCLOS >30% for 5 s triggering automatic braking), providing a high-precision solution for occupational health management in subway operations.
This study has the following limitations. Owing to the gender distribution within the industry (over 95% male), female participants were not included. With respect to environmental fidelity, although the simulator adheres to the IEC 62278 standard, its luminance range and noise spectrum are simplified in comparison to real tunnels. Regarding wearable sensor artifacts, motion noise in PPG/GSR during high-vibration scenarios is alleviated but not entirely eradicated. In terms of physiological confounding factors, individual differences in stress responses (e.g., caffeine sensitivity, circadian rhythms) are controlled yet not fully characterized. Furthermore, computational latency remains a challenge, as real-time deployment necessitates optimization for embedded systems. Moreover, the PSO-CNN-GRU-Attention model currently requires 18 ms per 1 s window on an NVIDIA RTX-4090 GPU, exceeding the real-time budget (<10 ms) mandated by on-board embedded computers; therefore, model quantization and pruning are necessary before in-cab installation.
Future research will pursue four directions: (i) recruiting a balanced-gender sample across multiple cultural contexts to extend external validity; (ii) validating the system in revenue-service trains equipped with high-fidelity environmental replication; (iii) implementing TinyML optimization (INT8 quantization, knowledge distillation) to deploy the model on edge devices with ARM Cortex-M7 or RISC-V cores; and (iv) integrating additional modalities such as eye-tracking glasses and unobtrusive ear-PPG to further enhance robustness against occlusions and lighting variations.
Author Contributions
Methodology, X.Y.; Software, X.Y.; Validation, X.Y.; Investigation, X.Y.; Resources, L.Y.; Writing—original draft, X.Y.; Writing—review & editing, X.Y. and L.Y.; Supervision, L.Y.; Funding acquisition, L.Y. All authors have read and agreed to the published version of the manuscript.
Funding
This research was funded by the Basic scientific research project of Liaoning Provincial Department of Education (Grant No. LJKQZ20222462).
Institutional Review Board Statement
The study was conducted in accordance with the Declaration of Helsinki and approved by the Ethics Committee of the School of Transportation Engineering, Dalian Jiaotong University, on 16 October 2024. Dalian Jiaotong University does not issue ethics approval codes, ethical approval documents (Chinese and English versions) serve as the official confirmation of review committee endorsement.
Informed Consent Statement
Written informed consent from the participant(s)/patient(s) was obtained for the publication of this study and any accompanying data and images.
Data Availability Statement
The datasets generated during and analyzed during the current study are available from the corresponding author upon reasonable request.
Acknowledgments
The authors would like to extend their heartfelt appreciation to the Basic Scientific Research Project of Liaoning Provincial Department of Education for the generous financial support provided.
Conflicts of Interest
The authors declare no conflicts of interest.
References
- Li, K.; Xu, X.; Zhang, Y.; Xu, X. The influence of environmental factors on the job burnout of physical education teachers in tertiary education. Sci. Rep. 2024, 14, 9126. [Google Scholar] [CrossRef]
- Pan, Y.X.; Wang, L. The Development of a Job Stress Questionnaire for Chinese Employees. Psychol. Sci. 2006, 29, 312–314. [Google Scholar]
- Wu, F.Y.; Ren, Z.; Wang, Q.; He, M.F.; Xiong, W.J.; Ma, G.D.; Fan, X.; Guo, X.; Liu, H.; Zhang, X.M. The relationship between job stress and job burnout: The mediating effects of perceived social support and job satisfaction. Psychol. Health Med. 2021, 26, 204–211. [Google Scholar] [CrossRef]
- Greenier, V.; Derakhshan, A.; Fathi, J. Emotion regulation and psychological well-being in teacher work engagement: A case of British and Iranian English language teachers. System 2021, 97, 102446. [Google Scholar] [CrossRef]
- Bement, M.H.; Weyer, A.; Keller, M.; Harkins, A.L.; Hunter, S.K. Anxiety and stress can predict pain perception following a cognitive stress. Physiol. Behav. 2010, 101, 87–92. [Google Scholar] [CrossRef]
- Sandi, C. Stress and cognition. WIREs Cogn. Sci. 2013, 4, 245–261. [Google Scholar] [CrossRef] [PubMed]
- Tian, M.; Li, X.; Ma, J.; Zhang, T.; Wang, P.; Yuan, X.; Wang, X. Who merits more concern: University teachers under task-related or those under interpersonal-related stress? Humanit. Soc. Sci. Commun. 2024, 11, 1564. [Google Scholar] [CrossRef]
- Balasundaram, A.; Ashokkumar, S.; Kothandaraman, D.; kora, S.; Sudarshan, E.; Harshaverdhan, A. Computer vision based fatigue detection using facial parameters. In IOP Conference Series: Materials Science and Engineering; IOP Publishing: Bristol, UK, 2020; Volume 981, No. 2. [Google Scholar] [CrossRef]
- Lv, C.; Nian, J.; Xu, Y.; Song, B. Compact vehicle driver fatigue recognition technology based on EEG signal. IEEE Trans. Intell. Transp. Syst. 2021, 23, 19753–19759. [Google Scholar] [CrossRef]
- Almarshad, M.A.; Islam, M.S.; Al-Ahmadi, S.; BaHammam, A.S. Diagnostic Features and Potential Applications of PPG Signal in Healthcare: A Systematic Review. Healthcare 2022, 10, 547. [Google Scholar] [CrossRef]
- Hibrian, H.; Baihaqi, M.; Ihsan, H. Relationship between academic stress and cyberloafing behavior among Psychology Department Students at Universitas Pendidikan Indonesia. PSIKOPEDAGOGIA J. Bimbing. Konseling 2022, 10, 89–93. [Google Scholar] [CrossRef]
- Nweke, G.E.; Jarrar, Y.; Horoub, I. Academic stress and cyberloafing among university students: The mediating role of fatigue and self-control. Humanit. Soc. Sci. Commun. 2024, 11, 419. [Google Scholar] [CrossRef]
- Yang, X.; McCoy, E.; Anaya-Boig, E.; Avila-Palencia, I.; Brand, C.; Carrasco-Turigas, G.; Dons, E.; Gerike, R.; Goetschi, T.; Nieuwenhuijsen, M.; et al. The effects of traveling in different transport modes on galvanic skin response (GSR) as a measure of stress: An observational study. Environ. Int. 2021, 156, 106764. [Google Scholar] [CrossRef] [PubMed]
- Goshvarpour, A.; Abbasi, A.; Goshvarpour, A. An accurate emotion recognition system using ECG and GSR signals and matching pursuit method. Biomed. J. 2017, 40, 355–368. [Google Scholar] [CrossRef]
- Krumhuber, E.G.; Skora, L.I.; Hill, H.C.H.; Lander, K. The role of facial movements in emotion recognition. Nat. Rev. Psychol. 2023, 2, 283–296. [Google Scholar] [CrossRef]
- Kim, D.; Park, H.; Kim, T.; Kim, W.; Paik, J. Real-time driver monitoring system with facial landmark-based eye closure detection and head pose recognition. Sci. Rep. 2023, 13, 18264. [Google Scholar] [CrossRef]
- China Association of Metros. Urban Rail Transit Annual Statistical and Analysis Report 2024. 28 March 2025. PDF File. Available online: https://www.camet.org.cn/xytj/tjxx/660844283682885.shtml (accessed on 5 August 2025).
- International Electrotechnical Commission (IEC). IEC 62278-1:2025 Railway Applications—Specification and Demonstration of Reliability, Availability, Maintainability and Safety (RAMS)—Part 1: Generic RAMS Process (1.0 ed.). 2025. Available online: https://webstore.iec.ch/en/publication/6747 (accessed on 5 August 2025).
- Jafari, M.; Zaeri, F.; Jafari, A.H.; Najafabadi, A.T.P.; Al-Qaisi, S.; Hassanzadeh-Rangi, N. Assessment and monitoring of mental workload in subway train operations using physiological, subjective, and performance measures. Hum. Factors Ergon. Manuf. Serv. Ind. 2020, 30, 165–175. [Google Scholar] [CrossRef]
- Liu, P.; Song, Y.; Yang, X.; Li, D.; Khosravi, M. Medical intelligence using PPG signals and hybrid learning at the edge to detect fatigue in physical activities. Sci. Rep. 2024, 14, 16149. [Google Scholar] [CrossRef] [PubMed]
- Zeynali, M.; Alipour, K.; Tarvirdizadeh, B.; Ghamari, M. Non-invasive blood glucose monitoring using PPG signals with various deep learning models and implementation using TinyML. Sci. Rep. 2025, 15, 581. [Google Scholar] [CrossRef]
- Jeong, D.U.; Lim, K.M. Combined deep CNN–LSTM network-based multitasking learning architecture for noninvasive continuous blood pressure estimation using difference in ECG-PPG features. Sci. Rep. 2021, 11, 13539. [Google Scholar] [CrossRef]
- Liu, Y. Research on Cuff—Less Blood Pressure Detection Method Based on PPG Morphology and HRV. Master’s Thesis, Xi’an University of Technology, Xi’an, China, 2024. [Google Scholar] [CrossRef]
- Yu, L. Research on Human Factor Parameter Monitoring and Early Warning Equipment in Confined Spaces. Ph.D. Thesis, University of Science and Technology Beijing, Beijing, China, 2020. [Google Scholar] [CrossRef]
- Chang, C.-W.; Munch, S.B.; Hsieh, C.-H. Comments on identifying causal relationships in nonlinear dynamical systems via empirical mode decomposition. Nat. Commun. 2022, 13, 2860. [Google Scholar] [CrossRef]
- Hogan, P.S.; Chen, S.X.; Teh, W.W.; Chib, V.S. Neural mechanisms underlying the effects of physical fatigue on effort-based choice. Nat. Commun. 2020, 11, 4026. [Google Scholar] [CrossRef] [PubMed]
- Rohr, M.; Tarvainen, M.; Miri, S.; Güney, G.; Vehkaoja, A.; Antink, C.H. An extensive quantitative analysis of the effects of errors in beat-to-beat intervals on all commonly used HRV parameters. Sci. Rep. 2024, 14, 2498. [Google Scholar] [CrossRef]
- Montanari, A.; Ferlini, A.; Balaji, A.N.; Mascolo, C.; Kawsar, F. EarSet: A Multi-Modal Dataset for Studying the Impact of Head and Facial Movements on In-Ear PPG Signals. Sci. Data 2023, 10, 850. [Google Scholar] [CrossRef] [PubMed]
- Gamrah, M.A.; Xu, J.; El Sawy, A.; Aguib, H.; Yacoub, M.; Parker, K.H. Mechanics of the dicrotic notch: An acceleration hypothesis. Proc. Inst. Mech. Eng. Part H J. Eng. Med. 2020, 234, 1253–1259. [Google Scholar] [CrossRef]
- Nolte, I.M.; Munoz, M.L.; Tragante, V.; Amare, A.T.; Jansen, R.; Vaez, A.; von der Heyde, B.; Avery, C.L.; Bis, J.C.; Dierckx, B.; et al. Genetic loci associated with heart rate variability and their effects on cardiac disease risk. Nat. Commun. 2017, 8, 15805. [Google Scholar] [CrossRef] [PubMed]
- Jiryis, T.; Magal, N.; Fructher, E.; Hertz, U.; Admon, R. Resting-state heart rate variability (HRV) mediates the association between perceived chronic stress and ambiguity avoidance. Sci. Rep. 2022, 12, 17645. [Google Scholar] [CrossRef]
- Schmid, R.F.; Thomas, J.; Rentzsch, K. Individual differences in parasympathetic nervous system reactivity in response to everyday stress are associated with momentary emotional exhaustion. Sci. Rep. 2024, 14, 26662. [Google Scholar] [CrossRef]
- Corponi, F.; Li, B.M.; Anmella, G.; Valenzuela-Pascual, C.; Pacchiarotti, I.; Valentí, M.; Grande, I.; Benabarre, A.; Garriga, M.; Vieta, E.; et al. A Bayesian analysis of heart rate variability changes over acute episodes of bipolar disorder. npj Ment. Health Res. 2024, 3, 44. [Google Scholar] [CrossRef]
- Pham, T.; Lau, Z.J.; Chen, S.H.A.; Makowski, D. Heart Rate Variability in Psychology: A Review of HRV Indices and an Analysis Tutorial. Sensors 2021, 21, 3998. [Google Scholar] [CrossRef]
- Cohen, M.X. A better way to define and describe Morlet wavelets for time-frequency analysis. NeuroImage 2019, 199, 81–86. [Google Scholar] [CrossRef]
- Kong, S.; Qiu, L.; Su, Y.; Zhang, Y.; Sun, K. Mindfulness, cognitive load, and performance: Examining the interplay of stress and self-regulation in physical education. BMC Psychol. 2025, 13, 518. [Google Scholar] [CrossRef]
- Luo, S. Fatigue State Recognition Based on Multi-Facial Feature Fusion. Master’s Thesis, Beijing Jiaotong University, Beijing, China, 2023. [Google Scholar] [CrossRef]
- Hsu, H.-P.; Wang, C.-N.; Nguyen, T.T.T.; Dang, T.-T.; Pan, Y.-J. Hybridizing WOA with PSO for coordinating material handling equipment in an automated container terminal considering energy consumption. Adv. Eng. Informatics 2024, 60, 102410. [Google Scholar] [CrossRef]
- Zhang, Y.; Gong, D.-W.; Sun, X.-Y.; Guo, Y.-N. A PSO-based multi-objective multi-label feature selection method in classification. Sci. Rep. 2017, 7, 376. [Google Scholar] [CrossRef] [PubMed]
- Li, X.; Zhou, S.; Wang, F.; Fu, L. An improved sparrow search algorithm and CNN-BiLSTM neural network for predicting sea level height. Sci. Rep. 2024, 14, 4560. [Google Scholar] [CrossRef] [PubMed]
- He, X.; Zhao, W.; Gao, Z.; Zhang, L.; Zhang, Q.; Li, X. Short-term load forecasting by GRU neural network and DDPG algorithm for adaptive optimization of hyperparameters. Electr. Power Syst. Res. 2025, 238, 111119. [Google Scholar] [CrossRef]
- Imani, M. Attention Based Network for Fusion of Polarimetric and Contextual Features for Polarimetric Synthetic Aperture Radar Image Classification. Eng. Appl. Artif. Intell. 2025, 139 Pt B, 109665. [Google Scholar] [CrossRef]
- Mishra, V.L.; Chauhan, Y.K.; Verma, K.S. A new hybrid swarm intelligence-based maximum power point tracking technique for solar photovoltaic systems under varying irradiations. Expert Syst. Appl. 2025, 264 Pt B, 125786. [Google Scholar] [CrossRef]
- Hyndman, R.J.; Koehler, A.B. Another look at measures of forecast accuracy. Int. J. Forecast. 2006, 22, 679–688. [Google Scholar] [CrossRef]
- Chai, T.; Draxler, R.R. Root mean square error (RMSE) vs mean absolute error (MAE). Geosci. Model Dev. 2014, 7, 1247–1250. [Google Scholar] [CrossRef]
- Lai, Z.; Mo, D.; Wong, W.K.; Xu, Y.; Miao, D.; Zhang, D. Robust Discriminant Regression for Feature Extraction. IEEE Trans. Cybern. 2018, 48, 2472–2484. [Google Scholar] [CrossRef]
Disclaimer/Publisher’s Note: The statements, opinions and data contained in all publications are solely those of the individual author(s) and contributor(s) and not of MDPI and/or the editor(s). MDPI and/or the editor(s) disclaim responsibility for any injury to people or property resulting from any ideas, methods, instructions or products referred to in the content. |
© 2025 by the authors. Licensee MDPI, Basel, Switzerland. This article is an open access article distributed under the terms and conditions of the Creative Commons Attribution (CC BY) license (https://creativecommons.org/licenses/by/4.0/).