Abstract
Wireless communications in industrial environments are challenged by severe multipath propagation, which causes significant signal distortion. Conventional mitigation techniques, such as complex equalizers, are unsuitable as they contradict the stringent low-power and low-complexity requirements of Reduced Capability (RedCap) devices. This paper introduces a novel method for optimizing single-carrier pulse shapes under a distortion constraint to combat multipath propagation. The performance was evaluated through simulations in MATLAB 2023b using a ray-traced warehouse model. The results show that the proposed optimal pulses achieve a significant reduction in Error Vector Magnitude (EVM) (up to 40% in non-line-of-sight scenarios) compared to conventional root-raised cosine (RRC) pulses, while adhering to the 20 MHz RedCap bandwidth requirement. Furthermore, this performance is attainable with a low-complexity scaling equalizer. EVM degradation under Doppler shift is estimated and the pilot period required to maintain the target distortion level is specified. The resulting bit rate of approximately 2.9 Mbps supports industrial sensor networks and low-definition video streaming, confirming the approach’s suitability for resource-constrained industrial applications.
1. Introduction
1.1. Related Work
The ongoing evolution of industrial automation, guided by the principles of Industry 4.0, increasingly depends on seamless and reliable data exchange. While wired Industrial Ethernet has long been the standard for this purpose [,,,], the growing need for mobility in sensors, tools, and wearable devices necessitates a shift towards wireless solutions. These wireless links must deliver high data rates within limited frequency resources while overcoming the significant challenges posed by industrial environments, such as severe multipath propagation caused by metallic surfaces and large machinery [,,,].
The recent introduction of Reduced Capability (RedCap) devices offers a solution for many industrial applications, positioning them between the requirements of eMBB (Enhanced Mobile Broadband), URLLC (Ultra-Reliable Low-Latency Communications) and mMTC (Massive Machine-Type Communications) []. RedCap devices include wearables (smart watches, health monitoring devices, augmented reality smart glasses, smart tools), industrial wireless sensors (pressure sensors, motion sensors), and video surveillance cameras. These devices must deliver moderate data rates (2–50 Mbps) within a 20 MHz bandwidth (FR1), all under strict limits for power, cost, size, and complexity []. Orthogonal Frequency Division Multiplexing (OFDM) is a common choice due to its resilience to intersymbol interference. However, its high Peak-to-Average Power Ratio (PAPR) results in inefficient power amplification that directly shortens the battery life of autonomous RedCap devices []. Spectrally Efficient Frequency Division Multiplexing (SEFDM) can improve spectral efficiency and reduce PAPR []. However, multicarrier signals (including both OFDM and SEFDM) are typically applied in ultra-high-speed data transmission scenarios, such as video streaming. Industrial applications, however, do not require such high data rates.
As an alternative, single-carrier signals with frequency-domain equalization (SC-FDE) can simplify transceiver design []. Typically generated using root-raised cosine (RRC) pulses, SC-FDE signals combat multipath effects with a cyclic prefix (CP). However, the CP introduces latency and requires computationally intensive equalization, which conflicts with RedCap objectives for low power and complexity. A promising approach to avoid complex receivers is to account for the channel characteristics at the transmitter. However, pre-distortion techniques such as Tomlinson-Harashima precoding [] inevitably alter the signal’s energy spectrum, which can lead to electromagnetic compatibility issues. Conversely, optimizing the fundamental shape of the transmitted pulse in accordance with the channel impulse response presents a more elegant solution, as it can inherently address multipath and Doppler effects while adhering to strict spectral requirements.
Different optimization criteria can be found in the literature. For instance, the authors of [,,,,] use a criterion based on minimizing the deviation in the energy spectrum from a spectral mask. However, no specific spectral mask requirements have been defined for RedCap devices.
In [,], the optimization criterion based on maximizing the free Euclidean distance with constraints on energy spectrum was proposed. However, using the maximum free Euclidean distance as a measure of signal distortion requires a trellis-based demodulation algorithm, such as Viterbi or BCJR. This algorithm is computationally intensive and is therefore unsuitable for RedCap devices.
Under conditions of a limited frequency resource, the priority shifts from improving energy efficiency under spectral requirements to minimizing bandwidth under energy efficiency constraints. In [,], an optimization problem is formulated based on the criterion of maximum band energy concentration under constraints on PAPR and the level of intersymbol interference (ISI). Due to this optimization criterion, the pulse shapes exhibit discontinuities at the boundaries of their time interval. Our preliminary research [] has shown that in an industrial scenario, a lower distortion level can be achieved by using signals with a smoother pulse shape. Such signals can be obtained by applying an optimization criterion focused on minimizing out-of-band emissions [,,,,,]. Unlike previous studies, which only included intrinsic ISI in the optimization constraints [,,], it is necessary to account for channel-induced distortion.
1.2. Contribution and Organization
In this paper, we propose a novel method for optimizing single-carrier pulse shapes to minimize distortion in industrial wireless channels. The core of our approach is a variational optimization problem of minimizing out-of-band emissions with the constraint on the level of distortions, solved numerically to obtain pulses that are tailored to specific 3GPP “Indoor Factory” (InF) scenarios. We evaluate the performance of these optimal pulses using the Error Vector Magnitude (EVM) metric across a realistic, ray-traced model of a warehouse. Our analysis demonstrates that in challenging non-line-of-sight scenarios, the optimal signals achieve an approximately 40% reduction in EVM compared to conventional RRC-based signals. This significant gain is attainable even with the low-complexity simple scaling equalizer, highlighting the practical efficiency of the proposed approach.
The rest of the paper is organized as follows. Section 2 describes the simulation model and the industrial scenarios. Section 3 provides an analysis of the key characteristics of the industrial channel. Section 4 details the formulation of the pulse shape optimization problem. Section 5 presents and discusses the results of our modeling, including EVM performance and signal characteristics. Finally, conclusions are drawn in Section 6.
2. Simulation Model of Signal Transmission in Industrial Scenario
2.1. Simulation Model Description
Figure 1 shows a block diagram of a simulation model developed in the Matlab environment for evaluating distortions in an industrial channel. The sequence of N information and pilot bits, intended for estimating the channel impulse response, is converted into BPSK symbols and then fed to a pulse shaping filter with impulse response . At the output of pulse shaping filter the baseband signal is formed:
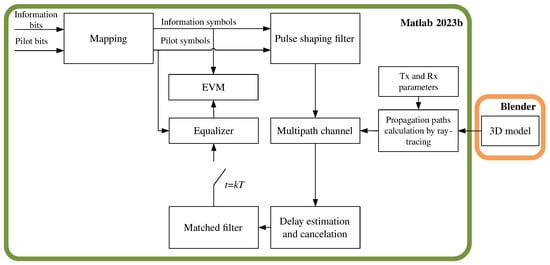
Figure 1.
Simulation model.
The formed baseband signal passes through a multipath channel, which is generated based on signal propagation paths pre-calculated using the ray-tracing method for given transmitter and receiver parameters. These parameters include the coordinates of the transmitter and receiver, antenna type, transmitter power, carrier frequency, and sampling rate. The maximum number of reflections and diffractions is also set. The focus is on distortions caused by the multipath nature of signal propagation; therefore, additive white Gaussian noise (AWGN) is not considered at this stage.
On the receiver side, the signal delay caused by transmission through the channel is estimated and eliminated. Then, the convolution of the received signal with the impulse response of the matched filter is computed. The values from the output of the matched filter are sampled at intervals that are multiples of the symbol interval T and are fed to the input of the equalizer. It is proposed to consider equalizers with different computational complexity and performance. In the simplest case, the equalization procedure reduces to scaling the received symbols by a complex-valued coefficient :
where is the k-th received symbol after correction. The coefficient can be determined with the use of pilot symbols:
More complex equalizers can be used, including a linear MMSE equalizer, a recursive least squares (RLS) equalizer, or a decision feedback equalizer (DFE).
The error vector magnitude (EVM) metric is proposed for use as a distortion metric. EVM represents the difference between the ideal symbols + and the estimates of the received symbols at the output of the equalizer . For the k-th symbol, the error vector magnitude can be defined by the following formula:
The study proposes to determine the maximum value of the metric over the duration of one frame
and to perform averaging over realizations:
The higher the EVM value, the greater the distance between the ideal symbols and their estimates, which leads to a higher bit error rate []. Unless otherwise specified, the parameters used in this paper are = 10, = 100 and N = 1000.
2.2. Industrial Scenario Description
The TR 38.901 standard, Release 15 [], introduced the “Indoor Factory” (InF) channel model. This model was further refined for different InF sub-scenarios in the TR 38.901 standard, Release 16 [].
Typical industrial InF scenarios include warehouses, manufacturing halls, automotive plants, assembly shops, etc. Compared to an office radio propagation environment, the InF environment has the following characteristics:
- Larger room size;
- Higher ceiling;
- More metallic objects causing specular reflection;
- Non-uniform object sizes;
- Signal blockage is primarily caused by machinery/equipment, not walls.
3GPP defines four main InF sub-scenarios []:
- Indoor Factory-Sparse Low (InF-SL)—Sparse clutter, both transmitter and receiver are located below the clutter height;
- Indoor Factory-Dense Low (InF-DL)—Dense clutter, both transmitter and receiver are located below the clutter height;
- Indoor Factory-Sparse High (InF-SH)—Sparse clutter, either the transmitter or the receiver is located above the clutter height;
- Indoor Factory-Dense High (InF-DH)—Dense clutter, either the transmitter or the receiver is located above the clutter height.
Several approaches can be used to model an industrial scenario. The first approach involves using known channel models and tuning their parameters based on measurements performed in specific industrial conditions. Such empirical models are computationally simple; however, they are only valid for a propagation environment similar to the one for which the model was developed. Another approach implies a numerical solution of Maxwell’s equations for a specific scenario using the material properties of the surfaces involved in signal propagation. The ray-tracing method [,] belongs to the latter approach.
The ray-tracing method allows for obtaining a sufficiently accurate channel model with significantly less time investment than required for conducting measurements []. This method is implemented in Matlab 2023b (Antenna Toolbox) and supports a frequency range from 100 MHz to 100 GHz. Starting with Matlab version 2023b, it has become possible to import 3D scenes in gLTF format, accounting for the material properties of object surfaces (concrete, plastic, plywood, brick, wood, glass, metal).
In this work, a warehouse was chosen as the industrial scenario. A 3D model of the warehouse with dimensions of 36.4 m × 27.9 m × 12.6 m was developed in the Blender environment (Figure 2). The warehouse walls and floor are made of concrete, while the staircase, roof, support pillars, entrance garage door, and the walls of the office on the second floor are made of metal. Metal racks were chosen as one of the most common objects for a sparse industrial scenario []. These 3-meter-high metal racks (1.2 m × 3 m footprint) have four storage levels, each holding two cardboard boxes (1.2 m × 0.8 m × 0.5 m, material: wood) (Figure 3a). The distance between the top box and the roof support is about 5.6 m. The distance between adjacent racks in a row is 0.9 m, with 5.2 m between rows.

Figure 2.
Three-dimensional model of a warehouse.
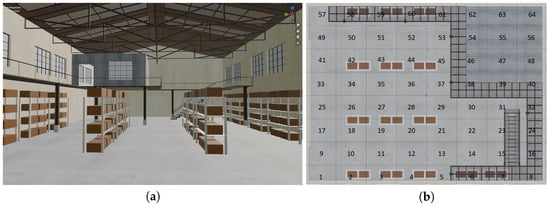
Figure 3.
Industrial sparse scenario (a) and its top view (b). The numbers on the map indicate the serial numbers of the points where the receiver can be located.
To assess the signal level at each point in space, the warehouse can be divided into several cells of equal area. Figure 3b shows a map of the warehouse with an 8 × 8 coordinate grid superimposed on it. The user terminal can be located at the center of a cell at a height of 1.5 m. Depending on the position of the base station, different InF sub-scenarios can be modeled. For example, with the base station located at coordinates x = 32 m, y = 4 m, z = 8 m (the far upper-right corner of the warehouse above cell 8), the InF-SH sub-scenario can be implemented, while with z = 1.5 m, the InF-SL sub-scenario can be realized.
For the InF-DH or InF-DL sub-scenario, a denser arrangement of obstacles is required. In this case, 7 m high metal storage racks with eight storage levels are arranged in a tight, back-to-back configuration, except for those placed directly against the walls and underneath the mezzanine (Figure 4a). The spacing between adjacent back-to-back racks is now 3.5–4 m, which is less than in a sparse configuration. The distance between the top box and the support of the roof is reduced from 5.6 m to 1.6 m. Besides, there are three metal forklifts with dimensions 4.35 m × 1.45 m × 2.34 m in this scenario. Due to all these obstacles, the number of receiver points decreases from 64 to 48. The location of the base station is the same as in a sparse scenario. A map corresponding to InF-DH scenario with a base station shown by a red marker is presented in Figure 4b.
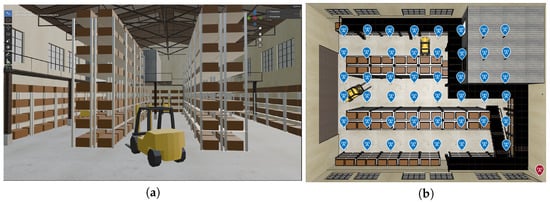
Figure 4.
Industrial dense scenario (a) and its top view (b). The blue markers indicate the points where the receiver can be located. The red marker denotes the transmitter.
3. Estimation of Industrial Channel Characteristics
Here are the common parameters of the industrial channel simulation:
- Maximum number of reflections: 10,
- Maximum number of diffractions: 0,
- Transmitter (Tx) coordinates: x = 32 m, y = 4 m, z = 8 m for InF-SH/InF-DH and z = 1.5 m for InF-SL/InF-DL,
- Receiver velocity: 0 m/s,
- Tx and Rx antenna type: isotropic,
- Tx power: 0.1 W,
- Carrier frequency: = 2.4 GHz (also 4.9 GHz, 28 GHz).
Let us start with the sparse scenario, which means that the obstacles occupy less than 40% of the room.
3.1. InF-SH, InF-SL
One of the key characteristics of a multipath channel is the power delay profile (PDP), which represents the dependence of the received signal power on the time delay. The power delay profile can be calculated using the propagation delay, losses, and phase shift for each ray, as well as the gains of the transmitting and receiving antennas.
The power delay profile for the multipath communication channel between the transmitter and receiver at point #1 is shown in Figure 5 for a transmitter power of 0 dBm ( = 2.4 GHz). The x-axis shows the ray delay value relative to the first arriving ray with the minimum delay .
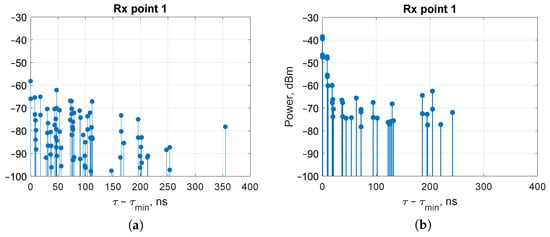
Figure 5.
Power delay profile at receiver point #1 for InF-SH (a) and InF-SL (b), = 2.4 GHz.
Using the channel’s power delay profile , the channel’s characteristics such as the mean excess delay , the root mean square (RMS) delay spread can be determined (k is the ray index) [,]:
Based on and the signal characteristics, the channel can be classified as frequency-selective or frequency-flat. Specifically, if the symbol duration T is significantly greater than the RMS delay spread , the impact of intersymbol interference caused by multipath propagation is negligible. In practice, a channel is typically classified as frequency-selective if the following condition is met []:
Figure 6 shows the values of the RMS delay spread for each receiver position (zeros correspond to points where no measurements were taken). With a sampling rate of = 30.72 MHz, as adopted in the LTE standard, and a number of samples per symbol = 10, the symbol duration T will be 325.52 ns. Therefore, for a frequency-selective channel, the RMS delay spread must be at least 32.55 ns. Thus, there are 21 receiver points where the InF-SH channel can be considered frequency-selective under these parameters (Figure 6a). Reducing the Tx antenna height to 1.5 m establishes a dominant line-of-sight (LOS) condition across most of the area (Figure 7), resulting in a decreased RMS delay spread. Only 9 receiver points correspond to frequency-selective channel (Figure 6b).
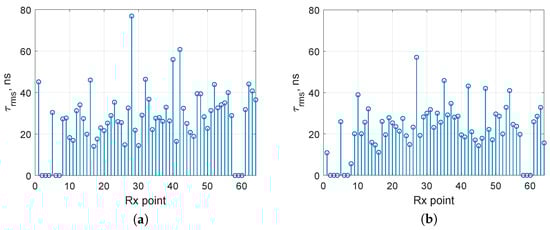
Figure 6.
Root mean square delay spread for InF-SH (a) and InF-SL (b), = 2.4 GHz.
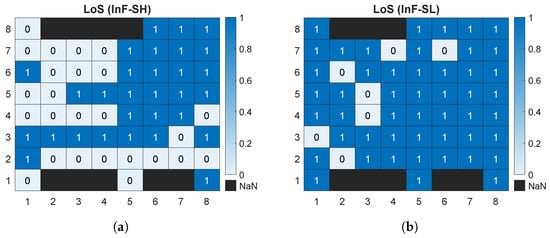
Figure 7.
Number of line-of-sight (LoS) rays at each receiver point for InF-SH (a) and InF-SL (b).
As the carrier frequency increases, the propagation loss of the rays also increases, leading to a decrease in the power of the received rays and a reduction in the overall signal power. For instance, transitioning from = 2.4 GHz to = 28 GHz for InF-SH scenario results in a decrease in received signal power up to 30 dB (Figure 8a). Transition to InF-SL scenario provides an increase in received signal power due to reduction in propagation path distance (Figure 8b). However, such a variation in received signal power has practically no effect on the values of the RMS delay spread.
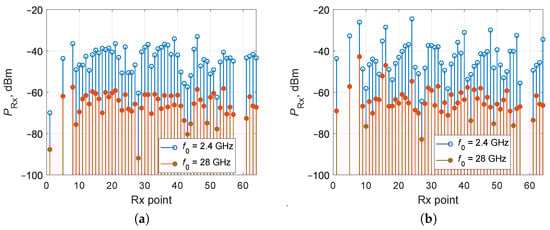
Figure 8.
Received signal power for InF-SH (a) and InF-SL (b).
3.2. InF-DH, InF-DL
In a dense scenario, the number of rays reaching a receiver point decreases compared to the sparse scenario. This is especially notable in case of a high Tx antenna (Figure 9).
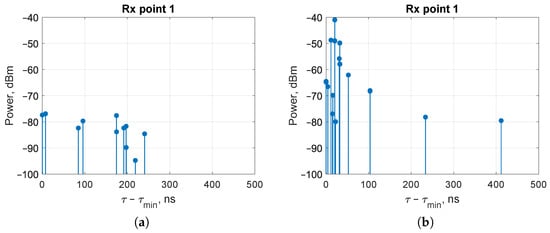
Figure 9.
Power delay profile at receiver point #1 for InF-DH (a) and InF-DL (b), = 2.4 GHz.
The RMS delay spread rather depends on the volume of the environment and the location of obstacles than on the carrier frequency. So, the RMS delay spread becomes higher in conditions of an increased number of obstacles including smooth metallic surfaces compared to a sparse scenario (see Figure 6 and Figure 10). These obstacles lead to a reduction in the number of points with line-of-sight conditions (Figure 7 and Figure 11). It correlates with the statements from []. In InF-DH case, 32 from 48 receiver points correspond to a frequency selective channel (Figure 10a). Similar to sparse scenarios, lowering the transmitter antenna height in dense scenarios also reduces the RMS delay spread by establishing LoS conditions at more locations (Figure 11): there are only 7 receiver points with a frequency selective channel (Figure 10b).
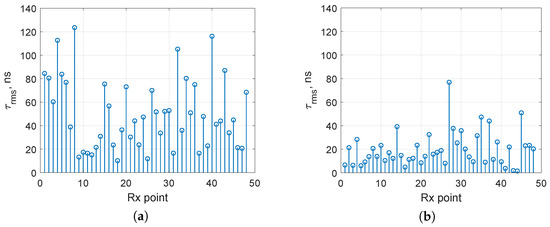
Figure 10.
Root mean square delay spread for InF-DH (a) and InF-DL (b), = 2.4 GHz.
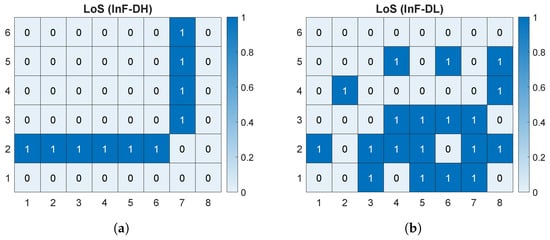
Figure 11.
Number of line-of-sight (LoS) rays at each receiver point for InF-DH (a) and InF-DL (b).
4. Optimization Problem
In paper [], it was shown that the use of smoother pulse shapes enables a lower level of EVM distortion. Since the smoothness of a pulse affects the level of out-of-band emissions, the criterion of minimizing out-of-band emissions is proposed for searching for new signal shapes. The problem of optimizing the pulse shape according to the criterion of minimizing out-of-band emissions can be written as follows:
where denotes the energy spectrum of the pulse determined on the interval .
Obviously, the emission level should be as low as possible within the necessary frequency band and as high as possible outside of it. It is most convenient to use an even-degree parabola as the function , , where n = 1, 2, 3… is a parameter that determines the degree of suppression of out-of-band emissions []. With this choice of the function , the convergence of the integral in (9) will be determined by the decay rate of the energy spectrum. Obviously, if the decay rate of the spectrum in the out-of-band emission region is higher than the growth of the function outside the necessary frequency band, then the integral in (9) will converge. This condition can be derived into the constraints of the optimization functional.
It can be shown that (9) can be transformed into the following expression:
The problem of optimizing the amplitude pulse shape involves determining the function that minimizes the integral in this expression. To obtain a unique solution from the infinite set of solutions, normalization should be performed ( is the energy of the pulse ) []:
Taking into account the constraint (11), the considered optimization problem is a typical variational isoperimetric problem. The method of Lagrange multipliers is used to solve the isoperimetric problem []. Let us define the Lagrange function:
The Euler equation is as follows:
Taking into account (10) and (12), we obtain a linear homogeneous differential equation of the -th order:
where is the eigenvalue of the differential equation, determined from the boundary conditions. It is proposed to choose the conditions of Mason’s theorem as the boundary conditions:
According to Mason’s theorem, if and all its derivatives up to the -th order have no discontinuities, and is finite everywhere, then the energy spectrum of will decrease at a rate no slower than (B is a constant). The assumption of the absence of discontinuities in the function also accounts for the fact that the function takes zero values at the ends of the interval [].
The choice of boundary conditions (15) ensures both a decay rate of the energy spectrum no slower than and the convergence of the integral (9).
The optimization problem of minimizing (10) with the aforementioned constraints can be solved analytically for certain parameters and n. As the parameter n increases, the order of the Euler differential equation also increases. The introduction of additional constraints leads to a ravine-like nature of the optimization functional. In this case, obtaining an analytical solution becomes extremely difficult or even impossible []. In this regard, it is proposed to switch to a numerical solution of the optimization problem.
Let us assume that the function is even on the interval , and let us represent it as a Fourier series expansion with m coefficients [,]:
Thus, the problem of minimizing the optimization functional (9) transforms into the problem of finding the coefficients that ensure the minimum of the multivariable function (17) [].
If the pulse length is longer than symbol duration T, intersymbol interference (ISI) occurs. Typically, the internal ISI is controlled by the constraint on correlation coefficient [,,]. In this research, we propose the constraint on the total distortion, which includes components from the multipath channel and from the internal ISI. The level of total distortion can be assessed using the EVM metric between the received estimates of the modulation symbols, , and their true values, . Higher EVM values, indicating a greater distance between the received and ideal symbols, result in a higher bit error rate []. The maximum EVM required for correct demodulation depends on the signal constellation. For QPSK, the maximum EVM is specified as 18.5% []. This threshold is also applicable to BPSK, as the minimum Euclidean distance between constellation points is identical for both modulations.
If the channel characteristic is known, the received symbols can be corrected using an equalizer. Equalization is a complex procedure that consumes a significant amount of resources. Instead of applying a complex equalizer, the channel response can be accounted for on the transmitter side. Simple scaling can be applied to simplify the optimization process. The pulse shape can be modified so that the distortions caused by the transmission channel and internal ISI do not exceed a certain value []:
Here, is the number of points where the receiver can be located, N is the number of modulation symbols, are the transmitted modulation symbols, and are the estimates of the received modulation symbols).
The values can be obtained at the output of the matched filter at time instants . However, it has been shown that using the simplest equalizer, represented as scaling with a complex-valued coefficient (3), can significantly reduce the level of distortions with only a minor increase in processing complexity. Therefore, in the distortion level constraint (18), it is proposed to calculate the difference between the true values of the modulation symbols and their estimates at the output of the simplest equalizer (2) []:
To simplify the optimization, we use the following three-step methodology:
- Calculate the distortion level for all receiver points.
- Apply the constraint only to the subset of points where the distortion is at least 90% of the maximum.
- Verify that the distortion level does not exceed the limit at all receiver locations.
If this condition is met, the obtained expansion coefficients are considered a valid solution. Otherwise, the threshold 90% is decreased, and the optimization is repeated for a larger subset of points.
5. Results
5.1. ISI-Free Signals
To begin, let us consider the following pulse shapes used in the formation of single carrier signals without intersymbol interference:
- a rectangular pulse:
- a half-wave sine:
- a half-wave sine to the tenth power:
These pulses have different time–frequency localization. The smoother pulse shapes have a narrower peak which produces a lower level of intersymbol interference in multipath conditions []. That is why the maximum EVM for InF-SH scenario is equal to 83% for a rectangular pulse shape (20) and 12% for a half-wave sine to the tenth power (22) when scaling is applied (Table 1). However, in the absence of intersymbol interference, transitioning to a smoother pulse leads to an increase in PAPR. When MMSE is applied, a half-wave sine (21) with PAPR = 3 dB can be used instead of pulse (22) with PAPR = 7.5 dB.

Table 1.
Characteristics of ISI-free signals.
The smoother the pulse shape, the higher the decay rate of out-of-band emissions. Increasing the decay rate of out-of-band emissions leads to an expansion of the main lobe of the power spectral density and the bandwidth containing 99% of the signal’s power. Thus, with a sampling rate = 30.72 MHz and 10 samples per symbol duration T, the occupied frequency band for pulse (22) ranges from 17.8 MHz to 33.2 MHz depending on the criterion used to define the bandwidth. According to [], the maximum bandwidth should not exceed 20 MHz for frequencies belonging to the FR1 range. To reduce the occupied bandwidth, we can apply pulses which duration exceeds T. In this case, the symbol interval duration should be kept equal to T to avoid a reduction in data rate. In other words, it makes sense to consider signals with intersymbol interference.
5.2. Signals with ISI
The expansion coefficients for the optimal pulses, obtained by solving the optimization problem for each scenario with and , are provided in Table 2. These coefficients were used to construct the optimal pulse shapes shown in Figure 12 and Figure 13 using (16). For a fixed target distortion , the optimal pulse shape becomes increasingly dependent on high-frequency expansion coefficients as the channel degrades. The growth in the magnitude of these coefficients compresses the pulse in time, leading to a rapid suppression of the sidelobes (see optimal pulses for InF-SL in Figure 12c and InF-DL in Figure 13c).
Table 2.
Expansion coefficients of optimal pulses for different scenarios.
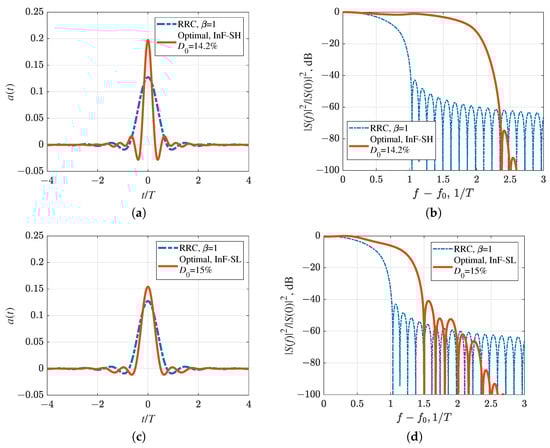
Figure 12.
Optimal pulse shapes and their energy spectra compared to RRC pulse with the roll-off factor : (a,b) InF-SH, (c,d) InF-SL.
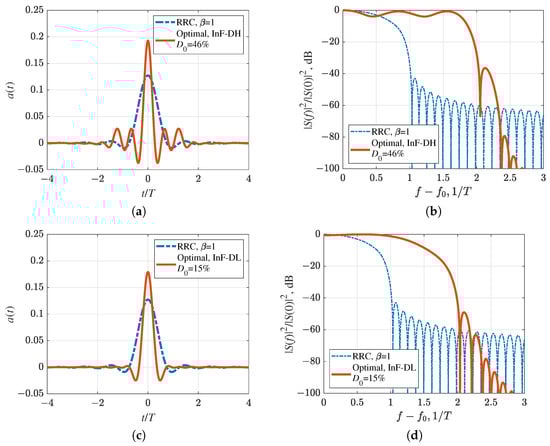
Figure 13.
Optimal pulse shapes (a) and their energy spectra compared to RRC pulse with the roll-off factor : (a,b) InF-DH, (c,d) InF-DL.
The values of occupied frequency bandwidth and PAPR determined by the level of complementary cumulative distribution function for optimal and RRC signals can be found in Table 3. Given the symbol duration T = 325.52 ns, the frequency bandwidth occupied by optimal pulses ranges from 7.4 MHz to 14.3 MHz, depending on the bandwidth definition criterion. Thus, the signals fully satisfy the requirement of a frequency bandwidth not exceeding 20 MHz []. The achieved bit rate of 2.9 Mbps adequately supports the requirements for industrial sensor data exchange and low-definition video streaming.
Table 3.
Comparison of optimal pulse shapes and RRC in terms of bandwidth and PAPR.
As channel conditions degrade under a fixed-distortion optimization, the optimal pulse becomes more compressed in time, and its peak amplitude grows. This increase raises the peak power while reducing the average power, which consequently leads to a higher PAPR. For example, PAPR increases from 4.1 dB for InF-SH to 5.2 dB for InF-DH (Table 3). Furthermore, the narrowing of the pulse’s peak in time also broadens the signal’s energy spectrum, leading to a wider main lobe (Figure 12d and Figure 13d) and increased , , and bandwidths (Table 3).
The occupied bandwidths , , and for the optimal signals are more than 1.5 times greater than the corresponding occupied bandwidths for signals based on RRC pulses. When defining the bandwidth at the −60 dB level, the difference decreases to 20%. The peak-to-average power ratio (PAPR) of the optimal signals also exceeds that of signals based on RRC pulses with a roll-off factor of = 1 by 0.6–2.9 dB. Nevertheless, optimal pulses are expected to introduce less distortion in an industrial scenario because their narrower main lobe in the time domain results in a more compact energy distribution. Figure 14 confirms this: due to multipath propagation, the two ideal points become a cluster of points. When optimal pulses are used, these points are grouped more tightly together and are closer to the ideal points compared to the case with RRC pulses.
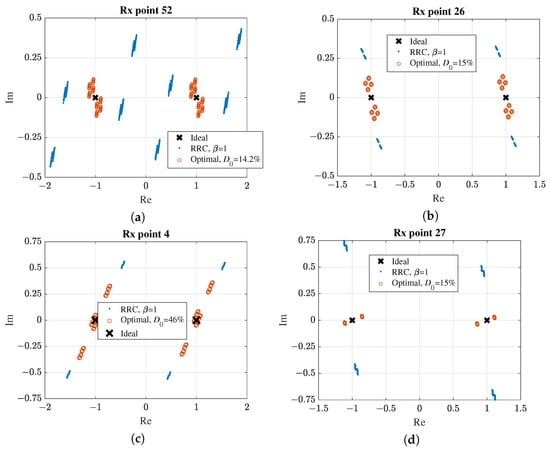
Figure 14.
Signal constellation at receiver ( = 2.4 GHz) after scaling with a complex-valued coefficient: (a) InF-SH, (b) InF-SL, (c) InF-DH, (d) InF-DL.
Although the optimal pulses provide a lower level of distortion than the RRC pulse, it is important to note that no pulse could be synthesized to meet the 18.5% EVM benchmark in InF-DH scenario. We hypothesize that the severely degraded channel conditions make the optimization problem infeasible for this parameter set. A potential solution would be to adjust the receiver positions, as even a half-wavelength movement could escape the deep fade.
Figure 14 shows the signal constellations corresponding to the receiver points with the highest EVM for optimal pulses after scaling with a complex-valued coefficient. Since propagation conditions can vary significantly, other receiver points exhibit different EVM values. A change in carrier frequency can alter the EVM at each point differently. Therefore, we present the dependence of the maximum EVM, averaged over all receiver points, on the carrier frequency in Figure 15. The observed dependence is non-monotonic. The primary factor influencing EVM is the phase shift in the individual rays, which changes substantially with carrier frequency. Depending on their relative phases, the rays can combine constructively or destructively. Destructive interference increases EVM, whereas constructive interference results in minimal distortion and a low EVM.
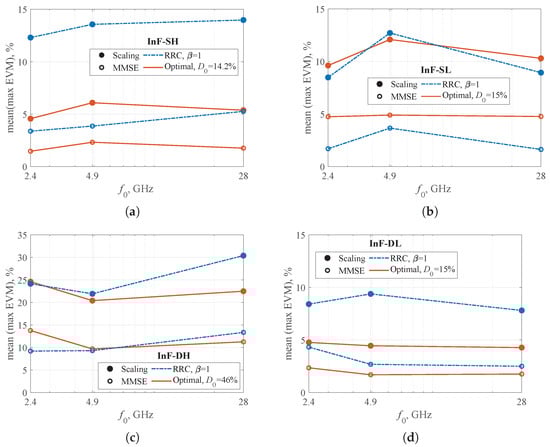
Figure 15.
Maximum EVM averaged over all receiver points vs. carrier frequency: (a) InF-SH, (b) InF-SL, (c) InF-DH, (d) InF-DL.
Furthermore, at mmWave frequencies, the size of common reflectors becomes large relative to the wavelength, which can cause diffuse scattering to behave more like specular reflection. The probability of a specular path reaching the receiver is lower than that of a scattered path, as it requires specific angles of arrival and departure. Consequently, the transition to mmWave frequencies may reduce the significance of multipath propagation. The decrease in EVM observed at 28 GHz (Figure 15), for instance, can be explained by lower level of multipath, potentially leading to a lower overall EVM.
Figure 16 illustrates the maximum EVM, evaluated across all receiver points and over 1000 modulation symbols, as a function of receiver velocity for different scenarios and equalizers. The results indicate that optimal signals outperform RRC signals when using the same equalization algorithm. This benefit is particularly pronounced in the InF-SH and InF-DH scenarios, where the optimal signals achieve an EVM reduction of 40% or more. The DFE and RLS equalizers demonstrate greater robustness to Doppler shift induced by changing receiver velocity; however, the MMSE equalizer yields the lowest overall EVM values. The application of a simple scaling technique produces results comparable to the MMSE equalizer with reduced computational complexity. Finally, the performance of more complex equalizers, such as RLS and DFE, is highly dependent on parameters like the number of taps and step size, which require more careful configuration. During simulation, the number of taps was set to 10 and the step size was equal to 0.1.
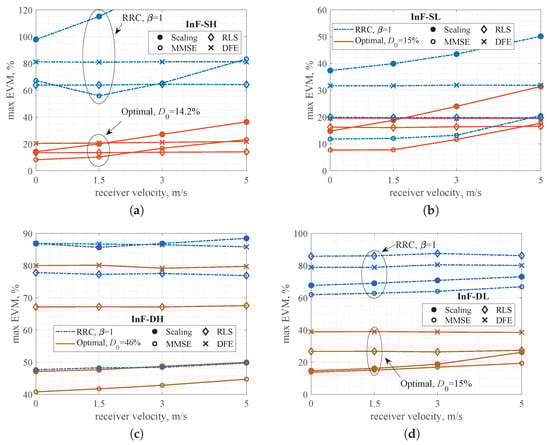
Figure 16.
Maximum EVM vs. receiver velocity for 1000 information bits: (a) InF-SH, (b) InF-SL, (c) InF-DH, (d) InF-DL. The blue curves correspond to RRC signals, while the red ones correpond to optimal signals.
Since the performance of the MMSE equalizer and the scaling technique is highly dependent on Doppler shift, it is necessary to characterize the maximum EVM of optimal signals as a function of the number of modulation symbols at different receiver velocities. Figure 17 illustrates this relationship for the InF-SH, InF-SL, and InF-DL scenarios. The InF-DH scenario was excluded because its optimal signals were not designed to meet the 18.5% EVM benchmark. The number of pilot symbols inserted at the beginning of the sequence for channel coefficient estimation was set to 10. The results demonstrate that at a high velocity (5 m/s), the scaling technique requires pilot insertion every 100 information symbols across all scenarios, incurring a 10% overhead and a corresponding reduction in the net bitrate which decreases from 2.9 Mbps to 2.67 Mbps. In contrast, the MMSE equalizer relaxes this requirement, allowing a pilot period of 500 symbols for InF-SH and InF-DL and 1000 symbols for InF-SL, which reduces the overhead to 2% or less (the resulting bitrate is at least 2.87 Mbps). Therefore, for low-mobility conditions (1.5 m/s), the scaling is sufficient. At higher speeds of 5 m/s, however, the MMSE equalizer is preferable, as it limits the data rate loss to less than 2%.
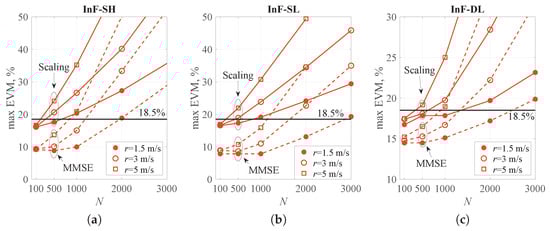
Figure 17.
Maximum EVM vs. number of information symbols at different speed: (a) InF-SH, (b) InF-SL, (c) InF-DL. The solid curves correspond to scaling, while the red ones correspond to MMSE equalizer.
6. Conclusions
The results of this study demonstrate the significant potential of pulse shape optimization for enhancing the performance of single-carrier wireless communication systems in industrial scenarios. We successfully formulated and solved an optimization problem to obtain novel pulse shapes for four distinct industrial sub-scenarios (InF-SH, InF-SL, InF-DH, InF-DL). These optimal pulses, defined by their Fourier series coefficients, inherently address multipath propagation while adhering to the stringent 20 MHz bandwidth requirement for RedCap devices operating in FR1 band. The resulting bit rate of approximately 2.9 Mbps is sufficient for communication between industrial sensors and for low-definition video surveillance. The performance evaluation was conducted using a realistic ray-traced warehouse model. In the challenging non-line-of-sight scenarios, the proposed pulses achieved a reduction in EVM of approximately 40% compared to conventional Root-Raised Cosine (RRC) pulses. The significant EVM gains were obtained even with a simple scaling equalizer, underscoring the practical efficiency of our approach and its alignment with the low-power, low-complexity objectives of RedCap devices. While more complex equalizers such as RLS and DFE offer greater robustness to Doppler shift, the target EVM can be met with simpler techniques, introducing an overhead of just 2%. This results in a net bitrate of 2.87 Mbps. To achieve this, scaling with a complex-valued coefficient can be used in low-mobility conditions (≤1.5 m/s), while an MMSE equalizer is required in high-mobility conditions (up to 5 m/s).
Despite these promising results, the study reveals important limitations that chart a course for future research. The optimized pulses exhibit a higher Peak-to-Average Power Ratio (PAPR) compared to conventional RRC pulses, which is detrimental for the power efficiency of battery-driven devices. In addition to this, the current optimal pulse for the InF-DH scenario was designed with a high distortion constraint ( = 46%) and does not meet the 18.5% EVM benchmark required for reliable BPSK/QPSK demodulation. A continued search for a more effective pulse for the InF-DH scenario is necessary. Future work will focus on extending the proposed method to higher-order modulations, incorporating PAPR constraints into the optimization problem, and investigating adaptive pulse shaping for time-varying industrial channels.
Author Contributions
Conceptualization, S.M., S.Z. and A.O.; methodology, A.O.; software, A.O., A.C., A.K. and I.L.; validation, A.O. and S.Z.; formal analysis, S.M. and G.D.; writing—original draft preparation, A.O., A.C. and I.L.; writing—review and editing, S.Z., S.M. and A.O.; project administration, S.Z.; funding acquisition, S.Z. All authors have read and agreed to the published version of the manuscript.
Funding
The results of the work were obtained with the support of the grant of Russian Science Foundation №24-29-00522, https://rscf.ru/en/project/24-29-00522/, accessed on 10 October 2025.
Data Availability Statement
Data is contained within the article.
Conflicts of Interest
The authors declare no conflicts of interest.
Abbreviations and Notations
The following abbreviations and notations are used in this manuscript:
| AWGN | Additive white Gaussian noise |
| BPSK | Binary phase shift keying |
| CP | Cyclic prefix |
| DFE | Decision feedback equalizer |
| eMBB | Enhanced mobile broadband |
| EVM | Error vector magnitude |
| InF | Indoor Factory |
| InF-DH | Dense clutter, either Tx or Rx is located above the clutter height |
| InF-DL | Dense clutter, both Tx and Rx are located below the clutter height |
| InF-SH | Sparse clutter, either Tx or Rx is located above the clutter height |
| InF-SL | Sparse clutter, both Tx and Rx are located below the clutter height |
| ISI | Intersymbol interference |
| mMTC | Massive machine-type communications |
| LTE | Long term evolution |
| MMSE | Minimum mean square error |
| OFDM | Orthogonal frequency division multiplexing |
| PAPR | Peak-to-average power ratio |
| PDP | Power delay profile |
| QPSK | Quadrature phase shift keying |
| RedCap | Reduced capability |
| RLS | Recursive least squares |
| RMS | Root mean square |
| RRC | Root-raised cosine |
| SC-FDE | Single-carrier signals with frequency-domain equalization |
| SEFDM | Spectrally efficient frequency division multiplexing |
| URLLC | Ultra-reliable low-latency communications |
| the k-th derivative of the pulse | |
| impulse response of pulse shaping filter | |
| k-th expansion coefficient of the pulse | |
| k-th symbol | |
| k-th received symbol | |
| k-th received symbol at the output of equalizer | |
| the total distortion level used in optimization constraint | |
| energy of the pulse | |
| the EVM maximized over all transmitted symbols | |
| error vector magnitude of the k-th symbol | |
| carrier frequency | |
| energy spectrum | |
| weighting function | |
| J | optimization functional |
| correlation coefficient used in optimization constraint on internal ISI | |
| m | number of expansion coefficients |
| N | number of data symbols |
| number of realizations for averaging EVM | |
| n | parameter which defines reduction rate of out-of-band emissions |
| number of pilot symbols | |
| number of receiver points on the map | |
| baseband signal | |
| number of samples per symbol | |
| T | time interval between transmitted symbols |
| pulse length | |
| RMS delay spread | |
| bandwidth containing 99% of signal energy | |
| bandwidth determined by the level of X dB of energy spectrum | |
| roll-off factor of RRC pulse | |
| complex-valued scaling coefficient |
References
- Ericsson. What Industry 4.0 Means for Manufacturing. 2019. Available online: https://www.ericsson.com/4ac650/assets/local/cases/customer-cases/2019/ericsson-tallinn-factory_case_study.pdf (accessed on 10 October 2025).
- Liu, T.; Tang, W.; Jiang, H. The design of industrial Ethernet adapter based on Ethernet/IP. In Proceedings of the 2009 4th International Conference on Computer Science & Education, Nanning, China, 25–28 July 2009; pp. 1239–1242. [Google Scholar] [CrossRef]
- Zhu, Z.-H.; Wang, Y.-E. The real-time technology research of industrial Ethernet in control field. In Proceedings of the 2010 International Conference on Mechanic Automation and Control Engineering, Wuhan, China, 26–28 June 2010; pp. 5274–5277. [Google Scholar] [CrossRef]
- Gong, Z.; Liu, B.; Yang, S.; Gui, X. Analysis of industrial ethernet’s reliability and realtime performance. In Proceedings of the 2009 8th International Conference on Reliability, Maintainability and Safety, Chengdu, China, 20–24 July 2009; pp. 1133–1136. [Google Scholar] [CrossRef]
- Drath, R.; Horch, A. Industrie 4.0: Hit or Hype? [Industry Forum]. IEEE Ind. Electron. Mag. 2014, 8, 56–58. [Google Scholar] [CrossRef]
- Varghese, A.; Tandur, D. Wireless requirements and challenges in Industry 4.0. In Proceedings of the 2014 International Conference on Contemporary Computing and Informatics (IC3I), Mysore, India, 27–29 November 2014; pp. 634–638. [Google Scholar] [CrossRef]
- Jiang, T.; Zhang, J.; Tang, P.; Tian, L.; Zheng, Y.; Dou, J.; Asplund, H.; Raschkowski, L.; D’Errico, R.; Jämsä, T. 3GPP Standardized 5G Channel Model for IIoT Scenarios: A Survey. IEEE Internet Things J. 2021, 8, 8799–8815. [Google Scholar] [CrossRef]
- Veedu, S.N.K.; Mozaffari, M.; Höglund, A.; Yavuz, E.A.; Tirronen, T.; Bergman, J.; Wang, Y.P.E. Toward Smaller and Lower-Cost 5G Devices with Longer Battery Life: An Overview of 3GPP Release 17 RedCap. IEEE Commun. Stand. Mag. 2022, 6, 84–90. [Google Scholar] [CrossRef]
- Hu, M.; Wang, J.; Cheng, W.; Zhang, H. Near-Optimal Piecewise Linear Companding Transform for PAPR Reduction of OFDM Systems. IEEE Trans. Broadcast. 2025, 71, 350–359. [Google Scholar] [CrossRef]
- Isam, S.; Darwazeh, I. Peak to average power ratio reduction in spectrally efficient FDM systems. In Proceedings of the 2011 18th International Conference on Telecommunications, Ayia Napa, Cyprus, 8–11 May 2011; pp. 363–368. [Google Scholar] [CrossRef]
- Falconer, D.; Ariyavisitakul, S.; Benyamin-Seeyar, A.; Eidson, B. Frequency domain equalization for single-carrier broadband wireless systems. IEEE Commun. Mag. 2002, 40, 58–66. [Google Scholar] [CrossRef]
- Wen, S.; Liu, G.; Liu, C.; Qu, H.; Zhang, L.; Imran, M.A. Joint Precoding and Pre-Equalization for Faster-Than-Nyquist Transmission Over Multipath Fading Channels. IEEE Trans. Veh. Technol. 2022, 71, 3948–3963. [Google Scholar] [CrossRef]
- Luo, X.; Yang, L.; Giannakis, G. Designing optimal pulse-shapers for ultra-wideband radios. In Proceedings of the IEEE Conference on Ultra Wideband Systems and Technologies, Reston, VA, USA, 16–19 November 2003; pp. 349–353. [Google Scholar] [CrossRef]
- Wu, X.; Tian, Z.; Davidson, T.; Giannakis, G. Optimal waveform design for UWB radios. IEEE Trans. Signal Process. 2006, 54, 2009–2021. [Google Scholar] [CrossRef]
- Zeng, D.; Annamalai, A.; Zaghloul, A. Pulse shaping filter design in UWB system. In Proceedings of the IEEE Conference on Ultra Wideband Systems and Technologies, Reston, VA, USA, 16–19 November 2003; pp. 66–70. [Google Scholar] [CrossRef]
- Dotlic, I.; Kohno, R. Design of the Family of Orthogonal and Spectrally Efficient UWB Waveforms. IEEE J. Sel. Top. Signal Process. 2007, 1, 21–30. [Google Scholar] [CrossRef]
- Nguyen Tan Hoang, P.; Gelgor, A. Optimization of Shaping Pulse by Spectral Mask to Enhance DVB-S2. In Internet of Things, Smart Spaces, and Next Generation Networks and Systems; Galinina, O., Andreev, S., Balandin, S., Koucheryavy, Y., Eds.; Springer: Cham, Switzerland, 2019; pp. 649–660. [Google Scholar] [CrossRef]
- Said, A.; Anderson, J. Bandwidth-efficient coded modulation with optimized linear partial-response signals. IEEE Trans. Inf. Theory 1998, 44, 701–713. [Google Scholar] [CrossRef]
- Wen, S.; Liu, G.; Chen, Q.; Qu, H.; Wang, Y. Optimal Precoding Based Spectrum Compression for Faster-Than-Nyquist Signaling. In Proceedings of the 2018 IEEE International Symposium on Broadband Multimedia Systems and Broadcasting (BMSB), Valencia, Spain, 6–8 June 2018; pp. 1–5. [Google Scholar] [CrossRef]
- Gelgor, A.; Gelgor, T. New Pulse Shapes for Partial Response Signaling to Outperform Faster-than-Nyquist Signaling. In Proceedings of the 2019 IEEE International Conference on Electrical Engineering and Photonics (EExPolytech), Saint Petersburg, Russia, 17–18 October 2019; pp. 144–148. [Google Scholar] [CrossRef]
- Makarov, S.B.; Liu, M.; Ovsyannikova, A.S.; Zavjalov, S.V.; Lavrenyuk, I.I.; Xue, W.; Qi, J. Optimizing the Shape of Faster-Than-Nyquist (FTN) Signals with the Constraint on Energy Concentration in the Occupied Frequency Bandwidth. IEEE Access 2020, 8, 130082–130093. [Google Scholar] [CrossRef]
- Yatsukova, K.; Orlova, A. Estimation of Signal Distortion in Industrial Scenario. In Proceedings of the 2024 International Conference on Electrical Engineering and Photonics (EExPolytech), Saint Petersburg, Russia, 17–18 October 2024; pp. 210–213. [Google Scholar] [CrossRef]
- Liu, M.; Xue, W.; Jia, P.; Makarov, S.B.; Li, B. Research on Spectrum Optimization Technology for a Wireless Communication System. Symmetry 2020, 12, 34. [Google Scholar] [CrossRef]
- Makarov, S.B.; Liu, M.; Ovsyannikova, A.S.; Zavjalov, S.V.; Lavrenyuk, I.; Xue, W.; Xu, Y. A reduction of peak-to-average power ratio based Faster-than-Nyquist quadrature signals for satellite communication. Symmetry 2021, 13, 346. [Google Scholar] [CrossRef]
- Zavjalov, S.V.; Volvenko, S.V.; Makarov, S.B. A Method for Increasing the Spectral and Energy Efficiency SEFDM Signals. IEEE Commun. Lett. 2016, 20, 2382–2385. [Google Scholar] [CrossRef]
- Liu, M.; Xue, W.; Gao, J.; Xu, Y.; Jia, P.; Chen, W. Optimized baseband Nyquist pulse-based PAPR reduction method for SEFDM systems. Telecommun. Syst. 2022, 81, 289–306. [Google Scholar] [CrossRef]
- Liu, M.; Xue, W.; Gao, J.; Jia, P.; Xu, Y.; Volvenko, S.V. Prototype Filter Design for Effectively Suppressing Out-of-Band Radiation in GFDM Systems. IEEE Commun. Lett. 2023, 27, 696–700. [Google Scholar] [CrossRef]
- Han, S.; Sung, Y.; Lee, Y.H. Filter Design for Generalized Frequency-Division Multiplexing. IEEE Trans. Signal Process. 2017, 65, 1644–1659. [Google Scholar] [CrossRef]
- Cebecioglu, B.B.; Mo, Y.K.; Dinh-van, S.; Evans, A.; Mi, D.; Higgins, M.D.; Abozariba, R.; Aneiba, A. Experimental Analysis of 5G NR for Indoor Industrial Environments. IEEE Access 2024, 12, 89310–89321. [Google Scholar] [CrossRef]
- TR 38.901 V15.1.0; Study on Channel Model for Frequencies from 0.5 to 100 GHz (Rel. 15). 3GPP: Sophia Antipolis, France, 2019. Available online: https://portal.3gpp.org/desktopmodules/Specifications/SpecificationDetails.aspx?specificationId=3173 (accessed on 10 October 2025).
- TR 38.901 V16.0; Study on Channel Model for Frequencies from 0.5 to 100 GHz (Rel. 16). 3GPP: Sophia Antipolis, France, 2019. Available online: https://portal.3gpp.org/desktopmodules/Specifications/SpecificationDetails.aspx?specificationId=3173 (accessed on 10 October 2025).
- Osa, J.; Björsell, N.; Val, I.; Mendicute, M. Measurement Based Stochastic Channel Model for 60 GHz Mmwave Industrial Communications. IEEE Open J. Ind. Electron. Soc. 2023, 4, 603–617. [Google Scholar] [CrossRef]
- Yun, Z.; Iskander, M.F. Ray Tracing for Radio Propagation Modeling: Principles and Applications. IEEE Access 2015, 3, 1089–1100. [Google Scholar] [CrossRef]
- Sheikh, M.U.; Ali, M.; Carpintero, G.; Ruttik, K.; Mutafangwa, E.; Jantti, R. Power Angular Measurements and Ray Tracing Simulations at Sub-THz Frequencies in Corridor. In Proceedings of the 2022 IEEE Wireless Communications and Networking Conference (WCNC), Austin, TX, USA, 10–13 April 2022; pp. 1587–1592. [Google Scholar] [CrossRef]
- Bhatia, G.S.; Corre, Y.; Di Renzo, M. Efficient Ray-Tracing Channel Emulation in Industrial Environments: An Analysis of Propagation Model Impact. In Proceedings of the 2023 Joint European Conference on Networks and Communications & 6G Summit (EuCNC/6G Summit), Gothenburg, Sweden, 6–9 June 2023; pp. 180–185. [Google Scholar] [CrossRef]
- Cho, Y.S. (Ed.) MIMO-OFDM Wireless Communications with MATLAB; IEEE Press: Hoboken, NJ, USA; John Wiley & Sons (Asia): Singapore, 2010. [Google Scholar]
- Panigrahi, S.R.; Bjorsell, N.; Bengtsson, M. Power Delay Profile investigation in Industrial Indoor Environments at the 24 GHz ISM band. In Proceedings of the 2022 IEEE International Conference on Industrial Technology (ICIT), Shanghai, China, 22–25 August 2022; pp. 1–6. [Google Scholar] [CrossRef]
- Mason, S.; Zimmermann, H. Electronic Circuits, Signals, and Systems; Wiley: New York, NY, USA, 1960. [Google Scholar]
- Yatsukova, K.; Orlova, A. Improving Energy Efficiency of Single-Frequency Signals in Industrial Scenario. In Proceedings of the 2024 International Conference on Electrical Engineering and Photonics (EExPolytech), Saint Petersburg, Russia, 17–18 October 2024; pp. 214–217. [Google Scholar] [CrossRef]
- TS 38.141-1 V18.2.0; NR; Base Station (BS) Conformance Testing; Part 1: Conducted Conformance Testing. 3GPP: Sophia Antipolis, France, 2023. Available online: https://portal.3gpp.org/desktopmodules/Specifications/SpecificationDetails.aspx?specificationId=3367 (accessed on 10 October 2025).
Disclaimer/Publisher’s Note: The statements, opinions and data contained in all publications are solely those of the individual author(s) and contributor(s) and not of MDPI and/or the editor(s). MDPI and/or the editor(s) disclaim responsibility for any injury to people or property resulting from any ideas, methods, instructions or products referred to in the content. |
© 2025 by the authors. Licensee MDPI, Basel, Switzerland. This article is an open access article distributed under the terms and conditions of the Creative Commons Attribution (CC BY) license (https://creativecommons.org/licenses/by/4.0/).