Abstract
The (3 + 1)-dimensional KdV–Calogero–Bogoyavlenskii–Schiff equation, a model that describes long-wave interactions and has numerous applications in mathematics, engineering, and physics, is examined in this work. First, a wave transformation is used to reduce the equation to lower dimensions. The modified Khater method is then used to derive different types of solitary wave solutions, such as chirped, kink, periodic, and kink-bright types. By allocating suitable constant parameters, 3D, 2D, and contour plots are created to demonstrate the physical behavior of these solutions. Phase portraits are used to qualitatively analyze the undisturbed planar system using bifurcation theory. The system is then perturbed by an external force, resulting in chaotic dynamics. Chaos in the system is confirmed using multiple diagnostic tools, including time series plots, Poincaré sections, chaotic attractors, return maps, bifurcation diagrams, power spectra, and Lyapunov exponents. The stability of the model is further investigated with varying initial conditions. A bidirectional scatter plot technique, which efficiently reveals overlapping regions using data point distributions, is presented for comparing solution behaviors. Overall, this work offers useful tools for advancing applied mathematics research as well as a deeper understanding of nonlinear wave dynamics.
1. Introduction
An essential element of contemporary mathematical and physical modeling, nonlinear evolution equations (NLEEs) explain how nonlinear systems change over time. They can be found in a variety of fields, including data science [1], deep learning [2], fluid dynamics [3], neuroscience [4], and image processing [5]. The development of various analytical techniques, such as the bilinear [6], auxiliary equation [7], long-wave limit (LWL) [8], Nucci’s reduction [9], generalized logistic equation [10], Darboux transform [11], trial function [12], Riemann–Hilbert [13], Bäcklund transformation [14], and modified Khater [15] methods, has been motivated by the need to find precise solutions to these equations.
In analytical research, one main emphasis is on obtaining soliton solutions to NLEEs. Solitary waves that are able to travel long distances without losing their form have long intrigued scientists, engineers, and mathematicians because of their interesting properties and vast number of possible applications. At the same time, the study of dynamical systems has been of significant interest to researchers in many fields because of their complex behaviors, including bifurcation phenomena and chaotic dynamics [16,17].
The qualitative behavior of several nonlinear systems has been studied by many investigators, some significant work examples of which are: Shallow water wave [18], advection diffusion reaction model [19], Wazwaz-Benjamin-Bona-Mahony model [20], prey–predator population model [21], and Davey Stewartson Kadomtsev Petviashvili model [22]. A newly proposed (3 + 1)-dimensional KdV–Calogero–Bogoyavlenskii–Schiff (KdV-CBS) equation was recently presented by Wazwaz [23], which models shallow wave propagation and fluid dynamics in diverse natural settings such as rivers and coastal regions. This equation has gained considerable attention for its broad applications in the fields of mathematics and engineering.
Here, , with , and m being undetermined parameters. Equation (1) represents a generalized KdV–CBS-type nonlinear model that describes the interaction between nonlinear and dispersive effects in multidimensional media. The time-derivative term in Equation (1) defines the evolutionary nature of the model, governing how the wave amplitude changes over time under the combined effects of dispersion and nonlinearity [24]. These models are frequently used to explain nonlinear wave dynamics in fluid mechanics, shallow-water, and plasma physics [25,26,27]. The coefficients and quantify higher-order dispersion along different spatial directions, while and m represent nonlinear coupling strengths. Hence, Equation (1) serves as a flexible physical model for exploring nonlinear wave interactions and energy localization across different physical settings.
1.1. Literature Review
Several researchers have employed diverse methods to study the KdV-CBS in various dimensions. Wazwaz [23] formulated Equation (1) and assessed its integrability using the Painlevé test. Additionally, multi-wave solitons were constructed using the simplified Hirota technique. Lump and localized waves of Equation (1) are obtained using a symbolic computation approach. Furthermore, multiple solitons in complex form are derived by employing Hirota’s direct method along with the long-wave approximation technique [25]. Zhou et al. [26] employed the truncated Painlevé test to derive a series of auto-Bäcklund transformations, and also obtained multi-wave soliton solutions. In [27], a new general bilinear Bäcklund transformation, Lax pair, and conservation laws for Equation (1) are derived using the theory of binary Bell polynomials. It is also demonstrated that the equation is completely integrable in the Lax pair framework. Various types of mixed solutions are constructed through a combination of the homoclinic test approach. By modifying its coefficients, Equation (1) is transformed into various NLEEs, each exhibiting distinct physical characteristics.
1.2. Research Gaps and Contributions
Although substantial progress has been made in exploring soliton dynamics related to Equation (1), a significant gap persists in the application of thorough dynamical system analysis techniques. An overview of the work conducted previously on the KdV-CSS model shows that wave solutions have not been obtained by using the MKM. As indicated in Table 1, though some analytical methods were used in different systems by previous studies, they do not provide a comprehensive analysis involving all the necessary tools.

Table 1.
Evaluation of various analytical tools covered in the literature.
To bridge this gap in the existing studies, the main contributions of this paper are therefore detailed as follows: The KdV-CSS equation has been studied from different perspectives. In the first place, we use MKM to construct solitary waves as presented in [15]. The choice of this method is because it is simple, practical, and dependable for obtaining analytical solutions of NLEEs. Although there exist a number of extensions and alternative forms of the Khater method in literature, a modified form is adopted here which gives more freedom toward finding exact analytical solutions. This version of the method is best suited to derive an extensive set of nonlinear wave patterns through the possibility of introducing auxiliary constraints and nonlinear functional expansions within one unified analytical framework.
Next, the dynamics of the KdV-CSS model were examined by means of a qualitative analysis as discussed in [31]. In order to analyze the unpredictable dynamics of this system, numerical simulations were conducted with the help of a fourth-order Runge-Kutta integration scheme. A broad array of methods for identifying chaos were used that included:
- Three-dimensional phase portraits (3D PP);
- Two-dimensional phase portraits (2D PP);
- Poincaré maps (PM);
- Time series graphs (TSG);
- Multistability analysis (MA);
- Chaotic attractor (CA);
- Iterative return mapping (IRM);
- Power spectrum (PS);
- Bifurcation diagram (BD);
- Lyapunov exponent (LE).
Table 1 provides a comparative view with previous research works highlighting the novelty aspects and unique contributions being carried out in the present work.
The paper is organized as follows, as displayed in Figure 1. The MKM is introduced in Section 2, and the soliton solutions are derived in Section 3. A thorough phase portrait analysis is presented in Section 5, while the physical interpretation of the results is covered in Section 4. In Section 6, the model’s chaotic and irregular behavior is examined, and in Section 7, the bidirectional scatter plot method is used to highlight overlaps among various solutions. The paper concludes with final remarks in the Conclusion section. Layout is shown in the Figure 1.
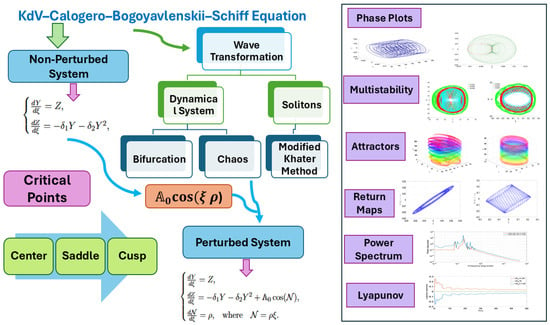
Figure 1.
Layout of the Paper.
2. Description of an Analytical Method
We use MKM [15], an effective analytical method that is ideal for dealing with NLEEs, to obtain wave solutions for the suggested model. A detailed explanation of the methodology is given below.
- (Step 1): Consider a nth order general PDE.
In this case, H represents a polynomial expression containing the unknown function .
- (Step 2): The governing PDE in Equation (1) is reduced to the following ODE by using the wave transformation , where .
- (Step 3): The following functional form is assumed for the solution of Equation (6):where are random constants, respectively. The function satisfies the following equation.
The condition is imposed, with , and denoting arbitrary constants. The discriminant of this equation is given by:
This definition of is used consistently throughout the subsequent derivations and determines the nature of the resulting wave solutions. Specifically, corresponds to hyperbolic-type solitons, yields rational-type solutions, and leads to trigonometric-type wave structures.
- (Step 4): Balancing techniques have been used to determine the value of n by comparing the highest-order derivative with the powers of nonlinear terms in the ODE. The value of j remains positive throughout.
- (Step 5): Upon substituting Equations (7) and (8) into Equation (6) and setting the coefficients of to zero, a solvable system of algebraic equations for is obtained. The system is solved using Maple. By substituting the resulting values together with Equation (8) and the wave transformation into Equation (1), the corresponding analytical solutions of Equation (1) are obtained.
3. Application of an Analytical Approach
The extended wave equation in (3 + 1) dimensions, known as the KdV–CBS equation, be formulated as:
By applying the traveling wave transformation:
In this regard, the traveling wave’s characteristics are described by and indicates its speed. The parameters are treated as wave number in and z directions. We get the resultant ODE by replacing the wave transformation in Equation (9).
By integrating Equation (11) with respect to , we acquire
Here, is the constant of integration, which is set to zero for simplicity under the assumption of localized wave solutions [32]. By choosing , Equation (12) becomes:
where, , , and . Next, we will obtain the wave solutions of Equation (12).
Traveling Wave Solutions
This section addresses the application of the MKM for the extraction of analytical solutions. Balancing the nonlinear term and the highest derivative term in Equation (12) yields . The initial solution in this case is as follows.
Substituting the above values into Equation (14) and applying the transformation defined in Equation (10), the resulting solutions for Equation (1) are obtained as follows. The classification of these analytical solutions is governed by the discriminant and by the sign combinations of , , and , which determine the qualitative behavior of the auxiliary function in Equation (8).
- Case 1: If then,
- Case 2: If then,
- Case 3: If and then,
- Case 4: If then,
- Case 5: If then,
- Case 6: If then,
- Case 7: If then,
- Case 8: If , then,
- Case 9: If then,
- Case 10: If then,
- Case 11: If and then,
- Case 12: If then,
Here, the trigonometric and hyperbolic functions are discussed below:
4. Physical Interpretation and Discussion of the Results
Four primary nonlinear wave forms—kink, periodic, kink–bright, and chirped solitons—are revealed by the analytical and graphical results produced by the modified Khater method. Because nonlinearity and dispersion are balanced, each pattern exhibits unique nonlinear dynamics.
A kink soliton is a front-like wave created by a smooth transition between two constant states. A periodic soliton mimics a recurring pattern of wave crests and troughs and displays regular, continuous oscillations. A kink–bright soliton, which combines a kink background with a sharp localized peak, reflects the interaction between large- and small-scale wave features. A localized pulse with a relationship between wave amplitude and phase, as well as a frequency variation along its profile as a result of phase modulation, is called a chirped soliton.
When combined, these structures demonstrate how the system can sustain periodic and localized waves under various dispersive and nonlinear effects. Physically, periodic solitons correlate to coherent oscillations, chirped solitons occur in optical communication and energy-transport systems, and kink and kink–bright solitons describe front propagation and density changes in fluids and plasmas. The dynamics of Equation (1) are visualized by the contour, 2D, and 3D plots. Four regimes are depicted in Figure 2, Figure 3, Figure 4 and Figure 5:
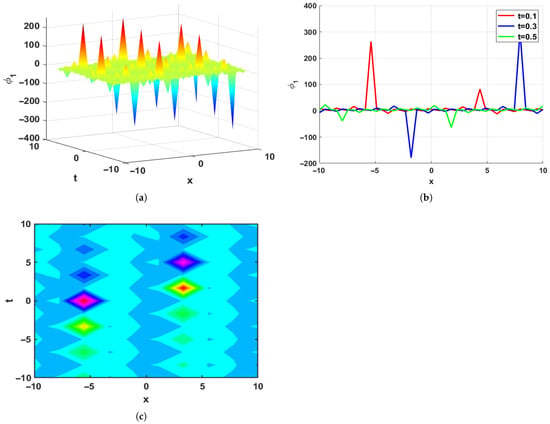
Figure 2.
Visualization of the solution , displaying periodic soliton under the parameter value , , , , and . (a) 3D Plot. (b) 2D Plot. (c) Contour Plot.
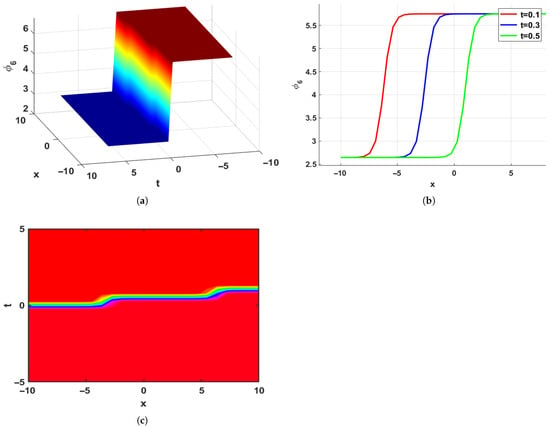
Figure 3.
Visualization of the solution , displaying kink type solitons under the parameter value , , , , and . (a) 3D Plot. (b) 2D Plot. (c) Contour Plot.
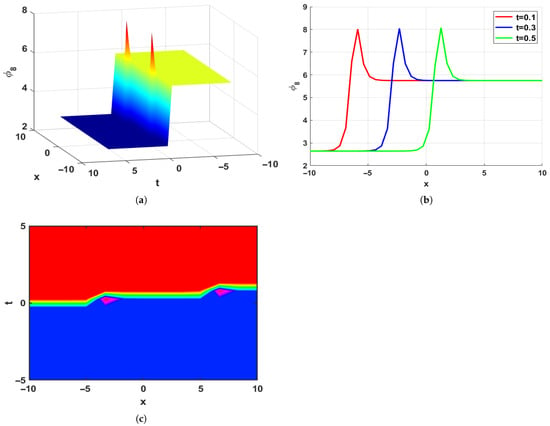
Figure 4.
Visualization of the solution , displaying bright-kink soliton under the parameter value , , , , and . (a) 3D Plot. (b) 2D Plot. (c) Contour Plot.
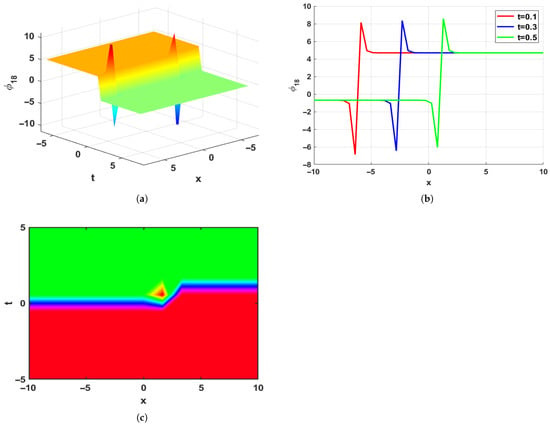
Figure 5.
Visualization of the solution , displaying chirped soliton solitons under the parameter value , , , , and . (a) 3D Plot. (b) 2D Plot. (c) Contour Plot.
- (i)
- Sharp kink or kink-bright forms are produced by strong nonlinearity;
- (ii)
- Extended periodic waves are produced by dominant dispersion;
- (iii)
- Modulated or chirped pulses are produced by combined effects;
- (iv)
- Symmetrical structures are created by symmetric coefficients.
These patterns show how adaptable the system is and how it can display a variety of nonlinear wave behaviors.
5. Phase Portraits and System Dynamics
A bifurcation is a qualitative shift in the behavior of the trajectories that happens when the system parameters are modified in a differential equation system. By letting in Equation (13), the associated planar system can be formulated as follows:
where , and . The Hamiltonian corresponding to Equation (28) can be written as:
which satisfies
As a starting point, the analysis involves locating the equilibrium points of system Equation (28) by setting and , which gives two points based on the chosen parameters.
Moreover, the Jacobian associated with system Equation (28) is given by:
The corresponding eigenvalues of the Jacobian are obtained from its characteristic equation and are given by:
The classification of the equilibrium points is presented in Table 2.

Table 2.
Classification of Equilibrium Points.
Adjusting the parameters as , the corresponding results are derived and displayed below in Table 3 and Figure 6 and Figure 7.

Table 3.
Overview of equilibrium points, and categorizations for various scenarios.
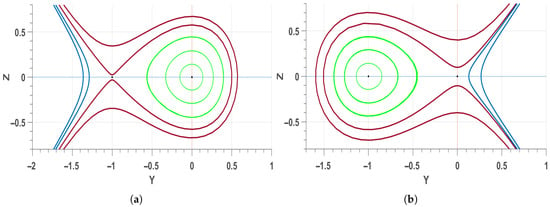
Figure 6.
Phase plots for the system Equation (28), when (a) , and , (b) , and .
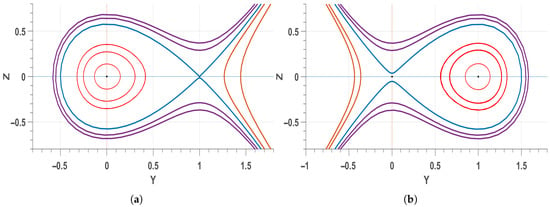
Figure 7.
Phase plots for the system Equation (28), when (a) , and , (b) , and .
6. Chaotic Phenomena
Chaotic dynamics arise when deterministic systems exhibit irregular behavior. To study this in Equation (1), the system Equation (28) is modified by adding a periodic forcing term, , as follows:
In this study, chaotic dynamics were detected using several well-established methods from previous research [31]. A summary of the main techniques used in the analysis is provided below.
6.1. Phase Space Analysis and Poincaré Section Mapping
A phase plot offers a 3D view of the system’s phase space, showing how state variables evolve over time. It helps identify various motion types, including chaotic behavior, as summarized in Table 4. Figure 8 and Figure 9 present the phase plots and time series of system Equation (31) for different values of , , and other parameters.

Table 4.
Classification of Motion Types Based on Phase Portrait Features.
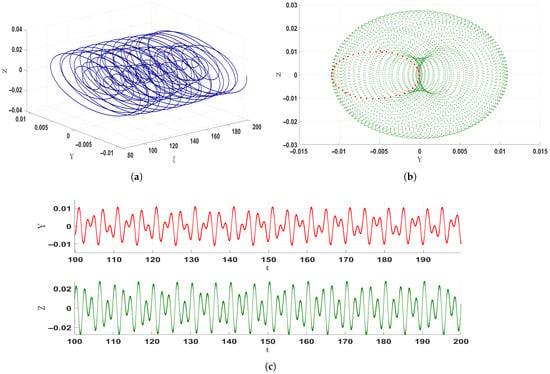
Figure 8.
Visualization of chaotic dynamics in system Equation (31): (a) three-dimensional phase portrait, (b) two-dimensional projection with the Poincaré section presented in red, and (c) time series graph. The analysis is based on the parameter set: , , , and .
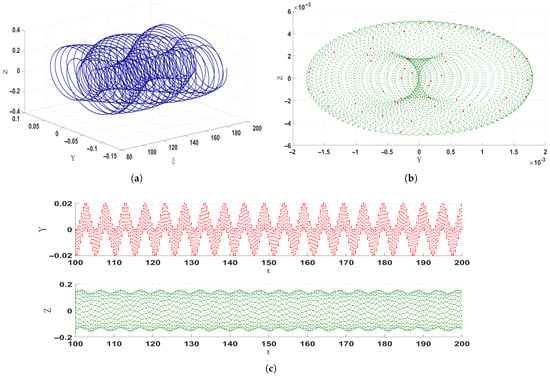
Figure 9.
Visualization of chaotic dynamics in system Equation (31): (a) three-dimensional phase portrait, (b) two-dimensional projection with the Poincaré section presented in red, and (c) time series graph. The analysis is based on the parameter set: , , , and .
To further examine irregular dynamics, Poincaré sections are used. These provide discrete snapshots of the phase space, where periodic motion appears as orderly points, while chaotic motion forms scattered, irregular patterns. In Figure 8b, the red closed curve signifies quasi-periodic behavior, while the red scattered points in Figure 9b confirm the emergence of chaos.
6.2. Multistability
Multistability refers to the presence of various stable states that can exist simultaneously in a nonlinear dynamical system, depending on the initial conditions, even when the system parameters remain unchanged. In the current analysis, four return maps are used to investigate this phenomenon by tracking system trajectories from three different initial states: (green), (red), and (cyan). The parameters and are varied for each subplot, as specified below the corresponding diagrams, to highlight how initial conditions influence the system’s dynamic response.
The green, red, and cyan trajectories in Figure 10a exhibit periodic motion, creating smooth closed loops that signify steady oscillations. The motion becomes quasi-periodic in Figure 10b, indicating increased sensitivity to initial conditions and parameters. Figure 10c,d show chaotic behavior, where the unpredictable nature of chaos is revealed by overlapping and densely packed paths. These findings demonstrate the rich multistability of nonlinear dynamics by demonstrating how slight modifications to initial values or parameters can change the system’s evolution.
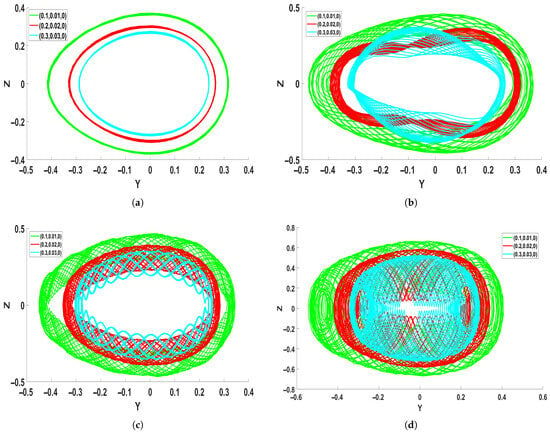
Figure 10.
Examination of chaotic behavior in system Equation (31) via multistability diagrams, employing the parameters and . (a) = 0.01 and = 0.1. (b) = 0.1 and = 1.5. (c) = 0.5 and . (d) = 1.5 and .
6.3. Iterative Return Map
A basic analytical method for examining how time delays affect system dynamics is the return map. One can learn a lot about the system’s temporal evolution by graphing the values of against for different delay values . Figure 11 demonstrates this relationship for four selected delay values: , , , and , with system parameters held constant at and initial conditions specified as .
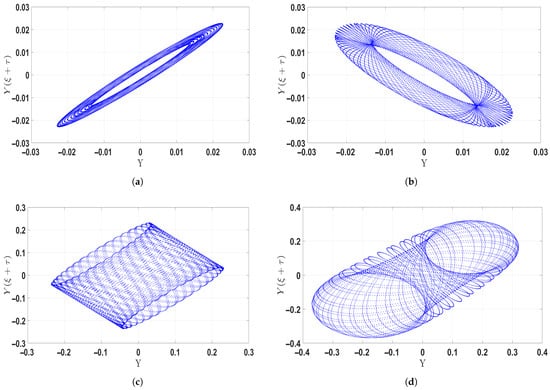
Figure 11.
Return map analysis illustrating chaotic dynamics in system Equation (31) for parameter settings and . (a) For (b) For . (c) For . (d) For .
As the delay parameter is raised, the system makes an evident transition into chaotic behavior from periodic behavior. When , very minor irregularities start appearing on the return map, showing the start of nonlinear effects and small deviations from periodic motion. When , the trajectories become more entangled, showing stronger nonlinearities and higher sensitivity to initial conditions, which lead to the formation of chaotic tendencies. At , the return map is very densely filled with overlapping and irregular trajectories, typical of a completely chaotic regime in which the system is highly sensitive to initial conditions and has fractal-like properties. In general, smaller values of preserve stability, while larger delays increase instability and complexity, propelling the system toward complete chaos.
6.4. Lyapunov Exponent
Lyapunov exponents (LEs) measure how quickly nearby trajectories in a system diverge, revealing its chaotic behavior. In this study, LEs were calculated using the Wolf algorithm with Gram-Schmidt orthogonalization for precision. They indicate system stability and sensitivity to initial conditions—where a positive LE confirms chaos. The following formulation defines the dynamical system used for calculating the LEs:
The Jacobian matrix takes the form:
The Jacobian matrix associated with the system is given by:
Subsequently, is subtracted from Jacobian, where I is the identity matrix and stands for the eigenvalue.
By evaluating the determinant , the result is as follows:
Since two eigenvalues of the system have equal magnitudes but opposite signs, their corresponding LEs show mirrored behavior. As remains zero, the analysis focuses on and . Figure 12 shows the time evolution of the LEs for two parameter sets under identical initial conditions.
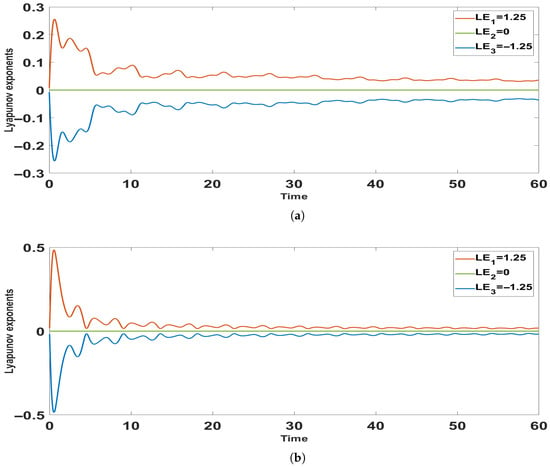
Figure 12.
Investigation of chaotic behavior in system Equation (31) using Lyapunov exponents under two parameter configurations: (a) and (b) .
For and the initial state , Figure 12a illustrates that when , and fluctuate near zero before diverging— stabilizes at a positive value while settles at an equal negative one. In the second case, with , Figure 12b shows that both exponents initially oscillate but later converge in opposite directions: one positive, one negative. The coexistence of one positive, one negative, and one zero LE confirms the presence of chaos in the system.
6.5. Strange Attractors
The chaotic attractors generated by the planar system for various initial values and parameters are shown in Figure 13. Each subplot highlights the system’s response to initial conditions, showcasing a variety of intricate, constrained, and chaotic paths.
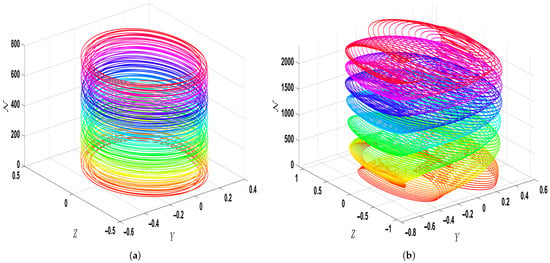
Figure 13.
Strange attractors illustrating chaotic dynamics in system Equation (31) for parameter settings and . (a) and (b) .
Figure 13a depicts strange attractors for with initial condition , exhibiting a multi-loop structure indicative of quasi-periodic behavior. However, Figure 13b, with and adjusted parameters , displays attractors with closely packed loops and overlapping trajectories, emphasizing the high degree of unpredictability and chaotic dynamics. The complex attractor geometry highlights how sensitive the system is to initial values, leading to nonlinear behavior.
6.6. Power Spectrum
Power spectrum analysis gives important information about how energy is distributed in terms of frequency within the system and aids in recognizing chaotic dynamics. An irregular, wide spectrum shows an aperiodic and sensitive motion characteristic of chaos, whereas narrow peaks represent periodic motion. Placing the axes logarithmically, the analysis shows how initial conditions under the parameter set influence the resulting energy distribution. Figure 14a plots two initial conditions, (blue) and (orange), the only difference being in . At low frequencies (–), the two curves both reflect weak power, with the blue one slightly higher. In the mid-frequency range (–), both oscillate, with the blue curve reflecting stronger peaks. At higher frequencies (–), power decreases gradually for both cases.
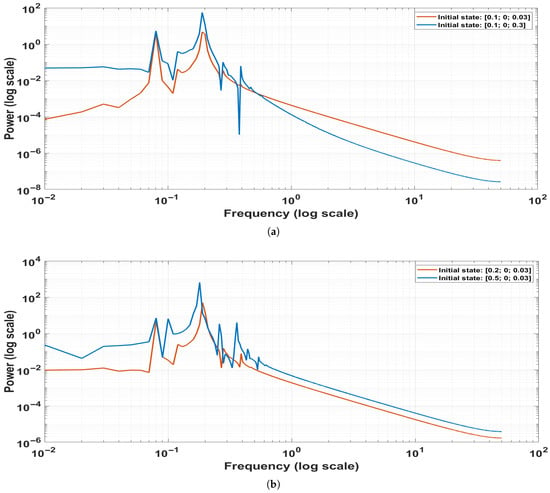
Figure 14.
Power spectrum analysis illustrating chaotic dynamics in system Equation (31) for parameter settings , , , and . (a) (blue) and (orange) and (b) (orange) and (blue).
Also, Figure 14b shows the spectra for (orange) and (blue), with only Y changed. Both have low power at low frequency, with the blue one varying slightly more. Both have mid-frequency fluctuations and then a smooth decline in power at higher frequencies.
In general, the continuous reduction of power with increasing frequency and the broadband, aperiodic character of the spectra verify the occurrence of chaos. Energy is spread out in a broad range of frequency, and this is an indicator of strong sensitivity to initial conditions and the simultaneous existence of several dynamic states.
6.7. Bifurcation Diagram
A bifurcation diagram shows how the dynamics of a dynamical system evolve as a control parameter is changed. In a perturbed plane system, the parameter usually denotes the magnitude of the perturbation. By looking at the bifurcation diagram, various dynamical regimes like steady states, periodic oscillations (limit cycles), and chaotic motion can be determined. Figure 15 presents the bifurcation diagram of the perturbed system Equation (31), plotted as Y versus Z with the parameters , , , and . The diagram exhibits irregular and complex patterns, indicating the presence of chaotic dynamics.
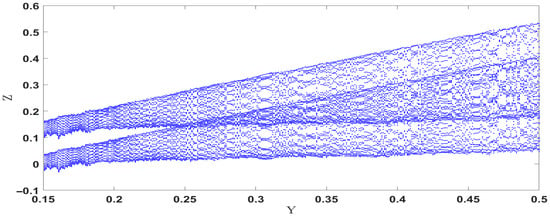
Figure 15.
Investigation of chaotic behavior in system Equation (31) using bifurcation diagram.
7. Analysis of Solution Overlaps
Using data points, this section plots the behaviors of different wave solutions against one another to show how they interact and share traits. The information tells us where the solutions start to diverge and where they possess similar features. Using specific parameter sets and selected temporal and spatial intervals, four soliton solutions—, , , and —are examined. Different data points are produced for each scenario by carefully adjusting these parameters in addition to the coordinates . The main goal is to investigate whether solutions with different spatial distributions behave similarly when given particular parameter values.
- Solution 1:with parameters , , , , , , , .
- Solution 2:with parameters , , , , , , , .
- Solution 3:with parameters , , , , , , , .
- Solution 4:with parameters , , , , , , , .
The spatial variables are defined within the ranges , , and , with step sizes , , and . These pairs produce a set of data points for each solution, enabling comparison of their overlapping and non-overlapping behaviors in different spatial regions. To display such comparisons, bidirectional scatter plots are given in Figure 16a,b, illustrating how the soliton solutions interact and differ in different spatial–temporal domains.
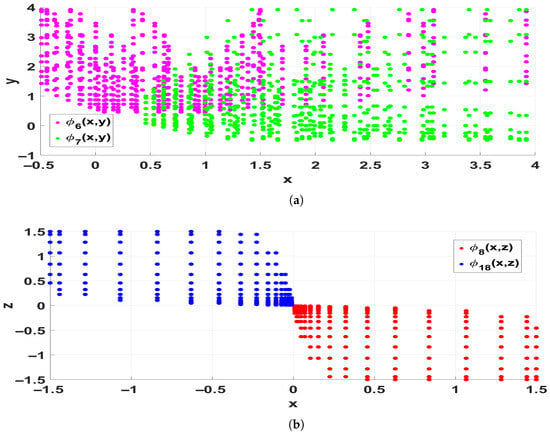
Figure 16.
Comparison of soliton solution behaviors based on data point distribution: (a) Scatter plot comparing and in -plane. (b) Scatter plot comparing and in -plane.
- Figure 16a: compares and , both with the same parameters. Magenta points indicate , and green points indicate . There seems to be strong overlap in the range and , where they have the same amplitude patterns. Outside this range, their behavior differs because of the different hyperbolic components in their representations—tanh for and coth for . Therefore, penetrates deeper into areas where rapidly falls.
- Figure 16b: indicates the comparison of (red) and (blue). The two solutions overlap near and , exhibiting similar distributions. Outside this region, because of their different functional structures— consists of tanh and sech terms scaled by , whereas consists of a more involved root form with and —the two solutions deviate. Consequently, extends further along the negative x-axis, while is clustered in the positive realm.
In total, these results demonstrate how even structurally dissimilar solutions might share transitional commonalities in particular regions. Outside of these overlap regions, however, each solution has a distinctive dynamic behavior, determined by its mathematical nature and parameters.
8. Conclusions
The (3 + 1)-dimensional KdV–CBS equation, a nonlinear model that describes long-wave interactions with applications in engineering and physics, is examined in this work. The modified Khater method (MKM) was used to derive analytical soliton solutions after the equation was reduced to a lower-dimensional form using an appropriate wave transformation. Plots in three dimensions, two dimensions, and contours (Figure 2, Figure 3, Figure 4 and Figure 5) show different nonlinear structures, such as chirped, periodic, kink, and kink–bright solitons, with symmetric amplitude patterns that are in line with the inherent symmetry of the system.
Transitions between stable and unstable regimes were confirmed by bifurcation analysis around equilibrium points (Figure 6 and Figure 7). The RK4 scheme and several nonlinear diagnostic tools, such as phase portraits, Poincaré sections, time series, chaotic attractors, multistability plots, iterative return maps, bifurcation diagrams, power spectra, and Lyapunov exponents, were used to analyze the system’s irregular and chaotic dynamics under external perturbations (Figure 8, Figure 9, Figure 10, Figure 11, Figure 12, Figure 13, Figure 14 and Figure 15). A bidirectional scatter plot approach (Figure 16) was used to quantitatively highlight the overlaps and differences between soliton profiles and to further compare them.
Providing a unified analytical–numerical framework for investigating both stable and chaotic behaviors in nonlinear multidimensional systems was the primary driving force behind the work. The MKM offers greater flexibility than traditional methods and produces compact, accurate, and physically meaningful solutions that directly satisfy the original equation. Overall, this work advances our understanding of complex dynamics, energy localization, and nonlinear wave propagation by making methodological and conceptual contributions to soliton theory and nonlinear dynamics.
Author Contributions
Conceptualization, S.S.K. and M.B.R.; methodology, S.S.K.; software, S.S.K.; validation, S.S.K. and M.B.R.; formal analysis, S.S.K. and M.B.R.; investigation, S.S.K.; data curation, S.S.K. and M.B.R.; writing—original draft preparation, S.S.K.; writing—review and editing, S.S.K. and M.B.R.; visualization, F.Z.D.; supervision, M.B.R.; Funding, F.Z.D.; project administration; F.Z.D. All authors have read and agreed to the published version of the manuscript.
Funding
This work was supported by the Ongoing Research Funding Program (ORF-2025-535), King Saud University, Riyadh, Saudi Arabia.
Data Availability Statement
Upon reasonable request, the corresponding author will provide all data generated or analyzed during this study. No proprietary or restricted data were used.
Acknowledgments
This work was supported by the Ongoing Research Funding Program (ORF-2025-535), King Saud University, Riyadh, Saudi Arabia.
Conflicts of Interest
The authors declare no conflicts of interest.
References
- Rudy, S.H.; Brunton, S.L.; Proctor, J.L.; Kutz, J.N. Data-driven discovery of partial differential equations. Sci. Adv. 2017, 3, e1602614. [Google Scholar] [CrossRef]
- Sirignano, J.; MacArt, J.F.; Freund, J.B. DPM: A deep learning PDE augmentation method with application to large-eddy simulation. J. Comput. Phys. 2020, 423, 109811. [Google Scholar] [CrossRef]
- Kazmi, S.S.; Riaz, M.B.; Jhangeer, A. Integrating data overlaps and nonlinear dynamics: A novel approach to the Davey-Stewartson system in optical fluid model. Ain Shams Eng. J. 2025, 16, 103420. [Google Scholar] [CrossRef]
- Gonzalez-Gaxiola, O.; Biswas, A.; Moraru, L.; Alghamdi, A.A. Solitons in Neurosciences by the Laplace–Adomian Decomposition Scheme. Mathematics 2023, 11, 1080. [Google Scholar] [CrossRef]
- Wu, Q. Research on deep learning image processing technology of second-order partial differential equations. Neural Comput. Appl. 2023, 35, 2183–2195. [Google Scholar] [CrossRef]
- Yuan, R.R.; Shi, Y.; Zhao, S.L.; Zhao, J.X. The combined KdV-mKdV equation: Bilinear approach and rational solutions with free multi-parameters. Results Phys. 2023, 55, 107188. [Google Scholar] [CrossRef]
- Kazmi, S.S.; Jhangeer, A.; Raza, N.; Alrebdi, H.I.; Abdel-Aty, A.H.; Eleuch, H. The analysis of bifurcation, quasi-periodic and solitons patterns to the new form of the generalized q-deformed Sinh-Gordon equation. Symmetry 2023, 15, 1324. [Google Scholar] [CrossRef]
- Ying, L.; Li, M.; Shi, Y. New exact solutions and related dynamic behaviors of a (3 + 1)-dimensional generalized Kadomtsev–Petviashvili equation. Nonlinear Dyn. 2024, 112, 11349–11372. [Google Scholar] [CrossRef]
- Hashemi, M.S.; Gulsen, S.; Inc, M.; Aslan, E.C. Analytical treatment with the Nucci reduction technique on the p-forced nonlinear Klein–Gordon equation. Opt. Quantum Electron. 2024, 56, 34. [Google Scholar] [CrossRef]
- Riaz, M.B.; Jhangeer, A.; Kazmi, S.S. Optical soliton stability in zig-zag optical lattices: Comparative analysis through two analytical techniques and phase portraits. Nonlinear Dyn. 2024, 112, 22221–22243. [Google Scholar] [CrossRef]
- Li, Y.; Li, J.; Wang, R. Darboux transformation and soliton solutions for nonlocal Kundu-NLS equation. Nonlinear Dyn. 2023, 111, 745–751. [Google Scholar] [CrossRef]
- Sucu, N.; Ekici, M.; Biswas, A. Stationary optical solitons with nonlinear chromatic dispersion and generalized temporal evolution by extended trial function approach. Chaos Solitons Fractals 2021, 147, 110971. [Google Scholar] [CrossRef]
- Ma, W.X. Riemann–Hilbert problems and inverse scattering of nonlocal real reverse-spacetime matrix AKNS hierarchies. Phys. D Nonlinear Phenom. 2022, 430, 133078. [Google Scholar] [CrossRef]
- Wu, H.; Chen, Q.; Song, J. Bäcklund transformation, residual symmetry and exact interaction solutions of an extended (2 + 1)-dimensional Korteweg–de Vries equation. Appl. Math. Lett. 2022, 124, 107640. [Google Scholar] [CrossRef]
- Khater, M.; Anwar, S.; Tariq, K.U.; Mohamed, M.S. Some optical soliton solutions to the perturbed nonlinear Schrödinger equation by modified Khater method. AIP Adv. 2021, 11, 025130. [Google Scholar] [CrossRef]
- Saha, A.; Tamang, J. Effect of q-nonextensive hot electrons on bifurcations of nonlinear and supernonlinear ion-acoustic periodic waves. Adv. Space Res. 2019, 63, 1596–1606. [Google Scholar] [CrossRef]
- Abbas, N.; Hussain, A.; Khan, A.; Abdeljawad, T. Bifurcation analysis, quasi-periodic and chaotic behavior of generalized Pochhammer-Chree equation. Ain Shams Eng. J. 2024, 15, 102827. [Google Scholar] [CrossRef]
- Rafiq, M.H.; Raza, N.; Jhangeer, A. Dynamic study of bifurcation, chaotic behavior and multi-soliton profiles for the system of shallow water wave equations with their stability. Chaos Solitons Fractals 2023, 171, 113436. [Google Scholar] [CrossRef]
- Tariq, M.M.; Riaz, M.B.; Kazmi, S.S.; Aziz-ur-Rehman, M. Unveiling chaos and stability in advection diffusion reaction systems via advanced dynamical and sensitivity analysis. Sci. Rep. 2025, 15, 5513. [Google Scholar] [CrossRef] [PubMed]
- Ullah, M.S.; Ali, M.Z.; Roshid, H.O. Bifurcation, chaos, and stability analysis to the second fractional WBBM model. PloS ONE 2024, 19, e0307565. [Google Scholar] [CrossRef] [PubMed]
- Al-Kaff, M.O.; El-Metwally, H.A.; Elsadany, A.E.A.; Elabbasy, E.M. Exploring chaos and bifurcation in a discrete prey–predator based on coupled logistic map. Sci. Rep. 2024, 14, 16118. [Google Scholar] [CrossRef]
- Talafha, A.M.; Jhangeer, A.; Kazmi, S.S. Dynamical analysis of (4 + 1)-dimensional Davey Srewartson Kadomtsev Petviashvili equation by employing Lie symmetry approach. Ain Shams Eng. J. 2023, 14, 102537. [Google Scholar] [CrossRef]
- Wazwaz, A.M. Two new Painlevé integrable KdV–Calogero–Bogoyavlenskii–Schiff (KdV-CBS) equation and new negative-order KdV-CBS equation. Nonlinear Dyn. 2021, 104, 4311–4315. [Google Scholar] [CrossRef]
- Duran, S. Analysis of Physical Processes of the Kudryashov-Sinelshchikov Equation with Variable Coefficients. Int. J. Theor. Phys. 2025, 64, 139. [Google Scholar] [CrossRef]
- Ali, K.K.; Yilmazer, R.; Osman, M.S. Dynamic behavior of the (3 + 1)-dimensional KdV–Calogero–Bogoyavlenskii–Schiff equation. Opt. Quantum Electron. 2022, 54, 160. [Google Scholar] [CrossRef]
- Zhou, T.Y.; Tian, B.; Shen, Y.; Gao, X.T. Auto-Bäcklund transformations and soliton solutions on the nonzero background for a (3 + 1)-dimensional Korteweg-de Vries-Calogero-Bogoyavlenskii-Schif equation in a fluid. Nonlinear Dyn. 2023, 111, 8647–8658. [Google Scholar] [CrossRef]
- Han, P.F.; Zhang, Y. Investigation of shallow water waves near the coast or in lake environments via the KdV–Calogero–Bogoyavlenskii–Schiff equation. Chaos Solitons Fractals 2024, 184, 115008. [Google Scholar] [CrossRef]
- Wazwaz, A.M. Single and multiple-soliton solutions for the (2 + 1)-dimensional KdV equation. Appl. Math. Comput. 2008, 204, 20–26. [Google Scholar] [CrossRef]
- Toda, K.; Yu, S.J. The investigation into the Schwarz–Korteweg–de Vries equation and the Schwarz derivative in (2 + 1) dimensions. J. Math. Phys. 2000, 41, 4747–4751. [Google Scholar] [CrossRef]
- Peng, Y.Z. A new (2 + 1)-dimensional KdV equation and its localized structures. Commun. Theor. Phys. 2010, 54, 863. [Google Scholar] [CrossRef]
- Hosseini, K.; Hinçal, E.; Ilie, M. Bifurcation analysis, chaotic behaviors, sensitivity analysis, and soliton solutions of a generalized Schrödinger equation. Nonlinear Dyn. 2023, 111, 17455–17462. [Google Scholar] [CrossRef]
- Duran, S. Travelling wave solutions and simulation of the Lonngren wave equation for tunnel diode. Opt. Quantum Electron. 2021, 53, 458. [Google Scholar] [CrossRef]
Disclaimer/Publisher’s Note: The statements, opinions and data contained in all publications are solely those of the individual author(s) and contributor(s) and not of MDPI and/or the editor(s). MDPI and/or the editor(s) disclaim responsibility for any injury to people or property resulting from any ideas, methods, instructions or products referred to in the content. |
© 2025 by the authors. Licensee MDPI, Basel, Switzerland. This article is an open access article distributed under the terms and conditions of the Creative Commons Attribution (CC BY) license (https://creativecommons.org/licenses/by/4.0/).