Abstract
Rockburst is a complex phenomenon of dynamic instability in the underground excavation of rock. Owing to the complex and unclear rockburst mechanism, it is difficult to accurately predict and reasonably assess the rockburst potential. With the increasing availability of case histories from rock engineering and the advancement of data science, the data mining algorithms provide a good way to predict complex phenomena, like rockburst potential. This paper investigates the potential of J48 and random tree algorithms to predict the rockburst classification ranks using 165 cases, with four parameters, namely maximum tangential stress of surrounding rock, uniaxial compressive strength, uniaxial tensile strength, and strain energy storage index. A comparison of developed models’ performances reveals that the random tree gives more reliable predictions than J48 and other empirical models (Russenes criterion, rock brittleness coefficient criterion, and artificial neural networks). Similar comparisons with convolutional neural network resulted at par performance in modeling the rockburst hazard data.
1. Introduction
During underground operations, rockburst is a sudden and violent release of elastic energy stored in rock and coal masses. This causes rock fragments to eject, potentially causing injury, collapse, and deformation of supporting structures, as well as damage to facilities [1,2,3]. Related activity occurs in open cuts in the mass of the joint rock [4,5]. For both the civil and mining engineering industries, its economic consequences are important. The mechanism is not yet well understood owing to the difficulty and uncertainty of the rockburst. In order to mitigate the risks caused by rockburst, such as damage to equipment, access closure, delays, and loss of property and life, it is important to accurately predict or estimate the realistic potential of rockburst for the safety and efficient construction and serviceability of underground projects.
Conventional mechanics-based methods fail to provide precise rockburst hazard detection due to the highly complex relationship between geological, geometric, and mechanical parameters of rock masses in underground environments. Further, mechanics-based methods have several underlying assumptions, which, if flouted, may yield biased model predictions. This has forced many researchers in recent years to investigate alternative methods for better hazard prediction and detection of the rockburst phenomenon. Several researchers suggested several indicators to assess burst potential. The strain energy storage index (Wet), proposed by Kidybinski [6], is the ratio of strain energy stored (Wsp) to strain energy dissipated (Wst).Wattimena et al. [7] used elastic strain energy density as a burst potential measure. The rock brittleness coefficient, which is based on the ratio of uniaxial compressive stress (UCS) to tensile stress, is another widely used burst liability index [8]. A tangential stress criterion, the ratio between tangential stress around underground excavations (σθ), and UCS of rock (σc), can be employed to assess the risk of rock bursts [9]. Energy-based burst potential index was developed by Mitri et al. [10] to diagnose burst proneness. However, many techniques have been developed in the last few decades to predict or assess rockburst, but there has been no advancement or a widely accepted technique preferred over other rockburst methods.
Over the past few decades, data mining techniques have been shown to be efficient in getting complex non-linear relationships between predictor and response variables and may be used to identify sites that are prone to rockburst events, as case history information is increasingly available. A number of approaches have been suggested by several researchers to predict the rockburst, such as Support Vector Machine (SVM) [11], Artificial Neural Networks (ANNs) [12], Distance Discriminant Analysis (DDA) [13], Bayes Discriminant Analysis (BDA) [14], and Fisher Linear Discriminant Analysis (LDA) [15], and moreover, some systems are based upon hybrid (Zhou et al. [16]; Adoko et al. [17]; Liu et al. [18]) or ensemble (Ge and Feng [19]; Dong et al. [20]) learning methods in long-term prediction of rockburst and their prediction accuracies are compared. Zhao and Chen [21], recently developed and compared a data-driven model based on a convolutional neural network (CNN) to a traditional neural network. In rockburst prediction, this proposed CNN model has a high potential compared to the conventional neural network. These algorithms used a number of rockburst indicators as input features, and the size of their training samples varied. While most of the aforementioned techniques have been effective in predicting rockburst hazard, they do have shortcomings. For example, the optimal structure (e.g., number of inputs, hidden layers, and transfer functions) must be specified a priori in the ANN method. This is usually accomplished by a process of trial and error. The black box nature of the ANN model, as well as the fact that the relationship between the system’s input and output parameters is described in terms of a weight matrix and biases that are not available to the user, is another major limitation [22]. Table 1 summarizes the main rockburst prediction studies that used machine learning (ML) methods with input parameters and accuracy.

Table 1.
Study of the rockburst classification ML algorithm with influence factors and accuracy values.
The majority of the established models (Table 1) are black boxes, meaning they do not show a clear and understandable relationship between input and output. These studies attempted to solve the problems of rockburst, but they were never entirely successful. In certain instances, a particular procedure can be appropriate, but not in others. Notably, precision ranges from 66.5 to 100%, which is a major variance in rockburst prediction. Rockburst prediction is a complex and nonlinear process that is hindered by model and parameter uncertainty, as well as limited by inadequate knowledge, lack of information characterization, and noisy data. Machine learning has been widely recognized in mining and geotechnical engineering applications for dealing with nonlinear problems and developing predictive data-mining models [25,26,27,28,29,30,31].
In this study, the random tree and J48 algorithms have been specifically selected on the basis of these considerations because they are primarily used in civil engineering but have not yet been thoroughly evaluated with each other and because of their open-source availability. The primary aim of this research was to reveal and compare the suitability of random tree and J48 algorithms in underground projects for rockburst hazard prediction. First, rockburst hazards classification cases are collected from the published literature. Next, these two algorithms are used to predict the rockburst hazard classification. Finally, their detailed performance is evaluated and compared with empirical models.
2. Materials and Methods
2.1. Influence Factors and Data Assemblage
Several factors such as the geological structures of the rock mass, the conditions of geo-stress, rock mass strength, the method of excavation and excavation size, and rock blasting are all related to the occurrence of rockbursts [9,15,32]. However, due to the limitations present in the reported parameters in previous field studies, all variables cannot be taken into account. Therefore, to create the new models, only parameters recorded in all field studies are used here. Previous studies used uniaxial compressive and tensile strength of the rock mass, maximum tangential stress of the surrounding rock, and strain energy storage index as main parameters. The existing rockburst cases were collected as supportive data for the development of the prediction model. This study used the rockburst database from different types of underground projects from all over the world previously collected by Pu et al. [24] and Zhou et al. [16] and recently referenced by Zhao and Chen [21]. The dataset contains 165 rockburst events of underground engineering projects which have four influence factors and a corresponding rank of rockburst. In general, the projects chosen experienced the most significant rockburst activity.
The way data are divided into training and research sets has a major influence on the results of data mining techniques [33]. The statistical analysis’ main goal was to ensure that the subsets’ statistical properties were as similar as possible and thus represented the same statistical population. To fairly compare the predictive performance of the proposed J48 and random tree models in this study, the dataset used for the training (137 cases) and testing (28 cases) was kept the same in the prediction of rockburst hazard. As per Cai et al. [34] the rockburst database has four rankings to determine the risk for the rockburst. They are as follows, with increasing severity: no rockburst (NR), moderate rockburst (MR), strong rockburst (SR) and violent rockburst (VR). The specific grading criteria are shown in Table 2 [34]. Figure 1 shows the distribution of rockburst data as a pie chart showing the portion of four rockburst hazard forms in underground projects, classified as no rockburst (NR, 31 cases), moderate rockburst (MR, 43 cases), strong rockburst (SR, 63 cases) and violent rockburst (VR, 28 cases).
Table 2.
Grading criteria of rockburst intensity.
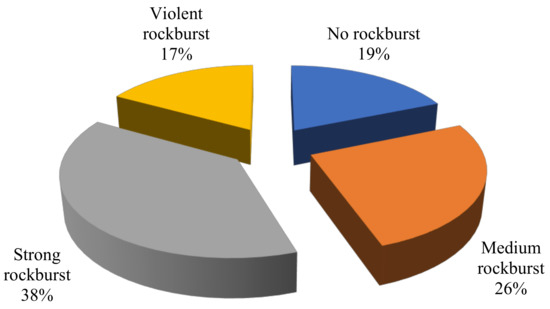
Figure 1.
Distribution of observed rockburst hazard in underground projects.
The database contains maximum tangential stress of surrounding rock σθ (MPa), uniaxial compressive strength σc (MPa), uniaxial tensile strength σt (MPa), and strain energy storage index Wet. The histograms, cumulative distribution functions and descriptive statistics (such as minimum and maximum values, mean and standard deviations) of the selected rockburst parameters with the established J48 and random tree models are provided in Figure 2 and Table 3 (the complete database is available in Appendix A, Table A1). It should be noted that in ranges with more dense data, the established models are more accurate.
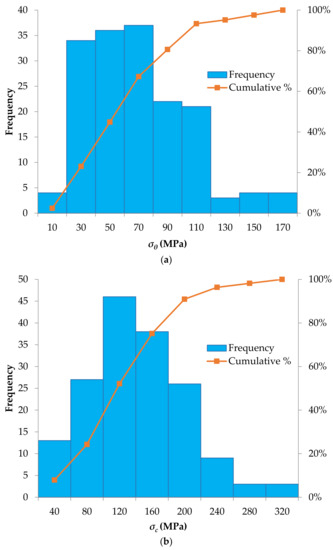
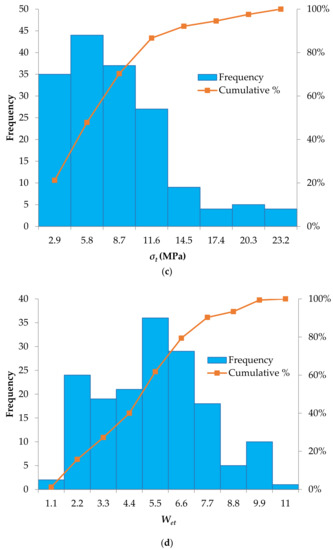
Figure 2.
Histograms of the input parameters considered to predict the rockburst hazard: (a) Maximum tangential stress of surrounding rock (σθ; MPa), (b) Uniaxial compressive strength, (σc; MPa), (c) Uniaxial tensile strength (σt; MPa), (d) Strain energy storage index (Wet).
Table 3.
Descriptive statistics of the rockburst dataset.
Rockburst events typically occur in rock masses characterised by brittle behaviour (low deformability), massive and relatively homogeneous structure, high intact rock strength and high in-situ stress states. That said, it is hard to accept that rockburst events were registered in some case-studies involving rock masses with low or very low values of uniaxial compressive strength (see for instance case-studies no. 4, 6, 26, 27, 39, 44, 52, 53, 60, 67, 83, 90, 121, 137). Very probably, in these cases other factors such as large in-situ stress attended to provide high energy releases.
2.2. Methodology
2.2.1. J48
The J48 algorithm is the implementation of the C4.5 algorithm [35]. Waikato Environment for Knowledge Analysis (WEKA) software’s implementation of the C4.5 random tree learner is the J48 algorithm (J48 also implements a later and slightly modified version named C4.5 revision 8, which was the last public version of this algorithm family before C5.0 was released for commercial implementation) [36].
The random trees are generated with C4.5. A tree-like structure serves as a random support system in the random tree. A root node, internal nodes, and leaf nodes build the tree structure. The root node contains all of the input data. A random function is associated with an internal node that may have two or more branches. The label class is represented by the leaf node, which is the output of the input vector. The main advantage of random trees is that they are simple to build and the resulting trees are easy to understand [37]. The C4.5 algorithm has recently been used to determine the potential for seismic soil liquefaction [28,29] and landslide susceptibility [37]. The J48 random tree algorithm takes the following steps [38].
Step 1: Compute the Entropy(S) of the training dataset S as follows:
where |S| is the number of samples in the training dataset, Ci is a dependent variable, i = 1, 2, …, K, K is the number of classes for the dependent variable, and freq(Ci, S) is the number of samples included in class Ci.
Step 2: Calculate the Information Gain X(S) for the partition’s X test attribute:
where L is the number of test outputs, X, Si is the subset of S corresponding to the output of ith, and |Si| is the number of dependent variables of the subset Si. A subset that provides maximum information gain will be selected as the threshold for a particular partition attribute. The node branch will consist of the two partitions S and S–Si. The tree is a leaf if the cases are from the same class; hence, the leaf is returned by defining the same dependent variables (class).
Step 3: Calculate the Split Info (X) acquisition’s partition information value for S partitioned to L subsets:
Step 4: Calculate the Gain Ratio(X):
Step 5: The root node will be the attribute with the highest gain ratio, and the same calculation from step 1 to step 4 will be repeated for each intermediate node until all instances are exhausted and it reaches the leaf node as defined in step 2.
2.2.2. Random Tree (RT)
RT splits the data set into sub-spaces and fits the constant to each sub-space. A single tree model tends to be very unstable and provides lower prediction accuracy. However, very accurate results can be obtained by bagging RT as a random tree algorithm [39]. RT has a high degree of versatility and quick training capabilities [40]. More comprehensive details of the RT can be found in Sattari et al. [41] and Kiranmai and Laxmi [42]. Table 4 presents the different variations between the J48 and random tree data mining algorithms.
Table 4.
Differences between J48 and random tree algorithms.
3. Construction of Prediction Model
The construction method of the prediction model is presented in Figure 3. The data is divided in two sub-datasets, i.e., training and testing. A training dataset of 137 cases is chosen to train the model and the remaining 28 cases are used to test the model. A hold-out technique is used to tune the hyper parameters of the model. The prediction model is fitted using the optimal configuration of hyperparameters, based on the training dataset. Different performance indexes such as classification accuracy (ACC), kappa statistic, producer accuracy (PA), and user accuracy (UA) are used to evaluate model performance. Last, the optimum model is calculated by evaluating the comprehensive performance of these models. If the predicted performance of this model is appropriate, then it can be adopted for deployment. In WEKA, the entire method of calculation is carried out.
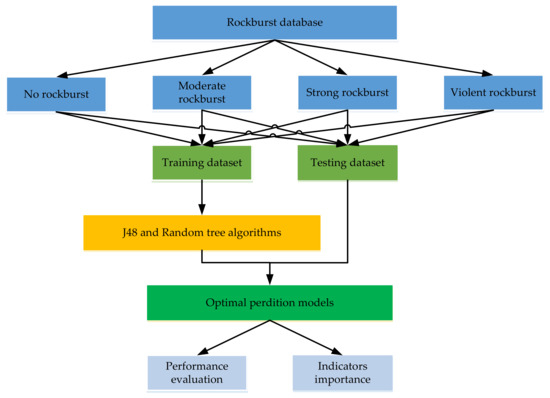
Figure 3.
Construction process of prediction model.
3.1. Hyperparameter Optimization
Tuning is the process of maximizing a model’s performance and avoiding overfitting or excessive variance. This is achieved in machine learning by choosing suitable “hyperparameters”. Choosing the right set of hyperparameters is critical for model accuracy, but can be computationally challenging. Hyperparameters are different from other model parameters in that they are not automatically learned by the model through training methods, instead, these parameters must be set manually. Critical hyperparameters in random tree and J48 algorithms are tuned to determine the optimum value of algorithm parameters such as the minimum number of instances per leaf and the confidence factor. For both algorithms, the trial and error approach is used to evaluate these parameters in a particular search range in order to achieve the best classification accuracy. The search range of the same hyperparameters is kept consistent. Furthermore, according to the maximum accuracy, the optimal values for each set of hyperparameters are obtained. In this analysis, the optimum values for the J48 algorithm were found as: the minimum number of instances was 1 and the confidence factor was 0.25, the tree size was 63, the number of leaves was 32, and in the case of a random tree, the tree size was 103 and the minimum total weight of the instances in a leaf was 1.
3.2. Model Evaluation Indexes
J48 and random tree algorithms are used as described in Section 2.2 in order to construct a predictive model for the classification of a rockburst hazard. The uncertainty matrix is a projected results visualization table where each row of the matrix represents the cases in the actual class, while each column displays the cases in the predicted class. It is normally constructed with m rows and m columns, where m is equal to the number of classes. The accuracy, kappa, producer accuracy, and user accuracy found for each class of the confusion matrix sample are used to test the predictive model’s efficacy. Let xij (i and j = 1, 2, …, m) be the joint frequency of observations designated to class i by prediction and class j by observation data, xi+ is the total frequency of class i as obtained from prediction, and x + j is the total frequency of class j based on observed data (see Table 5).
Table 5.
Confusion matrix.
Classification accuracy (ACC) is determined by summing correctly classified diagonal instances and dividing them by the total number of instances. The ACC is given as:
Cohen’s kappa index, which is a robust index that considers the likelihood of an event classification by chance, measures the proportion of units that are correctly categorized units proportions after removing the probability of chance agreement [43]. Kappa can be calculated using the following formula:
where n is the number of instances, m is the number of class values, xii is the number of cells in the main diagonal, and xi+, x+i are the cumulative counts of the rows and columns, respectively.
Landis and Koch [44] suggested a scale to show the degree of concordance (see Table 6). A kappa value of less than 0.4 indicates poor agreement, while a value of 0.4 and above indicates good agreement (Sakiyama et al. [45]; Landis and Koch [44]). The producer’s accuracy of class i (PAi) can be measured using Congalton and Green’s formula [46].
and user’s accuracy of class i (UAi) can be found as:
Table 6.
Strength agreement measure related to kappa statistic.
The J48 and random tree models are studied for the suitability of predicting rockburst. Comparison is made with the traditional empirical criteria of the rockburst including the Russenes criterion [47], the rock brittleness coefficient criterion [48], ANN [21], and CNN [21] models using performance measures i.e., ACC, PA, UA, and kappa.
4. Results and Discussion
The performance of both models was tested to predict rockburst hazard using various evaluation criteria as mentioned in Section 3. Based on the statistical assessment criteria, it was observed that both models had very high predictive accuracy capability (J48: 92.857%; Random tree: 100%). The result of the kappa coefficient showed that both of these models are almost perfect but the random tree model performed best, owing to having the highest kappa coefficient value (1.0), followed by the J48 (0.904). With comparisons of the results from the four models, it is found that the prediction accuracy (ACC) and kappa coefficient of random tree and CNN models are equivalent, which is higher than that of other models shown in Table 7.
Table 7.
Performance metrics of each model for test data.
In terms of the producer accuracy (PA) value, the random tree model also had the highest PA (100%) for all ranks of rockburst, followed by the J48. PA and UA show that some of the features are better classified than others (see Table 8). As can been seen from the Table 8, in the J48 model, both “no rockburst” and “moderate rockburst” both have at par PA values (100%) compared to “strong rockburst” (88.889%) and “no rockburst” (83.333%). While in the J48 model, both “no rockburst” and “violent rockburst” have at par UA values (100%) compared to “moderate rockburst” (88.889%) and “strong rockburst” (87.5%). The results showed that there was a statistically significant difference between the random tree and the J48 models, and it was found that the performance of the J48 is just secondary to the random tree model in prediction of rockburst hazard.
Table 8.
Confusion matrices and performance measures based on testing dataset of rockburst.
To illustrate and verify the performances of J48 and random tree models, the prediction capacity of these models is compared with the other models including the Russenes criterion [47], the rock brittleness coefficient criterion [48], ANN [21], and CNN [21]. The confusion matrix and the performance indices for traditional empirical criteria of the rockburst including Russenes criterion [47], the rock brittleness coefficient criterion [48], ANN [21], and CNN [21] models are presented in Table 8. The comparison of these models reveals that J48 and random tree models can be applied efficiently, but the random model exhibits the best and at par performance with the CNN [21] model and after that the J48 model. The random tree model can predict “no rockburst”, “moderate rockburst”, “strong rockburst” and “violent rockburst” cases with overall accuracy of 100%.
Although existing models such as SVM do not provide explicit equations for professionals, the established J48 and random tree models (see Figure 4) can be used by civil and mining engineering professionals with the aid of a spreadsheet to analyze potential rockburst events without going into the complexities of model development. Furthermore, the J48 and random tree approaches do not require data normalization or scaling, which is an advantage over most other approaches.
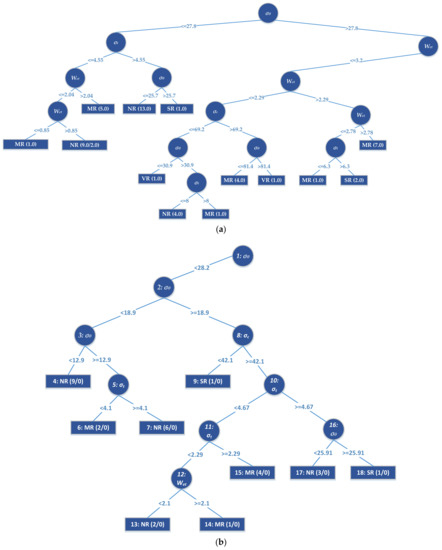
Figure 4.
Part of (a) J48 and (b) random tree models.
In general, both of the established models performed well in the testing data phase, while overall performance of the random tree model showed better performance (see Table 7 and Table 8) and it is shown that the random tree model is preferred over other models. It was found that for a larger dataset with almost no sampling bias (i.e., disparity in class ratio between population and sample) in the training and testing phases, predictive performance should be further examined. Though the dataset (165) used in this study is small, the J48 and random tree models can always be updated to yield better results, as new data become available. Study results suggest that proposed models show improved predictive performance compared to the majority of existing studies. This, in turn, will ensure the reduction in the loss of property, human lives, and injuries from a practical viewpoint.
5. Conclusions and Limitations
In underground mining and civil engineering projects, models for predicting rockburst can be valuable tools. This study compared J48 and random tree models for predicting rockburst. Four variables (σθ, σc, σt, and Wet) were selected as influence factors for predicting rockburst using a dataset of 165 rockburst events compiled from recent published research, which was used to construct the decision tree models. The following conclusions can be drawn, based on the results of the study:
- The performance measures of the testing dataset for the J48 and random tree algorithms conclude that it is rational and feasible to choose the maximum tangential stress of surrounding rock σθ (MPa), the uniaxial compressive strength σc (MPa), the uniaxial tensile strength σt (MPa), and the strain energy storage index Wet as indexes for predicting rockburst.
- The classification accuracy of J48 and random tree models in the test phase is 92.857% and 100%, respectively, which shows that the random tree model is an accurate and efficient approach to predicting the potential for rockburst classification ranks.
- The kappa index of the developed J48 and random tree models is in the range of 0.904–1.000, which means that the correlation between observed and predicted values is nearly perfect.
- The comparison of models’ performances reveals that the random tree model gives more reliable predictions and their application is easier owing to a clear graphical outcome that can be used by civil and mining engineering professionals.
Although the proposed method yields adequate prediction results, certain limitations should be discussed in the future.
(1) The sample size is restricted and unbalanced. The number and quality of datasets have a significant impact on the prediction performance of random tree and J48 algorithms. In general, the generalization and reliability of all data-driven models are affected by the size of the dataset. Although the random tree and J48 algorithms perform well, larger datasets can yield better prediction results. Furthermore, the dataset is unbalanced, particularly for samples with violent rockburst (17%) and samples with no rockburst (19%). As a result, establishing a larger and more balanced rockburst database is essential.
(2) Other variables may have an effect on the prediction outcomes. Numerous factors influence the risk of a rockburst, including rock properties, energy, excavation depth, and support structure, among others. Although the four indicators used in this study can define the required conditions for rockburst hazard assessment to some degree, some other indicators, such as the buried depth of the tunnel (H), failure duration time, and energy-based burst potential index, may also have an impact on rockburst hazard. As a consequence, it is crucial to look into the effects of these variables on the prediction outcomes.
Author Contributions
Conceptualization, M.A. (Mahmood Ahmad), J.-L.H. and X.-W.T.; methodology, M.A. (Mahmood Ahmad), M.H.-N. and F.A.; software, M.A. (Mahmood Ahmad) and F.A.; validation, M.A. (Mahmood Ahmad), A.N. and F.A.; formal analysis, M.A. (Mahmood Ahmad); investigation, M.H.-N., F.A., Z.U.R., M.A. (Mahmood Ahmad) and M.A. (Muhammad Abrar); resources, X.-W.T.; data curation, M.A. (Muhammad Abrar), A.N. and Z.U.R.; writing—original draft preparation, M.A. (Mahmood Ahmad); writing—review and editing, M.A. (Mahmood Ahmad), M.H.-N., A.N. and Z.U.R.; supervision, X.-W.T., J.-L.H., M.H.-N.; project administration, X.-W.T., J.-L.H.; funding acquisition, J.-L.H., X.-W.T. All authors have read and agreed to the published version of the manuscript.
Funding
The work presented in this paper was part of the research sponsored by the Key Program of National Natural Science Foundation of China under Grant No. 51639002 and National Key Research and Development Plan of China under Grant No. 2018YFC1505300-5.3.
Institutional Review Board Statement
Not applicable.
Informed Consent Statement
Not applicable.
Data Availability Statement
The data used to support the findings of this study are included within the article.
Conflicts of Interest
The authors declare no conflict of interest.
Appendix A
Table A1.
Rockburst database.
Table A1.
Rockburst database.
| S. No. | Maximum Tangential Stress of Surrounding Rock, σθ (MPa) | Uniaxial Compressive Strength, σc (MPa) | Uniaxial Tensile Strength, σt (MPa) | Strain Energy Storage Index, Wet | Rockburst Rank |
|---|---|---|---|---|---|
| 1 | 26.9 | 62.8 | 2.1 | 2.4 | MR |
| 2 | 24.93 | 99.7 | 4.8 | 3.8 | NR |
| 3 | 57.6 | 120 | 5 | 5.1 | SR |
| 4 * | 132.1 | 51.5 | 2.47 | 4.63 | SR |
| 5 | 17.4 | 161 | 3.98 | 2.19 | MR |
| 6 | 34.15 | 54.2 | 12.1 | 3.17 | MR |
| 7 | 60 | 135 | 15.04 | 4.86 | MR |
| 8 | 40.4 | 72.1 | 2.1 | 1.9 | MR |
| 9 * | 55.4 | 176 | 7.3 | 9.3 | SR |
| 10 | 105.5 | 190 | 17.1 | 3.97 | SR |
| 11 | 62.4 | 235 | 9.5 | 9 | VR |
| 12 * | 80 | 180 | 6.7 | 5.5 | MR |
| 13 | 29.8 | 132 | 11.5 | 4.6 | SR |
| 14 | 12.1 | 160 | 5.2 | 2.22 | NR |
| 15 | 58.2 | 83.6 | 2.6 | 5.9 | VR |
| 16 | 29.7 | 116 | 2.7 | 3.7 | MR |
| 17 | 49.5 | 110 | 1.5 | 5.7 | SR |
| 18 | 105 | 237.16 | 17.66 | 6.38 | VR |
| 19 * | 11 | 105 | 4.9 | 4.7 | NR |
| 20 | 7.5 | 52 | 3.7 | 1.3 | NR |
| 21 | 19 | 153 | 4.48 | 2.11 | MR |
| 22 | 89 | 236 | 8.3 | 5 | SR |
| 23 | 56.1 | 131.99 | 9.44 | 7.44 | SR |
| 24 | 60.7 | 111.5 | 7.86 | 6.16 | VR |
| 25 | 33.6 | 156 | 10.8 | 5.2 | SR |
| 26 | 127.9 | 35.82 | 1.24 | 3.67 | MR |
| 27 | 25.49 | 54.2 | 2.49 | 3.17 | MR |
| 28 | 48 | 120 | 1.5 | 5.8 | SR |
| 29 * | 92 | 263 | 10.7 | 8 | MR |
| 30 | 62.6 | 165 | 9.4 | 9 | MR |
| 31 | 89.56 | 170.28 | 12.07 | 5.76 | SR |
| 32 * | 30 | 88.7 | 3.7 | 6.6 | SR |
| 33 | 18.8 | 178 | 5.7 | 7.4 | NR |
| 34 | 54.2 | 134 | 9.09 | 7.08 | SR |
| 35 | 91.3 | 225.6 | 17.2 | 7.3 | VR |
| 36 | 44.4 | 120 | 5 | 5.1 | MR |
| 37 | 90 | 170 | 11.3 | 9 | SR |
| 38 * | 11.3 | 90 | 4.8 | 3.6 | NR |
| 39 | 35.8 | 67.8 | 3.8 | 4.3 | SR |
| 40 | 70.4 | 110 | 4.5 | 6.31 | SR |
| 41 | 50 | 130 | 6 | 5 | SR |
| 42 * | 108.4 | 140 | 8 | 5 | VR |
| 43 | 34 | 149 | 5.9 | 7.6 | MR |
| 44 * | 148.4 | 66.77 | 3.81 | 5.08 | MR |
| 45 | 56.8 | 112 | 2.2 | 5.2 | SR |
| 46 | 60 | 136.79 | 10.42 | 2.12 | MR |
| 47 | 19.7 | 142 | 4.55 | 2.26 | MR |
| 48 | 167.2 | 110.3 | 8.36 | 6.83 | VR |
| 49 | 30.1 | 88.7 | 3.7 | 6.6 | VR |
| 50 | 38.2 | 71.4 | 3.4 | 3.6 | SR |
| 51 | 61 | 171.5 | 22.6 | 7.5 | MR |
| 52 | 41.6 | 67.6 | 2.7 | 3.7 | SR |
| 53 | 19.5 | 30 | 2.67 | 2.03 | SR |
| 54 | 89.56 | 187.17 | 19.17 | 7.27 | SR |
| 55 * | 60.7 | 111.5 | 7.86 | 6.16 | VR |
| 56 | 63.8 | 110 | 4.5 | 6.31 | SR |
| 57 * | 62.4 | 235 | 9.5 | 9 | VR |
| 58 | 148.4 | 66.77 | 3.81 | 5.08 | MR |
| 59 | 62.6 | 165 | 9.4 | 9 | MR |
| 60 | 118.5 | 26.06 | 0.77 | 2.89 | MR |
| 61 | 90 | 220 | 7.4 | 7.3 | MR |
| 62 * | 96.41 | 18.32 | 0.38 | 1.87 | NR |
| 63 | 40.6 | 66.6 | 2.6 | 3.7 | SR |
| 64 | 12.3 | 237.1 | 17.66 | 6.9 | NR |
| 65 | 55.6 | 114 | 2.3 | 4.7 | SR |
| 66 * | 98.6 | 120 | 6.5 | 3.8 | SR |
| 67 | 30 | 30 | 2.67 | 2.03 | VR |
| 68 | 28.6 | 122 | 12 | 2.5 | SR |
| 69 | 70.3 | 129 | 8.73 | 6.43 | SR |
| 70 | 68 | 107 | 6.1 | 7.2 | VR |
| 71 | 29.1 | 94 | 2.6 | 3.2 | MR |
| 72 | 73.2 | 120 | 5 | 5.1 | SR |
| 73 | 105 | 304 | 9.12 | 5.76 | SR |
| 74 | 32.3 | 67.4 | 6.7 | 1.1 | NR |
| 75 * | 34 | 150 | 5.4 | 7.8 | NR |
| 76 | 15.2 | 53.8 | 5.56 | 1.92 | NR |
| 77 | 39.4 | 65.2 | 2.3 | 3.4 | SR |
| 78 | 75 | 180 | 8.3 | 5 | SR |
| 79 | 11 | 105 | 4.9 | 4.7 | NR |
| 80 | 18.7 | 82 | 10.9 | 1.5 | NR |
| 81 | 14.96 | 99.7 | 4.8 | 3.8 | NR |
| 82 * | 90 | 170 | 11.3 | 9 | SR |
| 83 | 13.5 | 30 | 2.67 | 2.03 | MR |
| 84 * | 167.2 | 110.3 | 8.36 | 6.83 | VR |
| 85 | 62.5 | 175 | 7.25 | 5 | SR |
| 86 * | 90 | 220 | 7.4 | 7.3 | MR |
| 87 | 20.9 | 160 | 5.2 | 2.22 | NR |
| 88 | 39 | 70.1 | 2.4 | 4.8 | SR |
| 89 | 63 | 115 | 1.5 | 5.7 | SR |
| 90 | 47.56 | 58.5 | 3.5 | 5 | MR |
| 91 | 157.3 | 91.23 | 6.92 | 6.27 | VR |
| 92 | 60 | 149.19 | 9.3 | 3.5 | MR |
| 93 | 56.9 | 123 | 2.7 | 5.2 | SR |
| 94 | 98.6 | 120 | 6.5 | 3.8 | SR |
| 95 | 81.4 | 110 | 4.5 | 6.31 | VR |
| 96 | 96.41 | 18.32 | 0.38 | 1.87 | NR |
| 97 * | 70.3 | 129 | 8.73 | 6.43 | SR |
| 98 | 62.1 | 132 | 2.4 | 5 | SR |
| 99 * | 38.2 | 53 | 3.9 | 1.6 | NR |
| 100 | 13.9 | 124 | 4.22 | 2.04 | NR |
| 101 | 54.2 | 134 | 9.1 | 7.1 | SR |
| 102 | 3.8 | 20 | 3 | 1.39 | NR |
| 103 * | 89 | 236 | 8.3 | 5 | SR |
| 104 | 46.4 | 100 | 4.9 | 2 | MR |
| 105 | 23 | 80 | 3 | 0.85 | MR |
| 106 | 55.9 | 128 | 6.29 | 8.1 | VR |
| 107 | 11.3 | 90 | 4.8 | 3.6 | NR |
| 108 | 26.9 | 92.8 | 9.47 | 3.7 | SR |
| 109 | 105 | 171.3 | 22.6 | 7.27 | VR |
| 110 | 80 | 180 | 6.7 | 5.5 | MR |
| 111 | 59.82 | 85.8 | 7.31 | 2.78 | SR |
| 112 | 55.6 | 256.5 | 18.9 | 9.1 | SR |
| 113 | 35 | 133.4 | 9.3 | 2.9 | MR |
| 114 | 107.5 | 21.5 | 0.6 | 2.29 | NR |
| 115 | 59.9 | 96.6 | 11.7 | 1.8 | MR |
| 116 | 40.1 | 72.1 | 2.3 | 4.6 | SR |
| 117 | 21.8 | 160 | 5.2 | 2.22 | NR |
| 118 | 38.2 | 53 | 3.9 | 1.6 | NR |
| 119 | 57 | 180 | 8.3 | 5 | SR |
| 120 | 57.2 | 80.6 | 2.5 | 5.5 | VR |
| 121 * | 127.9 | 35.82 | 1.24 | 3.67 | MR |
| 122 | 108.4 | 138.4 | 7.7 | 1.9 | VR |
| 123 | 30 | 88.7 | 3.7 | 6.6 | SR |
| 124 * | 54.2 | 134 | 9.09 | 7.08 | SR |
| 125 | 105 | 128.61 | 13 | 5.76 | VR |
| 126 | 46.2 | 105 | 5.3 | 2.3 | MR |
| 127 * | 157.3 | 91.23 | 6.92 | 6.27 | VR |
| 128 | 92 | 263 | 10.7 | 8 | MR |
| 129 | 55.6 | 114 | 2.3 | 4.7 | SR |
| 130 | 72.07 | 147.09 | 10.98 | 6.53 | SR |
| 131 | 39.4 | 69.2 | 2.7 | 3.8 | SR |
| 132 | 60 | 66.49 | 9.72 | 2.15 | MR |
| 133 | 48.75 | 180 | 8.3 | 5 | SR |
| 134 * | 107.5 | 21.5 | 0.6 | 2.29 | NR |
| 135 | 89 | 128.6 | 13.2 | 4.9 | VR |
| 136 * | 35 | 133.4 | 9.3 | 2.9 | MR |
| 137 | 132.1 | 51.5 | 2.47 | 4.63 | SR |
| 138 | 25.7 | 59.7 | 1.3 | 1.7 | NR |
| 139 | 55.4 | 176 | 7.3 | 9.3 | SR |
| 140 | 105.5 | 187 | 19.2 | 7.27 | SR |
| 141 | 43.4 | 123 | 6 | 5 | SR |
| 142 | 75 | 170 | 11.3 | 9 | SR |
| 143 | 4.6 | 20 | 3 | 1.39 | NR |
| 144 | 43.4 | 136.5 | 7.2 | 5.6 | VR |
| 145 | 30.3 | 88 | 3.1 | 3 | MR |
| 146 | 60 | 106.38 | 11.2 | 6.11 | MR |
| 147 | 108.4 | 140 | 8 | 5 | VR |
| 148 * | 48.75 | 180 | 8.3 | 5 | SR |
| 149 | 69.8 | 198 | 22.4 | 4.68 | MR |
| 150 | 89.56 | 190.3 | 17.13 | 3.97 | SR |
| 151 | 105 | 306.58 | 13.9 | 6.38 | VR |
| 152 | 18.8 | 171.5 | 6.3 | 7 | NR |
| 153 | 105 | 304.21 | 20.9 | 10.57 | VR |
| 154 | 70.3 | 128.3 | 8.7 | 6.4 | SR |
| 155 | 27.8 | 90 | 2.1 | 1.8 | NR |
| 156 | 105.5 | 170 | 12.1 | 5.76 | SR |
| 157 * | 43.4 | 136.5 | 7.2 | 5.6 | VR |
| 158 | 60 | 86.03 | 7.14 | 2.85 | MR |
| 159 | 11 | 115 | 5 | 5.7 | NR |
| 160 | 34 | 150 | 5.4 | 7.8 | NR |
| 161 | 45.7 | 69.1 | 3.2 | 4.1 | SR |
| 162 | 88.9 | 142 | 13.2 | 3.62 | VR |
| 163 | 30.9 | 82.56 | 6.5 | 3.2 | MR |
| 164 | 43.62 | 78.1 | 3.2 | 6 | MR |
| 165 | 2.6 | 20 | 3 | 1.39 | NR |
Note: Cases with * are testing samples.
References
- Ortlepp, W.; Stacey, T. Rockburst mechanisms in tunnels and shafts. Tunn. Undergr. Space Technol. 1994, 9, 59–65. [Google Scholar] [CrossRef]
- Dou, L.; Chen, T.; Gong, S.; He, H.; Zhang, S. Rockburst hazard determination by using computed tomography technology in deep workface. Saf. Sci. 2012, 50, 736–740. [Google Scholar] [CrossRef]
- Cai, M. Principles of rock support in burst-prone ground. Tunn. Undergr. Space Technol. 2013, 36, 46–56. [Google Scholar] [CrossRef]
- Al-Shayea, N. Failure of Rock Anchors along the Road Cut Slopes of Dhila Decent Road, Saudi Arabia. In Proceedings of the International Conference on Problematic Soils (GEOPROB 2005), Famagusta, Cyprus, 25–57 May 2005; pp. 1129–1136. [Google Scholar]
- Al-Shayea, N.A. Pullout Failure of Rock Anchor Rods at Slope Cuts, Dhila Decent Road, Saudi Arabia. In Proceedings of the 17th International Road Federation (IRF) World Meeting and Exhibition, Riyadh, Saudi Arabia, 10–14 November 2013. [Google Scholar]
- Kidybiński, A. Bursting liability indices of coal. Int. J. Rock Mech. Min. Sci. Geomech. Abstr. 1981, 18, 295–304. [Google Scholar] [CrossRef]
- Wattimena, R.K.; Sirait, B.; Widodo, N.P.; Matsui, K. Evaluation of rockburst potential in a cut-and-fill mine using energy balance. Int. J. Jcrm 2012, 8, 19–23. [Google Scholar]
- Altindag, R. Correlation of specific energy with rock brittleness concepts on rock cutting. J. South. Afr. Inst. Min. Metall. 2003, 103, 163–171. [Google Scholar]
- Wang, J.-A.; Park, H. Comprehensive prediction of rockburst based on analysis of strain energy in rocks. Tunn. Undergr. Space Technol. 2001, 16, 49–57. [Google Scholar] [CrossRef]
- Mitri, H.; Tang, B.; Simon, R. FE modelling of mining-induced energy release and storage rates. J. South. Afr. Inst. Min. Metall. 1999, 99, 103–110. [Google Scholar]
- Hong-Bo, Z. Classification of rockburst using support vector machine. Rock Soil Mech. 2005, 26, 642–644. [Google Scholar]
- Chen, D.; Feng, X.; Yang, C.; Chen, B.; Qiu, S.; Xu, D. Neural network estimation of rockburst damage severity based on engineering cases. In Proceedings of the SINOROCK 2013 Symposium, Shanghai, China, 18–20 June 2013; pp. 457–463. [Google Scholar]
- Gong, F.; Li, X. A distance discriminant analysis method for prediction of possibility and classification of rockburst and its application. Yanshilixue Yu Gongcheng Xuebao/Chin. J. Rock Mech. Eng. 2007, 26, 1012–1018. [Google Scholar]
- Gong, F.; Li, X.; Zhang, W. Rockburst prediction of underground engineering based on Bayes discriminant analysis method. Rock Soil Mech. 2010, 31, 370–377. [Google Scholar]
- Zhou, J.; Shi, X.-Z.; Dong, L.; Hu, H.-Y.; Wang, H.-Y. Fisher discriminant analysis model and its application for prediction of classification of rockburst in deep-buried long tunnel. J. Coal Sci. Eng. 2010, 16, 144–149. [Google Scholar] [CrossRef]
- Zhou, J.; Li, X.; Shi, X. Long-term prediction model of rockburst in underground openings using heuristic algorithms and support vector machines. Saf. Sci. 2012, 50, 629–644. [Google Scholar] [CrossRef]
- Adoko, A.C.; Gokceoglu, C.; Wu, L.; Zuo, Q.J. Knowledge-based and data-driven fuzzy modeling for rockburst prediction. Int. J. Rock Mech. Min. Sci. 2013, 61, 86–95. [Google Scholar] [CrossRef]
- Liu, Z.; Shao, J.; Xu, W.; Meng, Y. Prediction of rock burst classification using the technique of cloud models with attribution weight. Nat. Hazard. 2013, 68, 549–568. [Google Scholar] [CrossRef]
- Ge, Q.; Feng, X. Classification and prediction of rockburst using AdaBoost combination learning method. Rock Soil Mech. Wuhan 2008, 29, 943. [Google Scholar]
- Dong, L.-J.; Li, X.-B.; Kang, P. Prediction of rockburst classification using Random Forest. Trans. Nonferrous Met. Soc. China 2013, 23, 472–477. [Google Scholar] [CrossRef]
- Zhao, H.; Chen, B. Data-Driven Model for Rockburst Prediction. Math. Probl. Eng. 2020, 2020. [Google Scholar] [CrossRef]
- Javadi, A.A.; Ahangar-Asr, A.; Johari, A.; Faramarzi, A.; Toll, D. Modelling stress–strain and volume change behaviour of unsaturated soils using an evolutionary based data mining technique, an incremental approach. Eng. Appl. Artif. Intell. 2012, 25, 926–933. [Google Scholar] [CrossRef]
- Zhu, Y.; Liu, X.; Zhou, J. Rockburst prediction analysis based on v-SVR algorithm. J. China Coal Soc. 2008, 33, 277–281. [Google Scholar]
- Pu, Y.; Apel, D.B.; Lingga, B. Rockburst prediction in kimberlite using decision tree with incomplete data. J. Sustain. Min. 2018, 17, 158–165. [Google Scholar] [CrossRef]
- Ahmad, M.; Al-Shayea, N.A.; Tang, X.-W.; Jamal, A.; M Al-Ahmadi, H.; Ahmad, F. Predicting the Pillar Stability of Underground Mines with Random Trees and C4. 5 Decision Trees. Appl. Sci. 2020, 10, 6486. [Google Scholar] [CrossRef]
- Ahmad, M.; Tang, X.-W.; Qiu, J.-N.; Ahmad, F.; Gu, W.-J. A step forward towards a comprehensive framework for assessing liquefaction land damage vulnerability: Exploration from historical data. Front. Struct. Civ. Eng. 2020, 14, 1476–1491. [Google Scholar] [CrossRef]
- Ahmad, M.; Tang, X.; Ahmad, F. Evaluation of Liquefaction-Induced Settlement Using Random Forest and REP Tree Models: Taking Pohang Earthquake as a Case of Illustration. In Natural Hazards-Impacts, Adjustments & Resilience; IntechOpen: London, UK, 2020. [Google Scholar]
- Ahmad, M.; Tang, X.-W.; Qiu, J.-N.; Gu, W.-J.; Ahmad, F. A hybrid approach for evaluating CPT-based seismic soil liquefaction potential using Bayesian belief networks. J. Cent. South Univ. 2020, 27, 500–516. [Google Scholar]
- Ahmad, M.; Tang, X.-W.; Qiu, J.-N.; Ahmad, F. Evaluating Seismic Soil Liquefaction Potential Using Bayesian Belief Network and C4. 5 Decision Tree Approaches. Appl. Sci. 2019, 9, 4226. [Google Scholar] [CrossRef]
- Ahmad, M.; Tang, X.-W.; Qiu, J.-N.; Ahmad, F. Evaluation of liquefaction-induced lateral displacement using Bayesian belief networks. Front. Struct. Civ. Eng. 2021. [Google Scholar] [CrossRef]
- Pirhadi, N.; Tang, X.; Yang, Q.; Kang, F. A New Equation to Evaluate Liquefaction Triggering Using the Response Surface Method and Parametric Sensitivity Analysis. Sustainability 2019, 11, 112. [Google Scholar] [CrossRef]
- Mansurov, V. Prediction of rockbursts by analysis of induced seismicity data. Int. J. Rock Mech. Min. Sci. 2001, 38, 893–901. [Google Scholar] [CrossRef]
- Rezania, M.; Faramarzi, A.; Javadi, A.A. An evolutionary based approach for assessment of earthquake-induced soil liquefaction and lateral displacement. Eng. Appl. Artif. Intell. 2011, 24, 142–153. [Google Scholar] [CrossRef]
- Cai, W.; Dou, L.; Si, G.; Cao, A.; He, J.; Liu, S. A principal component analysis/fuzzy comprehensive evaluation model for coal burst liability assessment. Int. J. Rock Mech. Min. Sci. 2016, 100, 62–69. [Google Scholar] [CrossRef]
- Witten, I.H.; Frank, E.; Hall, M. Data Mining: Practical Machine Learning Tools and Techniques; Morgen Kaufmann: San Francisco, CA, USA, 2005. [Google Scholar]
- Witten, I.; Frank, E.; Hall, M. Data Mining: Practical Machine Learning Tools and Techniques, 3rd ed.; Morgan Kaufmann: San Francisco, CA, USA, 2011. [Google Scholar]
- Bui, D.T.; Ho, T.C.; Revhaug, I.; Pradhan, B.; Nguyen, D.B. Landslide susceptibility mapping along the national road 32 of Vietnam using GIS-based J48 decision tree classifier and its ensembles. In Cartography from Pole to Pole; Springer: Berlin/Heidelberg, Germany, 2014; pp. 303–317. [Google Scholar]
- Sun, W.; Chen, J.; Li, J. Decision tree and PCA-based fault diagnosis of rotating machinery. Mech. Syst. Signal Process. 2007, 21, 1300–1317. [Google Scholar] [CrossRef]
- Aldous, D.; Pitman, J. Inhomogeneous continuum random trees and the entrance boundary of the additive coalescent. Probab. Theory Relat. Fields 2000, 118, 455–482. [Google Scholar] [CrossRef]
- LaValle, S.M. Rapidly-Exploring Random Trees: A New Tool for Path Planning; Department of Computer Science: Ames, IA, USA, 1998. [Google Scholar]
- Sattari, M.T.; Apaydin, H.; Shamshirband, S. Performance Evaluation of Deep Learning-Based Gated Recurrent Units (GRUs) and Tree-Based Models for Estimating ETo by Using Limited Meteorological Variables. Mathematics 2020, 8, 972. [Google Scholar] [CrossRef]
- Kiranmai, S.A.; Laxmi, A.J. Data mining for classification of power quality problems using WEKA and the effect of attributes on classification accuracy. Prot. Control Mod. Power Syst. 2018, 3, 29. [Google Scholar] [CrossRef]
- Kuhn, M.; Johnson, K. Applied Predictive Modeling; Springer: Berlin/Heidelberg, Germany, 2013; Volume 26. [Google Scholar]
- Landis, J.R.; Koch, G.G. An application of hierarchical kappa-type statistics in the assessment of majority agreement among multiple observers. Biometrics 1977, 363–374. [Google Scholar] [CrossRef]
- Sakiyama, Y.; Yuki, H.; Moriya, T.; Hattori, K.; Suzuki, M.; Shimada, K.; Honma, T. Predicting human liver microsomal stability with machine learning techniques. J. Mol. Graph. Model. 2008, 26, 907–915. [Google Scholar] [CrossRef]
- Congalton, R.G.; Green, K. Assessing the Accuracy of Remotely Sensed Data: Principles and Practices; CRC Press: Boca Raton, FL, USA, 2002. [Google Scholar]
- Russenes, B. Analysis of Rock Spalling for Tunnels in Steep Valley Sides; Norwegian Institute of Technology: Trondheim, Norway, 1974. [Google Scholar]
- Wang, Y.; Li, W.; Li, Q. Fuzzy estimation method of rockburst prediction. Chin. J. Rock Mech. Eng 1998, 17, 493–501. [Google Scholar]


Publisher’s Note: MDPI stays neutral with regard to jurisdictional claims in published maps and institutional affiliations. |
© 2021 by the authors. Licensee MDPI, Basel, Switzerland. This article is an open access article distributed under the terms and conditions of the Creative Commons Attribution (CC BY) license (https://creativecommons.org/licenses/by/4.0/).