Abstract
There are several environmental factors such as temperature differential, moisture, oxidation, etc. that affect the extended life of the modified asphalt influencing its desired adhesive properties. Knowledge of the properties of asphalt adhesives can help to provide a more resilient and durable asphalt surface. In this study, a hybrid of Bayesian optimization algorithm and support vector regression approach is recommended to predict the adhesion force of asphalt. The effects of three important variables viz., conditions (fresh, wet and aged), binder types (base, 4% SB, 5% SB, 4% SBS and 5% SBS), and Carbon Nano Tube doses (0.5%, 1.0% and 1.5%) on adhesive force are taken into consideration. Real-life experimental data (405 specimens) are considered for model development. Using atomic force microscopy, the adhesive strength of nanoscales of test specimens is determined according to functional groups on the asphalt. It is found that the model predictions overlap with the experimental data with a high R2 of 90.5% and relative deviation are scattered around zero line. Besides, the mean, median and standard deviations of experimental and the predicted values are very close. In addition, the mean absolute Error, root mean square error and fractional bias values were found to be low, indicating the high performance of the developed model.
1. Introduction
A resilient asphalt pavement ensures smooth vehicle movement and resists the harmful effects of the environment [1,2]. The two most important factors, among the several types of environmental factors that endanger the surface resistance of asphalt, are moisture and oxidation [3,4,5]. Numerous actions have been adopted to avoid the adverse effects of these factors on the surface of asphalt pavements. Indeed, there is no clear strategy to provide a clear cut solution and does not differentiate the process of riding quality loss. The differed processes of deterioration or prolonged durability are the result of better properties due to the actions taken, which are gradually eliminated by the effects of moisture and oxidation over the life of the asphalt pavement surface. Based on this temporary solution, it can be concluded that providing properties developed over a longer time can extend the durability of asphalt surfaces. In this context, it is important to become familiar with the important properties of bituminous binders that are affected mainly by the addition of moisture and oxidation [6,7,8].
During the life of the asphalt pavement surface, moisture and oxidation cause loss of adhesion between binder and aggregate. In the presence of moisture between the asphalt binder and the binder, the adhesive and cohesive properties of the asphalt are weakened. Asphalt adhesion isimpaired by the action of water vapor, and the action of such steam is defined as stripping. This release effect destroys the adhesive bonds in the asphalt binder and at the interface between the asphalt and the surface of the aggregates. Apart from moisture, asphalt oxidation also changes the composition of the asphalt and then influences the adhesion properties of the asphalt binder. Oxidation in the presence of moisture alters the adhesive properties of asphalt, which is one of the most important property for the surface durability of asphalt. Hence, it is necessary to deepen the knowledge about the nature of the adhesive due to such effects [9,10].
The complex behavior of asphalt surface under various loads, surface structures and environmental conditions makes it difficult to predict the permanent deformation of asphalt surfaces accurately. For prediction, it was necessary to devise a mathematical relationship between the input and related output data using an accurate as well as a straightforward method. Over the last few years, Artificial Neural Networks (ANN) have been employed to model material properties and behavior and to establish complicated relationships between several other properties and attributes in many areas of construction engineering, as they can be learned and adapted in a vivacious manner [11,12,13].
Since the last few decades, increased axial loads, construction errors and heavy traffic have led to a plea for properties that are better than the original asphalt mix. Such behavior of HMA depends on both loading time and temperature [14,15,16,17]. At lower or higher temperatures, it becomes brittle and liquid, which can cause low temperature pavement cracking and erosion, which occurs at higher temperatures, thus affecting both the quality and productivity for the pavement [2]. Rutting owing to permanent deformation is considered as one of the primary distress in an asphalt made pavement surface. This can be problematic under almost every climatic condition, but particularly in regions with elevated temperatures that reduce surface age and the risk of aquaplaning and when there is water in the place with the ruts depth.
Recently, the accumulation of some additives like: polymers and nanomaterials has become common to improve the in-service performance of HMA mixes against distortion [18,19,20]. Typically, the durability and effectiveness of HMA mixes increased by the use of modified asphalt binders where unmodified bitumen may not meet certain specifications and requirements under challenging situations. Various blends and quantity of additives have been utilized to modify the properties of asphalt binders to resist permanent deformation, low temperature cracking, fatigue cracking, moisture damage as well as oxidative oriented aging [21,22,23,24,25]. Lately, the use of Nano-additives in asphalt binders has increased speedily due to their exclusive properties like quantum possessions, structural properties and large areas.
These days, artificial intelligence (AI) methods (e.g., ANN, SVR) are used to recognize patterns, symbols, language, image compression, process control, process optimization as well as in science and economy. The ANN is also a classic example of a modern interdisciplinary subject that solves various technical problems, which cannot be solved with conventional modelling [26,27]. In previous researches, many researchers have shown the positive effects of using neural networks to predict the process [28,29,30]. The SVR is a computational intelligence tool based on machine learning that captures either linear or nonlinear patterns that link the descriptors to the target. Complex engineering systems can be modeled and controlled using this method.
Herein, a hybrid model BOA-SVR (Bayesian Optimization Algorithm based Support Vector Regression) was built to estimate the bond strength of reinforced concrete. The effects of three important variables such as conditions, binder types, and carbon Nano tube doses on adhesive strength considered. When developing the model, a 5-fold cross-validation was included to avoid overfitting. An approach of Bayesian optimization was used to adjust the hyperparameters automatically, resulting in the generation of optimal models. Subsequently, the hybrid BOA-SVR model was further analyzed using multiple performance parameters such as coefficient of determination (R2), Pearson correlation coefficient (R), Root Mean Square Error (RMSE), Mean Absolute Error (MAE) and Fractional Bias (FB). Considering the problems that commonly accompany the cost of experimentation as well as construction delay, AI based modeling is found to be satisfactory for predicting the adhesive force of asphalt binders.
2. Materials and Methods
2.1. Materials
The control binder used in the study was assessed for its major properties. Each of the modified binder was comprised of asphalt and polymer and then with or without SWCNTs. The pragmatic asphalt possessions are listed in Table 1 which shows that the properties were determined according to the standard test methods mentioned. The viscosity test was carried out at 135 °C with a Brookfield viscometer.

Table 1.
Properties of asphalt.
The two polymers used in the study, SB and SBS, are the most commonly used polymers in the industry to modify bitumen which is used in asphalt pavements [27]. The mentioned polymers offer several improved binder properties, including greater resistance to moisture sensitivity, which is the focus of this research. [23]. In the current study, two levels of each polymer (4% and 5%) were used. Generally, the industry uses 4–5% of SBS for asphalt modification [28], therefore same percentages of SBS/SB is adopted for this study. In addition to these polymers, CNT was used as a nano modifier. It is rolled up graphene sheets with highly flexible hollow carbon tubes. The formation of the honeycomb lattice in the tube provides higher elasticity and tensile strength than steel [29]. Two types of CNT are available: single wall carbon nanotube (SWCNTs) and double wall carbon nanotubes (DWCNTs). The SWCNT has one-dimensional geometry with a distinct rolling up property. SWNTs have only one layer of graphene cylinders. The diameter of SWCNT varies between 0.7 and 3 nm. The two special and available sorts of CNTs are single-walled carbon nanotubes (SWCNT) and double-walled carbon nanotubes (DWCNT). With a one-dimensional geometry and clear winding properties, SWCNT has a one-dimensional geometry with clear winding properties. There is only one cylindrical graphene layer in SWNT. Its diameter SWCNT differs between 0.7 to 3 nm. Due to its size, it has a huge surface area of 300 m2/g and excellent thermal and chemical stability. Other than their unique physical properties, their chemical related properties may have also attracted the attention of researchers in various applications. With the accumulation of certain compounds or external atoms, the attributes of SWCNT are significantly altered. It was used in this study with three distinct fractions of SWCNT weight (0.5%, 1.0% and 1.5%). Table 2 shows the inut and output factors as summary.
Table 2.
The inut and output factors.
2.2. Sample Preparation
At 163 °C, the new asphalt is heated inside a closed vessel. The binding agent is a mixture of the anticipated percentage of SWCNT and polymer after 30 to 40 min. Melting was passed out by moving the respective sample in a blender at a speed of 60 rpm and at 190 °C. Both the rotation and temperature was based on several studies modifying asphalt polymers and with/without nanomaterials. At 190 °C, the temperature used in the study was chosen as follows the thermogravimetric curves experimental in the preceding study indicated that the SWCNT remained unstructured.
Based on previous research, the traditional technique of mixture separation was used because it is more practical and applicable to plant conditions. An CNT dispersion in the binder must be confirmed, however, as a filler (<0.075 mm) meaningfully affects the adhesion for a respective mixture. This means that the viscosity of several different samples is periodically evaluated, and it has been detected that after around 2 h of mixing, the specific samples were detected with a slight change, representing a more homogeneous state of the mixture. A polymer and SWCNT-modified sample were processed under both dry and wet conditions. Specimens are cautiously kept in a dry place to dodge moisture penetration. Based on the standardized procedure (AASHTO T-283), the wet sample was prepared. At the time of production of wet conditioned samples, dry samples are stored under vacuum for around half an hour and transferred under the water for about 72 h. The required modified specimen is placed on a glass substrate with an approximate size of 10 × 10 × 1 mm 3 after sample preparation. If the granulates are subjected to such a binder layer, this thickness simulates the condition of the bed in the mill during the mixing time. These samples were finally tested using the AFM protocols [4].
2.3. Background of AFM
As part of a family of scanning probes that can be used to evaluate a wide variety of materials, including polymers, AFM is one of a family of scanning probes that can be used to assess a wide variety of materials, including polymers. There are numerous uses for evaluating bitumen, including moisture hardness and imaging, as well as for evaluating surface energy. As the scope of this research, however, only requires the measurement of the bond or skid resistance that exists on asphalt at the nano-Newtonian scale. Using the pointed tip on top of the flexible support, the AFM uses the tip of the flexible support to evaluate the surface of the sample. This is done by attributing a probe to the support and gauging the curvature or “deformation” of the support. By Hooke’s law, the support acts as spring types of support during the deflection types of movement.
The physical parameter being tested is the force generated by various interactions. There are three different modes of contact in between the samples and the main AFM machine. For the physical parameter being tested, the force generated by various interactions is used. There are three different modes of contact between the specimen and the AFM called force distance curves. The repellence between the tip and the sample is measured in contact mode. The maximum force remains constant in relation to the sample and deflects the console during this time. Tip with the intermittent contact type vibrates at a higher frequency vertically between the contact surfaces of the sample. When the probe comes in contact with the surface, the amplitude of the vibrations decreases due to the energy loss caused by the tip. The tip could not touch the sample in non-contact mode and measures the tensile force, which shows the Van der Waals force between the sample and the tip.
The AFM test peaks must be calibrated to obtain the tensile strength/adhesion from the distance-force curve. Standard calibration in this study was performed by measuring the peak constant following the peak distance in a sample with known parameters. In addition, the specific displacement of the sample is converted into a force after calculating the peak constant. Full details on force-distance curves and their use to estimate the bond strength of asphalt can be referred to [30,31].
2.4. Description of Proposed Model
The background of the proposed hybrid model is presented in this section. A brief and transitory report of support vector regression computational intelligence technique is discussed. The physical portrayal of the Bayesian optimization algorithm (BOA) is presented as well.
2.4.1. Support Vector Regression (SVR)
A support vector machine (SVM) is usually satisfactory and can deliver very good results in practical applications. This is mainly owing to the principle of structural risk minimization (SRM) in SVM technique, which may have larger and better generalizations than the principle of empirical risk minimization (ERM) applied in mainly neural networks. Vapnik of AT & T Bell Laboratories has conducted extensive studies on SVM for classification and regression since the development of SVM theory. In SVM technique the results promise global minima, while ERM only can localize local minimum. For example, if you train a neural network, the results will show a local minimum that is not promised to contain a global minimum. Additionally, SVM can be adapted to complex and reliable systems with corrupted types of data. This function offers the possibility of a more substantial generalization to SVM. This is the obstacle of its forerunner, the neural network approach. Moreover, the tremendous development of SVM in statistical analysis stimulates researchers to employ SVM actively in a variety of research areas. Historically, a significant number of researches has focused on the use of SVM to document image classification and recognition. Several works applying SVM based on intelligent transportation systems (ITSs) are traffic-pattern recognition, vehicle detection, and head recognition. The SVM (SVM Maintenance Vector Regression) application has also recently shown many breakthroughs and reasonable results, such as financial market forecasts, estimation of power consumption, forecasting of electricity price and reconstruction of chaotic systems [32,33]. Except for the estimated traffic flow, there are few SVR results in the ITS time series analysis. The mathematical improvement of SVR technique has been studied widely. Briefly, it can be explained as follows:
The connection between input and output variables for non-linear mapping can be calculated using Equations (1) and (2) (Sue et al., 2018):
where z = (z1, z2, …, zn) denotes the input value and yi ∈ Rl represents the output value. Furthermore, v ∈ Rn, c ∈ R, and n represent the weight vector, a mathematical constant number, and the number of the training dataset, respectively. Additionally, ϕ(z) is an irregular function to assign input data to the high-dimensional feature space. To define v and c, the following formula is employed based on the principle of SRM:
where C is regularization constant defined as a penalty factor that balances the empirical risk and the flatness of the model, , represents slack variables, and is the Vapnik’s insensitive loss function that represents the optimization performance (Wang et al., 2012). The slack variables are zero for all data points within the ε-insensitive zone and progressively increase for data points outside the zone. Vapnik (1995) defines the insensitive loss function as:
The solution of the optimization problem in Equation (2), introducing the Lagrangian multipliers can be written as a dual quadratic programming problem:
where is defined as the Kernel function.
After solving Equation (4) for the values of , the final form of Equation (1) can be written as:
The goal of optimizing hyperparameters in machine learning is to get the best parameters that will result in high performance objectives. It works based on Bayes’ rule, as shown in Equation (6) bellow [1].
where, w represents an unobserved quantity, p (w) is the prior distribution, p (w|D) the posterior distribution and p (D|w) is the likelihood.
Bayes’ rule uses previous knowledge to calculate the following possibility, which means that it deliberates the results of the previous iterations when selecting values from the subsequent iteration. Hence, it can approach the ideal and optimal point more efficiently than to random types of sampling.
The BOA can be employed using two sub-models; acquisition and the surrogate. The surrogate model stochastically assesses the target function by using earlier results which is based on Gaussian process (GP). Also, the GP over the function f(x) is specified by the mean function (m) as well as covariance function (k), as follows:
This function relies on previous observations and can be maximized over iterations. This is recommended by the acquisition model for an iteration using the outcomes of the substitute model. Since the acquisition model tends to increase closer to the maximum point measured, the maximum return uncertainty is carried over from the replacement (surrogate) model. Based on the relationship between the measured value and the uncertainty, the value is further determined and the optimization point is determined by repeating this process and reducing the uncertainty. Mathematically, hyperparameter optimization using BOA can be expressed by the below equation as:
In this case, represents an objective score to decrease the RMSE determined on the test set, symbolizes the set of hyperparameters which produces the minimal value of the respective score, and x is any X domain represented value. In this study, BOA was utilized because of its better efficiency [32] as compared to other existing optimization techniques (e.g., manual, random and grid search). The process is a pragmatic, systematic and global optimization procedure of the black box functions that do not really require derivatives.
2.4.2. Hyperparameter Optimization Using BOA
In the SVR modelling, major three hyperparameters such as the insensitive loss function (ε), the capacity parameter or box constraint (C) and the Gaussian width parameter (γ) are exercised. A tolerance margin (insensitive region) is explained by the parameter ε, while parameter C states the error weight outside of the tolerance margin. Setting a higher C value will cause the SVR to fully reminisce the training data set besides thus will generalize the test data set that is poorly hidden. If a lower ε value indicates noiseless data and thus causes an over adjustment of the SVR. On the contrary, if a lower C value or a higher value of ε can result in an underadjustment of the SVR. The value γ is equally responsible for the under or over adjustment of forecasts. While a higher γ value leads to an over-fit, a lower γ value leads to a prediction fiasco.
The k-fold and cross-validation technique was utilized before to the applied BOA. In short, the current method divided all the data equally into k subsets. Of these, one is selected as a test subset, although the others are selected as mainly training purpose subsets. It is repeated for k times, and therefore every subset is used precisely at least once for testing. In general, large values of k increase generalization performance—compared to RMSE—but increase the computational cost for calculation. Consequently, a trade-off is necessary for individual and each user. A computational flowchart of k-fold validation and BOA is presented in Figure 1.
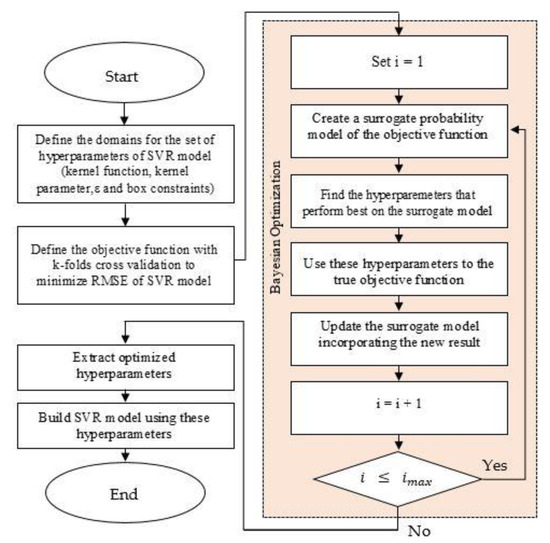
Figure 1.
A flow diagram of k-fold validation and Bayesian optimization algorithm.
3. Result & Discussion
3.1. Hybrid BOA-SVR Model Development
The BOA-SVR model is developed by tuning its hyperparameters (kernel function, C, ɛ, since the model performance depends heavily on these parameters. K-fold cross-validation was used to prevent overfitting. In this research, 5-fold cross-validation was selected to protect against overfitting because it showed a low RMSE with less computational time. The kernel function type, kernel parameter value, epsilon, and value of the box constraint were tuned using the BOA technique and the predictive accuracies of the models assessed. Figure 2 shows the progress of the SVR hyperparameter optimization, including the optimal point. The scores for the minimum objective observed of 2279.7 was observed at 12 iterations. The level of accuracy was used to determine the optimal model, applying the other parameters shown in Table 3.
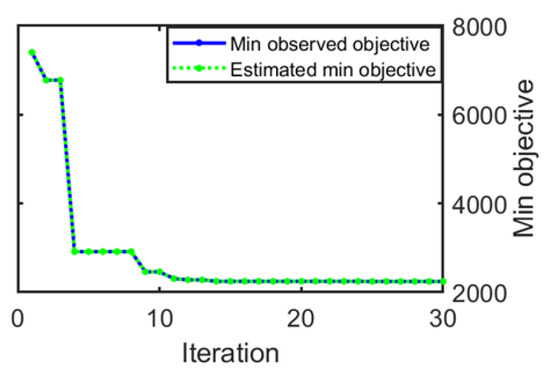
Figure 2.
The progress of Bayesian optimization for tuning hyperparameters of SVR. At 12 iterations, the minimum objective of 2279.7 was observed.
Table 3.
The optimized hyperparameters for SVR model.
Since computational intelligence models are data-dependent, the proposed BOA-SVR models were formulated using actual experimental data obtained from the literature. It is a remarkable aspect that both the descriptive statistics and the distribution of results were achieved by both the experiments and the SVR model. Table 4 listed the statistical summaries (e.g., median, interquartile range, minimum, maximum) including mean and standard deviation.
Table 4.
Statistical analysis of the dataset.
The boxplot is a popular approach to displaying data distribution based on a five-digit summary, including minimum score, first quartile (bottom), median, third quartile (top), and maximum score. Figure 3 displays the boxplots of predicted and experimental outputs for adhesive strength. The results specified that the shape of the distribution of experimental and predicted values was similar and all the data are right skewed. All median lines are sent to the field, indicating that there may not be differences between records the data sets. The box lengths (interquartile ranges) for both experimental (111.78) and predicted (101.95) strengths were not changing much, which indicates the results were not much broadly dispersed. Also, three outliers were observed in experimental while only one outlier was found in predicted adhesive strength.
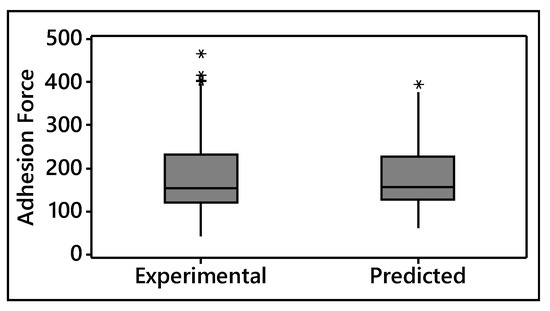
Figure 3.
Box plot for experimental and predicted adhesive strengths.
3.2. Evaluation of the Hybrid BOA-SVR Model
The SVR model developed in this paper is used to predict the adhesion forces in asphalt binders. Figure 4 shows the fitted line between the experimental and the model predicted adhesive strength with the corresponding 45° line. The coefficient of determination (R2), as well as adjusted coefficient of determination (adj R2) values of the fitted curve is 90.5% which indicates a proper fit. Hence, it can be argued that the predicted results are in good agreement with the experimental results.
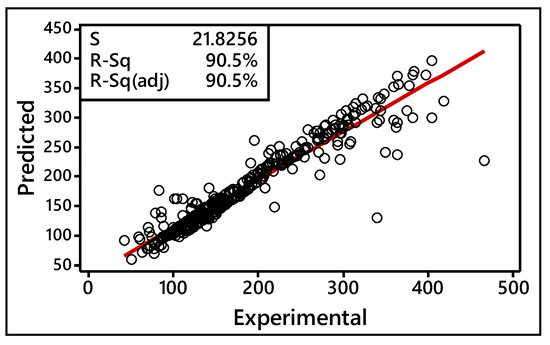
Figure 4.
Fitted line plot of experimental and predicted values.
In addition, to describe the compatibility or accuracy of the model, the results of residual analyses (relative deviation vs. experimental values, and residual vs. frequency) are shown in Figure 5 and Figure 6. It is worth mentioning that residual plot is a scatter plot, and if relative deviations or residual datapoints are scattered around 0 line then the model is acceptable. Interestingly, all of the plots indicate that the relative deviations, as well as residual are well distributed around the zero line with low deviations, thus furthering the validity and reliability of the model developed.
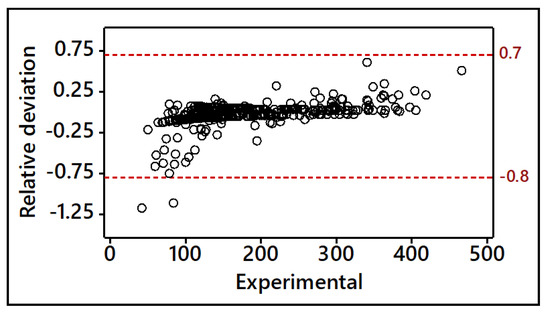
Figure 5.
Residual plot of relative deviation vs. experimental adhesive strength.
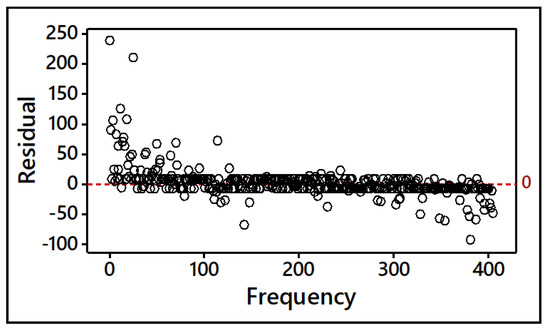
Figure 6.
Residual plot of residual vs. frequency.
For further evaluation of the performance of the model, the predicted results are assessed using four accuracy indices; such as: Pearson correlation coefficient (R), mean absolute error (MAE), root mean square error (RMSE), and fractional bias (FB). The corresponding indices are expressed as follows:
where, VExp is the experimental adhesive strength, is the mean experimental adhesive strength, VM is the model predicted adhesive strength, N is the total number of data. The results of all the performance indices for the model are shown in Table 5. High values of Pearson correlation coefficient (>0.95) with statistical a p-value of 0.000 indicating predicted and experimental results were superimposed. All the statistical error parameters (e.g., MAE, RMSE) were observed to be low (see Table 5 and Ref. [32]). Besides, the performance of a model is acceptable if and has a value of zero for an ideal model [4,5]. Thus, the results, as shown in Table 3, indicated that the predictive model used in this study were strongly reliable in predictions. In summary, the BOA-SVR predictions are satisfactory when the correlation coefficient and errors estimates are found to be close to 1 and low, respectively. It is clear that the models met the criteria.
Table 5.
Performance indicator of the model.
4. Conclusions
This study investigates the impact of several factors (conditions, binder types, CNT doses) on the adhesive behavior of asphalt. A hybrid AI model using BOA-based SVR techniques was developed for anticipating the asphalt adhesive force. A total of 405 experimental data of asphalt adhesive force with different combination of factors were used for the model development. Atomic force microscopy (AFM) was utilized to estimate the asphalt adhesive force. The performance of the model was assessed utilizing the different performance measuring indicators. From the investigation, the following bottom-lines can be considered:
- A hybrid AI model of BOA-SVR is developed for the anticipation of adhesive force of asphalt.
- The mean, median and standard deviation of experimental and predicted adhesive force seems very close. The interquartile ranges of the experimental and predicted results are also closed which are 111.78 and 101.95, respectively.
- The predicted results overlap with those of the laboratory tests, since the R2 and adjusted R2 values between the experimental and predicted values are approximately 90.5%.
- The developed model shows that the relative deviations are well dispersed around zero line with low deviations. The residual data points also lie around the zero line, which further validates the reliability of the proposed model.
- The values of statistical error parameters (MAE, RMSE) were obtained to be low. Besides, the value of fractional bias ( is found to be 0.0213, which is very close to zero, indicating that the model is reliable and robust.
Author Contributions
M.A., software and investigation; M.A.G., writing—review and editing; K.K., writing—review and editing; S.M.Z.H., writing—review and editing; M.A. and S.M.Z.H., graphs and review; K.K. and M.A.G. editing and writing; M.A., funding and review. All authors have read and agreed to the published version of the manuscript.
Funding
The authors extend their appreciation to the Deputyship for Research and Innovation, Ministry of Education in Saudi Arabia for funding this research work through the project number “IFT20076”.
Institutional Review Board Statement
Not Applicable.
Informed Consent Statement
Not Applicable.
Data Availability Statement
The data presented in this study are available on request from the corresponding author.
Conflicts of Interest
The authors declare no conflict of interest. The founding sponsors had no role in the design of the study; in the collection, analyses or interpretation of data; in the writing of the manuscript; nor in the decision to publish the results.
References
- Yao, H.; Dai, Q.; You, Z.; Ye, M.; Yap, Y.K. Rheological properties, low-temperature cracking resistance, and optical performance of exfoliated graphite nanoplatelets modified asphalt binder. Constr. Build. Mater. 2016, 113, 988–996. [Google Scholar] [CrossRef]
- Xiao, F.; Amirkhanian, A.; Amirkhanian, S. Influence on rheological characteristics of asphalt binders containing carbon nanoparticles. J. Mater. Civ. Eng. 2011, 23, 423–431. [Google Scholar] [CrossRef]
- Hassan, M.; Mamun, A.A.; Hossain, M.; Arifuzzaman, M. Moisture damage modeling in lime and chemically modified asphalt at nanolevel using ensemble computational intelligence. Computat. Intell. Neurosci. 2018, 1100–1114. [Google Scholar] [CrossRef]
- Arifuzzaman, M.; Gazder, U.; Islam, M.; Mamun, A. Prediction and sensitivity analysis of CNTs-modified asphalt’s adhesion force using a radial basis neural network model. J. Adhes. Sci. Technol. 2019, 34, 1100–1114. [Google Scholar] [CrossRef]
- Arifuzzaman, M. Advanced ANN prediction of moisture damage in CNT modified asphalt binder. Soft Comput. Civ. Eng. 2017, 1, 1–11. [Google Scholar]
- Arifuzzaman, M.; Islam, M.S.; Hossain, M.I. Moisture damage evaluation in SBS and lime modified asphalt using AFM and artificial intelligence. Neural Comput. Appl. 2017, 28, 125–134. [Google Scholar] [CrossRef]
- Galan, J.J.; Silva, L.M.; Pérez, I.; Pasandín, A.R. Mechanical Behavior of Hot-Mix Asphalt Made with Recycled Concrete Aggregates from Construction and Demolition Waste: A Design of Experiments Approach. Sustainability 2019, 11, 3730. [Google Scholar] [CrossRef]
- Plati, C.; Cliatt, B. A Sustainability Perspective for Unbound Reclaimed Asphalt Pavement (RAP) as a Pavement Base Material. Sustainability 2019, 11, 78. [Google Scholar] [CrossRef]
- Anwar, M.K.; Shah, S.A.R.; Sadiq, A.N.; Siddiq, M.U.; Ahmad, H.; Nawaz, S.; Javead, A.; Saeed, M.H.; Khan, A.R. Symmetric Performance Analysis for Mechanical Properties of Sustainable Asphalt Materials under Varying Temperature Conditions: An Application of DT and NDT Digital Techniques. Symmetry 2020, 12, 433. [Google Scholar] [CrossRef]
- Han, S.; Chung, H.-W.; Subgranon, T.; Tia, M. Development of Mix Designs for Minimally Refined Reclaimed Asphalt Pavement (RAP) Concrete for Florida Concrete Test Road. Sustainability 2018, 10, 2598. [Google Scholar] [CrossRef]
- Arifuzzaman, M.; Tarefder, R.; Islam, M. Behavior of Carbon Nano-Tubes (CNTs) as Modifier to Resist Aging and Moisture Damage in Asphalt. Nanosci. Nanotechnol. Asia 2020, 10, 1–7. [Google Scholar] [CrossRef]
- Arifuzzaman, M.; Gazder, U.; Alam, M.; Sirin, O.; Mamun, A. Modelling of Asphalt’s Adhesive Behaviour Using Classification and Regression Tree (CART) Analysis. Comput. Intell. Neurosci. 2019, 7. [Google Scholar] [CrossRef]
- Mamun, A.; Arifuzzaman, M.; Taha, R. Nano scale aging characterization of carbon nanotube modified asphalt binders. In Proceedings of the Advances in Materials and Pavement Prediction; CRC Press: London, UK, 2018; p. 4. [Google Scholar] [CrossRef]
- Espinoza, M.; Campos, N.; Yang, R.; Ozer, H.; Aguiar-Moya, J.P.; Baldi, A.; Loría-Salazar, L.G.; Al-Qadi, I.L. Carbon Footprint Estimation in Road Construction: La Abundancia–Florencia Case Study. Sustainability 2019, 11, 2276. [Google Scholar] [CrossRef]
- Cantisani, G.; Di Mascio, P.; Moretti, L. Comparative Life Cycle Assessment of Lighting Systems and Road Pavements in an Italian Twin-Tube Road Tunnel. Sustainability 2018, 10, 4165. [Google Scholar] [CrossRef]
- Kleizienė, R.; Šernas, O.; Vaitkus, A.; Simanavičienė, R. Asphalt Pavement Acoustic Performance Model. Sustainability 2019, 11, 2938. [Google Scholar] [CrossRef]
- Amirkhanian, A.N.; Amirkhanian, S.N. Long-term ageing influence on rheological characteristics of asphalt binders containing carbon nanoparticles. Int. J. Pavement Eng. 2011, 12, 533–541. [Google Scholar]
- Rath, P.; Love, J.E.; Buttlar, W.G.; Reis, H. Performance Analysis of Asphalt Mixtures Modified with Ground Tire Rubber Modifiers and Recycled Materials. Sustainability 2019, 11, 1792. [Google Scholar] [CrossRef]
- White, G. A Synthesis on the Effects of Two Commercial Recycled Plastics on the Properties of Bitumen and Asphalt. Sustainability 2020, 12, 8594. [Google Scholar] [CrossRef]
- Rodrigues, C.; Capitão, S.; Picado-Santos, L.; Almeida, A. Full Recycling of Asphalt Concrete with Waste Cooking Oil as Rejuvenator and LDPE from Urban Waste as Binder Modifier. Sustainability 2020, 12, 8222. [Google Scholar] [CrossRef]
- Omranian, S.R.; Hamzah, M.O.; Pipintakos, G.; Vuye, C.; Hasan, M.R.M. Effects of Short-Term Aging on the Compactibility and Volumetric Properties of Asphalt Mixtures Using the Response Surface Method. Sustainability 2020, 12, 6181. [Google Scholar] [CrossRef]
- Liu, H.; Fu, L.; Jiao, Y.; Tao, J.; Wang, X. Short-Term Aging Effect on Properties of Sustainable Pavement Asphalts Modified by Waste Rubber and Diatomite. Sustainability 2017, 9, 996. [Google Scholar]
- Ge, D.; Zhou, X.; Chen, S.; Jin, D.; You, Z. Laboratory Evaluation of the Residue of Rubber-Modified Emulsified Asphalt. Sustainability 2020, 12, 8383. [Google Scholar] [CrossRef]
- Zhang, H.-L.; Su, M.-M.; Zhao, S.-F.; Zhang, Y.-P.; Zhang, Z.-P. High and low temperature properties of nano-particles/polymer modified asphalt. Constr. Build. Mater. 2016, 114, 323–332. [Google Scholar] [CrossRef]
- de Melo, J.V.S.; Trichês, G. Evaluation of properties and fatigue life estimation of asphalt mixture modified by organophilic nanoclay. Constr. Build. Mater. 2017, 140, 364–373. [Google Scholar] [CrossRef]
- Shahriari, B.; Swersky, K.; Wang, Z.; Adams, R.P.; De Freitas, N. Taking the human out of the loop: A review of Bayesian optimization. Proc. IEEE 2016, 4, 148–175. [Google Scholar] [CrossRef]
- Mockus, J. Bayesian Approach to Global Optimization, 1st ed.; Springer: Dordrecht, The Netherlands, 1989; p. 270. [Google Scholar] [CrossRef]
- Snoek, J.; Larochelle, H.; Adams, R.P. Practical Bayesian optimization of machine learning algorithms. Adv. Neural Inf. Process. Syst. 2012, 4, 2951–2959. [Google Scholar]
- Kumar, A.; Luo, J.; Bennett, G.F. Statistical evaluation of Lower Flammability Distance(LFD) using four hazardous release models. Process Saf. Prog. 1993, 12, 1–11. [Google Scholar] [CrossRef]
- Sultana, N.; Hossain, S.M.; Alam, M.; Islam, M.; Al Abtah, M. Soft computing approaches for comparative prediction of the mechanical properties of jute fiber reinforced concrete. Adv. Eng. Softw. 2020, 149, 102887. [Google Scholar] [CrossRef]
- Arifuzzaman, M.; Hassan, R. Moisture damage prediction of polymer modified asphalt binder using support vector regression. J. Comput. Theor. Nanosci. 2014, 11, 2221–2227. [Google Scholar] [CrossRef]
- Kumar, A.; Bellam, N.K.; Sud, A. Performance of an industrial source complex model: Predicting long-term concentrations in an urban area. Environ. Prog. 1999, 18, 93–100. [Google Scholar] [CrossRef]
- Shafabakhsh, G.; Mirabdolazimi, S.; Sadeghnejad, M. Evaluation the effect of nano-tio2 on the rutting and fatigue behavior of asphalt mixtures. Constr. Build. Mater. 2014, 54, 566–571. [Google Scholar] [CrossRef]


Publisher’s Note: MDPI stays neutral with regard to jurisdictional claims in published maps and institutional affiliations. |
© 2020 by the authors. Licensee MDPI, Basel, Switzerland. This article is an open access article distributed under the terms and conditions of the Creative Commons Attribution (CC BY) license (http://creativecommons.org/licenses/by/4.0/).