Abstract
The study aims to investigate the effects of Burdur (Turkey) marble on human health by interpreting their radioactivity concentration (226Ra, 232Th, and 40K), radiological hazard parameters, chemical concentration, physical properties, and all data related to these features by using multivariate statistical methods. Chemical and radionuclide analyses were performed on marble samples. The data were interpreted by statistical analysis. According to the regression model, an increase in the concentration of vanadium carried to the environment by hydrothermal waters causes a 4.452-fold higher concentration of 226Ra. The R2 value of the model was 0.64 and it was statistically significant. The maximum concentration of 226Ra in Isparta Davraz Beige sample (M7) exceeded the values of some countries’ standards. Except for M7, the analyzed sorts of marble can be used safely in dwellings and public buildings.
Keywords:
radionuclide; radiological hazards; multivariate statistics; data analysis; building materials 2010 Mathematics Subject Classification:
62H10; 62H86; 62H25; 62H30
1. Introduction
People prefer natural products instead of fabricated ones for a healthier life. Marble is the most important and widely used building material obtained from natural resources. The use of marble as a building material has gained importance in the national and international arena. It is known that all building materials contain different rates of natural radioactivity. Some marbles may have naturally occurring radioactive materials (NORM) originating from the Earth’s crust. People who come into contact with this kind of the marble may be exposed to ionizing radiation. In particular, the detection of ionizing radiation activities affecting the cells on the bone surface and bone marrow is important for the protection of human health [1]. Many scientific studies state that 226Ra (radium), 232Th (thorium), and 40K (potassium), which are among the radionuclides, should be taken into consideration and their specific activity doses and effects should be measurable [2].
Since about 80% of people spend most of their time at their homes or offices, buildings are very significant in human life [3]. Among building materials, natural marble is in common use [4,5,6,7,8]. Long-term whole-body exposure to radiation due to the use of such granite and marble materials in buildings can affect the health of the individuals using them [9,10]. Therefore, it is very important to compare the natural radioactivity levels of marble (226Ra, 232Th, and 40K) and their associated radiological impact indexes with the accepted limit values. Several studies have been conducted to reveal the reason why the radioactivity of the samples depends on the grain size. Some differences may be observed depending on the type of sample investigated [11,12,13,14,15,16,17].
Thus, knowing the activity concentrations for a given grain size facilitates the selection of building materials with the minimum radiation risk by taking their grain size into consideration. Health organizations, including the World Health Organization (WHO), have embraced strong measures to minimize health risks associated with exposure to internal radiation [18].
Marble is used as an interior and exterior flooring material for buildings, thresholds, windowsills, stairs, columns, facades, and decorations. Marble consists mainly of calcite (a crystalline form of calcium carbonate) and other minerals of metamorphic rock. It is defined as a dolomite rock and/or any calcareous rock with a polishable surface. Marble, which is used as a flooring material in dwellings and a lining material on walls, depending on the geological and geographical conditions, has a high natural radioactivity concentration. Moreover, the presence of other minerals in marble gives it a variety of attractive colors [9]. Therefore, it is important to examine the mineralogical, physical, and chemical concentrations of the samples when conducting radiation studies on them [19,20,21,22]. Radionuclide concentrations, the radiological hazard parameters obtained from them, and the results of chemical analysis can be examined using multivariate statistical analyses. Successful assessments can be made on radionuclides and their origins by this method.
In this context, the Burdur region (Turkey) was chosen as the study area since the marble sector has been quite active and no similar study has been carried out there before. The Anatolian region holds one of the richest natural stone formations in the world. Marble has different properties based on its region. The Burdur province, which is located in the south of Turkey, holds the most important marble reserves in the world. Therefore, it is important to examine the radiation levels emitted by the Burdur marble used as building materials to investigate the radiological risks. This study aims to conduct the required analyses and calculations to take the necessary health precautions with marble samples, which are widely used as building materials in the Burdur region. Within the scope of the study, the activity concentrations of radionuclides (226Ra, 232Th, and 40K) in the marble samples were analyzed and their radiological hazard parameters (radiological impact indexes) were calculated; the chemical concentrations of the same samples and the correlation between them were also analyzed using multivariate statistical analysis.
The specific activities of 226Ra, 232Th, and 40K were identified in marble samples used as building materials by gamma-ray spectrometry using a high-purity germanium HPGe co-axial detector. Radium equivalent activity index (Raeq), absorbed gamma dose rate (D), alpha index (Iα), gamma index (Iγ), external gamma radiation (Hex), internal alpha radiation (Hin), annual effective dose equivalent (AEDE), annual gonadal dose equivalent (AGDE), excess lifetime cancer risk (ELCR), and activity utilization index (AUI) were calculated to investigate their radiological effects and were compared with the limit values proposed in the United Nations Scientific Committee on the Effects of Atomic Radiation (UNSCEAR) report and international studies. The same marble samples were analyzed to examine their chemical and physical properties. The determination of the radiological effects of hydrothermal waters on marble has been attempted. To determine this, multivariate statistical analyses were performed on all data. The correlations between the chemical analysis results and radionuclides were determined. Using products with minimum radiation risk is essential and necessary for the people using them to take required health precautions. This study on determining radiological effect in relation to hydrothermal fluids in marble used in the construction industry can be defined as new research.
2. Materials and Methods
2.1. Sampling and Preparation
The marble samples were taken from the Burdur region covering Burdur, Korkuteli, Denizli, Isparta, Bursa, and Mugla. The samples, which were used in the construction sector, were collected for radioactivity measurement. The marble samples were named with the names of the quarries they were taken from. These names are used in the marble definitions to understand which quarries they came from. A total of 36 marble samples were taken from important marble companies which export their products worldwide. The number of samples representing all the marble sold in this region was intended to be reached. Marble is sold in blocks or plates. It was not appropriate to take samples by cutting blocks of marble. Therefore, while sampling from the marble companies, dimensioned samples representing block and plate marble were obtained. The raw samples of 10 cm × 10 cm × 10 cm in size were dried for 24 h at room temperature. Then, the samples were grouped according to their physical properties. A total of 36 samples selected from Burdur marble were classified into 12 groups according to their characteristics. Although the marble companies were different, the sample types were from the same marble quarries. Therefore, the marble was physically, mineralogically, and chemically the same marble. It was easy to group them. Then, they were prepared for the measurement of radionuclide activity concentration and element concentration by grinding and homogenization at the Akdeniz University laboratory in Turkey. Sample containers were cleaned with ethyl alcohol. After that, each of the samples was left to rest for 30 days in a radon-impermeable plastic storage container with a geometry of 5 × 6 cm. The permanent sealing of 226Ra and 222Rn was ensured by closing the containers.
2.2. Gamma Spectrometric Analyses of the Samples and Dose Calculations
U, Th, and K activities in the Burdur marble samples were examined by a gamma-ray spectrometry system with detector calibration using an electrically cooled P-type coaxial HPGe detector in the Physics Department at Akdeniz University. The Amatek-Ortec (GEM40P4-83) model HPGe detector had a relative efficiency of 40%, its full width at half maximum (FWHM) value for the Co57 radioisotope peak at 122 keV was 768eV, and its FWHM for the Co60 radioisotope peak at 1332 keV was 1.85 keV. The HPGe detector was connected to a computer and a Nuclear Instrumentation Module (NIM) bin, consisting of a spectroscopy amplifier, an analog converter, and a power supply belonging to Ortec. The HPGe detector was placed in a lead shield with a thickness of 10 cm. The inner surface of the lead shield was covered with 2 mm of copper to filter X-rays that may have been caused by the shield. Maestro and GF3 software packages were used for data collection and analysis. The energy and efficiency calibrations of the detector were carried out using reference materials with the codes “IAEA-375, IAEA-RGU-1, IAEA-RGTh-1, IAEA-RGK-1” supplied by the “Saraykoy Nuclear Research and Training Center”.
The radioactivity measurements and dose calculations were measured for 10,000 s for each sample after performing energy and efficiency calibrations in the system. The determination of the net peak area to avoid artificial high anomaly values was attempted. Therefore, attention was paid to eliminate the external anomalies during the measurements for the same time interval. Particularly, the background measurement was carried out before placing the Burdur marble samples in the device. Thus, external anomalies were eliminated. The activity calculations were conducted using the equation below:
where N: net peak area, ε: efficiency, P: the probability of releasing gamma by the relevant radionuclides, t: counting time, and m: mass (kg).
In the activity calculations of 238U (226Ra), 232Th (Ac228), and 40K radionuclides, the energy peaks of 214Bi-352 keV, 228Ac-911 keV, and 40K-1460 keV were used, respectively, with the gamma spectroscopy system.
The minimum detectable activity (MDA) values of the 226Ra, 232Th, and 40K radionuclides of the 1 kg samples measured for 10,000 s by the gamma spectroscopy system are given in Table 1.

Table 1.
Minimum detectable activity values for the measurement time of 10,000 s.
Similar studies have been conducted on radiometric measurements of rocks and soils [15,23,24,25]. Radiological parameters and hazard indices were calculated using the results of the radiometric analysis. Multivariate statistical analyses were performed using all of these values.
2.3. Measurements of the Radiological Parameters
2.3.1. Radium Equivalent Activity Index (Raeq)
The radiation exposure values of 226Ra, 232Th, and 40K and in building materials are not the same; therefore, they are defined using radium equivalent activity. Raeq was measured in Bq/kg to provide uniformity concerning the radiation exposure values reported in the literature [26,27,28]. Particularly, these calculations were made to compare the specific activities of materials containing different amounts of 226Ra, 232Th, and 40K radionuclides. The use of construction materials with a radium equivalent activity value of 370 Bq/kg causes the people living in the building to be exposed to a dose of 1.5 mSv per year [29]. It is used to compare the activity concentration of materials containing different amounts of 226Ra, 40K, and 232Th radionuclides. The radium equivalent activity index was calculated as follows [29,30,31].
where ARa, ATh, and AK are the activity concentrations of 226Ra, 232Th, and 40K in Bq/kg, respectively.
2.3.2. Absorbed Gamma Dose Rate (D)
The main contribution to absorbed gamma dose rate (D) in the air comes from terrestrial gamma-ray radionuclides existing in trace amounts in the soil. The measurements of the dose rate particularly depend on the measurements of specific activity concentrations of radionuclides from the Ra226, Th232, and K40 family. According to a report [29] and European Commission reports, D in the air at a height of 1 m above the ground may be calculated by using the following equation [26]:
where ATh, ARa, and AK are the activity concentrations of 232Th, 226Ra, and 40K radionuclides, respectively.
2.3.3. Hazard Indices
Alpha Index (Iα)
The alpha index (Iα) is calculated using the following equation, where ARa is the activity concentration of 226Ra in building materials. The value of the alpha index (Iα) ranges between 0.01 and 0.32 on average. With a value of 0.32, the marble sample M7 (Isparta Davraz Beige) had the highest value among all samples. All samples were suggested to have an alpha index value of < 1; therefore, the samples meeting this condition were deemed to fall below the radon limit value.
Gamma Index (Iγ)
The European Commission (EC) suggests two criteria for the gamma dosage of building materials: the exemption criterion of gamma dosage (0.3 mSv/y) and the upper limit of gamma dosage (1 mSv/y). Most countries use the upper limit (1 mSv/y) as a control parameter. The gamma index (Iγ) is calculated by using the following equation. Gamma index values of (Iγ) ≤ 1 correspond to 0.3. Additionally, gamma index values (Iγ) ≤ 3 correspond to 1 mSv/y.
External Gamma Radiation (Hex)
is used to determine the external radiation hazard index depending on the gamma rays emitted from outside of the building materials used in buildings. The model of places an upper limit on the external gamma radiation dose from building materials to unity, which corresponds to a radium equivalent activity of 370 Bq/kg. The external gamma radiation is defined with the following equation [3]:
Internal Alpha Radiation (Hin)
, depending on , is also a very important parameter in terms of radiology. 222Rn gas, as well as gamma rays, play a very important role. 222Rn is used to reduce the internal radiation hazard [28]. Therefore, short-lived products and radon are characterized by . Internal alpha radiation is evaluated using the following equation [32]:
The Annual Effective Dose Equivalent (AEDE)
The annual effective dose rate is calculated to understand the effects of absorbed dose rates on human health. Since the existing sediments are the major materials mixed with cement and cement products in terms of their use as building materials, it is very important to determine the annual effective dose equivalent value of samples from each site. The calculations of AEDE depend on the value of D in the air. To calculate this value, the outdoor occupancy factor, and dose conversion coefficient must be taken into account in the conversion from D in the air to AEDE received by occupancy. The values of these two parameters vary depending on the average age of the population and the climate in the area considered. The UNSCEAR [33] report suggests using 0.7 Sv/Gy as the dose conversion coefficient for females and males and outdoor and indoor areas, and 0.2 as the outdoor occupancy factor. Therefore, the outdoor AEDE can be calculated using the following equation [1]:
The Annual Gonadal Dose Equivalent (AGDE)
The World Health Organization (WHO) takes into account the annual gonadal dose equivalent (AGDE) values in calculating radioactive activities in bone marrow and bone surface cells. AGDE can be defined as follows [2]:
Excess Lifetime Cancer Risk (ELCRoutdoor)
The people who are exposed to radiation for a long time are assumed to have the risk of getting cancer. While the cancer incidence in males during their life is 44%, this rate is 38% in females. The ELCR is the additional or extra risk of developing cancer due to exposure to a toxic substance over the lifetime of an individual. It is calculated using the following equation, where AEDE(outdoor) denotes the annual effective dose equivalent, DL denotes the duration of life (70 years), and RF denotes the risk factor (Sv−1), which is the fatal cancer risk as per Sievert [23].
Activity Utilization Index (AUI)
The activity utilization index was calculated by applying different combinations of the three radionuclides in building materials by applying appropriate conversion factors and dose rates in the air. It is the fractional contributions of the actual concentrations of these radionuclides to the total dose rate in the air due to gamma radiation. It is calculated using the following equation:
2.4. Physical Properties and Chemical Analysis
The physical properties of the 12 marble samples used were examined and their structural properties were determined. The same samples were homogenized by grinding in agate mortar at the Akdeniz University Mineral Deposits Laboratory and prepared for chemical analysis. Chemical analyses (Certificate of Analysis: ANK14000275.1) were carried out using the ICP-ES (Procedure Code: MA300) method by multi-acid digestion packages following the international standards at ACME Labs in Canada. Multiple acid digestion packets were used to give a value close to the total values for all elements. For each sample, 0.25 g were separated, heated to fuming in HN03-HCl04-HF and allowed to dry. The remaining residue was then dissolved in HCl and analyzed. The results of the analysis (Ca, Calcium; Al, Aluminium; Na, Sodium; K, Potassium; P, Fosforium; Mg, Magnesium; La, Lanthanum; Cr, Chromium; Ba, Barium; Zr, Zirconium; Y, Yttriyum; Nb, Niobium; Cu, Copper; Pb, Lead; Zn, Zinc; Ni, Nickel; Co, Cobalt; Mn, Manganese; Fe, Iron; Sr, Strontium; Cd, Cadmium; Bi, Bismuth; V, Vanadium) are shown in ppm. The graphics of the element concentrations were prepared.
2.5. Multivariate Statistics
Statistical analysis and multivariate statistical methods were used to reveal the correlation between the variables of marble and their effect on the distribution of natural radionuclides [6,16,23,28,34,35,36,37,38,39,40,41,42,43,44,45,46,47]. Firstly, descriptive statistics were determined and then multivariate statistical analyses, such as correlation, factor, cluster, and regression analysis, were performed. The dataset was examined in terms of the required conditions for these analyses. Spearman correlation analysis was carried out to determine the correlations between the radiological hazard parameters of 226Ra, 232Th, and 40K radioactivity concentrations and the degree of these correlations. In this context, the Raeq, D, Iα, Iγ, Hex, Hin, AEDE, AGDE, ELCR, and AUI results of the chemical analysis were tested using Spearman correlation analysis. Descriptive statistics (skewness, kurtosis, frequency distribution), multivariate statistics, correlation analysis (Kolmogorov–Smirnov and Shapiro–Wilk normality tests, Spearman’s correlation), factor analysis (scree plot of variables, principal component analysis (PCA)), cluster analysis (CA) (hierarchical cluster), regression analysis (Durbin–Watson, model summary, ANOVA, regression model), and related graphics of marble samples were prepared using SPSS 23 software.
With descriptive statistics, simple statistical results of the data and how the data are distributed were investigated. Whether the data showed normal distribution or not was investigated by correlation analysis. In addition, the relationship of the data with each other and the level of relations between them were found. With factor analysis, it was ensured that a large number of variables formed fewer factors compared to the correlation relationship between them. In this way, variables were more easily interpreted. With the regression analysis, the explanatory rates of the relationship between the data or with each other were investigated and their modeling was done.
3. Results and Discussion
3.1. The Concentration of Natural Radionuclides
The mean values of the measured activity concentrations of 232Th, 226Ra, and 40K in the marble samples collected from the Burdur region are presented in Table 2. High-resolution gamma-ray spectroscopy was used to determine the natural radioactivity concentrations of 232Th, 226Ra, and 40K content in the Burdur marble samples.

Table 2.
Physical properties, radioactivity values, indices, and chemical analysis results of marble samples.
3.2. Radium Equivalent Activity (Raeq)
The Raeq values of the samples, which range between 14.12 and 72.8 Bq/kg (sample with the maximum value: M7, Isparta Davraz Beige), are below the acceptable limit values (370–740 Bg/kg) for industrial products [33,48]. The results reveal that the marble samples used as construction materials pose no radiological health risk to the population.
3.3. Absorbed Gamma dose Rate (D)
The calculated absorbed dose rate values of the samples range between 6.78 and 33.82 with an average value of 11.34 . According to the recommended world averages, the average value should be between 10 and 200 [1].
3.4. Alpha Index (Iα)
The averages of the alpha index (Iα) values of the samples range between 0.01 and 0.32. With a value of 0.32, sample M7 (Isparta Davraz Beige) has the highest value among all the marble samples, however, it is below the recommended limit value of (Iα < 1). This result shows that there is no danger of these marble samples in terms of radon inhalation.
3.5. Gamma Index (Iγ)
The gamma index (Iγ) measurements of the samples show that the value range between is 0.21 and 0.42. Thus, the sample M7 (Isparta Davraz Beige), which has the highest activity concentration value according to the calculations, exceeds 0.3 mSv/y, which is the exemption criterion.
However, it does not exceed the upper limit (1 mSv/y). It is observed that the marble samples, except for M7 (Isparta Davraz Beige), do not have an alarming situation. Therefore, all marble except for this one (Isparta Davraz Beige) can be used as a building material.
3.6. External Gamma Radiation (Hex)
The Hex value is required to be less than 1 to fall within health limits. This Hex value depends on the Raeq upper limit (370 Bq/kg). In this study, the Hex values were measured to be between 0.05 and 0.37. The estimated average values of Hex are 0.1. Since the values of the samples seem to be lower than the recommended value, their radiation hazard may be neglected.
3.7. Internal Alpha Radiation (Hin)
Since the inhalation of radon and its products also pose a risk of radiation, Hin values were examined. Hin values were measured to be between 0.04 and 0.2 (M7). In this study, the mean internal radiation hazard is 0.1, which is below unity. Excess lifetime cancer risk values of all the marble samples are below the world average (2.9.10-4) reported by UNSCEAR [33].
3.8. The Annual Effective Dose Equivalent (AEDE)
The AEDE values calculated for marble samples range between 8.32 and 41.48 micSv/year. The mean AEDE of the marble samples in this study was determined to be less than the world average (70 mSv/y).
3.9. The Annual Gonadal Dose Equivalent (AGDE)
AGDE values calculated for marble samples range between 48.06 and 228.7 µSv y−1. The mean AGDE values of the samples are lower than the standard annual average (300 mSv/y).
3.10. Excess Lifetime Cancer Risk (ELCRoutdoor)
In this study, the mean excess lifetime cancer risk values were calculated to be in the range of (0.03–0.15) × 10−4. The obtained results fall below the world average, which is 2.9 × 10⁻⁴ µSv yr−1.
3.11. Activity Utilization Index (AUI)
The average AUI values calculated for the marble samples range between 0.28 and 1.46. With a value of 1.46, sample M7 (Isparta Davraz Beige) has the highest value among all the marble samples. Depending on the annual dose, the AUI is the index exceeding the external gamma radiation originating from the surface. The index value I ≤ 1 corresponds to 0.3 mSv/y and index value I ≤ 3 corresponds to 1 mSv/y. Only the AUI value of sample M7 (Isparta Davraz Beige) corresponds to 1 mSv/y.
4. Physical Properties and Chemical Analysis
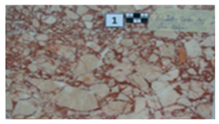
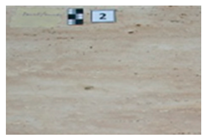
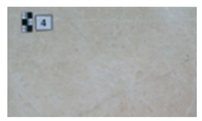
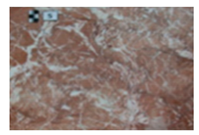
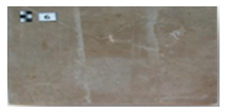
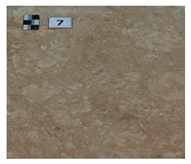
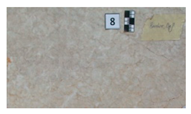
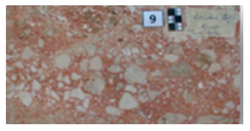
The physical properties of all the marble samples were examined and it was observed that the marble samples were typically limestone. The marble was composed of calcium minerals with various properties with thin, medium, and thick layers. These metamorphic rocks were observed to be in white, yellow, beige, and brown colors. In some samples, microcrystalline limestone, sandy limestone, micro-mesocrystalline calcite, alternation, banded and intraclast, pisolitic, hollow structures, and occasionally fine microconglomerate levels were observed.
The chemical analyses revealed that the samples’ element concentrations and their proportions were different. According to chemical analyses, the following elements, which were considered to be related to radionuclides, were found to be in great proportions in the given samples: the rate of Bi concentration is high in the sample M7, whereas the first five samples with a higher rate of V concentration are M7, M10, M1, M6, and M5. On the other hand, the following elements were observed at a higher rate in the corresponding samples: the first seven samples with a higher rate of Cd concentration are M8, M5, M1, M3, M4, M7, and M9; the first five samples with a higher rate of Y element concentration are M9, M5, M8, M11, and M1; the first five samples with a higher rate of La concentration are M9, M5, M11, M1, and M8; and the first four samples with a higher rate of P concentration are M11, M9, M1, and M7.
The highest 226Ra anomaly values are in the M7, M6 and M10 samples, from large to small. Bi and V elements and Ra value are related in the M7 example. The highest Th anomaly values are in the M2, M1 and M5 samples. Cd element and Th anomaly were associated in the M5 and M1 samples. The highest K anomaly values are in the M9, M1 and M5 samples. Y, La, and P elements and K anomaly were associated, especially in the M9 sample.
5. Multivariate Statistical Analysis
5.1. Descriptive Statistics
According to descriptive statistics, the data with the highest averages belonged to 40K, 226Ra, and 232Th, respectively (Table S1). The skewness and kurtosis values of the curve of the distribution of the radionuclides were drawn (Table S1, Figure S1). The skewness degrees of 226Ra, 40K, and 232Th were found to be 2.857, 1.173, and 0.388, respectively. According to these distributions, Ra and K radionuclides showed positive skewness. 226Ra values showed a positively right-skewed asymmetric distribution with a tendency to low values. Since the 226 Ra values of the samples tended to be low, it could be interpreted that their radiation effects were also low. Only the Ra value of sample M7 (Isparta Davraz Beige) was found to be high, which could be interpreted as posing a risk of radiation. 232Th values were observed to have a normal distribution.
Kurtosis refers to a measure of peakedness and flatness of the data relative to the normal distribution. According to the kurtosis value, 226Ra (8.807 > 3) had a peaked distribution with a high range (range = 61.85). Sample M7 (Isparta Davraz Beige) was considered to cause this high range. According to the kurtosis values of 40K (1.53 < 3) and 232Th (−0.725 < 3), they were determined to have a flat distribution.
5.2. Correlation Analysis
A correlation analysis was performed to reveal the relationship between radionuclides, radiological parameters, and chemical concentrations. Kolmogorov–Smirnov and Shapiro–Wilk normal tests are performed for the statistical analysis of data obtained in different ways [10,16,49]. The normality of the data was tested performing Kolmogorov–Smirnov and Shapiro–Wilk tests (Table S2). The significance values of all data (except for 232Th and Al), were found to be lower than 0.05 (p < 0.05). Therefore, the data were analyzed using Spearman’s correlation coefficient.
A very strong positive correlation was observed between all the calculated radiological hazard parameters and the 226Ra radionuclide (Table 3). The 226Ra activities in the marble samples were determined to be important. A strong positive correlation was found between radiological hazard parameters and vanadium (V), which was a chemical concentration. 226Ra was found to have a negative correlation with Zn (very high) and Fe (high).

Table 3.
Spearman’s correlation coefficient table.
232Th was observed to have no positive correlation with 226Ra and radiological hazard parameters. Although a positive correlation was observed between 40K and Iγ, there was no correlation between 226Ra and radiological hazard parameters. Therefore, the 232Th and 40K radionuclides’ contribution to the radioactivity of the marble was considered to be not significant. The 40K radionuclide was observed to have a positive correlation with K (very high), Ni (very high), and Mn (high) heavy metals. A high correlation was found between 226Ra and 232Th and a high negative correlation was found between 232Th and Iα. It can be interpreted that those with a positive correlation with 226Ra have the same origin, while those with a negative correlation have different origins.
Including chemical concentrations in the analysis provided important information about the correlation between these radionuclides and their origins.
5.3. Factor Analysis
Factor analysis was performed to obtain a small number of identifiable significant variables from a great number of variables. Generally, factors with a value equal to or greater than 1 are determined as significant factors. According to “rotation sums of squared loadings”, seven factors were determined and 95.060% of the cumulative value was explained and the data were graded perfectly. The eighth factor’s eigenvalue was found to be below 1 (Table 4).

Table 4.
Factor analysis of variables.
Analyzing the scree plot, it can be seen that the data gets flattened after the seventh factor; therefore, seven factors were obtained (Figure S2). Different factor groups can be considered as properties that determine marble types. It is a significant result to determine seven factors from the marble samples of 12 types according to their physical properties. The number of factors obtained was found to be compatible with the 12 marble types.
Principal component analysis (PCA) provided seven components (Table 5). During the analysis, the number of components was not kept fixed; instead, it was determined automatically. At the end of the analysis, the following factors were determined: Factor 1: AGDE, AEDE, D, Raeq, Hin, AUI, ELCR, Hex, 226Ra, Iα, Bi, V, Iγ; Factor 2: Cu, Co, Mn, Ni; Factor 3: P, La, Na, Y, 40K; Factor 4: Fe, K, Zr, 232Th; Factor 5: Al, Ba, Pb, Sr; Factor 6: Ca, Nb; Factor 7: Zn. The presence of radionuclides together with other variables may indicate that they have similar sources. PCA analysis was found to be compatible with correlation analysis. Analyzing the results of the chemical analyses together with radionuclides facilitated the explanation of the natural origins of the radionuclides and was proved to be successful.

Table 5.
Principal component analysis of variables.
5.4. Cluster Analysis (CA)
According to the hierarchical cluster analysis dendrogram prepared based on the samples, in general, the similarities were grouped under three (3) groups of Q-type clusters at the arbitrary similarity level of 50% (Figure 1). A hierarchical cluster analysis dendrogram was prepared to determine the similarity of the 12 marble samples. According to the dendrogram, the first group is composed of the samples M2, M6, M10, M7, and M4 and sample M9, which is connected to them externally; these samples have similar properties. The second dendrogram group consists of the samples M8, M12, M1, M5, and M11. These two groups are connected to each other with a high degree of similarity. The similar groups of the samples explain the similarities of the samples among themselves. The third group consists of the sample M3, which is completely different from the other groups. The marble samples within the groups show similar properties.
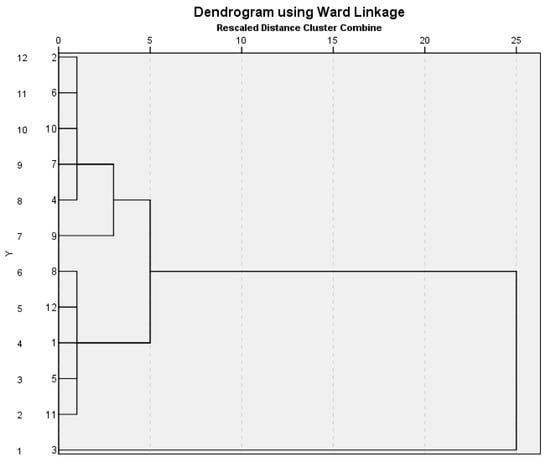
Figure 1.
The proximity or distance of the data in relation to each other.
5.5. Regression Analysis
The regression analysis was conducted by selecting the 226Ra radionuclide as the dependent variable and the V element, which was considered to affect this radionuclide, as the independent variable (Table 6). The R2 value of the model was determined to be 0.649, which meant that 64.9% of the change in the 226Ra radionuclide was explained by the changes in the V element. All assumptions of the regression analysis were examined. A Durbin–Watson test was performed to find whether there was any correlation between the residuals (errors) in the model and the test value was found to be 1.95. This value indicated that there was no autocorrelation between residuals. Besides, the model’s variance inflation factor (VIF) value was found to be 1. This VIF value indicated that there was no multicollinearity problem between the variables.

Table 6.
Regression analysis between 226Ra and concentration of vanadium.
Examining the ANOVA table according to the results of the F-test, which showed the significance of the model, the significance value was determined to be 0.002. This revealed that the regression model, which was designed to explain the change in the 226Ra value with the change in the V element value, was significant.
The value of the constant term in the regression model was determined to be −2.506 and the significance value was calculated as 0.6. The model was determined as follows:
According to this model, a one-unit increase in the V value causes an increase of 4.452 units in the 226Ra value. The 226Ra value becomes −2.506 when the V value is zero. This regression model was determined based on the presence of vanadium. Therefore, the equation used in the regression model cannot be applied in the absence of vanadium.
6. Comparison with Other Countries
The average of the 226Ra values of the marble samples (14.19 Bq/kg) is below the world average (Table 7). However, the maximum value of the sample “M7, Isparta Davraz Beige” (64.70 Bq/kg) was found to be above the world average. The average values of 232Th (3.31 Bq/kg) and 40K (66.13 Bq/kg) and the maximum values of 232Th and 40K are below the world average. The average radioactivity values of 226Ra, 232Th, and 40K are lower than the average values of Egypt, Algeria, Nigeria, Iraq, China, Australia, Pakistan, Afyon (Turkey), and Tunisia.

Table 7.
Comparison with activity values of other countries.
The maximum value of sample M7 (Isparta Davraz Beige), which is above the world average, is also higher than the average values of Algeria, Nigeria, Oman, Cameroon, Iraq, China, Australia, and Pakistan.
7. Conclusions
The highest values of the 226Ra, 232Th, and 40K radionuclides were observed in the samples of Isparta Davraz Beige M7: 64.70 Bq/kg), Denizli Travertine (M2: 4.88 Bq/kg), and Korkuteli Taurus Beige (M9: 95.90 Bq/kg), respectively.
The minimum and maximum values of Raeq (14,12–72.8), D (6.78–33.82), Iα (0.01–0.32), Hex (0.05–0.37), Hin (0.04–0.2), AEDE (8.32–41.48), AGDE (48.06–228.7), and ELCRoutdoor (0.03–0.15) are below the UNSCEAR limit values. The Iγ value (0.21–0.42) and the AUI value (1.46 mSv/y) of sample M7 (Isparta Davraz Beige) exceed the exemption criterion of 0.3 mSv/y. However, these values do not exceed the upper limit (1 mSv/y).
The skewness values of the 232Ra and 40K data show positively right-skewed asymmetric distributions. The highest Ra value (2.857) was found in sample M7 (Isparta Davraz Beige). The Th values show a normal distribution. According to the kurtosis values, Ra (8.807 > 3) has a peaked distribution with a high range (range = 61.85).
232Th (except for its positive correlation with Iγ) and 40K (except for its positive correlation with Iγ) were observed to not correlate with “radiological hazard parameters”. Therefore, it is interpreted that the contribution of 232Th and 40K to the radioactivity of marble is not significant. A strong positive correlation was found between vanadium and radiological parameters. According to chemical analysis, sample M7 (Isparta Davraz Beige) has the highest value of V. The activity concentration of 226Ra was determined to be influenced by the presence of V.
According to the “rotation sums of squared loadings” conducted by factor analysis, the data of the seven factors with a cumulative value of 95.060% were graded perfectly. The marble samples, which were classified into 12 groups according to their physical properties, were determined to have seven factors that were compatible with seven components. The analysis resulted in the following factors, which were observed to be compatible with another analysis: Factor 1: 226Ra, Raeq, D, AGDE, Iα, Iγ, Hex, Hin, AEDE, ELCR, AUI, Bi, and V; Factor 3: K40, Na, P, La, and Y; Factor 4: Th232, K, Zr, Fe. Analyzing PCA, radionuclides, parameters, and chemical analyses together using statistical methods facilitated the explanation of the relationship between them and succeeded in explaining the natural origins of the radionuclides.
The hierarchical group analysis performed using hierarchical cluster analysis resulted in a Q-type cluster with an arbitrary similarity level of 50%. The samples were clustered into three (3) groups with the first group consisting of M3, M8, M4, M5, M1, M10, M11, M12, M2, and M6; the second group consisting of M9; and the third group consisting of M7. Sample M7, which differed from the other data, had a separate cluster.
The R2 value of the regression analysis with the dependent variable 226Ra and independent variable V element is 0.649. According to the results of the F-test (p = 0.002), it was determined that the explanation of the 226Ra value by the V element was significant. A one-unit increase in the V value caused an increase of 4.452 units in the 226Ra value.
None of the samples exceeded world standards in terms of the average 226Ra, 232Th, or 40K values. In general, Burdur marble shows lower radioactivity values compared to the marble of Egypt, Algeria, Nigeria, Iraq, China, Australia, Pakistan, Afyon (Turkey), and Tunisia.
It could be concluded that Burdur marble, except for the Isparta Davraz Beige (M7) sample, which is used as building materials in the Burdur region, can be used safely in dwellings and public buildings in terms of human health. Multivariate statistical analyses were successfully used to interpret the radioactivity values of the samples, their radiological hazard parameters, and the results of the chemical analysis together, to define the correlation between them, and to determine the natural origins of the radionuclides.
Supplementary Materials
The following are available online at https://www.mdpi.com/2073-8994/12/8/1219/s1, Figure S1: Frequency distribution of Ra226, Th232, and K40 data, Figure S2: Scree Plot of variables, Table S1: Descriptive statistics of variables, Table S2: Kolmogorov-Smirnov and Shapiro-Wilk Normality Tests.
Author Contributions
Conceptualization, F.Y., S.U., and M.G.Y.; methodology, S.U., S.F.O.; software, F.Y.; validation; formal analysis, F.Y., O.A., and S.B.O.; investigation, O.A.; resources, M.G.Y. and O.A.; data curation, F.Y.; writing—original draft preparation, F.Y., S.U., M.G.Y., and S.B.O.; writing—review and editing, M.G.Y.; visualization, M.G.Y. and S.U.; supervision, F.Y.; S.U., and M.G.Y.; project administration, M.G.Y.; funding acquisition, M.G.Y. All authors have read and agreed to the published version of the manuscript.
Funding
This research received no external funding.
Conflicts of Interest
The authors declare no conflict of interest.
References
- United Natıons Sources Effects and Risks of Ionizing Radiation (UNSCEAR). Report to the General Assembly, with Annexes; United Nations Sources Effects and Risks of Ionizing Radiation: New York, NY, USA, 1988. [Google Scholar]
- Mamont-Ciesla, K.; Gwiazdowski, B.; Biernacka, M.; Zak, A. Radioactivity of building materials in Poland. In Natural Radiation Environment; Halsted Press: New York, NY, USA, 1982; p. 551. [Google Scholar]
- Beretka, J.; Mathew, P.J. Natural radioactivity of Australian building materials, industrial wastes and by-products. Health Phys. 1985, 48, 87–95. [Google Scholar] [CrossRef] [PubMed]
- Ramassay, V.; Dheenathayalu, M.; Ravisankar, R.; Ponnusamy, V. Natural radioactivity measurements in Beach-rock samples of South-East Coast of Tamilnadu, India. Radiat. Prot. Dosim. 2004, 111, 229–235. [Google Scholar] [CrossRef] [PubMed]
- Rati, V.; Mahur, A.; Sonkawade, R.; Suhail, M.; Azam, A.; Prasad, R. Evaluation and analysis of 226Ra, 232Th, 40K and radon exhalation rate in various grey cements. Indian J. Pure Appl. Phys. 2010, 48, 473–482. [Google Scholar]
- Mohamed, R.I.; Algamdi, S.K.; Al-Shamani, N.S. Evaluation of radionuclide concentrations and associated radiological hazard in marble indices and granite used as building materials in Al-Madinah Al-Munawarah. J. Taibah Univ. Sci. 2016, 10, 369–374. [Google Scholar] [CrossRef]
- Elnobi, S.; Harb, S.; Ahmed, N.K. Influence of grain size on radionuclide activity concentrations and radiological hazard of building material samples. Appl. Radiat. Isot. 2017, 130, 43–48. [Google Scholar] [CrossRef] [PubMed]
- Abdellah, W.M.; Mansour, N.A.; Diab, H.M.; Hassan, N.M.; Kasem, A.; Ibrahim, M.H. Evaluation of Natural Radioactivity and its Radiation Hazards in Some Building and Decorative Materials in Iraq. Arab J. Nucl. Sci. Appl. 2018, 51, 39–45. [Google Scholar]
- Borsellino, C.; Calabrese, L.; Di Bella, G. Effects of powder concentration and type of resin on the performance of marble composite structures. Const. Build. Mater. 2009, 23, 1915–1921. [Google Scholar] [CrossRef]
- Yalcin, F.; Ilbeyli, N.; Demirbilek, M.; Yalcin, M.G.; Gunes, A.; Kaygusuz, A.; Ozmen, S.F. Estimation of Natural Radionuclides’ Concentration of the Plutonic Rocks in the Sakarya Zone, Turkey Using Multivariate Statistical Methods. Symmetry 2020, 12, 1048. [Google Scholar] [CrossRef]
- El-Gamal, H.; El-Haddad, M. Estimation of Natural Radionuclides and Rare Earth Elements Concentration of the Rocks of Abu Khuruq Ring Complex, Egypt. Symmetry 2019, 11, 1041. [Google Scholar] [CrossRef]
- Kalkwarf, D.R.; Jackson, P.O.; Kutt, J.C. Emanation coefficients for Rn in sized coal fly ash. Health Phys. 1985, 48, 429–436. [Google Scholar] [CrossRef]
- Kumari, R.; Kant, K.; Garg, M. The effect of grain size on radon exhalation rate in natural-dust and stone-dust samples. Phys. Procedia 2015, 80, 128–130. [Google Scholar] [CrossRef]
- Unal, S.; Yalcin, M.G.; Ocak, S.; Yalcin, R.; Ozmen, S.F. Computation of gamma radioactivity of natural rocks in the vicinity of Antalya province and its effect on health. Kerntechnik 2018, 83, 112–120. [Google Scholar] [CrossRef]
- Yalcin, M.G.; Unal, S. Natural radioactivity levels and associated radiation hazards in ophiolites around Tekirova, Kemer, and Kumluca Touristic Regions in Antalya, Turkey. J. Radioanal. Nucl. Chem. 2018, 316, 321–330. [Google Scholar] [CrossRef]
- Nyamsari, D.G.; Yalcin, F.; Mboh, M.T.; Alfred, F.G.; Yalcin, M.G. Natural radioactive risk assessment in top soil and possible health effect in Minim and Martap villages, Cameroon: Using radioactive risk index and statistical analysis. Kerntechnik 2019, 84, 115–122. [Google Scholar] [CrossRef]
- Nyamsaria, D.G.; Yalcin, M.G.; Wolfson, I. Alteration, Chemical Process and Parent Rock of Haléo-Danielle Plateau Bauxite, Adamawa–Cameroon. Lithol. Miner. Resour. 2020, 55, 231–243. [Google Scholar] [CrossRef]
- Al-Jarallah, M.I.; Musazay, M.S.; Abu-Jarad, F. Application of the can technique and radon gas analyzer for radon exhalation measurements. Appl. Radiat. Isot. 2003, 59, 353–358. [Google Scholar]
- Ergul, H.A.; Belivermis, M.; Kilic, O.; Topcuoglu, S.; Cotuk, Y. Natural and artificial radionuclide activity concentrations in surface sediments of Izmit Bay, Turkey. J. Environ. Radioact. 2013, 126, 125–132. [Google Scholar] [CrossRef]
- Papaefthymiou, H.; Gkaragkouni, A.; Papatheodorou, G.; Geraga, M. Radionuclide activities and elemental concentrations in sediments from a polluted marine environment (Saronikos Gulf-Greece). J. Radioanal. Nucl. Chem. 2017, 314, 1841–1852. [Google Scholar] [CrossRef]
- Saenboonruang, K.; Phonchanthuek, E.; Prasandee, K. Determination Using Gamma Spectroscopy of Natural Radionuclide Activity Concentrations and Annual Committed Effective Doses in Selected Thai Medicinal Plants. Chiang Mai J. Sci. 2018, 45, 821–831. [Google Scholar]
- Rosli, M.N.R.; Samat, S.B.; Yasir, M.S.; Yusof, M.F. Determination of Concentration Activity Natural Radionuclide (232) th, (238) u and (40) k in Fish at the Coastal Arca of Terengganu, Malaysia. Sains Malays. 2018, 47, 2151–2156. [Google Scholar] [CrossRef]
- Chandrasekaran, A.; Ravisankar, R.; Rajalakshmi, A.; Eswaran, P.; Vijayagopal, P.; Venkatraman, B. Assessment of natural radioactivity and function of minerals in soils of Yelagiri hills, Tamilnadu, India by Gamma Ray spectroscopic and Fourier Transform Infrared (FTIR) techniques with statistical approach. Spectrochim. Acta Part A Mol. Biomol. Spectrosc. 2015, 136, 1734–1744. [Google Scholar] [CrossRef]
- He, L.C.; Diao, L.J.; Sun, B.H.; Zhu, L.H.; Zhao, J.W.; Wang, M.; Wang, K. Summing coincidence correction for γ-ray measurements using the HPGe detector with a low background shielding system. Nucl. Instrum. Methods Phys. Res. Sect. A Accel. Spectrometers Detect. Assoc. Equip. 2018, 880, 22–27. [Google Scholar] [CrossRef]
- Guerra, J.G.; Rubiano, J.G.; Winter, G.; Guerra, A.G.; Alonso, H.; Arnedo, M.A.; Bolivar, J. Automatic modeling using PENELOPE of two HPGe detectors used for measurement of environmental samples by γ-spectrometry from a few sets of experimental efficiencies. Nucl. Instrum. Methods Phys. Res. Sect. A Accel. Spectrometers Detect. Assoc. Equip. 2018, 880, 67–74. [Google Scholar] [CrossRef]
- UNSCEAR. Sources and Effects of Ionizing Radiation: Report to the General Assembly, Scientific Annexes; United Nations: New York, NY, USA, 2010; Volume 1, pp. 1–219. [Google Scholar]
- Veiga, R.; Sanches, N.; Anjos, R.M.; Macario, K.; Bastos, J.; Iguatemy, M.; Baptista Filho, M. Measurement of natural radioactivity in Brazilian beach sands. Radiat. Meas. 2006, 41, 189–196. [Google Scholar] [CrossRef]
- Sharaf, J.M.; Hamideen, M.S. Measurement of natural radioactivity in Jordanian building materials and their contribution to the public indoor gamma dose rate. Appl. Radiat. Isot. 2013, 80, 61–66. [Google Scholar] [CrossRef] [PubMed]
- United Nations Scientific Committee on the Effects of Atomic Radiation (UNSCEAR). Report to the General Assembly, with Annexes; United Nations Scientific Committee on the Effects of Atomic Radiation: New York, NY, USA, 1982; pp. 84–89. [Google Scholar]
- Gbenu, S.T.; Oladejo, O.F.; Alayande, O.; Olukotun, S.F.; Fasasi, M.K. Assessment of radiological hazards of quarry products from southwest Nigeria. J. Radiat. Res. Appl. Sci. 2016, 9, 20–25. [Google Scholar] [CrossRef]
- Kaliprasad, C.S.; Vinutha, P.R.; Narayana, Y. Natural radionuclides and radon exhalation rate in the soils of cauvery river basin. Air Soil Water Res. 2017, 10, 1–7. [Google Scholar] [CrossRef]
- Krieger, R. Radioactivity of construction materials. Betonw. Fert. Tech. 1981, 47, 468–473. [Google Scholar]
- United Nations Scientific Committee on the Effects of Atomic Radiation (UNSCEAR). Sources, effects and risks of ionizing radiation. In Report to the General Assembly with Annex B: Exposures from Natural Sources of Radiation; United Nations: New York, NY, USA, 2000. [Google Scholar]
- Tsai, T.L.; Liu, C.C.; Chuang, C.Y.; Wei, H.J.; Men, L.C. The effects of physico-chemical properties on natural radioactivity levels, associated dose rate and evaluation of radiation hazard in the soil of Taiwan using statistical analysis. J. Radioanal. Nucl. Chem. 2011, 288, 927–936. [Google Scholar] [CrossRef]
- Ravisankar, R.; Sivakumar, S.; Chandrasekaran, A.; Jebakumar, J.P.P.; Vijayalakshmi, I.; Vijayagopal, P.; Venkatraman, B. Spatial distribution of gamma radioactivity levels and radiological hazard indices in the East Coastal sediments of Tamilnadu, India with statistical approach. Radiat. Phys. Chem. 2014, 103, 89–98. [Google Scholar] [CrossRef]
- Ravisankar, R.; Raghu, Y.; Chandrasekaran, A.; Gandhi, M.S.; Vijayagopal, P.; Venkatraman, B. Determination of natural radioactivity and the associated radiation hazards in building materials used in Polur, Tiruvannamalai District, Tamilnadu, India using gamma ray spectrometry with statistical approach. J. Geochem. Explor. 2016, 163, 41–52. [Google Scholar] [CrossRef]
- Raghu, Y.; Ravisankar, R.; Chandrasekaran, A.; Vijayagopal, P.; Venkatraman, B. Assessment of natural radioactivity and radiological hazards in building materials used in the Tiruvannamalai District, Tamilnadu, India, using a statistical approach. J. Taibah Univ. Sci. 2017, 11, 523–533. [Google Scholar] [CrossRef]
- Nguelem, E.J.M.; Ndontchueng, M.M.; Motapon, O.; Guembou, C.J.S.; Darko, E.O. Radiological monitoring and statistical approach of primordial and anthropogenic radionuclides in surface soil of Mami-water site in the Western Cameroon. Environ. Earth Sci. 2017, 76, 612. [Google Scholar] [CrossRef]
- Akozcan, S.; Kulahci, F.; Mercan, Y. A suggestion to radiological hazards characterization of 226Ra, 232Th, 40K and 137Cs: Spatial distribution modelling. J. Hazard. Mater. 2018, 353, 476–489. [Google Scholar] [CrossRef] [PubMed]
- Gbadamosi, M.R.; Afolabi, T.A.; Banjoko, O.O.; Ogunneye, A.L.; Abudu, K.A.; Ogunbanjo, O.O.; Jegede, D.O. Spatial distribution and lifetime cancer risk due to naturally occurring radionuclides in soils around tar-sand deposit area of Ogun State, southwest Nigeria. Chemosphere 2018, 193, 1036–1048. [Google Scholar] [CrossRef] [PubMed]
- Gunoglu, K.; Seckiner, S. Evaluation of dose parameters and radiological hazards in gravel samples of Konyaaltı Beach, Antalya. Arab. J. Geosci. 2018, 11, 457. [Google Scholar] [CrossRef]
- Shohda, A.M.; Draz, W.M.; Ali, F.A.; Yassien, M.A. Natural radioactivity levels and evaluation of radiological hazards in some Egyptian ornamental stones. J. Radiat. Res. Appl. Sci. 2018, 11, 323–327. [Google Scholar] [CrossRef]
- Aladeniyi, K.; Olowookere, C.; Oladele, B.B. Measurement of natural radioactivity and radiological hazard evaluation in the soil samples collected from Owo, Ondo State, Nigeria. J. Radiat. Res. Appl. Sci. 2019, 12, 200–209. [Google Scholar] [CrossRef]
- Hamideen, M.S.; Bdair, O.M.; Chandrasekaran, A.; Saleh, H.; Elimat, Z.M. Multivariate statistical investigations of natural radioactivity and radiological hazards in building materials mainly used in Amman Province, Jordan. Int. J. Environ. Anal. Chem. 2020, 100, 189–203. [Google Scholar] [CrossRef]
- Hamideen, M.S.; Chandrasekaran, A.; Elimat, Z.M. Statistical assessment of radiological data of tiles collected from Jordan. Int. J. Environ. Anal. Chem. 2019, 99, 1325–1339. [Google Scholar] [CrossRef]
- Ogundele, L.T.; Ayeku, P.O.; Inuyomi, S.O.; Ogunsakin, O.M.; Oladejo, O.F.; Adejoro, I.A. Assessment of naturally occurring 40K, 232Th and 238U and their associated radiological hazard indices in soils used for building in Ondo West Local Government Area, Southwestern, Nigeria. EQA Int. J. Environ. Qual. 2019, 37, 11–21. [Google Scholar]
- Liu, Q.; Feng, G.; Lu, Z.; Tang, C.; Wu, B.; Mao, P.; Cai, C. Assessment of Tenorm and potential radiological hazards from the main brand glazed tiles produced in China with statistical analysis. Int. J. Environ. Anal. Chem. 2020, 1–12. [Google Scholar] [CrossRef]
- ICRP. ICRP Publication 70: Basic Anatomical & Physiological Data for Use in Radiological Protection: The Skeleton; Elsevier Health Sciences: Amsterdam, The Netherlands, 1996; Volume 70. [Google Scholar]
- Ozer, O.; Yalcin, F.; Tarinc, O.K.; Yalcin, M.G. Investigation of suitability of marbles to standards with inequality expressions and statistical approach using some physical and mechanical properties. J. Inequal. Appl. 2020, 97. [Google Scholar] [CrossRef]
- Amrani, D.; Tahtat, M. Natural radioactivity in Algerian building materials. Appl. Radiat. Isot. 2001, 54, 687–689. [Google Scholar] [CrossRef]
- Bachama, Y.D.; Ahmed, A.L.; Lawal, K.M.; Arabi, A.S. Natural Gamma Radiation in Rocks from Kerri-Kerri Formation, Northeastern Nigeria. J. Afr. Earth Sci. 2017, 130, 269–273. [Google Scholar] [CrossRef]
- Akkurt, I.; Oruncak, B.; Gunoglu, K. Natural Radioactivity and dose rates in commercially used marble from Afyonkarahisar-Turkey. Int. J. Phys. Sci. 2010, 5, 170–173. [Google Scholar]
- Ngachin, M.; Garavaglia, M.; Giovani, C.; Kwato Njock, M.G.; Nourreddine, A. Assessment of natural radioactivity and associated radiation hazards in some Cameroonian building materials. Radiat. Meas. 2007, 42, 61–67. [Google Scholar] [CrossRef]
- Manai, K.; Ferchichi, C.; Oueslati, M.; Trabelsi, A. Gamma radiation measurements in Tunisian marbles. World J. Nucl. Sci. Technol. 2012, 2, 5. [Google Scholar] [CrossRef]
- Fares, S.; Yassene, A.A.; Ashour, A.; Abu-Assy, M.K.; El-Rahman, M.A. Natural radioactivity and the resulting radiation doses in some kinds of commercially marble collected from different quarries and factories in Egypt. Nat. Sci. 2011, 3, 895–905. [Google Scholar] [CrossRef]
- Huang, Y.; Lu, X.; Ding, X.; Feng, T. Natural radioactivity level in beach sand along the coast of Xiamen Island, China. Mar. Pollut. Bull. 2015, 91, 357–361. [Google Scholar] [CrossRef]
- Tufail, M.; Hamid, T. Natural radioactivity hazards of building bricks fabricated from saline soil of two districts of Pakistan. J. Radiol. Prot. 2007, 27, 481. [Google Scholar] [CrossRef] [PubMed]
© 2020 by the authors. Licensee MDPI, Basel, Switzerland. This article is an open access article distributed under the terms and conditions of the Creative Commons Attribution (CC BY) license (http://creativecommons.org/licenses/by/4.0/).
