Abstract
Landslides are one of the most extensive geological disasters in the world. The objective of this study was to assess the performances of different landslide susceptibility models information content method (ICM), analytical hierarchy process (AHP), and random forest (RF) model) and mapping unit (slope unit and grid unit) for landslide susceptibility mapping in the Helong city, Jilin province, northeastern China. First, a total of 159 landslides were mapped in the study area based on a geological hazard survey (1:50,000) of Helong city. Then, the slope units of the study area were divided by using the curvature watershed method. Next, eight influencing factors, namely, lithology, slope angle, slope aspect, rainfall, land use, seismic intensity, distance to river, and distance to fault, were selected to map the landslide susceptibility based on geological data, field survey, and landslide information. Afterward, landslide susceptibility modeling of landslide inventory data is performed for extracting and learning the symmetry latent in data patterns and relationships by three landslide susceptibility models and utilizing it to predict landslide susceptibility. Finally, the receiver operating characteristic (ROC) curve was used to compare the landslide susceptibility models. In addition, results based on grid units were calculated for comparison. The AUC (the area under the curve) result for ICM, AHP, and RF model was 87.1%, 80.5%, and 94.6% for slope units, and 83.4%, 70.9%, and 91.3% for grid units, respectively. Based on the overall assessments, the SU-RF model was the most suitable model for landslide susceptibility mapping. Consequently, these methods can be very useful for landslide hazard mitigation strategies.
1. Introduction
Landslides are among the world’s most destructive geological disasters, threatening the human life, environments, resources, and property [1,2,3,4]. The high incidence and wide distribution of landslides have aroused the research interest of many scientists, some of whom have devoted themselves to the mapping of landslide susceptibility [1,5,6]. By analyzing maps of landslide susceptibility, areas that are highly susceptible to these events can be evaluated and located. With this information, people can take appropriate preventive measures to reduce the negative impact of the landslide. After decades of development, landslide susceptibility mapping has become one of the most important subjects in international geomorphology and engineering geology [7,8,9,10].
At present, the methods used for landslide susceptibility mapping are mainly divided into qualitative analysis and quantitative analysis [11,12,13,14,15]. The basis of qualitative analysis is the thorough investigation of the causal mechanism of landslides by gaining a complete understanding of the geological environment background of the study area, evaluating the susceptibility to landslides based on expert experience and expert knowledge, and expressing the evaluation results on the map; such methods include the as analytic hierarchy process method [13,16,17], and fuzzy mathematics [18,19,20,21]. Quantitative analysis methods are used to estimate the susceptibility to landslides by mathematical or numerical algorithms, such as the frequency ratio method [22,23], information content method [13,16], and logistic regression [17,24]. In addition, many machine learning methods are used in landslide susceptibility mapping, and include artificial neural networks [25,26], and support vector machine [27,28]. However, each approach has its advantages and disadvantages. Due to the variety of the influencing factors that trigger landslides and the extremely complex relationship between them and landslide susceptibility, an evaluation model cannot be applied universally for all studies. In this study, a subjective method (AHP), quantitative analysis (ICM), and a machine learning method (RF) were adopted to the landslide susceptibility models and select the optimal one for Helong city.
In addition to selecting the susceptibility model, there is another key step in landslide susceptibility mapping, which is the selection of mapping units. As the smallest indivisible unit in landslide susceptibility mapping, the suitability of its selection affects the model prediction accuracy. The most commonly used mapping unit for landslide susceptibility is the grid unit [16]. Although grid unit based division has been increasingly refined, it has lost almost all connection with geology, geomorphology, and other engineering geological conditions [29]. Landslides often occur in mountain areas and have a physical relationship with valley lines and ridge lines. Thus, many scholars began to adopt the slope unit as the mapping unit [16,29,30,31]. However, the traditional slope unit division based on the hydrological method cannot identify the horizontal surface. This results in a large error between the slope unit and the actual terrain. Thus, in this study, the curvature watershed method was adopted to divide the slope units of the study area, which can identify the horizontal surface.
Our study aims to find a more suitable landslide susceptibility model for Helong City, Jilin Province, Northeastern China. Firstly, a total of 159 landslides were mapped in the study area based on a geological hazard survey (1:50,000) of Helong city. Afterward, based on the curvature watershed method, the slope units were divided. Then, according to the geological data, field survey, and landslide information, eight influencing factors, namely lithology, slope angle, slope aspect, rainfall, land use, seismic intensity, distance to river, and distance to fault, were selected for landslide susceptibility mapping. Then, the information content method (ICM), analytical hierarchy process (AHP), and random forest (RF) model were adopted to establish landslide susceptibility models. Finally, the receiver operating characteristic (ROC) curve was used to validate and compare the prediction abilities of the landslide susceptibility models, and select the optimal one. The results of this study can be very useful for landslide hazard mitigation strategies in Helong city.
2. Study Area
The study area covers the whole territory of Helong city. Its geographical coordinates are 128°22′ E~129°24′ E longitude, 41°59′ N~42°57′ N latitude, covering an area of 5100 km2 (Figure 1). The maximum elevation of the study area is 1679 m, and the minimum elevation is 250 m. The maximum elevation difference is 1479 m. The terrain decreases in elevation gradually from southwest to northeast. The mountainous area is 4681 km2, accounting for 92.7% of the total area. The southern part of the study area is the Chinese and Korean quasi-platform. The northern part is the Jihei fold system in the Tianshan-Xingan geosyncline fold area, which is bounded by the deep and large fault of the Gudong River. As can be seen in Figure 1, the modified Mercalli index ranges from VI to VII, but no earthquake-induced landslides were found in the study area. There are three major rivers in the study area: The Tumen River, the Hailan River, and the Gudong River. A field investigation revealed that landslides have been mainly distributed along the rivers, which means that the rivers have a significant impact on landslide susceptibility. According to a geological map at a 1:250,000 scale (Figure 1c), the strata of the study area mainly include the Quaternary strata (Q), Neogene strata (N), Cretaceous strata (K), Jurassic strata (J), and Triassic strata (T). Lithology is primarily gravel soil, basalt, sandstone, andesite, marble, etc., and there are several deep and major faults in the study area.
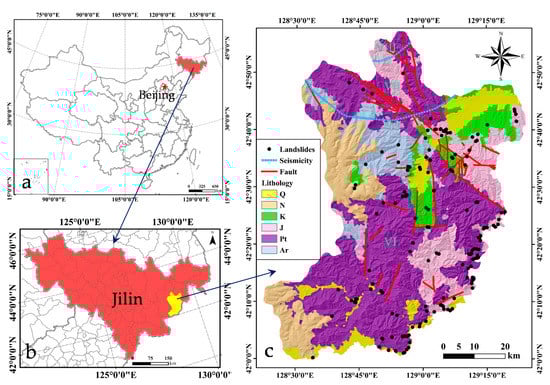
Figure 1.
Sketch of the study area: (a) geographic location; (b) landslide inventory map from the geological hazard survey and regionalization of Helong city, Jilin province (1:100,000); (c) geological map: lithology and fault from 91 weitu software; Seismic intensity from the Seismic Intensity Zoning Map of China.
3. Methodology
Figure 2 shows the main steps of this study: (a) data preparation, (b) landslide susceptibility modeling, and (c) validation and selection of the optimal models.
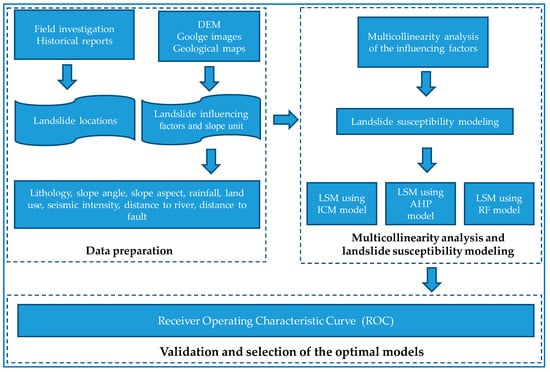
Figure 2.
Flowchart describing the methodology applied for our analysis.
3.1. The Mapping Unit
Before the evaluation of landslide susceptibility, the mapping unit should be selected first, which directly determines the extraction accuracy of the influencing factors and the suitability of the final evaluation results [16,32,33]. Currently, common mapping units include grid units, slope units, and watershed units [33]. Among them, slope units can more closely reflect the topography of the study area, so they are widely used in landslide susceptibility mapping [16]. Therefore, slope units were adopted for landslide susceptibility mapping of Helong city. The basic principle of slope units is the division of the study area into map units by ridge lines and valley lines [31]. At present, the most commonly used method of slope unit division is based on the hydrological analysis module in ArcGIS software. This method divides slope units by calculating the DEM (Digital Elevation Model) and the inverse flip DEM of the subwatershed [34]. However, the division model base on slope units performs poorly in recognizing of horizontal surface. A large number of parallel river channels will be generated at the horizontal surface, and heavy manual modification is required to eliminate inappropriate units. In this case, the curvature watershed method was used to divide the slope units in the study area. It is well known that the slope aspect often changes in valleys and ridges, while the slope angle changes in tableland and wide valley margins. Profile curvature is the derivative of the slope angle in the streamline direction, and its maximum and minimum values can be used to indicate the margins of tablelands and wide valleys. The maximum and minimum values of plan curvature can reflect an abrupt change in the slope aspect. The average curvature is the average of profile curvature and plan curvature [35]. Thus, its maximum and minimum can indicate the ridge line, valley line, tableland margin and wide valley margin [36]. In this way, the study area can be divided into slope units by using the curvature method. The detailed division process is shown in Figure 3. Compared with the hydrological method, the curvature watershed method can identify the horizontal surface, which greatly reduces the modification required in the later stage. According to Figure 3, it was found that for a DEM with a resolution of 200 m, the slope unit based division is the most consistent with the real terrain, and the study area can be divided into 9574 slope units (Figure 4). The maximum unit area is 3.15 km2, and the minimum unit area is 0.11 km2. More than 55% of the total units’ area are between 0.30 and 1.00 km2. The unit shape is between a triangle and a square. Elongated units are rarely present. The slope angle standard deviation of more than 90% of the total units is less than 9°, and the slope aspect standard deviation of more than 50% of the total slope units is less than 70°.
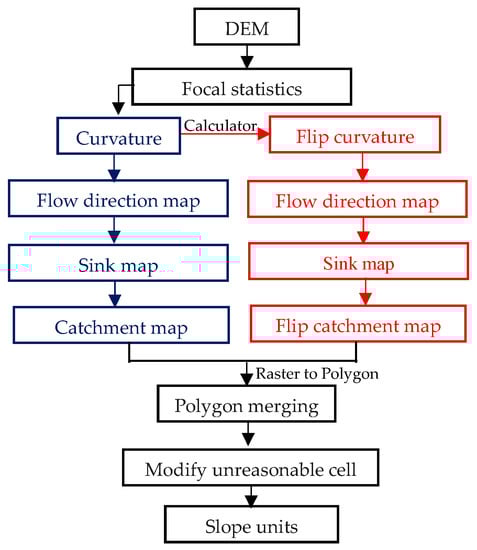
Figure 3.
The construction process of the slope units based on the curvature watershed method.
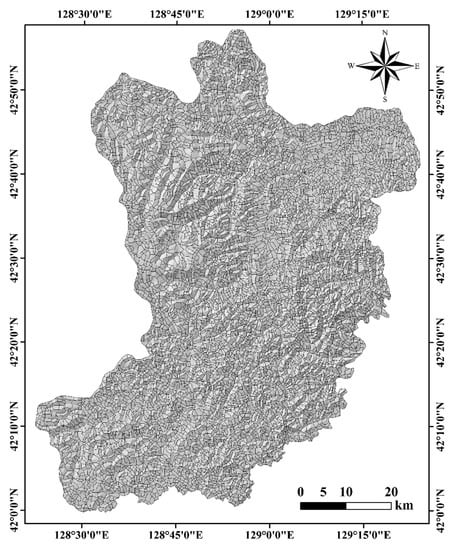
Figure 4.
Map of slope unit division of the study area.
3.2. Landslide Inventory
A landslide inventory map is the basis of landslide susceptibility mapping [13,25,37,38,39]. In this study, the landslide information was obtained from a geological hazard survey (1:50,000) of Helong city, Jilin province, undertaken by the Jilin team of the China Building Materials Industrial Geological Survey Center. This geological hazard survey was completed on the basis of remote sensing interpretation, field survey, comprehensive reference to the geological hazard survey and regionalization of Helong city, Jilin province (1:100,000) and the “twelfth five-year plan” for geological hazard prevention and control of Helong city, Jilin province. Thus, the production process of the landslide inventory map of this study is as follows:
- (a)
- Data collection: The existing data are the basis of this landslide investigation. Before remote sensing interpretation and field investigation, a large number of data of the study area, including formation conditions and inducing factors of geological disasters, the current situation and prevention of geological disasters, 1:50,000 topographic maps, 1:10,000 topographic maps, 1:250,000 geological maps, and satellite and aerial remote sensing information, were collected.
- (b)
- Remote sensing interpretation: Before the field investigation, the remote sensing interpretation of landslides was carried out according to the topographic features of the landslide [40].
- (c)
- Field investigation: Through field investigation, landslides interpreted through remote sensing were confirmed, and landslides not detected through remote sensing were added.
- (d)
- Production of the landslide inventory map: Based on GIS (Geographic Information System), the landslide inventory map was produced.
According to the above method, 159 landslides were mapped in the study area. The landslide inventory map of the study area is shown in Figure 1. Figure 5 shows some typical landslides and their impacts within the study area.
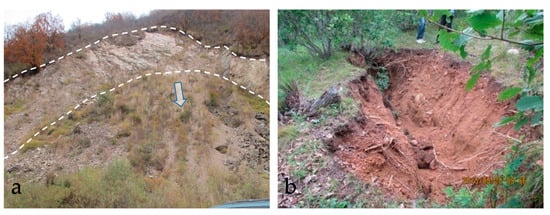
Figure 5.
Typical landslides and their impacts within the study area. (a) Zhulin landslide; (b) landslide due to a fissure.
3.3. Influencing Factors
The influencing factors that lead to landslides are very complex, therefore, the selection of influencing factors should be based on previous studies, field investigation, and the mechanism of landslides in the study area [12,28,41,42,43,44,45,46]. In this study, eight influencing factors, namely lithology, slope angle, slope aspect, rainfall, land use, seismic intensity, distance to river, and distance to fault, are were applied to the landslide susceptibility mapping of the Helong city. Lithology is the material basis of landslides and the basic factor that controls slope stability [33]. The slope angle has a decisive effect on the stress field in the slope body [13]. In general, shear stress in soil and rock usually increases with the increase in slope angle [16]. Slope aspect mainly affects soil moisture, surface water supply and discharge, and vegetation coverage [37,47]. In this study, the slope angle map and slope aspect map were extracted from a DEM with a resolution of 10 m. Rainfall reduces the shear strength of rock and soil in the slope body [48], thus inducing landslides [13,49]. The annual average rainfall of the study area varies between 490 and 610 mm. Areas with low vegetation coverage are more conducive to the occurrence of landslides [33]. Earthquakes increase the probability of slope instability along weak areas [50]. The banks of a river are more prone to landslides due to erosion by the river [33]. Near the fault, the rock mass is more fragmented, making the slope less stable [13]. All of the influencing factor maps are shown in Figure 6. The categories of continuous conditioning factors were based on the existing research [2,13,33]. For continuous data, the average value of the slope unit was assigned to the unit. For discrete data, the type assigned to the largest proportion of slope units was adopted.
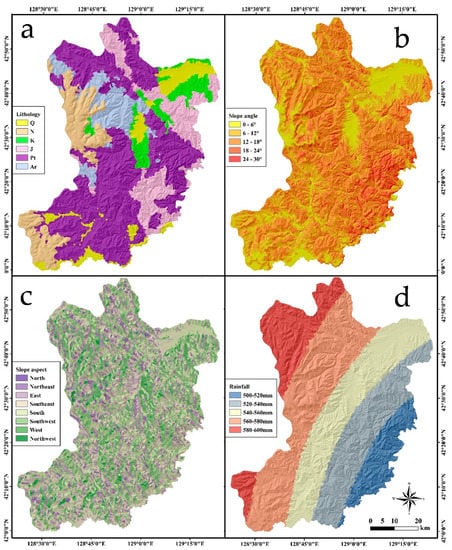
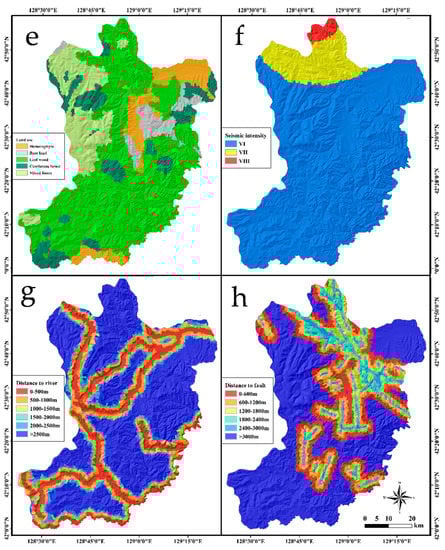
Figure 6.
Influencing factor maps of the study area: (a) lithology, (b) slope angle, (c) slope aspect, (d) rainfall, (e) land use, (f) seismic intensity, (g) distance to river, and (h) distance to fault.
3.4. Multicollinearity Analysis of the Influencing Factors
Many landslide susceptibilities models, such as the logistic regression model, are sensitive to the multicollinearity of influencing factors [51]. The variance inflation factor (VIF) can be used to analyze the multicollinearity of influencing factors and can be calculated by using the following equation:
where Ri is the negative correlation coefficient of the regression analysis of the independent variable Xi on the other independent variables. The VIF value is greater than 1. The closer the VIF value is to 1, the weaker the multicollinearity. In this study, we calculated the VIF value for each influencing factor. If the VIF value is greater than 10, then the influencing factor should be excluded from the landslide susceptibility model.
3.5. Landslide Susceptibility Modeling
3.5.1. Information Content Model (ICM)
The information content model was put forward according to information theory, and it has become a common model of landslide susceptibility [13,16]. ICM is a type of statistical analysis and prediction method. Based on the known landslide information and its influencing factors, this method calculates the information content values of each influencing factor and establishes an evaluation and prediction model. Then, according to the analogy principle, the landslide susceptibility of the whole study area can be evaluated. The calculation of the information content values is as follows:
where R(Xi, D) is information content value; A is the total number of the landslides in the study area; Ai is the number of landslides for influencing factor Xi; B is the total number of pixels for the study area; and Bi is the number of pixels for influencing factor Xi. Then, the information content value is used to reclassify the influencing factor maps. Finally, the landslide susceptibility index (LSI) can be calculated as follows:
where ICM indicates the influencing factor maps that have been reclassified as per their information content values.
3.5.2. Analytic Hierarchy Process (AHP)
The analytic hierarchy process is a multi-criteria decision analysis method that distributes the elements related to the decision into the target layer, criterion layer and scheme layer, and qualitative and quantitative analyses are conducted on this basis [11,13,16,17]. The AHP method has been widely used in landslide susceptibility mapping. When using the AHP method to evaluate landslide susceptibility, the corresponding hierarchy model should be established first. Then, the importance is subjectively compared between two influencing factors to construct a judgment matrix, which can be expressed as follows [11,17]:
where A is the judgment matrix; and aij is the result of comparing the importance of factor i and factor j, and has the following properties:
The relative importance of each factor is scored on a scale of 1–9, representing less importance to greater importance. Finally, the consistency of the judgment matrix should be checked, which can be performed by using the following equations [11,17]:
where CI is the consistency indicator; CR is the random consistency ratio, and a value below 0.1 is acceptable; λmax is the largest eigenvalue of the judgment matrix; n is the order of the judgment matrix; and RI is the random index, which is listed in Table 1 [16].

Table 1.
The random consistency ratio RI.
By using the AHP method, the relative weights of all influencing factors can be obtained. The landslide susceptibility index (LSI) can be calculated as follows:
where AHP indicates the influencing factors, and ωi is the weight of influencing factor i.
3.5.3. Random Forest (RF) Model
Random Forest (RF) is a classification method that involves multiple decision trees, which can classify a large amount of higher-dimensional data [52]. The random forest model adopts the random selection method when sampling the original data, which can prevent the over-fitting of the model. Secondly, it also has a high tolerance for outliers. Therefore, this model is one of the most commonly used machine learning methods with high prediction accuracy. In view of the advantages of the random forest model in classification, it was chosen as a landslide susceptibility model in this study. When the landslide susceptibility model is established by the random forest model, the number of non-landslide units must be equal to the number of landslide units in the modeling. In order to satisfy this condition, non-landslide units were randomly selected at a distance of at least 800 m from the landslide units in the study area, thereby achieving equal numbers between the two types. The landslide units and non-landslide units were randomly split into a ratio of 70:30 as the training and testing dataset, respectively. The analysis was carried out by using the SPSS software.
4. Results
4.1. Multicollinearity Analysis
In this study, the VIF was used to analyze the multicollinearity of the influencing factors. Any influencing factor with a VIF value of greater than 10 should be excluded from the landslide susceptibility model. In Table 2, it can be seen that no influencing factor has a VIF value greater than 10, which indicates that no influencing factor needed to be excluded from the landslide susceptibility model.
Table 2.
The variance inflation factor (VIF) values for the influencing factors.
4.2. Results of the Information Content Model
According to the information content model, the information content values of each influencing factor were calculated, and the results are shown in Table 3. When the ICM value is greater than 0, the probability of landslide occurrence is high; when the ICM value is less than 0, the probability of landslide occurrence is low. Based on Table 3, it can be seen that the ICM value of classes Q and J are 0.54 and 0.59, respectively. This indicates that Q and J are prone to the occurrence of landslides in the study area. The lithology of Q is mainly gravel, alluvial deposit, etc. The lithology of J is mainly andesite and tuff. The field survey showed that J is usually strongly influenced by geological processes such as joints, cracks, and faults, and the existence of these structural planes greatly reduces the shear strength of rock mass [46]. Q is usually looser. Thus, landslides are more likely to occur in these two strata. For the slope angle, the classes 18–24 (0.75), and 24–30 (3.37) have the largest ICM values. A higher slope angle is beneficial for the conversion of the potential energy of the soil and rock mass into kinetic energy, so the higher the slope angle, the more conducive it is to the occurrence of landslides. For the slope aspect, the ICM values of classes southeast, and south are 0.18 and 0.42, respectively. For rainfall, the ICM value of the class 500–520 is 1.32. According to statistics, landslides in Helong city are mainly caused by heavy rainfall. However, in this study, landslides occurred more frequently in areas with less annual rainfall. The reason for this is that areas with high rainfall are mostly forested and mountainous areas, and human activities have little impact. Therefore, the correlation between landslides and rainfall in this area is poor. The ICM values of the classes hemerophyte, bare land, leaf wood, coniferous forest, and mixed forest are 0.46, 0.55, 2.49, −1.18, and −2.46, respectively. These values indicate that hemerophytes, bare land, and leaf wood are more likely to experience landslides. For the seismic intensity, according to “the ground motion parameter zoning map of China” (GB18306-2015), the most common earthquake intensity of Helong is VI. Historical records do not record landslides triggered by earthquakes, but when an earthquake reaches a certain degree, landslides can still occur. Therefore, the influence of earthquakes on landslides in the study area should be given sufficient attention. Landslides mainly occurred within 0–1000 m of a river. The reason for this is that the erosion on the slope foot by the river can reduce the stability of the slope [33]. The existence of faults results in a relatively broken rock mass, which develops many fractures. The existence of these fractures reduces the shear strength of the rock mass [53,54,55,56,57]. The landslide susceptibility map produced by the ICM method is shown in Figure 7a.
Table 3.
Distribution of the training pixels.
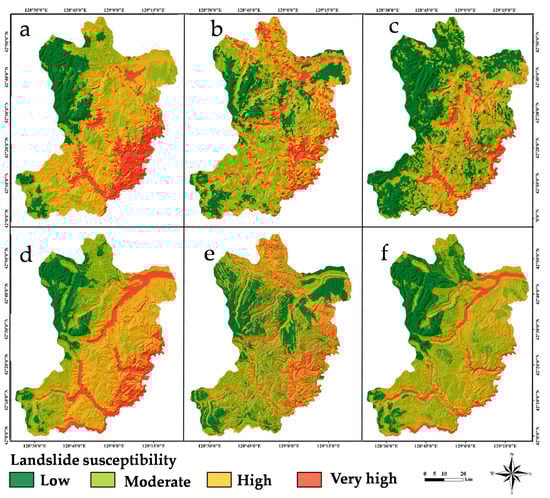
Figure 7.
Landslide susceptibility maps; (a) information content method (ICM) method (slope units), (b) analytical hierarchy process (AHP) method (slope units), (c) random forest (RF) method (slope units), (d) ICM method (grid units), (e) AHP method (grid units), and (f) RF method (grid units).
4.3. Results of the Analytic Hierarchy Process
Using the AHP method to produce the landslide susceptibility map mainly includes three steps: (a) assign the weight of the influencing factors’ sub-classes; (b) assign the weight of each influencing factor; (c) calculate the weighted sum of all of the factors. The results of the weight of the influencing factors and their sub-classes are shown in Table 4. In Table 4, it can be seen that the slope angle has a weight value of 0.3313 and has the greatest importance compared with others, followed by lithology (0.2307), distance to river (0.1572), and distance to fault (0.1059). The results indicate that tectonic activity, river action, lithology, and topography are the main factors that contribute to the occurrence of landslides in the study area. The LSI can be calculated by using Equation (8):
Table 4.
Judgment matrix of the influencing factors and their weights.
4.4. Results of the Random Forest Model
According to the landslide inventory map, 159 slope units experienced landslides. To meet the modeling requirements, an equal number of non-landslide units at least 800 m away from the landslide units were randomly selected. The whole RF modeling process was is carried out in SPSS software. The number of decision trees in the model was set to 300. The maximum number of nodes in the decision tree was 10,000, the maximum depth was 10, and the minimum child node size was 5. The modeling fitting result is shown in Figure 7c.
For comparison, the calculation results of grid units are also shown in Figure 7d–f. All the landslide susceptibility maps were divided into four classes, namely low, moderate, high, and very high, by using the natural breaks classification method.
5. Validation and Discussion
5.1. Validation
The validation of model accuracy is very important for landslide susceptibility mapping [14,33,45,58,59,60,61,62]. The receiver operating characteristic (ROC) curve has been widely used in the accuracy validation of binary classification models [13,32,33]. This method takes the true positive rate as the ordinate and the false positive rate as the abscissa to draw the corresponding curve, and the area under the ROC curve (AUC) value is used to evaluate the accuracy of the landslide susceptibility model. The AUC value is between 0.5 and 1. When the AUC value ranges from 0.9 to 1.0, the accuracy of the landslide susceptibility model is “excellent”; when it ranges from 0.8 to 0.9, the accuracy is “good”; when it ranges from 0.7 to 0.8, the accuracy is “fair”; when it ranges from 0.6 to 0.7, the accuracy is “poor”; when it ranges from 0.5 to 0.6, the accuracy is “failing” [33]. Figure 8 shows the ROC curves of the landslide susceptibility models established in this study. The results indicate that the SU-RF model has the highest accuracy, with an AUC value of 94.6%, followed by the GU-RF model (91.3%), SU-ICM model (87.1%), GU-ICM model (83.4%), SU-AHP model (80.5%), and GU-AHP model (70.9%). The accuracies of the SU-RF model and GU-RF model fall within the “excellent” class. The others fall within the “good” classification category, except the GU-AHP model (fair).
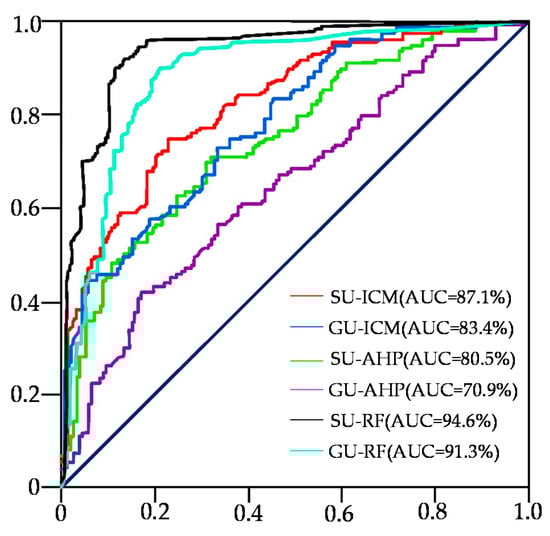
Figure 8.
Receiver operating characteristic (ROC) curve of the models (SU: slope units, GU: grid units).
5.2. Comparison of Landslide Susceptibility Maps
In order to produce a more suitable landslide susceptibility map, this study adopted three landslide susceptibility models, namely, the ICM model, AHP model, and RF model, and two mapping units (slope units and grid units) to evaluate the landslide susceptibility of Helong city. Figure 8 shows that the SU-RF model has the highest accuracy. In order to compare the models in detail, the statistical results of the landslide susceptibility maps produced in this study are also listed in the Table 5. The results show that the area of the susceptibility classes low, moderate, high, and very high are 897.03, 1142.43, 1696.53, and 1373.56 km2, respectively, for the SU-ICM model. For the SU-AHP model, the area of the four classes are 942.80, 1964.54, 1410.72, and 791.49 km2, respectively. For the SU-RF model, the area of the four classes are 1907.41, 1571.90, 1100.75, and 528.49 km2, respectively. For the GU-ICM model, the areas are 756.05, 2188.98, 1275.39, and 889.13 km2, respectively. For the GU-AHP model are 1274.84, 2044.59, 1109.42, and 680.70 km2, respectively. For the GU-RF model are 1100.92, 2082.84, 1491.10, and 434.68 km2, respectively. The landslide counts for the four susceptibility classes of the SU-ICM model are 2, 11, 42, and 103, respectively, accounting for 1.26%, 6.92%, 24.42% and 64.78% of the total landslide count of the study area, respectively. The landslide counts for the SU-AHP model are 8, 28, 45, and 78, respectively, accounting for 5.03%, 17.61%, 28.30%, and 49.06% of the total landslides count, respectively. For the SU-RF model are 0, 6, 35, and 118, respectively, accounting for 0.00%, 3.77%, 22.01%, and 74.41% of the total landslides count, respectively. For the GU-ICM model are 2, 22, 35, and 100, respectively, accounting for 1.26%, 13.84%, 22.01%, and 62.89% of the total landslides count, respectively. For the GU-AHP model are 16, 52, 36, and 56, respectively, accounting for 10.06%, 32.70%, 22.01%, and 35.22% of the total landslides count, respectively. For the GU-RF model are 5, 23, 54, and 77, respectively, accounting for 3.14%, 14.47%, 33.96%, and 48.43% of the total landslides count, respectively.
Table 5.
Statistical results of landslide susceptibility mapping.
The high and very high landslide susceptibility classes make up 91.20%, 77.36%, 96.22%, 84.90%, 57.23%, and 82.39% of the total landslide count in the SU-ICM model, SU-AHP model, SU-RF model, GU-ICM model, GU-AHP model, and GU-RF model, respectively. The number of landslides included in the high and very high susceptibility classification can also reflect the predictive power of a model. In this respect, the SU-RF model also has the highest predictive power. In terms of methods, it can be seen that the RF method has higher prediction ability than the ICM model and AHP method, regardless of whether it was built with slope units or grid units. The AHP method, as a subjective weighting method, assigns a large weight to some factors with poor correlations with landslide occurrence in the study area due to the influence of the subjectivity of the weight assigner, resulting in a decrease in the prediction ability of the model. The ICM method can avoid the influence of subjective judgment and establish a relatively objective evaluation model. However, this method underestimates the importance of some factors, which will also lead to a decline in the prediction ability of the model. The RF method, as a machine learning method, is used to avoid the problem of over-fitting by random sampling of the original data. Moreover, it has a high tolerance for outliers and missing data, so it has a high prediction accuracy. Therefore, the three methods can be combined to obtain a more effective model.
In terms of mapping units, it can be seen that the slope units have higher prediction ability than grid units, regardless of whether they were built with the ICM method, AHP method, or RF model. With the rapid development of computer technology, grid unit based division is increasingly refined. Although grid units are becoming more refined, they have lost almost all connection with the geology, geomorphology, and other engineering geological conditions of the study area [16]. Although the division and calculation of slope units have greater computational cost than those of grid units, they can be effectively combined with the terrain conditions of the study area and establish a more suitable landslide susceptibility model [33].
5.3. Comparison with Other Models
Some studies have been conducted in similar areas. Based on artificial neural networks (ANN), support vector machines (SVM), and slope units, Yu et al. [63] analyzed the landslide susceptibility of Southeastern Helong City. Table 6 shows that the prediction accuracy of the landslide susceptibility model established by slope units is higher than that established by grid units. The SU-RF model still has the highest prediction accuracy, which means that the SU-RF model in this study is the most suitable for the production of landslide susceptibility maps.
Table 6.
Model fitting results of the study area.
5.4. Landslide Suceptibility Maps Analysis
According to the above analysis, the SU-RF model is the optimal model. Thus, the SU-RF model was adopted to landslide susceptibility map analysis in this study. In Figure 7c, it can be seen that the very high susceptibility area is mainly distributed along the rivers. This is consistent with the law of landslide distribution along the river found in our field investigation. It also can be seen that the very high susceptibility area is mainly distributed in four regions: (a) Huizhang-Xinxingdong-Dadong; (b) Sanshiwu-Xiaoman-Dadong; (c) Xiaobeigou-Gongnong; and (d) Bajiazi. In these regions, the impact of human engineering activities is enormous. Due to artificial land reclamation, resulting in a reduction in local vegetation coverage, coupled with highway excavation and river erosion, the slope stability decreased. Landslides occur very readily in the season in which rainfall is concentrated. Landslides threaten the safety of nearby farmland, roads and residential buildings. The high and moderate susceptibility area mainly distributed in the central part of Helong city. Landslides in the area are mainly distributed around all levels of highways, where they are caused by the cutting slope of artificial road construction. The low susceptibility area is mainly distributed in the southwest and northwest Helong city. In this region, there are fewer man-made steep cliffs and steep slopes; the slope angle is relatively gentle and the slope height is relatively small. Due to the high vegetation coverage rate and the low intensity of human engineering activities, this area maintains a largely natural ecological environment. The rock mass this area has is of good integrity and highly resistant to weathering. Thus, landslides rarely occur in this area.
6. Conclusions
In this study, landslide susceptibility mapping was carried out in Helong city. According to geological data, field survey, and landslides information, eight influencing factors, namely lithology, slope angle, slope aspect, rainfall, land use, seismic intensity, distance to river, and distance to fault, were selected for the landslide susceptibility mapping of Helong city. The slope unit divided by the curvature watershed method was selected as the basic mapping unit. The ICM, AHP, and RF methods were adopted to establish the landslide susceptibility model. Results based on the grid unit are also listed for comparison. The ROC curve was used to validate the accuracy of the landslide susceptibility models.
From the results for the AUC values, it can be seen that the SU-RF model is the most optimal model, with an AUC value of 94.6%, followed by the GU-RF model (91.3%), SU-ICM model (87.1%), GU-ICM model (83.4%), SU-AHP model (80.5%), and GU-AHP model (70.9%). The statistical results show that the high and very high landslide susceptibility classes make up 91.20%, 77.36%, 96.22%, 84.90%, 57.23%, and 82.39% of the total landslide count in the SU-ICM model, SU-AHP model, SU-RF model, GU-ICM model, GU-AHP model, and GU-RF model, respectively, which also indicates that the SU-RF model is better than the others. The four-susceptibility class, namely very high, high, moderate, and low, in the SU-RF model have areas of 897.03, 1142.43, 1696.53, and 1373.56 km2, respectively. The landslide counts for the four susceptibility classes of the SU-RF model are 0, 6, 35, and 118, respectively, accounting for 0.00%, 3.77%, 22.01%, and 74.41% of the total landslide counts, respectively.
Furthermore, by comparing the AUC values of the landslide susceptibility models established with grid unit and slope unit, it can be seen that the slope unit produces a model with higher prediction accuracy. This is because the slope unit more effectively combines with the actual terrain and other geological factors, so the obtained landslide susceptibility map is more suitable.
Finally, from the landslide susceptibility map produced by the SU-RF model, it can be seen that the very high and high susceptibility area mainly distributed in four regions: (a) Huizhang-Xinxingdong-Dadong; (b) Sanshiwu-Xiaoman-Dadong; (c) Xiaobeigou-Gongnong; and (d) Bajiazi. Therefore, it is necessary to prevent and control landslide disasters in these areas by applying measures, such as slope protection, retention, and anchoring.
Author Contributions
C.Y. contributed to data analysis and manuscript writing. J.C. proposed the main structure of this study. All authors have read and agreed to the published version of the manuscript.
Funding
This work was supported by the State Key Program of National Natural Science of China [U1702241].
Acknowledgments
Thanks to anonymous reviewers for their valuable feedback on the manuscript.
Conflicts of Interest
The authors declare no conflict of interest.
References
- Rotigliano, E.; Conoscenti, C.; Costanzo, D.; Agnesi, V.J.N.H. Slope units-based flow susceptibility model: Using validation tests to select controlling factors. Nat. Harzards 2012, 61, 143–153. [Google Scholar] [CrossRef]
- Sun, X.; Chen, J.; Han, X.; Bao, Y.; Zhan, J.; Peng, W. Application of a GIS-based slope unit method for landslide susceptibility mapping along the rapidly uplifting section of the upper Jinsha River, South-Western China. Bull. Eng. Geol. Environ. 2019. [Google Scholar] [CrossRef]
- Yang, X.J.; Chen, L.D. Geoinformation. Using multi-temporal remote sensor imagery to detect earthquake-triggered landslides. Int. J. Appl. Earth Obs. Geoinf. 2010, 12, 487–495. [Google Scholar] [CrossRef]
- Bao, Y.; Zhai, S.; Chen, J.; Xu, P.; Sun, X.; Zhan, J.; Zhang, W.; Zhou, X. The evolution of the Samaoding paleolandslide river blocking event at the upstream reaches of the Jinsha River, Tibetan Plateau. Geomorphology 2020, 351, 106970. [Google Scholar] [CrossRef]
- Ohlmacher, G.C.; Davis, J.C. Using multiple logistic regression and GIS technology to predict landslide hazard in northeast Kansas, USA. Eng. Geol. 2003, 69, 331–343. [Google Scholar] [CrossRef]
- Ren, F.; Wu, X. GIS-Based Landslide Susceptibility Mapping Using Remote Sensing Data and Machine Learning Methods; Springer: Berlin/Heidelberg, Germany, 2014; pp. 319–333. [Google Scholar]
- Dieu Tien, B.; Shahabi, H.; Omidvar, E.; Shirzadi, A.; Geertsema, M.; Clague, J.J.; Khosravi, K.; Pradhan, B.; Binh Thai, P.; Chapi, K.; et al. Shallow landslide prediction using a novel hybrid functional machine learning algorithm. Remote Sens. 2019, 11, 931. [Google Scholar] [CrossRef]
- Liu, L.; Li, S.; Li, X.; Jiang, Y.; Wei, W.; Wang, Z.; Bai, Y. An integrated approach for landslide susceptibility mapping by considering spatial correlation and fractal distribution of clustered landslide data. Landslides 2019, 16, 715–728. [Google Scholar] [CrossRef]
- Mondal, S.; Mandal, S. Landslide susceptibility mapping of Darjeeling Himalaya, India using index of entropy (IOE) model. Appl. Geomat. 2019, 11, 129–146. [Google Scholar] [CrossRef]
- Monsieurs, E.; Dewitte, O.; Demoulin, A. A susceptibility-based rainfall threshold approach for landslide occurrence. Nat. Hazards Earth Syst. Sci. 2019, 19, 775–789. [Google Scholar] [CrossRef]
- Nahayo, L.; Kalisa, E.; Maniragaba, A.; Nshimiyimana, F.X. Comparison of analytical hierarchy process and certain factor models in landslide susceptibility mapping in Rwanda. Model. Earth Syst. Environ. 2019, 5, 885–895. [Google Scholar] [CrossRef]
- Bai, S.-B.; Wang, J.; Lue, G.-N.; Zhou, P.-G.; Hou, S.-S.; Xu, S.-N. GIS-based logistic regression for landslide susceptibility mapping of the Zhongxian segment in the Three Gorges area, China. Geomorphology 2010, 115, 23–31. [Google Scholar] [CrossRef]
- Cao, C.; Wang, Q.; Chen, J.; Ruan, Y.; Zheng, L.; Song, S.; Niu, C. Landslide Susceptibility Mapping in Vertical Distribution Law of Precipitation Area: Case of the Xulong Hydropower Station Reservoir, Southwestern China. Water 2016, 8, 270. [Google Scholar] [CrossRef]
- Lee, S. Application of logistic regression model and its validation for landslide susceptibility mapping using GIS and remote sensing data journals. Int. J. Remote Sens. 2005, 26, 1477–1491. [Google Scholar] [CrossRef]
- Yalcin, A.; Reis, S.; Aydinoglu, A.C.; Yomralioglu, T. A GIS-based comparative study of frequency ratio, analytical hierarchy process, bivariate statistics and logistics regression methods for landslide susceptibility mapping in Trabzon, NE Turkey. Catena 2011, 85, 274–287. [Google Scholar] [CrossRef]
- Wang, F.; Xu, P.; Wang, C.; Wang, N.; Jiang, N. Application of a GIS-Based Slope Unit Method for Landslide Susceptibility Mapping along the Longzi River, Southeastern Tibetan Plateau, China. ISPRS Int. J. Geo-Inf. 2017, 6, 172. [Google Scholar] [CrossRef]
- Du, G.; Zhang, Y.; Yang, Z.; Guo, C.; Yao, X.; Sun, D. Landslide susceptibility mapping in the region of eastern Himalayan syntaxis, Tibetan Plateau, China: A comparison between analytical hierarchy process information value and logistic regression-information value methods. Bull. Eng. Geol. Environ. 2019, 78, 4201–4215. [Google Scholar] [CrossRef]
- Chen, W.; Panahi, M.; Tsangaratos, P.; Shahabi, H.; Ilia, I.; Panahi, S.; Li, S.; Jaafari, A.; Bin Ahmad, B. Applying population-based evolutionary algorithms and a neuro-fuzzy system for modeling landslide susceptibility. Catena 2019, 172, 212–231. [Google Scholar] [CrossRef]
- Khosravi, K.; Panahi, M.; Bui, D.T. Spatial prediction of groundwater spring potential mapping based on an adaptive neuro-fuzzy inference system and metaheuristic optimization. Hydrol. Earth Syst. Sci. 2018, 22, 4771–4792. [Google Scholar] [CrossRef]
- Lei, T.; Xue, D.; Lv, Z.; Li, S.; Zhang, Y.; Nandi, A.K. Unsupervised Change Detection Using Fast Fuzzy Clustering for Landslide Mapping from Very High-Resolution Images. Remote Sens. 2018, 10, 1381. [Google Scholar] [CrossRef]
- Mokarram, M.; Zarei, A.R. Landslide Susceptibility Mapping Using Fuzzy-AHP. Geotech. Geol. Eng. 2018, 36, 3931–3943. [Google Scholar] [CrossRef]
- Kose, D.D.; Turk, T. GIS-based fully automatic landslide susceptibility analysis by weight-of-evidence and frequency ratio methods. Phys. Geogr. 2019, 40, 481–501. [Google Scholar] [CrossRef]
- Kumar, A.; Sharma, R.K.; Bansal, V.K. GIS-based comparative study of information value and frequency ratio method for landslide hazard zonation in a part of mid-Himalaya in Himachal Pradesh. Innov. Infrastruct. Solut. 2019, 4, 18. [Google Scholar] [CrossRef]
- Sevgen, E.; Kocaman, S.; Nefeslioglu, H.A.; Gokceoglu, C. A Novel Performance Assessment Approach Using Photogrammetric Techniques for Landslide Susceptibility Mapping with Logistic Regression, ANN and Random Forest. Sensors 2019, 19, 3940. [Google Scholar] [CrossRef]
- Binh Thai, P.; Dieu Tien, B.; Prakash, I.; Dholakia, M.B. Hybrid integration of Multilayer Perceptron Neural Networks and machine learning ensembles for landslide susceptibility assessment at Himalayan area (India) using GIS. Catena 2017, 149, 52–63. [Google Scholar] [CrossRef]
- Jiang, P.; Zeng, Z.; Chen, J.; Huang, T. Generalized regression neural networks with K-Fold cross-validation for displacement of landslide forecasting. In Advances in Neural Networks—ISNN 2014; Zeng, Z., Li, Y., King, I., Eds.; Springer International Publishing: Cham, Switzerland, 2014; Volume 8866, pp. 533–541. [Google Scholar]
- Chen, W.; Pourghasemi, H.R.; Kornejady, A.; Zhang, N. Landslide spatial modeling: Introducing new ensembles of ANN, MaxEnt, and SVM machine learning techniques. Geoderma 2017, 305, 314–327. [Google Scholar] [CrossRef]
- Hong, H.; Liu, J.; Zhu, A.X.; Shahabi, H.; Binh Thai, P.; Chen, W.; Pradhan, B.; Dieu Tien, B. A novel hybrid integration model using support vector machines and random subspace for weather-triggered landslide susceptibility assessment in the Wuning area (China). Environ. Earth Sci. 2017, 76, 652. [Google Scholar] [CrossRef]
- Liu, Y.H.; Li, D.H.; Chen, W.; Lin, B.S.; Seeboonruang, U.; Tsai, F. Soil Erosion Modeling and Comparison Using Slope Units and Grid Cells in Shihmen Reservoir Watershed in Northern Taiwan. Water 2018, 10, 1387. [Google Scholar] [CrossRef]
- Tian, Y.; Xiao, C.; Wu, L. Slope unit-based landslide susceptibility zonation. In Proceedings of the 2010 18th International Conference on Geoinformatics, Beijing, China, 18–20 June 2010; pp. 1–5. [Google Scholar]
- Tsai, H.Y.; Tsai, C.C.; Chang, W.C. Slope unit-based approach for assessing regional seismic landslide displacement for deep and shallow failure. Eng. Geol. 2019, 248, 124–139. [Google Scholar] [CrossRef]
- Su, Q.; Zhang, J.; Zhao, S.; Wang, L.; Liu, J.; Guo, J. Comparative Assessment of Three Nonlinear Approaches for Landslide Susceptibility Mapping in a Coal Mine Area. ISPRS Int. J. Geo-Inf. 2017, 6, 228. [Google Scholar] [CrossRef]
- Sun, X.; Chen, J.; Bao, Y.; Han, X.; Zhan, J.; Peng, W. Landslide Susceptibility Mapping Using Logistic Regression Analysis along the Jinsha River and Its Tributaries Close to Derong and Deqin County, Southwestern China. ISPRS Int. J. Geo-Inf. 2018, 7, 438. [Google Scholar] [CrossRef]
- Tanyas, H.; Rossi, M.; Alvioli, M.; van Westen, C.J.; Marchesini, I. A global slope unit-based method for the near real-time prediction of earthquake-induced landslides. Geomorphology 2019, 327, 126–146. [Google Scholar] [CrossRef]
- Romstad, B.; Etzelmuller, B. Mean-curvature watersheds: A simple method for segmentation of a digital elevation model into terrain units. Geomorphology 2012, 139, 293–302. [Google Scholar] [CrossRef]
- Sun, X.; Chen, J.; Han, X.; Bao, Y.; Zhou, X.; Peng, W. Landslide susceptibility mapping along the upper Jinsha River, south-western China: A comparison of hydrological and curvature watershed methods for slope unit classification. Bull. Eng. Geol. Environ. 2020, 79, 4657–4670. [Google Scholar] [CrossRef]
- Binh Thai, P.; Dieu Tien, B.; Pourghasemi, H.R.; Indra, P.; Dholakia, M.B. Landslide susceptibility assesssment in the Uttarakhand area (India) using GIS: A comparison study of prediction capability of naïve bayes, multilayer perceptron neural networks, and functional trees methods. Theor. Appl. Climatol. 2017, 128, 255–273. [Google Scholar] [CrossRef]
- Conforti, M.; Pascale, S.; Robustelli, G.; Sdao, F. Evaluation of prediction capability of the artificial neural networks for mapping landslide susceptibility in the Turbolo River catchment (northern Calabria, Italy). Catena 2014, 113, 236–250. [Google Scholar] [CrossRef]
- Dahal, R.K.; Hasegawa, S.; Nonomura, A.; Yamanaka, M.; Masuda, T.; Nishino, K. GIS-based weights-of-evidence modelling of rainfall-induced landslides in small catchments for landslide susceptibility mapping. Environ. Geol. 2008, 54, 311–324. [Google Scholar] [CrossRef]
- Guzzetti, F.; Mondini, A.C.; Cardinali, M.; Fiorucci, F.; Santangelo, M.; Chang, K.-T. Landslide inventory maps: New tools for an old problem. Earth-Sci. Rev. 2012, 112, 42–66. [Google Scholar] [CrossRef]
- Aditian, A.; Kubota, T.; Shinohara, Y. Comparison of GIS-based landslide susceptibility models using frequency ratio, logistic regression, and artificial neural network in a tertiary region of Ambon, Indonesia. Geomorphology 2018, 318, 101–111. [Google Scholar] [CrossRef]
- Ayalew, L.; Yamagishi, H. The application of GIS-based logistic regression for landslide susceptibility mapping in the Kakuda-Yahiko Mountains, Central Japan. Geomorphology 2005, 65, 15–31. [Google Scholar] [CrossRef]
- Ballabio, C.; Sterlacchini, S. Support Vector Machines for Landslide Susceptibility Mapping: The Staffora River Basin Case Study, Italy. Math. Geosci. 2012, 44, 47–70. [Google Scholar] [CrossRef]
- Hong, H.; Pradhan, B.; Jebur, M.N.; Bui, D.T.; Xu, C.; Akgun, A. Spatial prediction of landslide hazard at the Luxi area (China) using support vector machines. Environ. Earth Sci. 2016, 75, 40. [Google Scholar] [CrossRef]
- Kumar, D.; Thakur, M.; Dubey, C.S.; Shukla, D.P. Landslide susceptibility mapping & prediction using Support Vector Machine for Mandakini River Basin, Garhwal Himalaya, India. Geomorphology 2017, 295, 115–125. [Google Scholar] [CrossRef]
- Zhan, J.; Chen, J.; Zhang, W.; Han, X.; Sun, X.; Bao, Y. Mass movements along a rapidly uplifting river valley: An example from the upper Jinsha River, southeast margin of the Tibetan Plateau. Environ. Earth Sci. 2018, 77, 634. [Google Scholar] [CrossRef]
- Binh Thai, P.; Dieu Tien, B.; Dholakia, M.B.; Prakash, I.; Ha Viet, P.; Mehmood, K.; Hung Quoc, L. A novel ensemble classifier of rotation forest and Naive Bayer for landslide susceptibility assessment at the Luc Yen district, Yen Bai Province (Viet Nam) using GIS. Geomat. Nat. Hazards Risk 2017, 8, 649–671. [Google Scholar] [CrossRef]
- Zhang, X.; Wu, Y.; Zhai, E.; Ye, P. Coupling analysis of the heat-water dynamics and frozen depth in a seasonally frozen zone. J. Hydrol. 2020, 125603. [Google Scholar] [CrossRef]
- Feng, H.; Yu, J.; Zheng, J.; Tang, X.; Peng, C.J.E.E.S. Evaluation of different models in rainfall-triggered landslide susceptibility mapping: A case study in Chunan, southeast China. Environ. Earth Sci. 2016, 75, 1399. [Google Scholar] [CrossRef]
- Yi, Y.; Zhang, Z.; Zhang, W.; Xu, Q.; Deng, C.; Li, Q. GIS-based earthquake-triggered-landslide susceptibility mapping with an integrated weighted index model in Jiuzhaigou region of Sichuan Province, China. Nat. Hazards Earth Syst. Sci. 2019, 19, 1973–1988. [Google Scholar] [CrossRef]
- Hong, H.Y.; Liu, J.Z.; Zhu, A.X. Modeling landslide susceptibility using LogitBoost alternating decision trees and forest by penalizing attributes with the bagging ensemble. Sci. Total Environ. 2020, 718, 137231. [Google Scholar] [CrossRef]
- Sachdeva, S.; Kumar, B. Comparison of gradient boosted decision trees and random forest for groundwater potential mapping in Dholpur (Rajasthan), India. Stoch. Environ. Res. Risk Assess. 2020, 1–20. [Google Scholar] [CrossRef]
- Li, Y.; Zhang, S.; Zhang, X. Classification and fractal characteristics of coal rock fragments under uniaxial cyclic loading conditions. Arab. J. Geosci. 2018, 11, 201. [Google Scholar] [CrossRef]
- Qin, Z.; Fu, H.; Chen, X. A study on altered granite meso-damage mechanisms due to water invasion-water loss cycles. Environ. Earth Sci. 2019, 78, 428. [Google Scholar] [CrossRef]
- Wang, J.; Li, S.; Li, L.; Lin, P.; Xu, Z.; Gao, C. Attribute recognition model for risk assessment of water inrush. Bull. Eng. Geol. Environ. 2019, 78, 1057–1071. [Google Scholar] [CrossRef]
- Zhang, S.; Li, Y.; Shen, B.; Sun, X.; Gao, L. Effective evaluation of pressure relief drilling for reducing rock bursts and its application in underground coal mines. Int. J. Rock Mech. Min. Sci. 2019, 114, 7–16. [Google Scholar] [CrossRef]
- Zhu, C.; Tao, Z.; Yang, S.; Zhao, S. V shaped gully method for controlling rockfall on high-steep slopes in China. Bull. Eng. Geol. Environ. 2019, 78, 2731–2747. [Google Scholar] [CrossRef]
- Huang, F.; Yin, K.; Huang, J.; Gui, L.; Wang, P. Landslide susceptibility mapping based on self-organizing-map network and extreme learning machine. Eng. Geol. 2017, 223, 11–22. [Google Scholar] [CrossRef]
- Pourghasemi, H.R.; Kerle, N. Random forests and evidential belief function-based landslide susceptibility assessment in Western Mazandaran Province, Iran. Environ. Earth Sci. 2016, 75, 185. [Google Scholar] [CrossRef]
- Pradhan, B.; Lee, S. Landslide susceptibility assessment and factor effect analysis: Backpropagation artificial neural networks and their comparison with frequency ratio and bivariate logistic regression modelling. Environ. Model. Softw. 2010, 25, 747–759. [Google Scholar] [CrossRef]
- Yao, X.; Tham, L.G.; Dai, F.C. Landslide susceptibility mapping based on Support Vector Machine: A case study on natural slopes of Hong Kong, China. Geomorphology 2008, 101, 572–582. [Google Scholar] [CrossRef]
- Yesilnacar, E.; Topal, T. Landslide susceptibility mapping: A comparison of logistic regression and neural networks methods in a medium scale study, Hendek region (Turkey). Eng. Geol. 2005, 79, 251–266. [Google Scholar] [CrossRef]
- Yu, C.; Chen, J. Landslide Susceptibility Mapping Using the Slope Unit for Southeastern Helong City, Jilin Province, China: A Comparison of ANN and SVM. Symmetry-Basel 2020, 12, 1047. [Google Scholar] [CrossRef]
Publisher’s Note: MDPI stays neutral with regard to jurisdictional claims in published maps and institutional affiliations. |
© 2020 by the authors. Licensee MDPI, Basel, Switzerland. This article is an open access article distributed under the terms and conditions of the Creative Commons Attribution (CC BY) license (http://creativecommons.org/licenses/by/4.0/).